유전체의학과 미래의학 1 유전체의학_공개용
DESCRIPTION
TRANSCRIPT

유전체 의학과 미래 의학
최형진
충북대학교 내분비내과

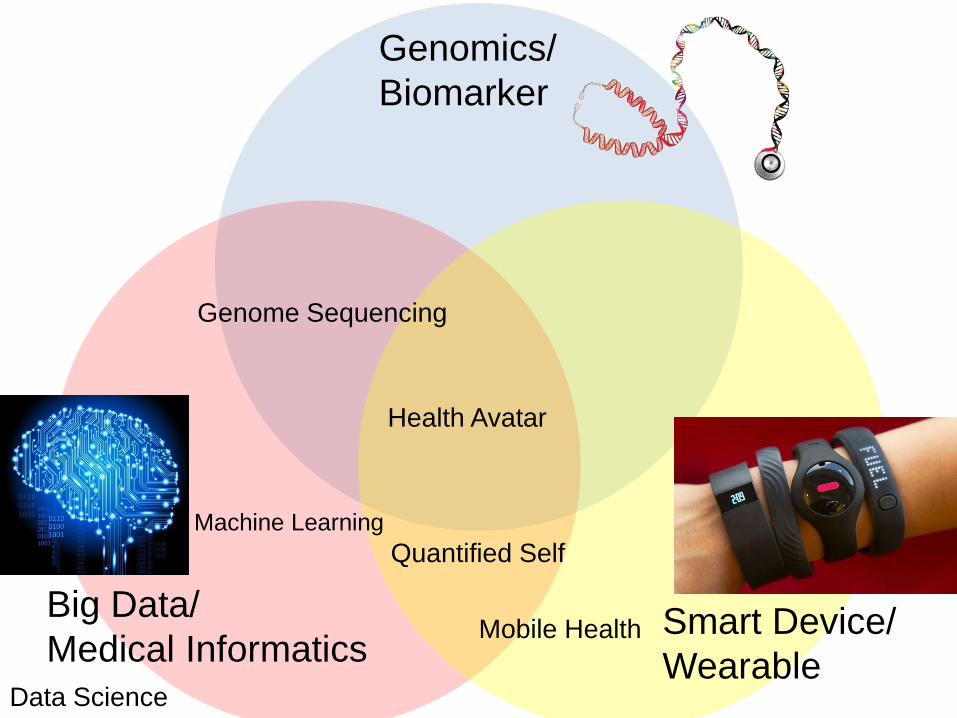
Genomics/
Biomarker
Big Data/
Medical Informatics Smart Device/
Wearable
Genome Sequencing
Data Science
Quantified Self
Health Avatar
Mobile Health
Machine Learning
미래의학 유전체, 빅데이터, 스마트 의료
최형진

시대변화

Genomics/
Biomarker
Big Data/
Medical Informatics Smart Device/
Wearable
Genome Sequencing
Data Science
Quantified Self
Health Avatar
Mobile Health
Machine Learning
Contents
1. Introduction
2. Genetic Variation and Expression
Analyses
3. Human Genome Project and Beyond
4. Personalized Medicine in Endocrinology
① Common Disease Risk
② Rare Disease Risk
③ Pharmacogenomics

1997

발전한다?

저의 유전자
분석 결과를
반영하여 진료해주세요!! 헠?

Your
estimated
lifetime
risk
$2,000~$3,000
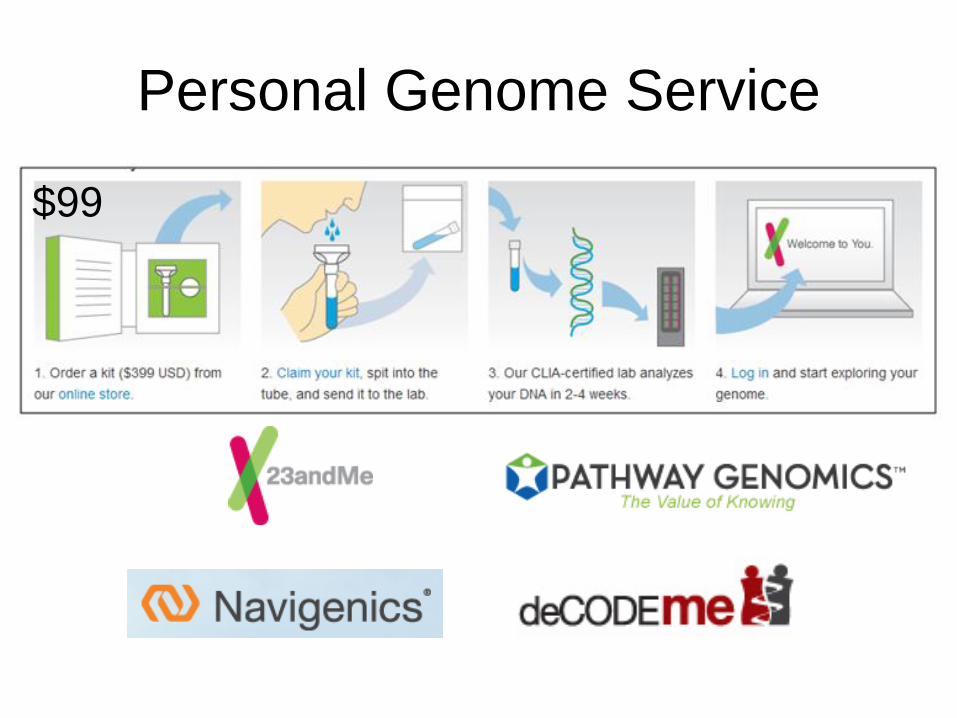
Personal Genome Service
$99


2013.01.29
헬스케어 3.0 시대의 변화 키워드
2011.11.23 헬스케어 3.0: '건강수명' 시대의 도래
주: 선의 굵기는 영향의 강도를 의미

2013.4.25. KBS 9시 뉴스

며칠 전 유전자 검사를 받은 40대 남성입니다.
혈액세포의 DNA 상태를 분석해 앞으로 암에 걸릴 위험이 있는지 여부를 판단할 수 있다고 합니다.
2013.4.25. KBS 9시 뉴스

2013.4.25. KBS 9시 뉴스
60년전 DNA의 구조가 밝혀진 이래 2003년 인간 유전자 지도가 완성됐고, 현재는 어떤 유전자가 어떤 질병을 일으키는지 분석도 80% 정도 끝난 상태입니다.
예를들어 13번 염색체의 BRCA2 유전자에 이상이 생기면 유방암에 걸릴 확률이 높습니다. 또 17번 염색체 유전자는 난소암, 7번 염색체 유전자는 비만을 일으킵니다.
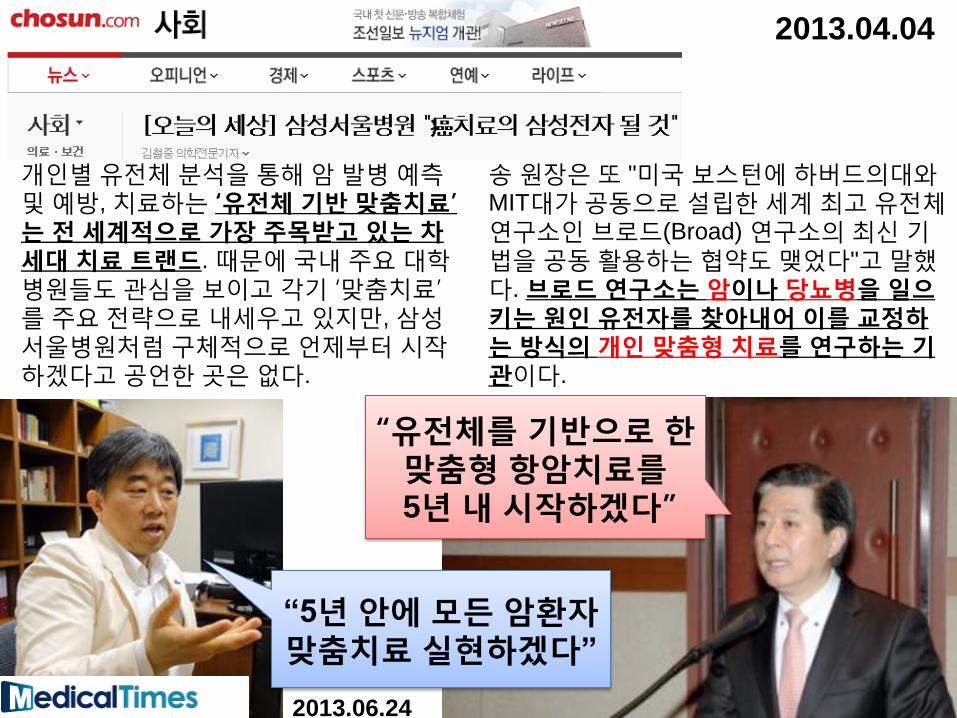
개인별 유전체 분석을 통해 암 발병 예측
및 예방, 치료하는 ‘유전체 기반 맞춤치료’는 전 세계적으로 가장 주목받고 있는 차세대 치료 트랜드. 때문에 국내 주요 대학병원들도 관심을 보이고 각기 ‘맞춤치료’를 주요 전략으로 내세우고 있지만, 삼성서울병원처럼 구체적으로 언제부터 시작하겠다고 공언한 곳은 없다.
송 원장은 또 "미국 보스턴에 하버드의대와
MIT대가 공동으로 설립한 세계 최고 유전체
연구소인 브로드(Broad) 연구소의 최신 기법을 공동 활용하는 협약도 맺었다"고 말했다. 브로드 연구소는 암이나 당뇨병을 일으키는 원인 유전자를 찾아내어 이를 교정하는 방식의 개인 맞춤형 치료를 연구하는 기관이다.
2013.04.04
“유전체를 기반으로 한
맞춤형 항암치료를
5년 내 시작하겠다”
“5년 안에 모든 암환자
맞춤치료 실현하겠다”
2013.06.24

2011 Nature. Charting a course for genomic medicine from base pairs to bedside
Genomics and KOREA

Contents
1. Introduction
2. Genetic Variation and Expression
Analyses
3. Human Genome Project and Beyond
4. Personalized Medicine in Endocrinology
① Common Disease Risk
② Rare Disease Risk
③ Pharmacogenomics
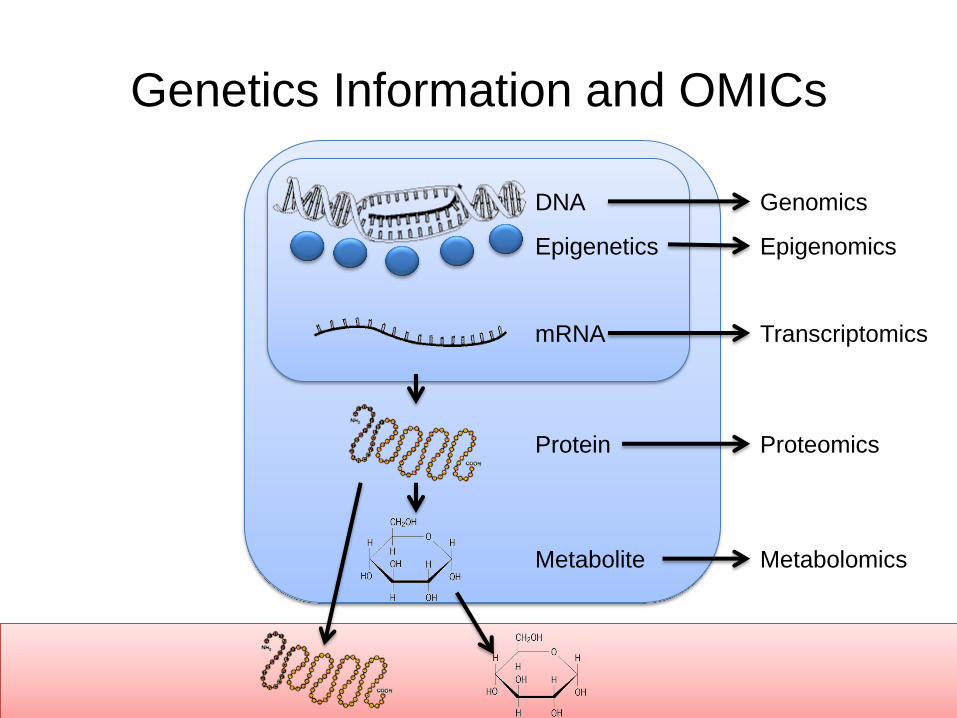
DNA
mRNA
Protein
Metabolite
Epigenetics
Genetics Information and OMICs
Genomics
Epigenomics
Transcriptomics
Proteomics
Metabolomics

외래/입원
진료
당뇨병으로
진단된 환자
임상정보 수집 혈액 샘플 수집
외래/입원
진료 및 투약
당뇨병 합병증
및 추적관찰 정보
합병증/치료효과 관련
유전체 연관 분석
유전체 분석
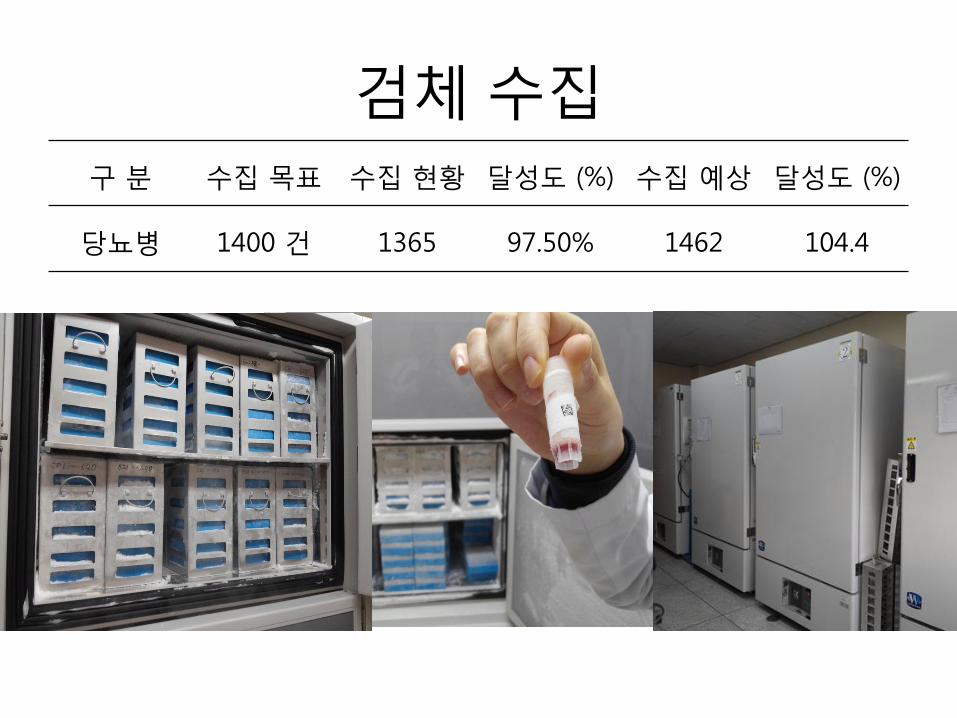
검체 수집
구 분 수집 목표 수집 현황 달성도 (%) 수집 예상 달성도 (%)
당뇨병 1400 건 1365 97.50% 1462 104.4
Food Diabetes
Genetic
Predisposition
Environmental
Predisposition
Epigenetic change
Epigenetic change
Diabetic
Complications
1. Diabetes
Susceptibility 2. Diabetes
Complication
Pathogenesis

Metabolomics
2013 Metabolomics platforms for genome wide association studies—linking the genome to the metabolome
Metabolomics
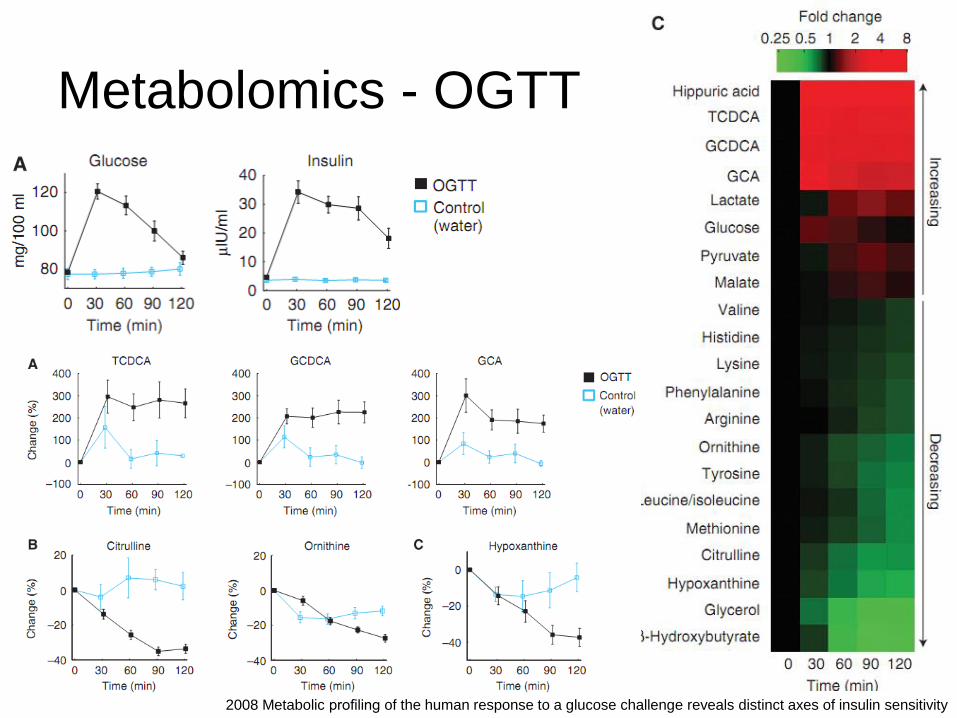
Metabolomics - OGTT
2008 Metabolic profiling of the human response to a glucose challenge reveals distinct axes of insulin sensitivity
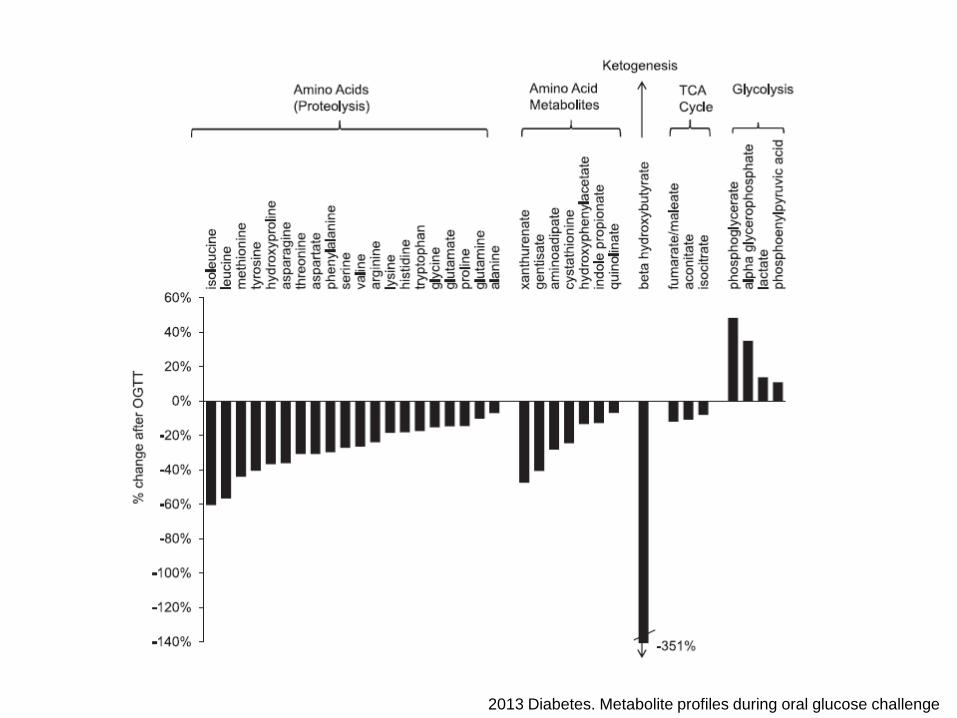
2013 Diabetes. Metabolite profiles during oral glucose challenge
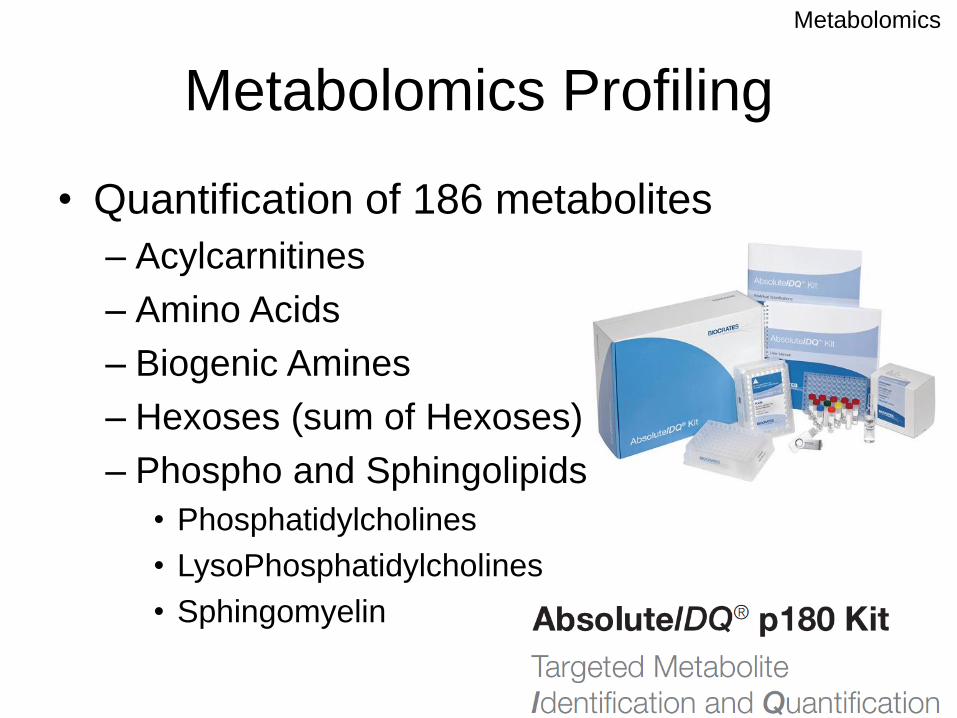
Metabolomics Profiling
• Quantification of 186 metabolites
– Acylcarnitines
– Amino Acids
– Biogenic Amines
– Hexoses (sum of Hexoses)
– Phospho and Sphingolipids
• Phosphatidylcholines
• LysoPhosphatidylcholines
• Sphingomyelin
Metabolomics

Next-Generation Sequencing (NGS)
Benchtop Genome Center (90min)
454/FLX (Roche), Solexa (Illumina), SOLiD (AB)
50ng DNA (Sanger=1 ug)
Contents
1. Introduction
2. Genetic Variation and Expression
Analyses
3. Human Genome Project and Beyond
4. Personalized Medicine in Endocrinology
① Common Disease Risk
② Rare Disease Risk
③ Pharmacogenomics

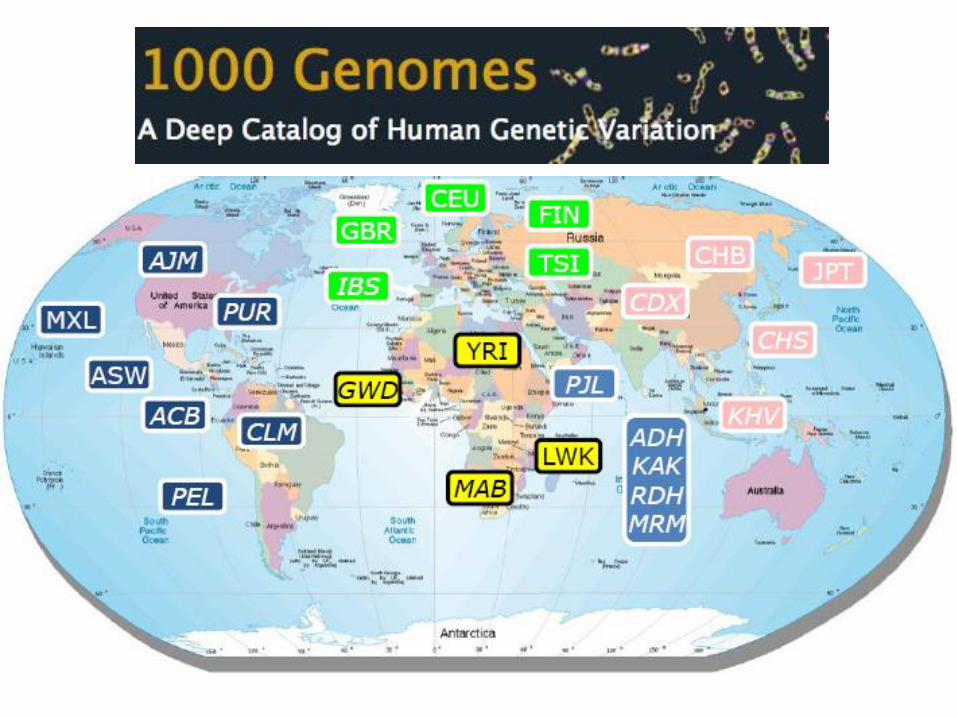

1000 Genomes Samples
Population
When cell li
ne avail. (ap
prox)
DNA seque
nced from b
lood
Offspring sa
mples from
trios avail.
First set Second
set Third set Total
Utah residents (CEPH) with Northern and Western Eu
ropean ancestry (CEU) Available no yes 100 100
Toscani in Italia (TSI) Available no no 100 100
British from England and Scotland (GBR) Available no no 96 4 100
Finnish from Finland (FIN) Available no no 100 100
Iberian populations in Spain (IBS) Available no yes 30 70 100
Total European ancestry 426 74 500
Han Chinese in Beijing, China (CHB) Available no no 100 100
Japanese in Toyko, Japan (JPT) Available no no 100 100
Han Chinese South (CHS) Available most yes 100 100
Chinese Dai in Xishuangbanna (CDX) Feb-12 some no 100 100
Kinh in Ho Chi Minh City, Vietnam (KHV) Available some some 100 100
Chinese in Denver, Colorado (CHD) (pilot 3 only) Available no no 0
TOTAL East Asian ancestry 300 200 500
Yoruba in Ibadan, Nigeria (YRI) Available no yes 100 100
Luhya in Webuye, Kenya (LWK) Available no no 100 100
Gambian in Western Division, The Gambia (GWD) Aug-12 no yes 100 100
Mende in Sierra Leono (MSL) Aug-12 no yes 100 100
Esan in Nigeria (ESN) Aug-12 no yes 100 100
TOTAL West African ancestry 200 300 500
African Ancestry in Southwest US (ASW) Available no some 61 1 62
African Caribbean in Barbados (ACB) Available yes yes 79 21 100
Mexican Ancestry in Los Angeles, CA (MXL) Available no yes 70 70
Puerto Rican in Puerto Rico (PUR) Available yes yes 70 20 90
Colombian in Medellin, Colombia (CLM) Available no yes 70 19 89
Peruvian in Lima, Peru (PEL) Available yes yes 70 19 89
TOTAL Americas 271 150 79 500
Gujarati Indian in Houston, TX (GIH) Available no no 100 100
Punjabi in Lahore, Pakistan (PJL) May-Aug 20
12 yes yes 100 100
Bengali in Bangladesh (BEB) Aug-12 no yes 100 100
Sri Lankan Tamil in the UK (STU) Aug-12 yes yes 100 100
Indian Telegu in the UK (ITU) Aug-12 yes yes 100 100
TOTAL South Asian ancestry 100 400 500
TOTAL 1197 524 779 2500

Wellcome Trust: 10,000 human genomes to uncover disease-causing variants

Korean Reference Genome
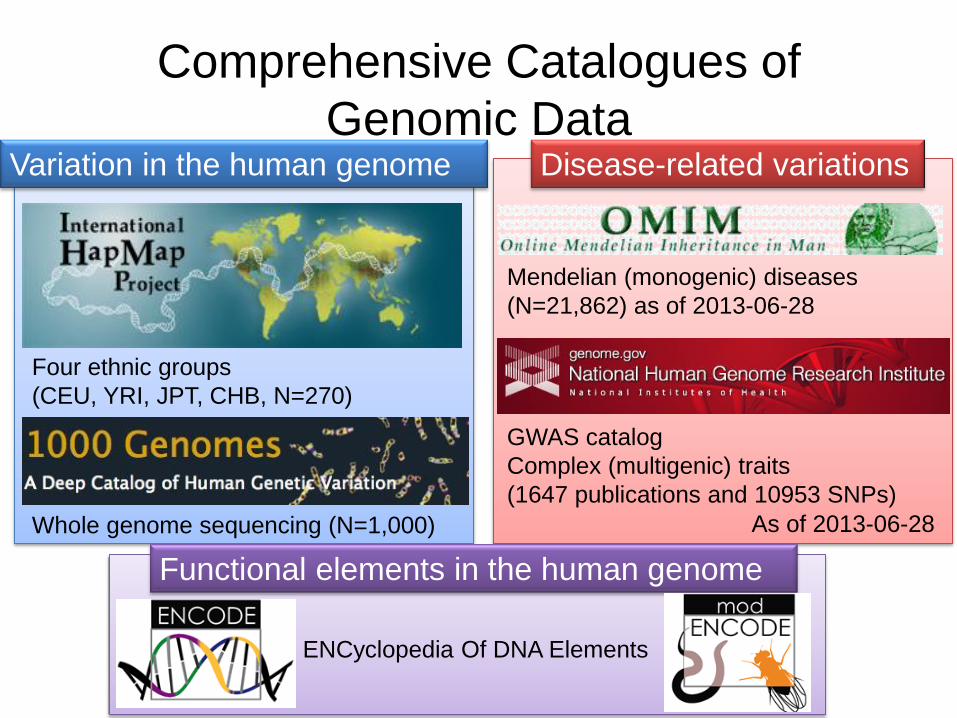
Comprehensive Catalogues of
Genomic Data Variation in the human genome
Mendelian (monogenic) diseases
(N=21,862) as of 2013-06-28
Whole genome sequencing (N=1,000)
Four ethnic groups
(CEU, YRI, JPT, CHB, N=270)
GWAS catalog
Complex (multigenic) traits
(1647 publications and 10953 SNPs)
As of 2013-06-28
Disease-related variations
Functional elements in the human genome
ENCyclopedia Of DNA Elements

Contents
1. Introduction
2. Genetic Variation and Expression
Analyses
3. Human Genome Project and Beyond
4. Personalized Medicine in Endocrinology
① Common Disease Risk
② Rare Disease Risk
③ Pharmacogenomics

Genome-wide Profiling Human Genome(DNA) Study
Microarray
Proteonomics
GWAS, Candidate gene study
Familial study
Linkage study
Genomic Study
Genomic Medicine
Novel Variant(SNP) Discovery Novel Target Discovery
GENE for everyone VARIANT based individualization
Non-responder of treatment
Severe side effect
Anti-oxidant
Monoclonal antibody for osteoporosis
Genetic counseling for rare diseases
Sensitive urine test, DM subtype
Mendelian disease diagnosis
High risk of future osteoporosis
High risk of DM complications
Diagnosis
Treatment
Prevention
Common Disease Risk
Rare Disease Risk
Therapeutic Option
Novel Disease Target Personalized Medicine
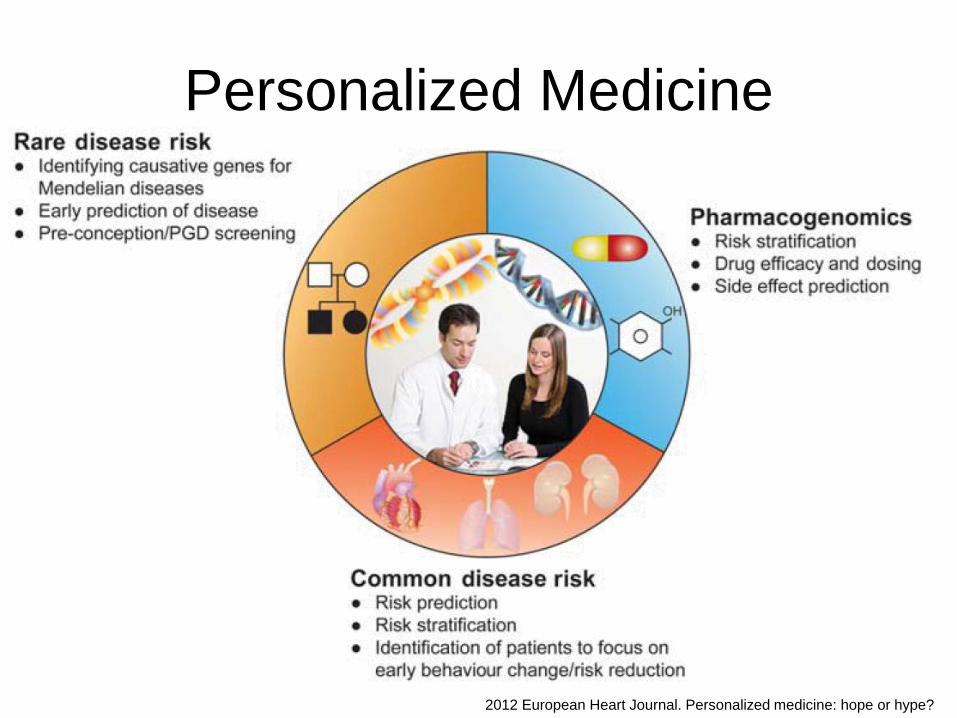
Personalized Medicine
2012 European Heart Journal. Personalized medicine: hope or hype?
Contents
1. Introduction
2. Genetic Variation and Expression
Analyses
3. Human Genome Project and Beyond
4. Personalized Medicine in Endocrinology
① Common Disease Risk
② Rare Disease Risk
③ Pharmacogenomics
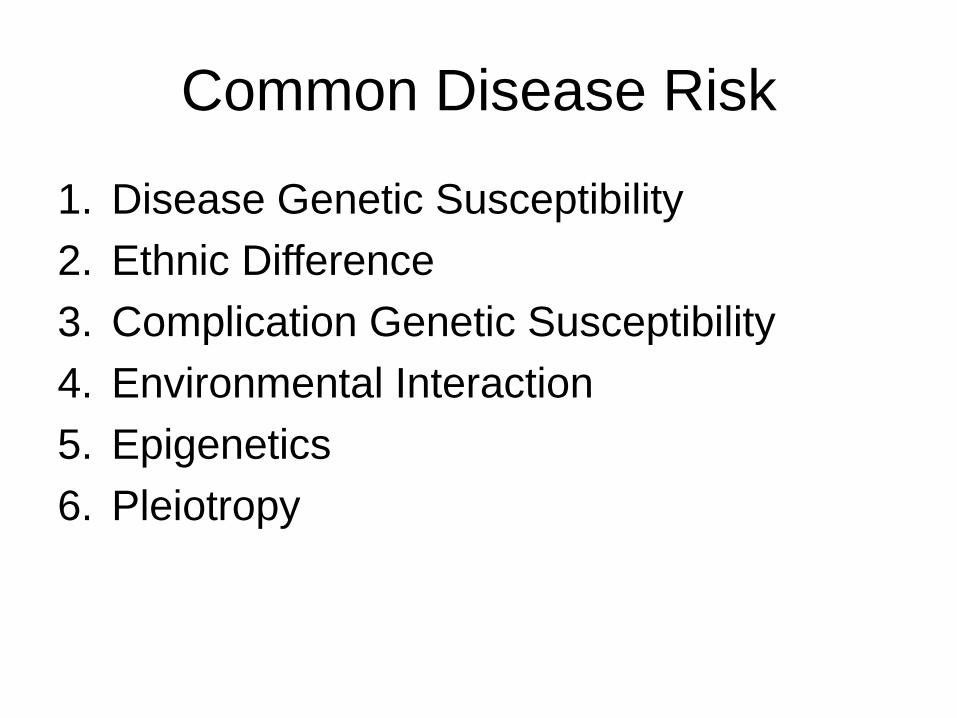
Common Disease Risk
1. Disease Genetic Susceptibility
2. Ethnic Difference
3. Complication Genetic Susceptibility
4. Environmental Interaction
5. Epigenetics
6. Pleiotropy
Common Disease Risk
1. Disease Genetic Susceptibility
2. Ethnic Difference
3. Complication Genetic Susceptibility
4. Environmental Interaction
5. Epigenetics
6. Pleiotropy
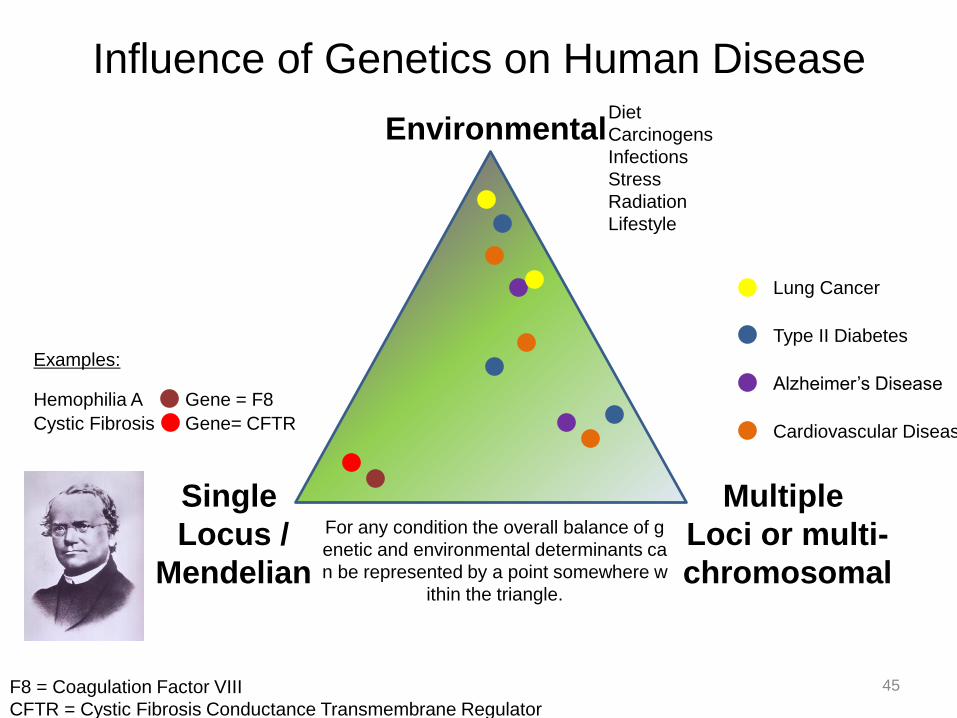
Influence of Genetics on Human Disease
For any condition the overall balance of g
enetic and environmental determinants ca
n be represented by a point somewhere w
ithin the triangle.
45
Single
Locus /
Mendelian
Multiple
Loci or multi-
chromosomal
Environmental
Cystic Fibrosis
Hemophilia A
Examples:
Alzheimer’s Disease
Type II Diabetes
Cardiovascular Disease
Diet
Carcinogens
Infections
Stress
Radiation
Lifestyle
Gene = F8
Gene= CFTR
F8 = Coagulation Factor VIII
CFTR = Cystic Fibrosis Conductance Transmembrane Regulator
Lung Cancer
2008 HMG Genome-based prediction of common diseases- advances and prospects

2008 HMG Genome-based prediction of common diseases- advances and prospects
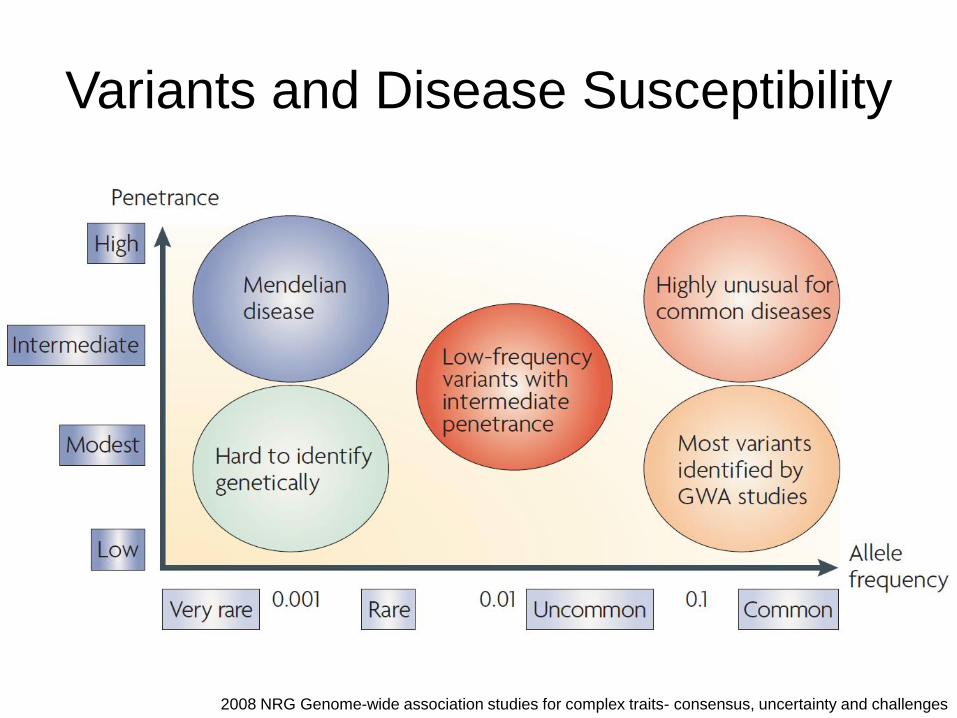
Variants and Disease Susceptibility
2008 NRG Genome-wide association studies for complex traits- consensus, uncertainty and challenges
Promise of Human Genome Project
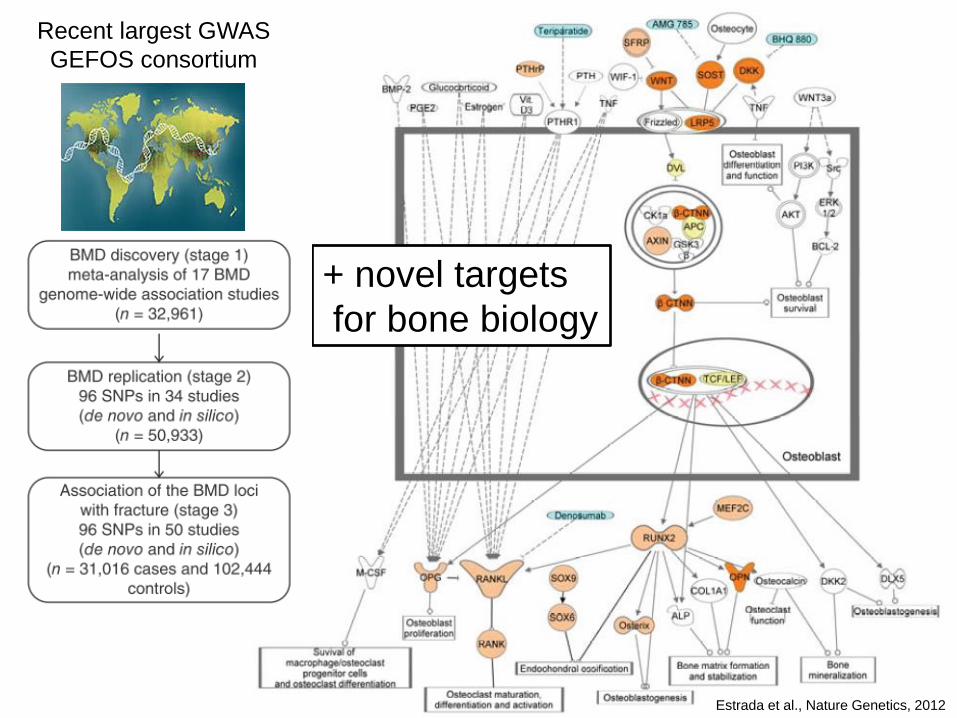
Estrada et al., Nature Genetics, 2012
+ novel targets
for bone biology
Recent largest GWAS
GEFOS consortium


Diabetes ≠ Genetic Disease?
• Familial aggregation – Genetic influences?
– Epigenetic influences • Intrauterine environment
– Shared family environment? • Socioeconomic status
• Dietary preferences
• Food availability
• Gut microbiome content
• Overestimated heritability – Phantom heritability
2012. Drong AW, Lindgren CM, McCarthy MI. Clin Pharmacol Ther. The genetic and epigenetic basis of type 2 diabetes and obesity.
2012. PNAS The mystery of missing heritability- Genetic interactions create phantom heritability

Per-allele effect of BMI-associated
loci on body weight
2012 Genetic determinants of common obesity and their value in prediction
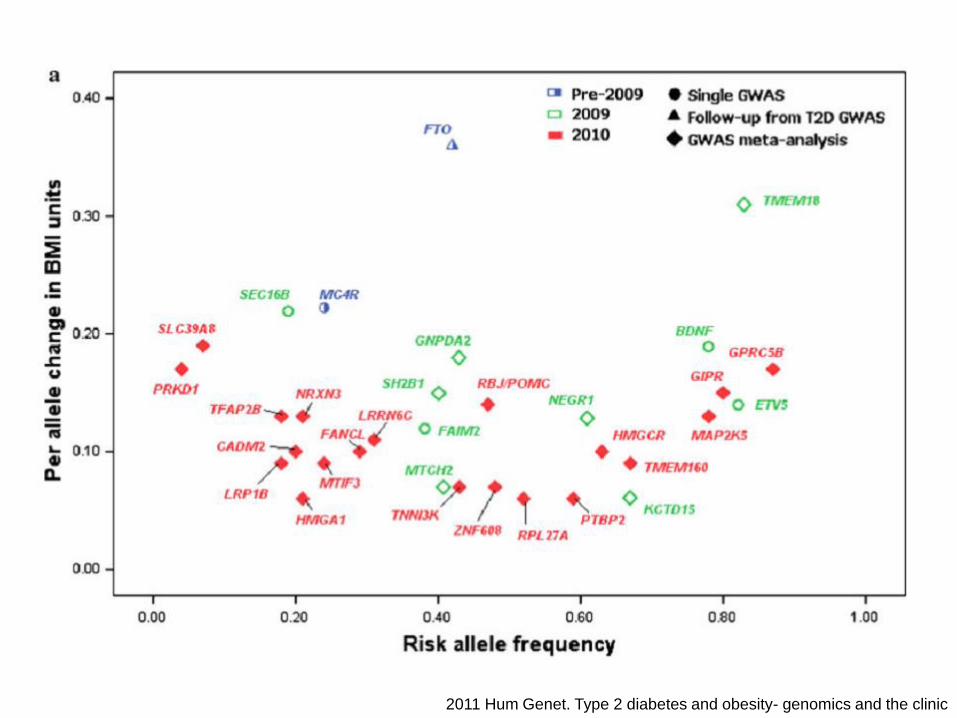
2011 Hum Genet. Type 2 diabetes and obesity- genomics and the clinic
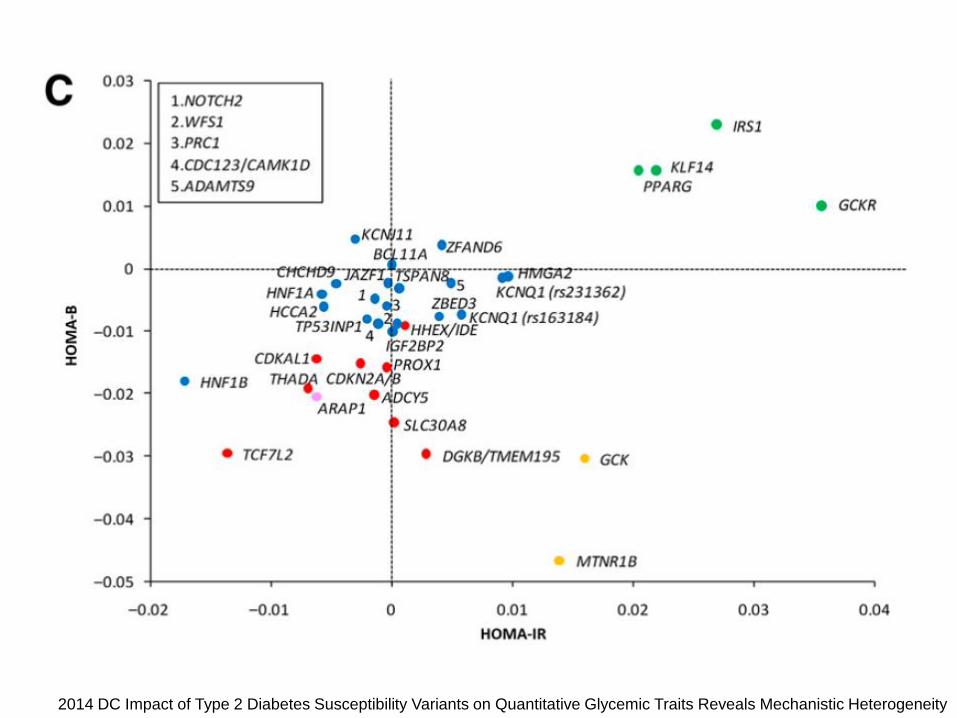
2014 DC Impact of Type 2 Diabetes Susceptibility Variants on Quantitative Glycemic Traits Reveals Mechanistic Heterogeneity
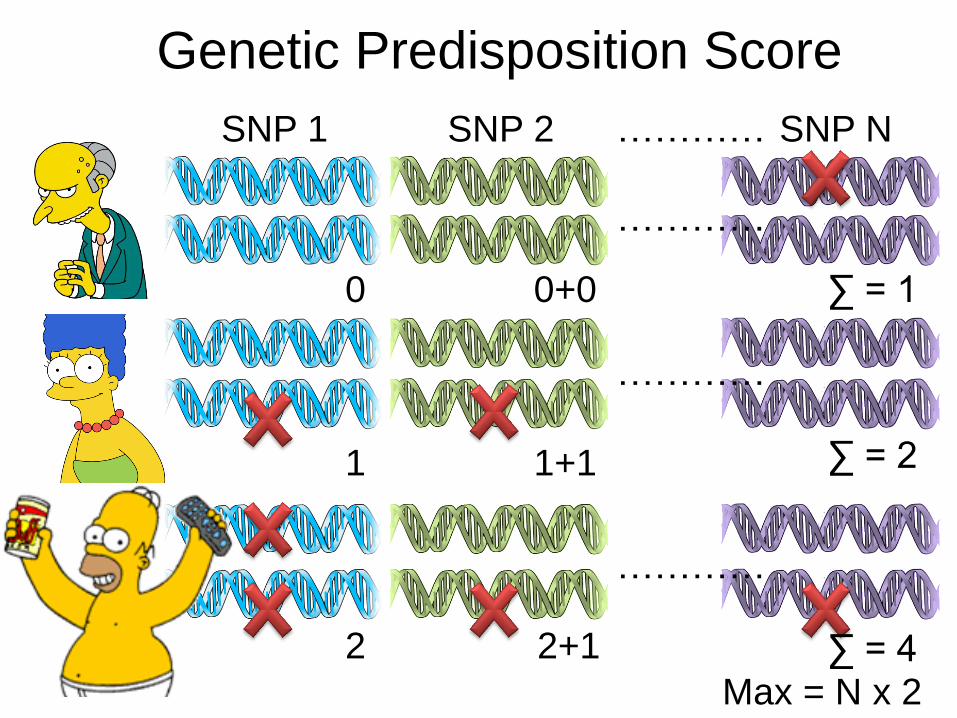
SNP N …………
…………
…………
…………
∑ = 1
Max = N x 2
∑ = 2
∑ = 4
SNP 1
0
1
2
SNP 2
0+0
1+1
2+1
Genetic Predisposition Score

2008 HMG Genome-based prediction of common diseases- advances and prospects
Single variant Single variant 20 variants

2010 AJCN Cumulative effects and predictive value of common obesity-susceptibility variants identified by genome-wide association studies

◇◆ ‘parental obesity’ as a test to predict obesity
in adult life •Dark blue 1–2 yrs
•Green 3–5 yrs
•Red 6–9 yrs
•Light blue 10–14 yrs
•Grey , 15–17 yrs
Genetic Prediction of Obesity Risk
The predictive ability of
the currently
established BMI-
associated loci is poor
2012 Genetic determinants of common obesity and their value in prediction
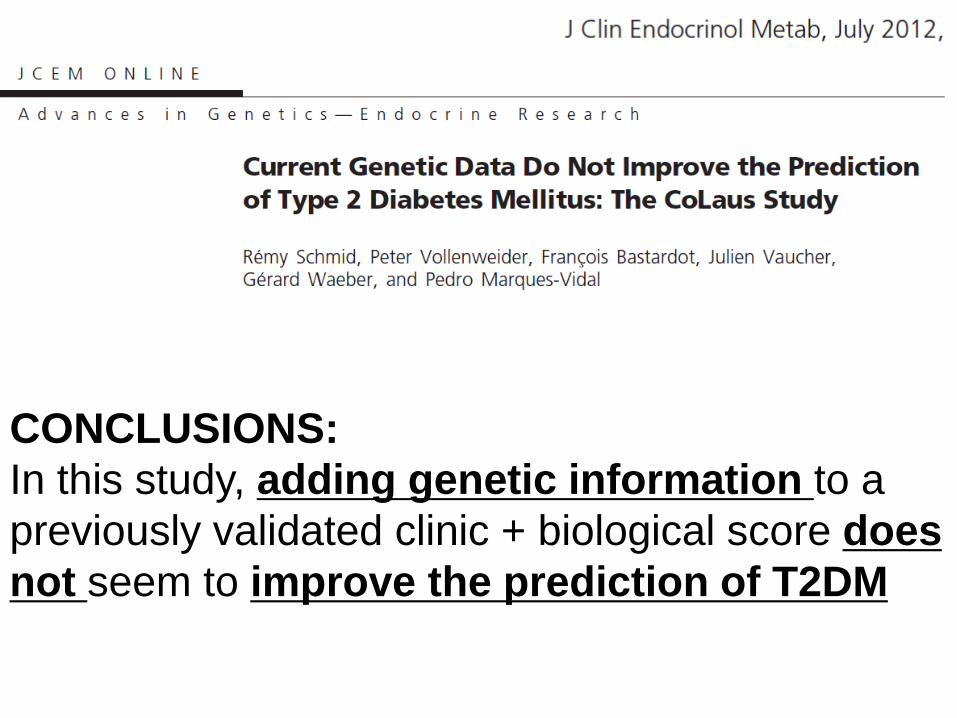
CONCLUSIONS:
In this study, adding genetic information to a
previously validated clinic + biological score does
not seem to improve the prediction of T2DM

“At the end of the era of common variant discovery for T2D,
polygenic scores can predict T2D in whites and blacks but do
not outperform clinical models.
Further optimization of polygenic prediction may require novel
analytic methods, including less common as well as
functional variants.”

2014 DC Polygenic Type 2 Diabetes Prediction at the Limit of Common Variant Detection

2014 DC Polygenic Type 2 Diabetes Prediction at the Limit of Common Variant Detection

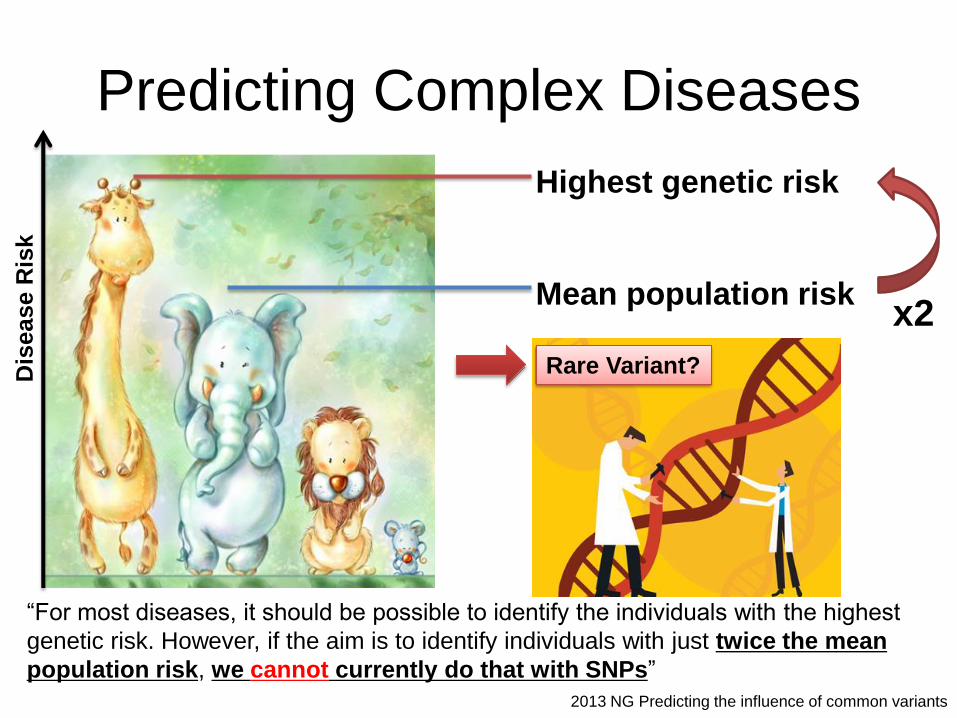
Predicting Complex Diseases
2013 NG Predicting the influence of common variants
“For most diseases, it should be possible to identify the individuals with the highest
genetic risk. However, if the aim is to identify individuals with just twice the mean
population risk, we cannot currently do that with SNPs”
Mean population risk
Highest genetic risk
x2
Dis
ease R
isk
Rare Variant?
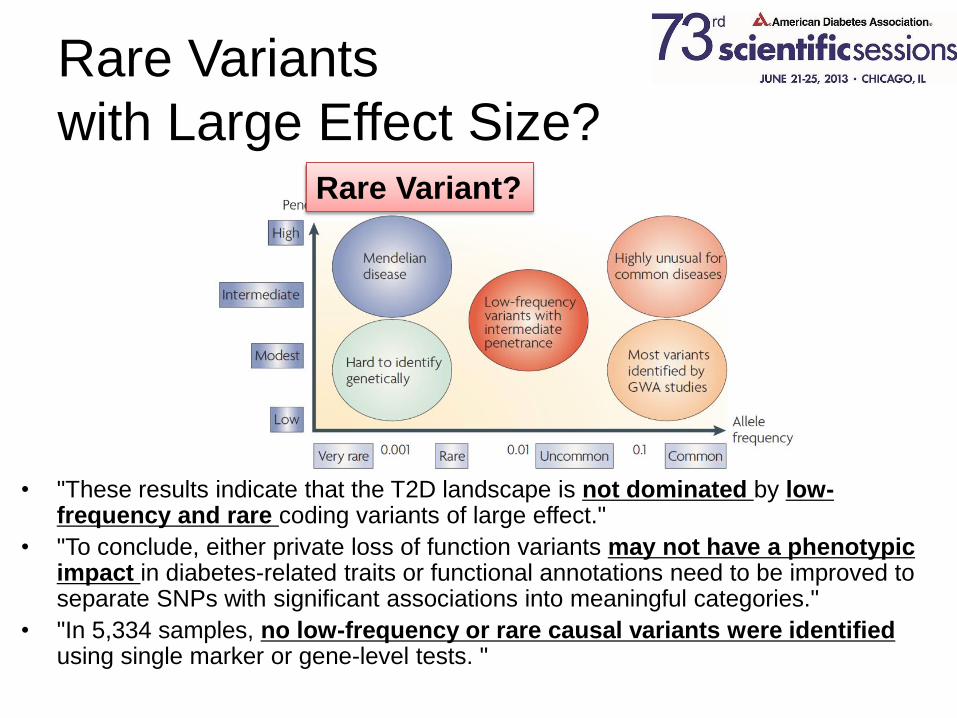
Rare Variants
with Large Effect Size?
• "These results indicate that the T2D landscape is not dominated by low-frequency and rare coding variants of large effect."
• "To conclude, either private loss of function variants may not have a phenotypic impact in diabetes-related traits or functional annotations need to be improved to separate SNPs with significant associations into meaningful categories."
• "In 5,334 samples, no low-frequency or rare causal variants were identified using single marker or gene-level tests. "
Rare Variant?

2014 NG Identification of low-frequency and rare sequence variants associated with elevated or reduced risk of type 2 diabetes
Variant based approach
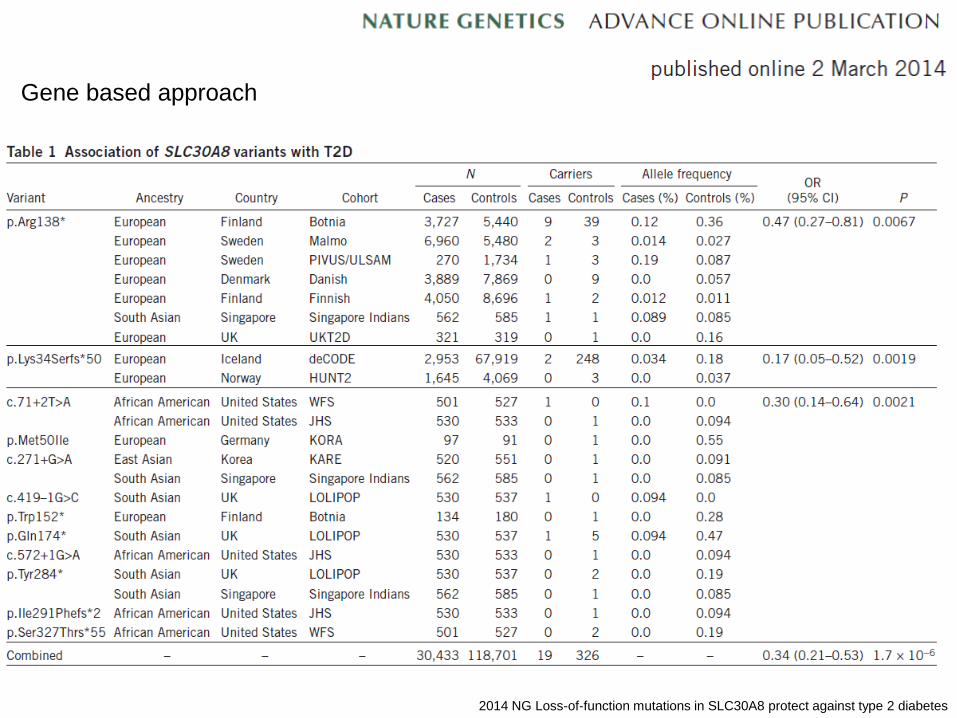
2014 NG Loss-of-function mutations in SLC30A8 protect against type 2 diabetes
Gene based approach

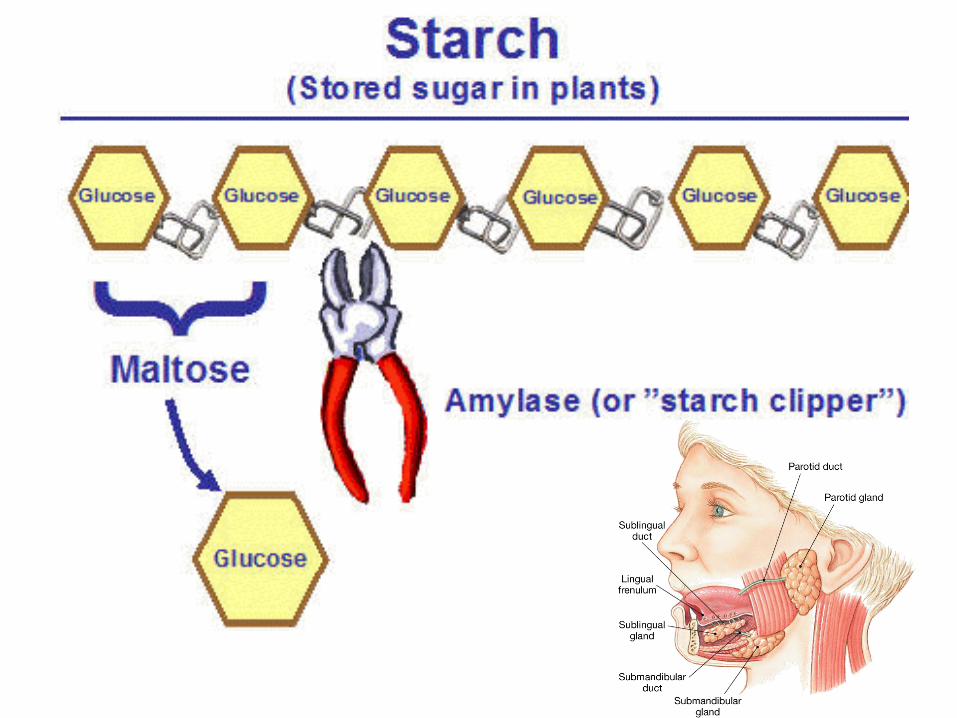
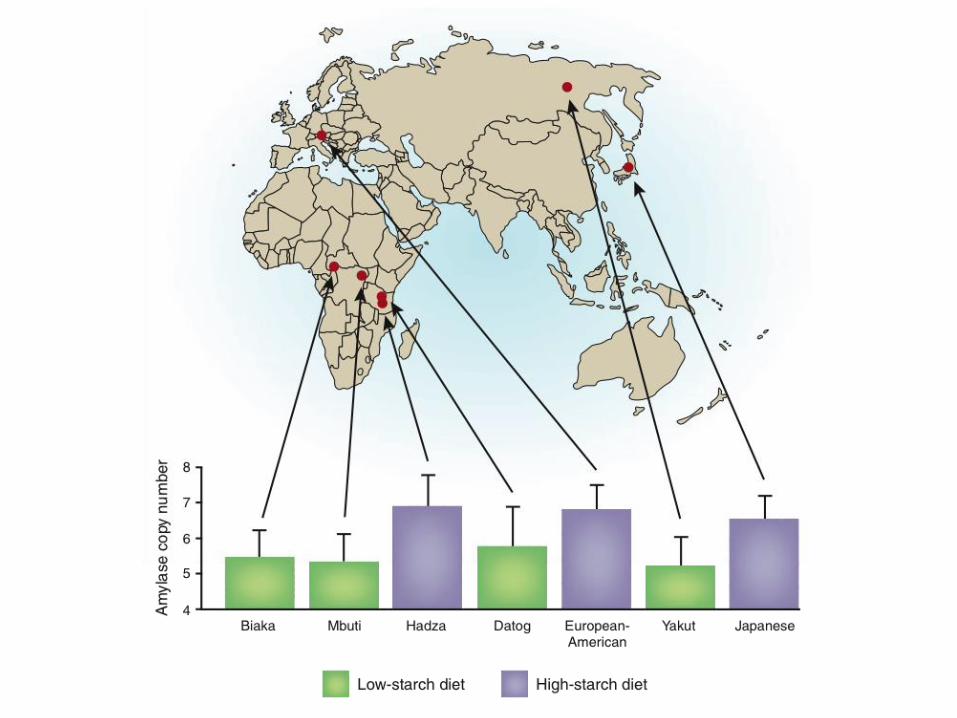
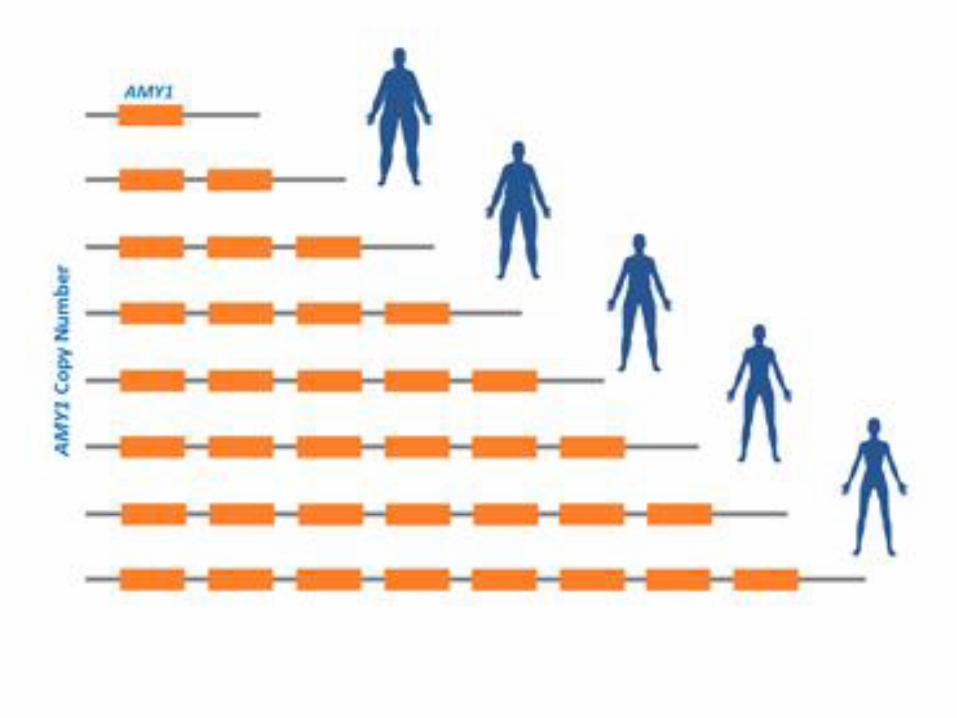
2014 NG Low copy number of the salivary amylase gene predisposes to obesity
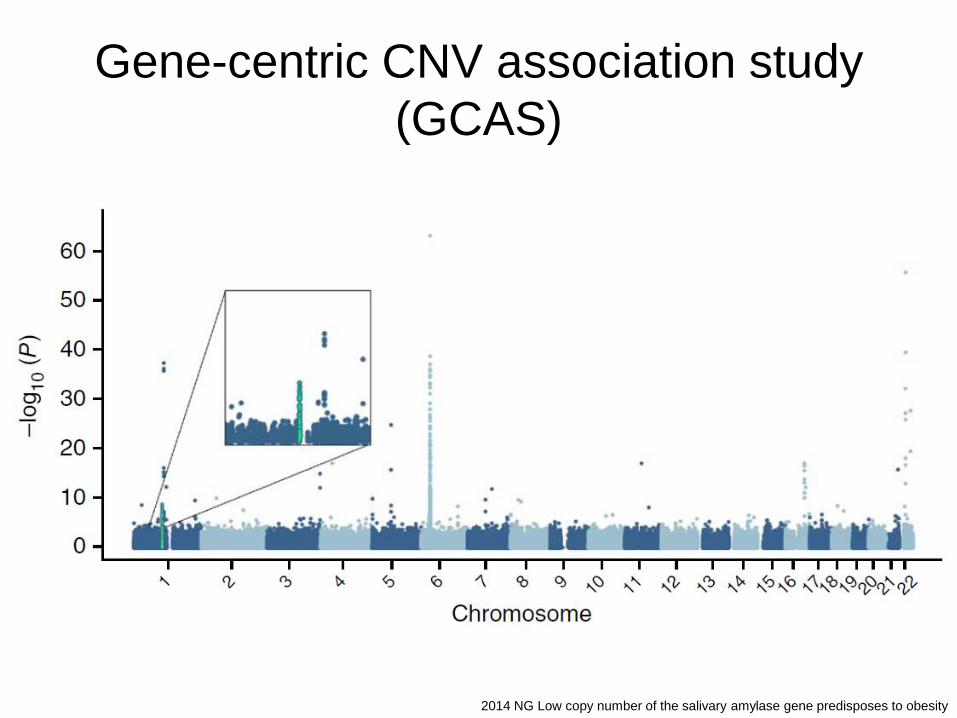
Gene-centric CNV association study
(GCAS)
2014 NG Low copy number of the salivary amylase gene predisposes to obesity
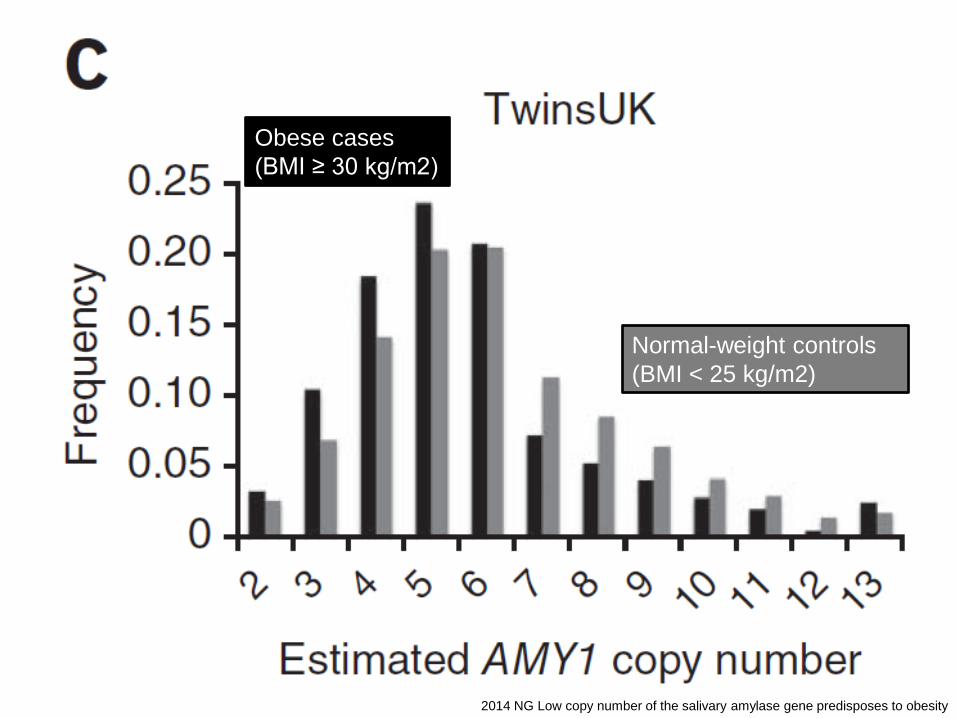
Normal-weight controls
(BMI < 25 kg/m2)
Obese cases
(BMI ≥ 30 kg/m2)
2014 NG Low copy number of the salivary amylase gene predisposes to obesity

AMY1 copy numbers and Obesity
2014 NG Low copy number of the salivary amylase gene predisposes to obesity
Common Disease Risk
1. Disease Genetic Susceptibility
2. Ethnic Difference
3. Complication Genetic Susceptibility
4. Environmental Interaction
5. Epigenetics
6. Pleiotropy
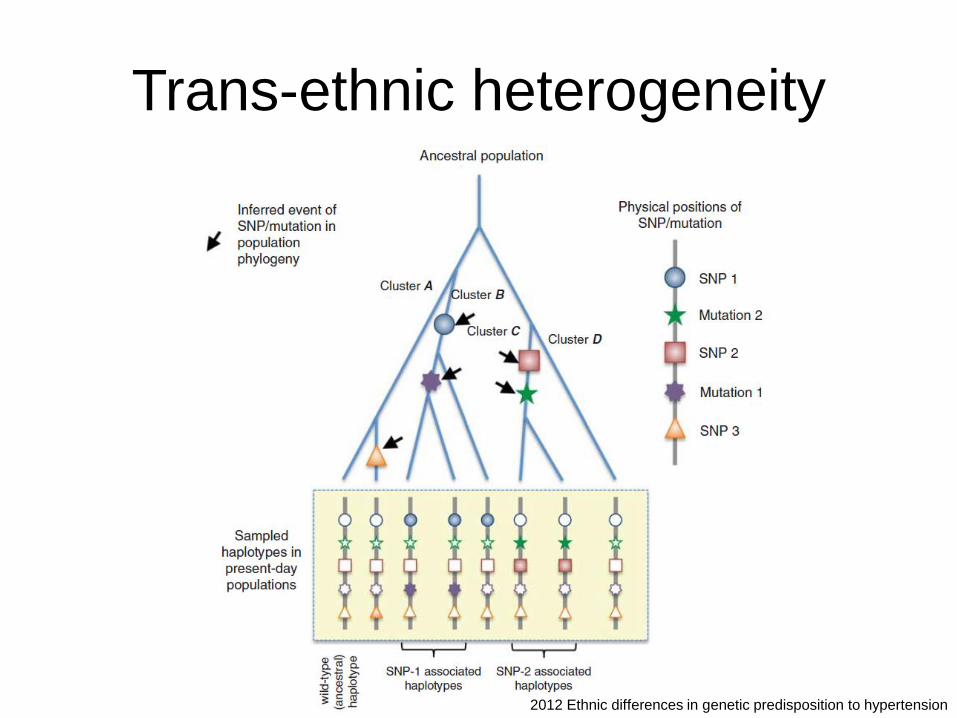
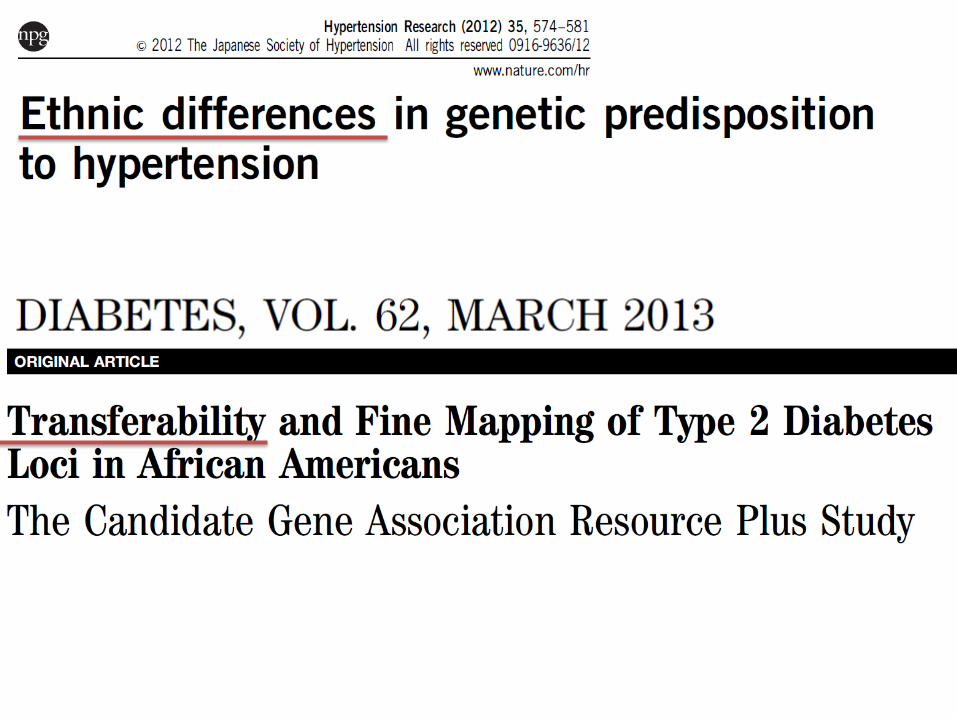
Trans-ethnic heterogeneity
2012 Ethnic differences in genetic predisposition to hypertension
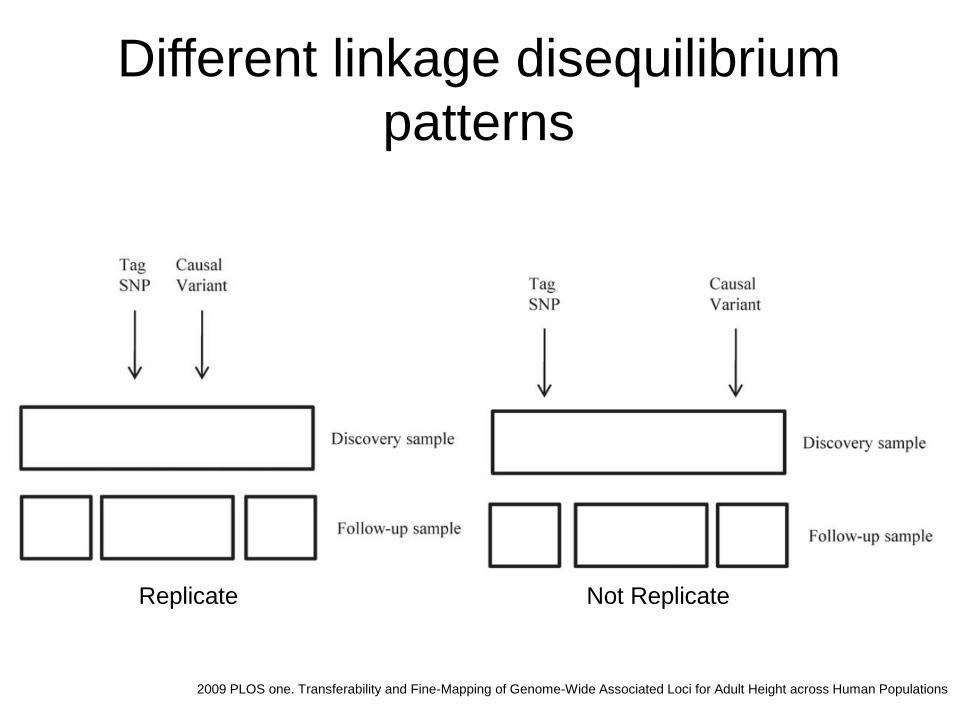
Different linkage disequilibrium
patterns
2009 PLOS one. Transferability and Fine-Mapping of Genome-Wide Associated Loci for Adult Height across Human Populations
Replicate Not Replicate
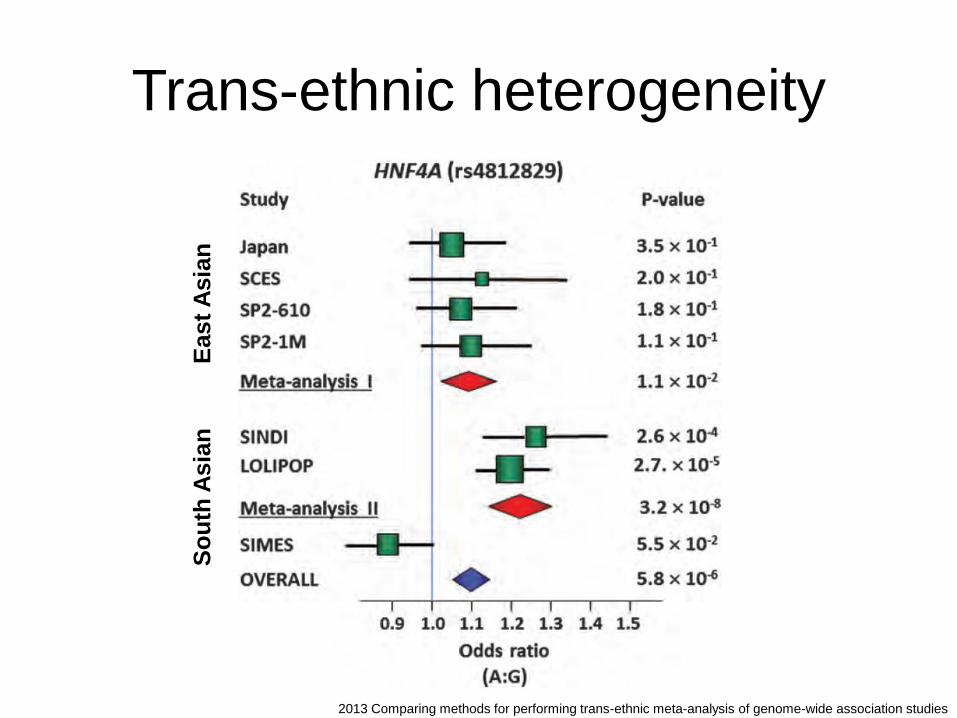
Trans-ethnic heterogeneity
East
Asia
n
So
uth
Asia
n
2013 Comparing methods for performing trans-ethnic meta-analysis of genome-wide association studies
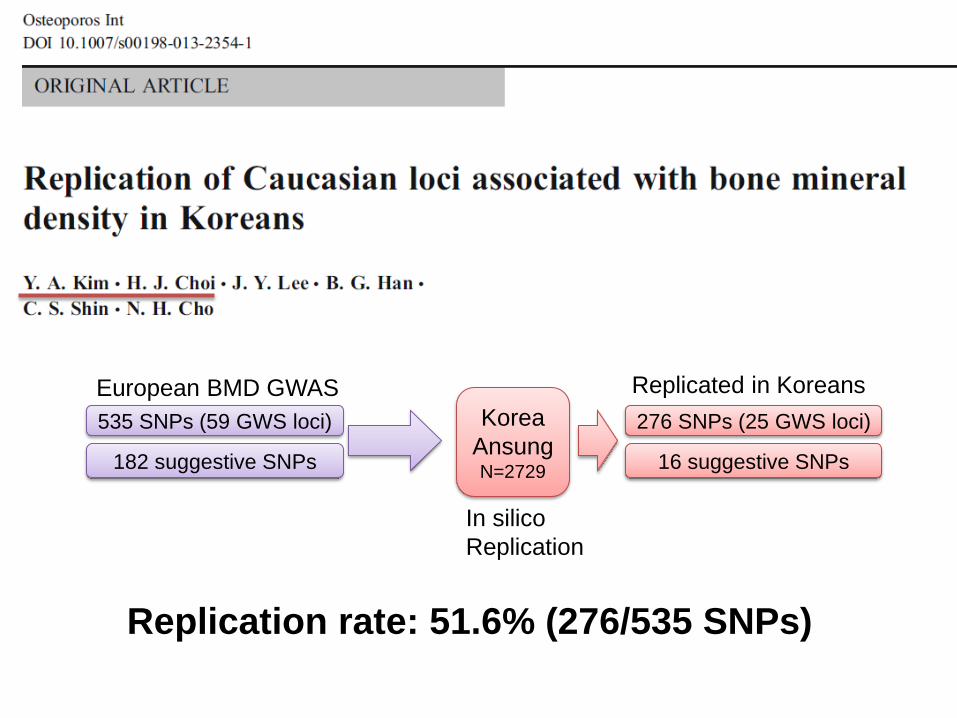
535 SNPs (59 GWS loci) Korea
Ansung N=2729
In silico
Replication
European BMD GWAS
182 suggestive SNPs
276 SNPs (25 GWS loci)
16 suggestive SNPs
Replicated in Koreans
Replication rate: 51.6% (276/535 SNPs)

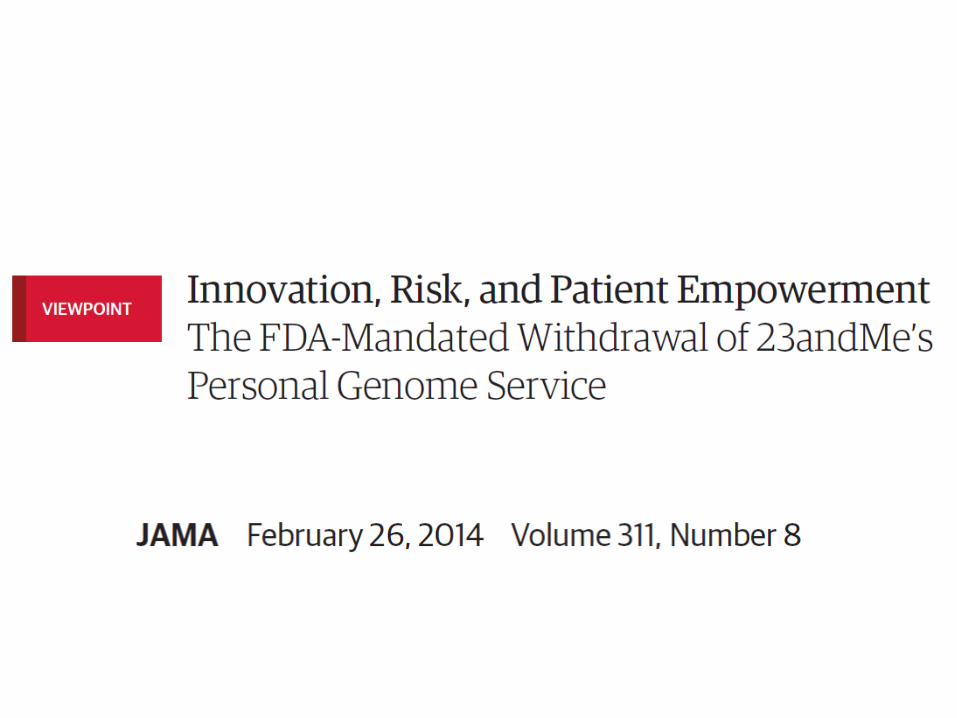
FDA Halt 23andMe
2013.11.22.
Common Disease Risk
1. Disease Genetic Susceptibility
2. Ethnic Difference
3. Complication Genetic Susceptibility
4. Environmental Interaction
5. Epigenetics
6. Pleiotropy
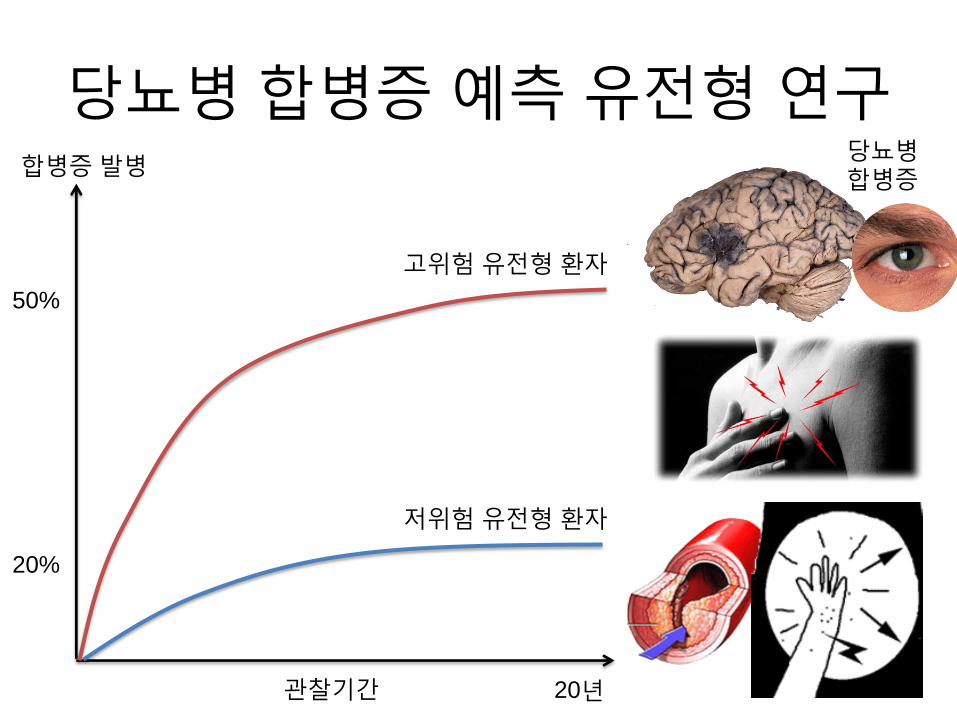
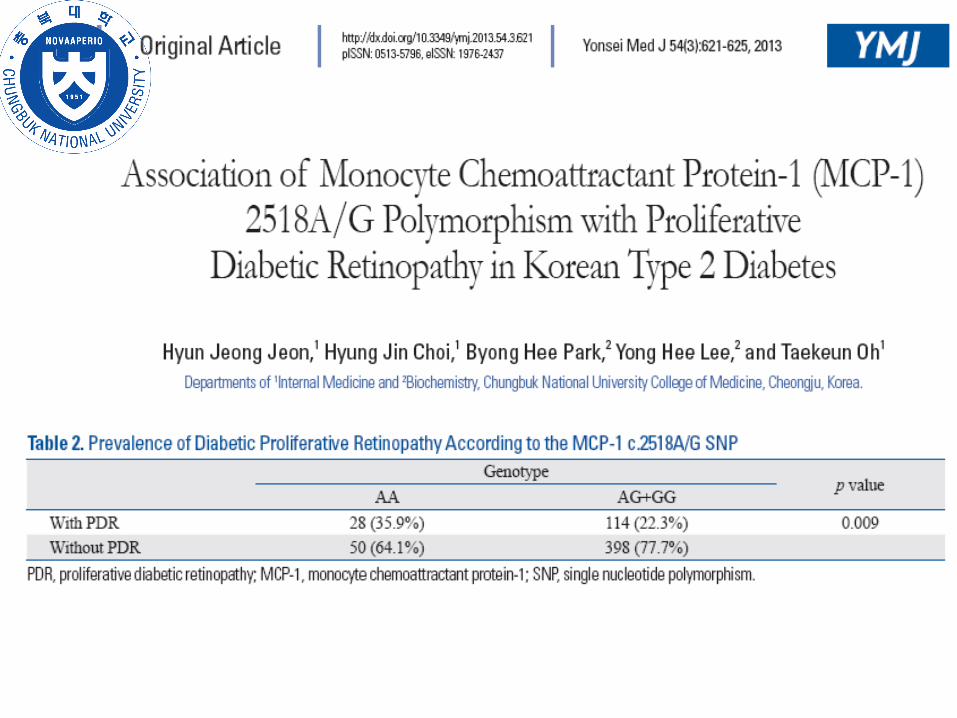
당뇨병 합병증 예측 유전형 연구
관찰기간 20년
합병증 발병
50%
20%
고위험 유전형 환자
저위험 유전형 환자
당뇨병
합병증

Diabetes Complication Prediction
2013 NEJM APOL1 Risk Variants, Race, and Progression of Chronic Kidney Disease
APOL1 genotype predicts kidney function decline

2014 DC Genetic Risk Score Associations With Cardiovascular Disease and Mortality in the Diabetes Heart Study
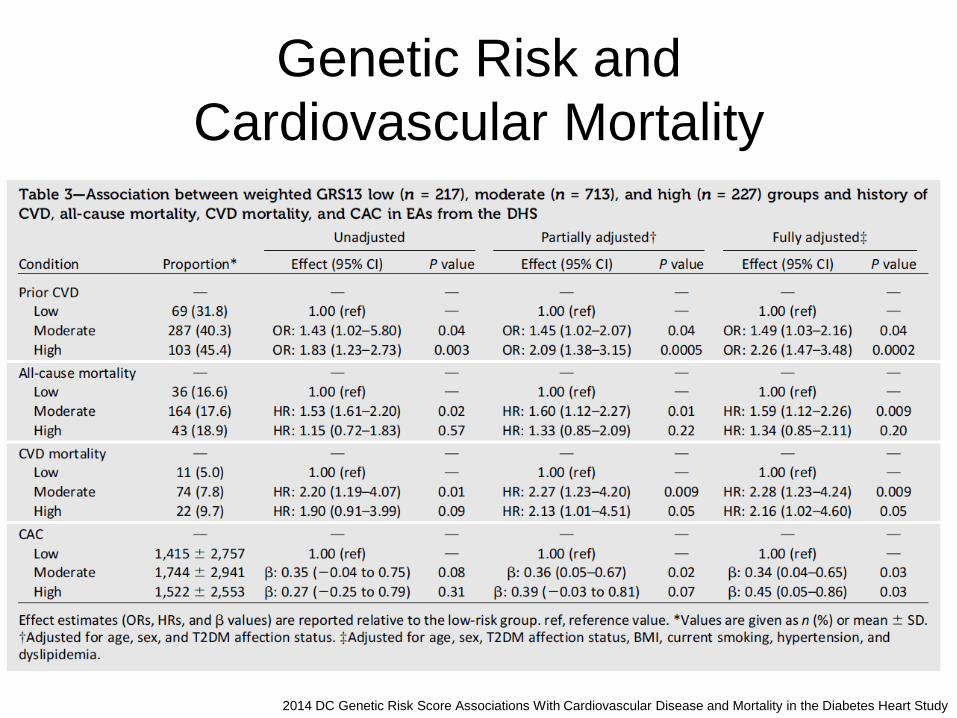
Genetic Risk and
Cardiovascular Mortality
2014 DC Genetic Risk Score Associations With Cardiovascular Disease and Mortality in the Diabetes Heart Study
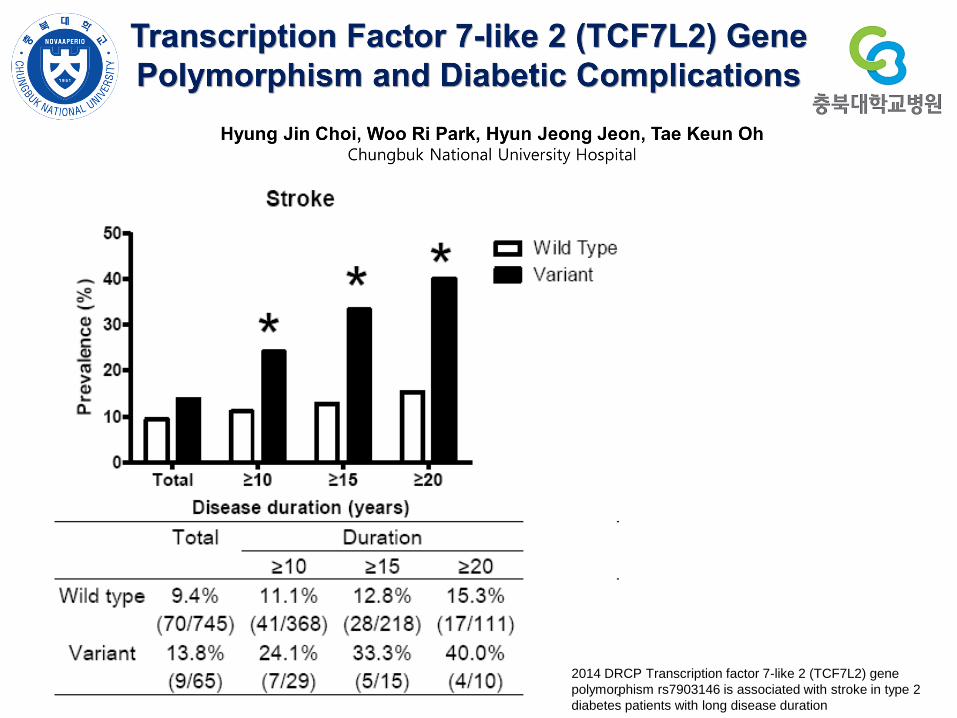
2014 DRCP Transcription factor 7-like 2 (TCF7L2) gene
polymorphism rs7903146 is associated with stroke in type 2
diabetes patients with long disease duration

Common Disease Risk
1. Disease Genetic Susceptibility
2. Ethnic Difference
3. Complication Genetic Susceptibility
4. Environmental Interaction
5. Epigenetics
6. Pleiotropy

Gene-Environment Interaction
Gene Environment
Disease
Genetic Predisposition Score Sugar-Sweetened Beverages
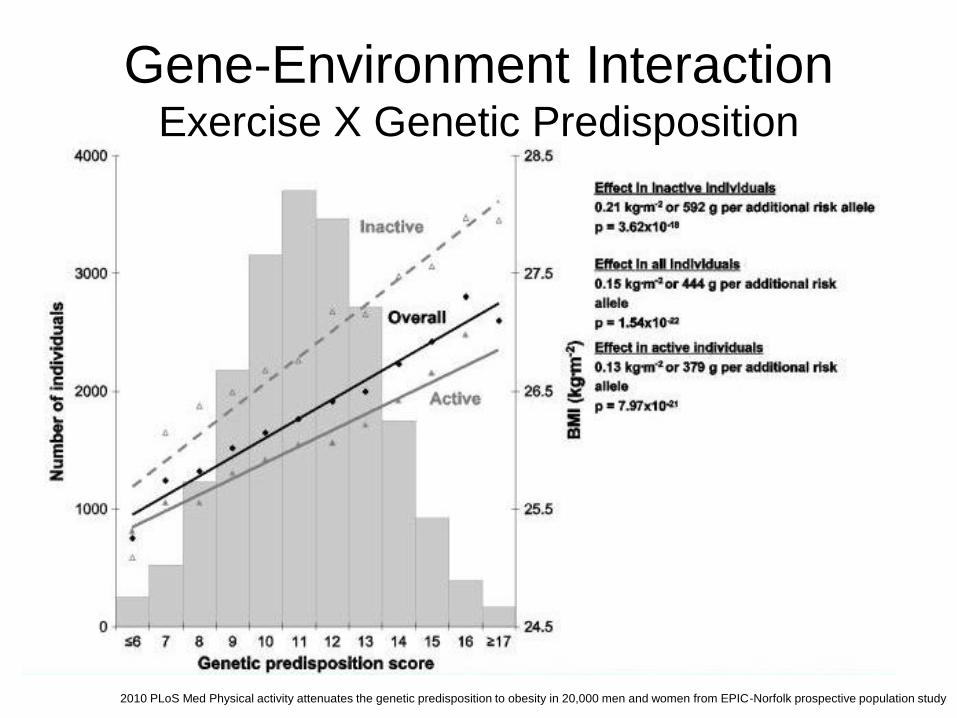
2010 PLoS Med Physical activity attenuates the genetic predisposition to obesity in 20,000 men and women from EPIC-Norfolk prospective population study
Gene-Environment Interaction Exercise X Genetic Predisposition
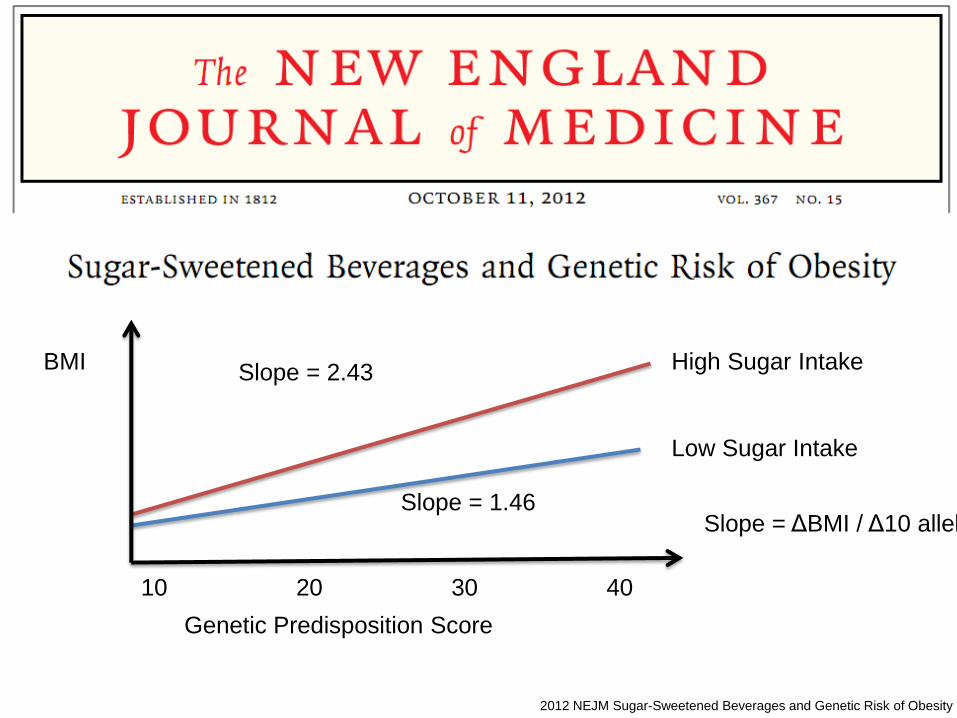
High Sugar Intake
Low Sugar Intake
Genetic Predisposition Score
10 40 20 30
BMI Slope = 2.43
Slope = 1.46 Slope = ΔBMI / Δ10 alleles
2012 NEJM Sugar-Sweetened Beverages and Genetic Risk of Obesity

Soda School
No-Soda School
Obese Family Lean Family

Common Disease Risk
1. Disease Genetic Susceptibility
2. Ethnic Difference
3. Complication Genetic Susceptibility
4. Environmental Interaction
5. Epigenetics
6. Pleiotropy

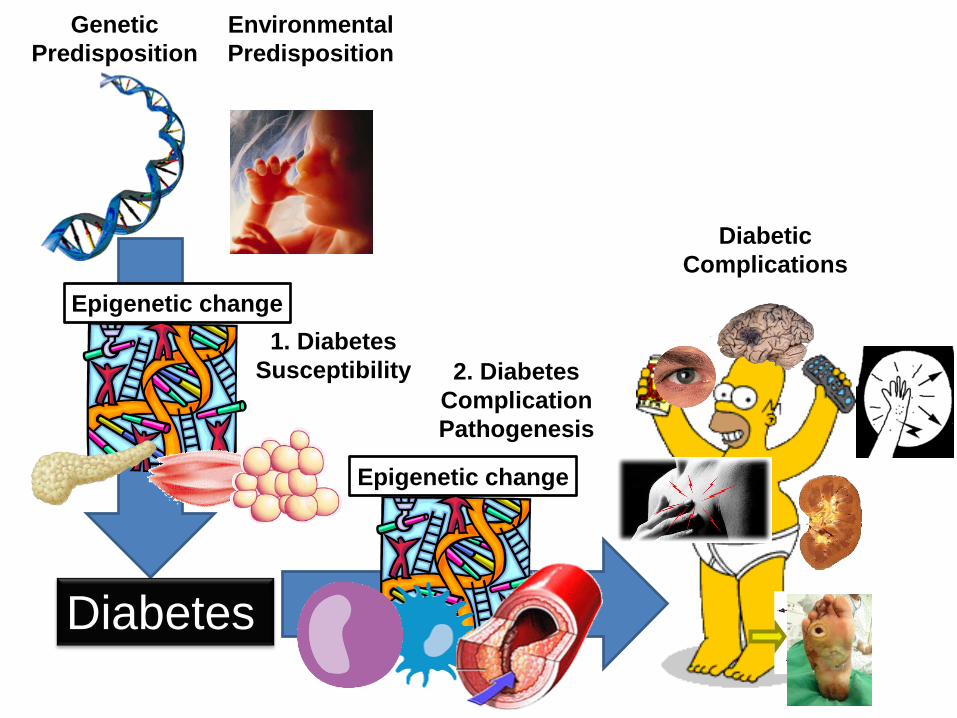
당뇨병과 후성유전체 연구
Food Diabetes
Genetic
Predisposition
Environmental
Predisposition
Epigenetic change
Epigenetic change
Diabetic
Complications
1. Diabetes
Susceptibility 2. Diabetes
Complication
Pathogenesis
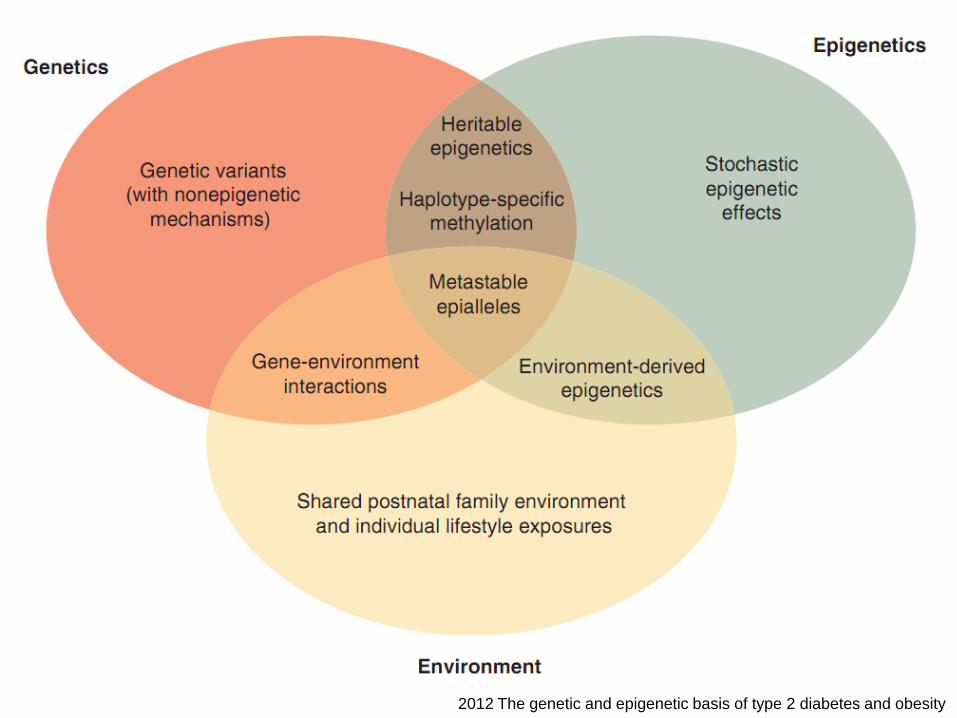
2012 The genetic and epigenetic basis of type 2 diabetes and obesity

Common Disease Risk
1. Disease Genetic Susceptibility
2. Ethnic Difference
3. Complication Genetic Susceptibility
4. Environmental Interaction
5. Epigenetics
6. Pleiotropy
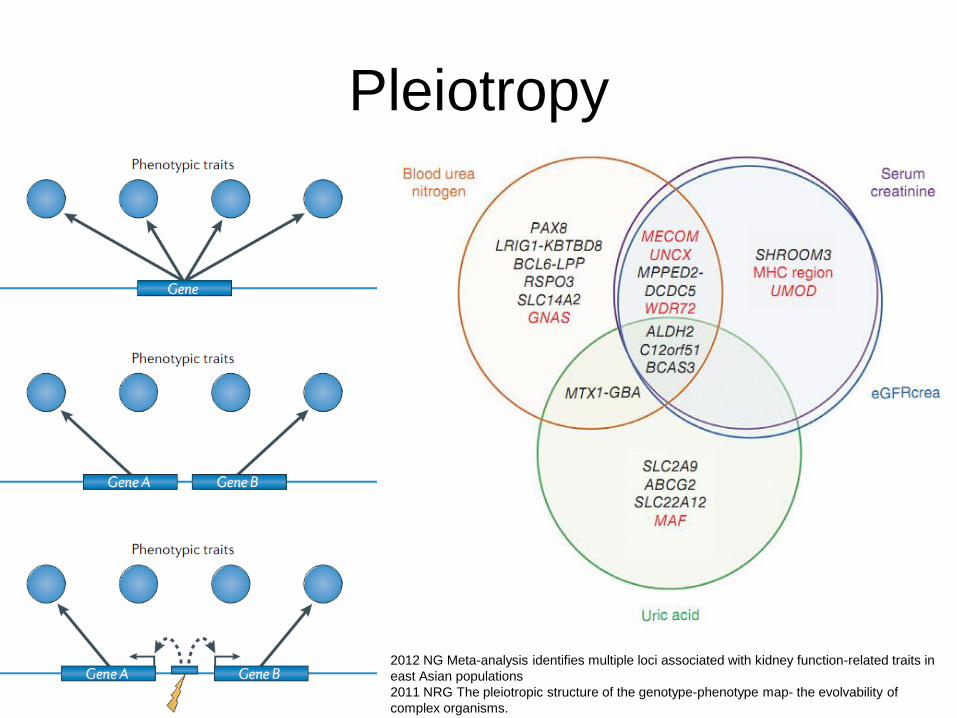
Pleiotropy
2012 NG Meta-analysis identifies multiple loci associated with kidney function-related traits in
east Asian populations
2011 NRG The pleiotropic structure of the genotype-phenotype map- the evolvability of
complex organisms.
Contents
1. Introduction
2. Genetic Variation and Expression
Analyses
3. Human Genome Project and Beyond
4. Personalized Medicine in Endocrinology
① Common Disease Risk
② Rare Disease Risk
③ Pharmacogenomics

2012 European Heart Journal. Personalized medicine: hope or hype?

Laboratory Director
강현석
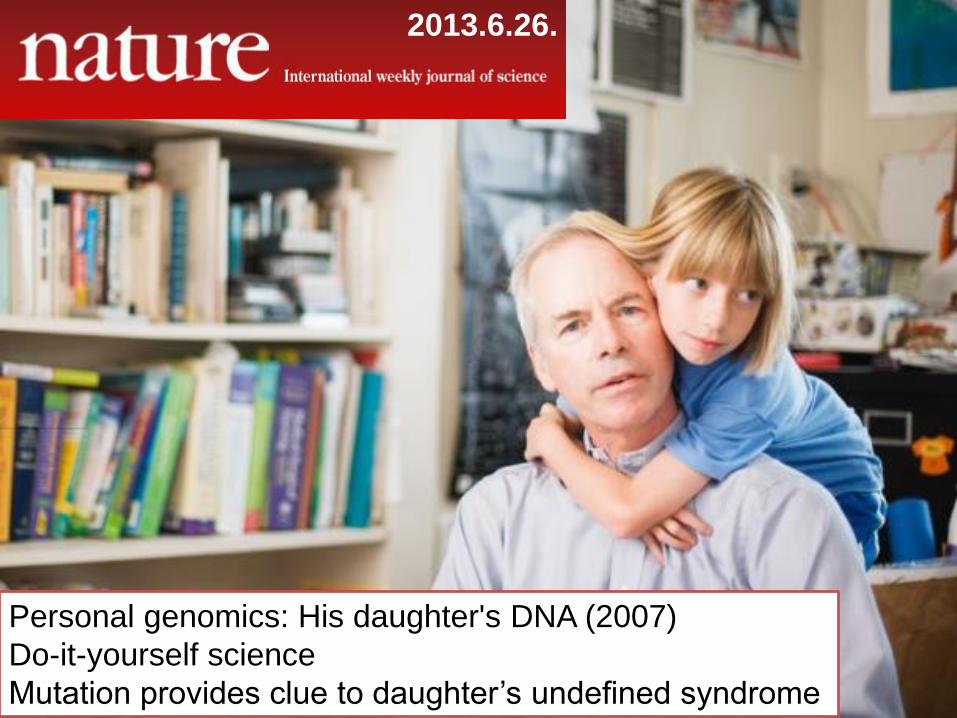
Personal genomics: His daughter's DNA (2007)
Do-it-yourself science
Mutation provides clue to daughter’s undefined syndrome
2013.6.26.

Contents
1. Introduction
2. Genetic Variation and Expression Analyses
3. Human Genome Project and Beyond
4. Personalized Medicine in Endocrinology
① Common Disease Risk
② Rare Disease Risk
③ Pharmacogenomics
• Cancer
• Non-cancer

Variable Drug Responses

2012 European Heart Journal. Personalized medicine: hope or hype?
Herceptin
Glivec

November 19, 2013
Cancer genomics
Pharmacogenomics
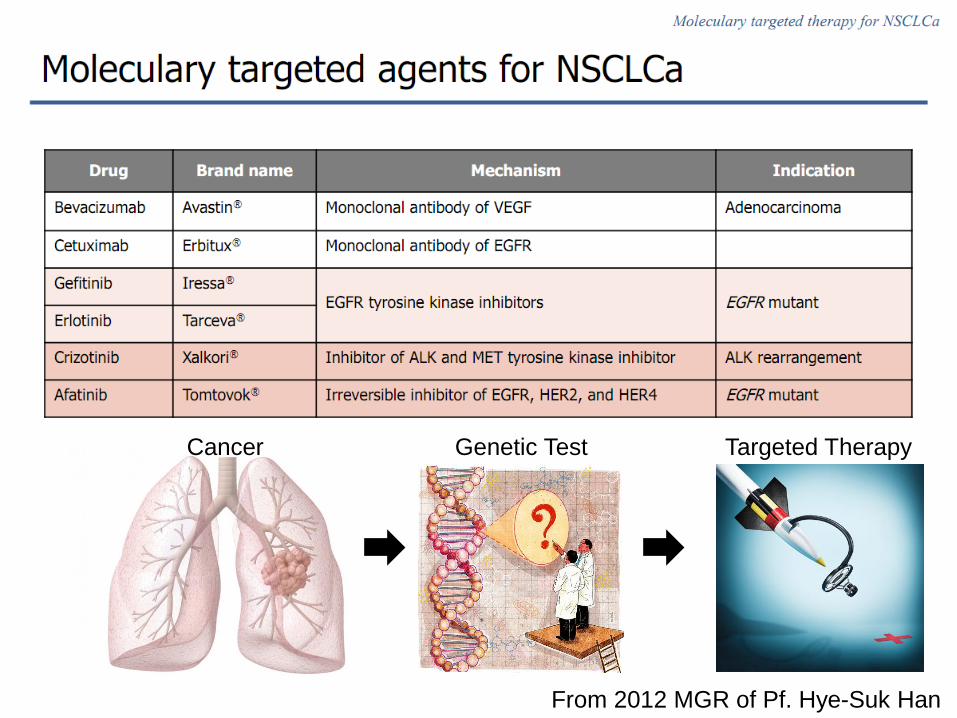
From 2012 MGR of Pf. Hye-Suk Han
Targeted Therapy Genetic Test Cancer
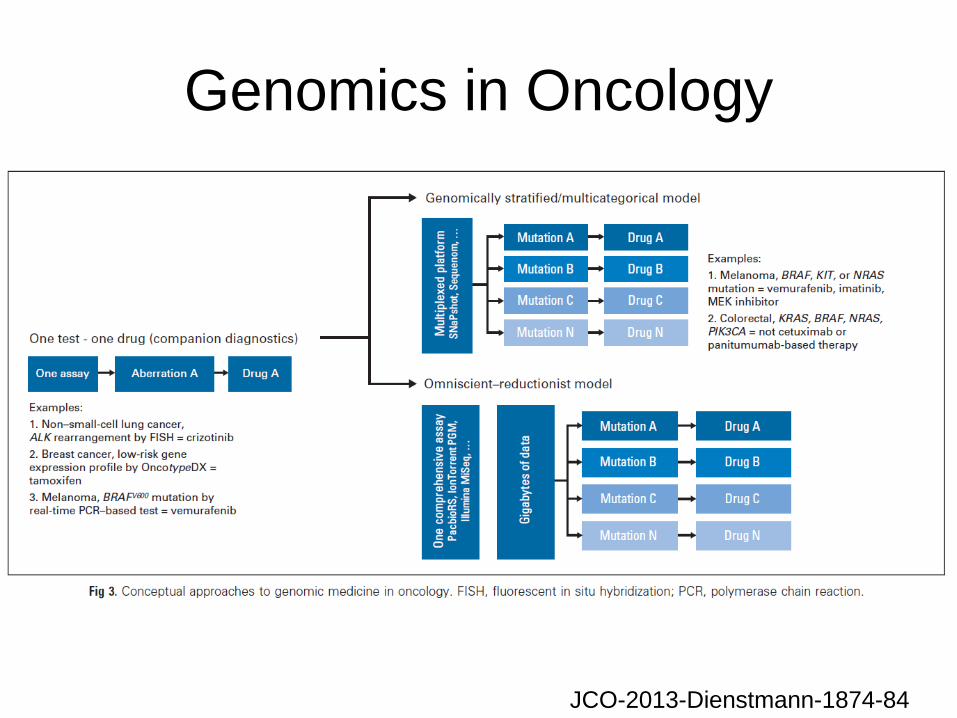
Genomics in Oncology
JCO-2013-Dienstmann-1874-84

JCO-2013-Garraway-1806-14

10 oncogenic drivers testing
2014 JAMA Using Multiplexed Assays of Oncogenic Drivers in Lung Cancers to Select Targeted Drugs

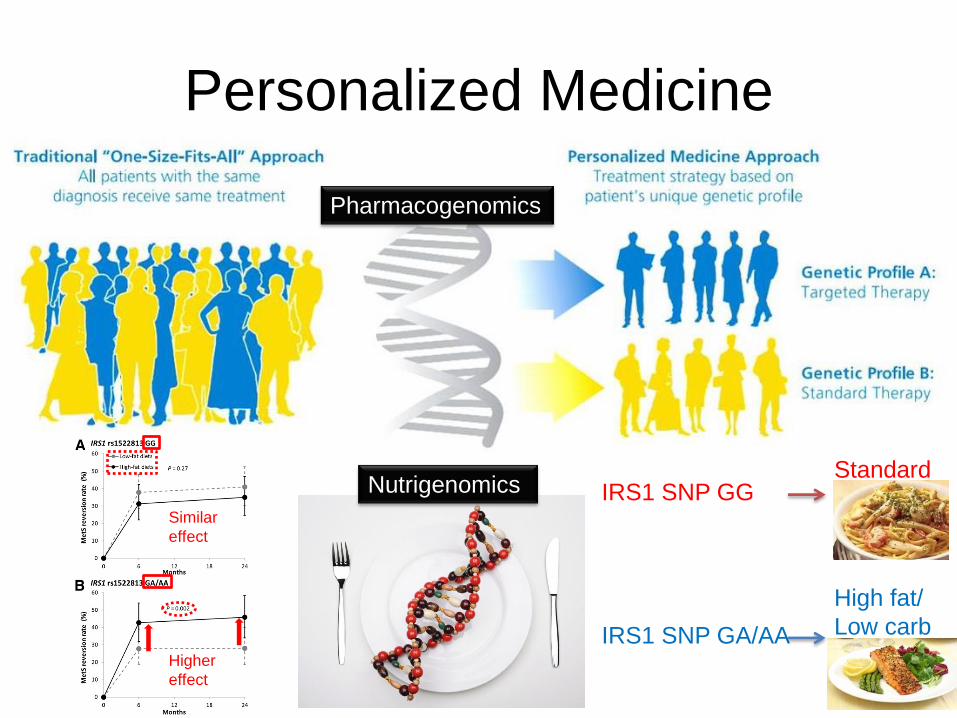
Personalized Medicine
Pharmacogenomics
Nutrigenomics
IRS1 SNP GA/AA
High fat/
Low carb
IRS1 SNP GG Standard
Higher
effect
Similar
effect

Large Effect Size Variant?
Disease susceptibility variant Pharmacogenetic variant
Environmental
Exposure
Drug
Exposure
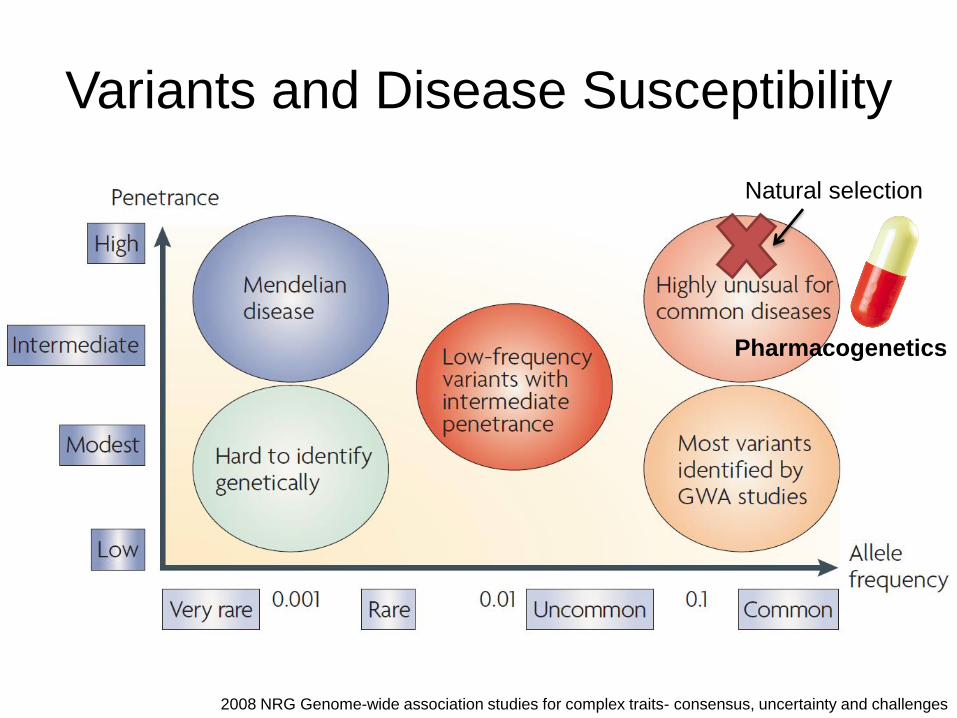
Variants and Disease Susceptibility
2008 NRG Genome-wide association studies for complex traits- consensus, uncertainty and challenges
Natural selection
Pharmacogenetics

GWAS
Effect Size vs. Sample Size
genotype relative
risks (GRR)
Small effect size
Large
effect size
2007 BMC Genetics. Power analysis for genome-wide association studies Small sample size
Large sample size
November 19, 2013
November 19, 2013

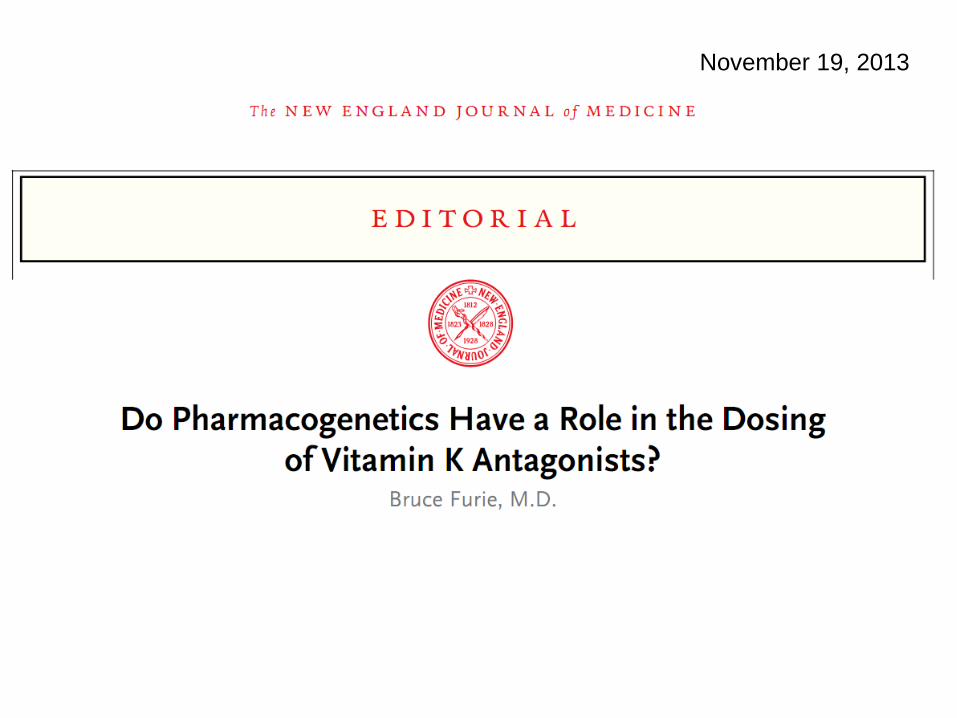
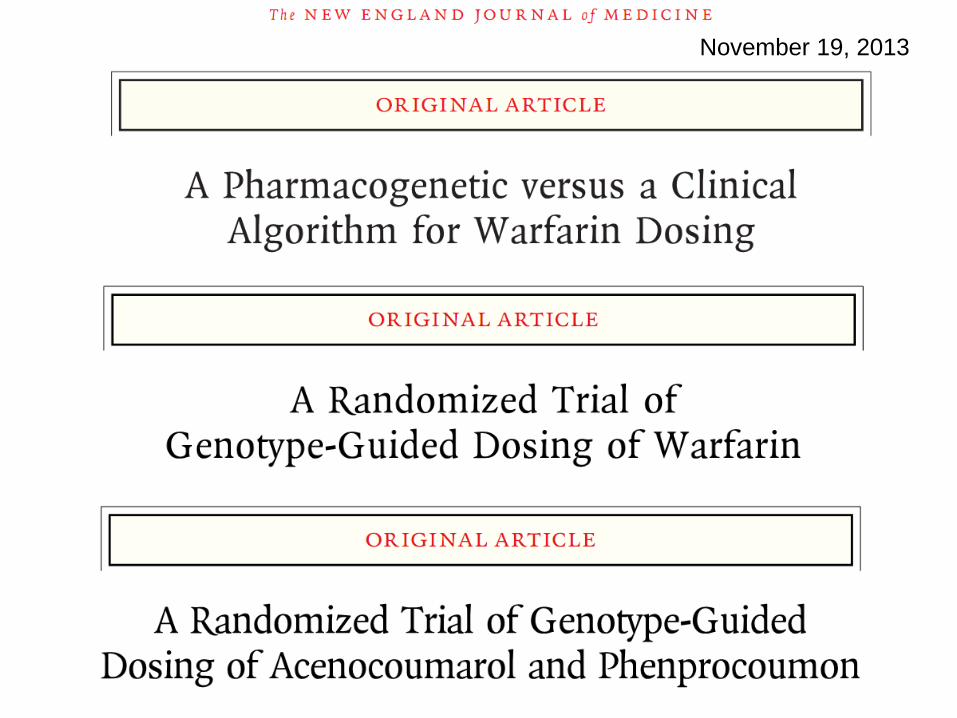
2013 NEJM A Randomized Trial of
Genotype-Guided Dosing of Warfarin

2013 NEJM A
Randomized Trial of
Genotype-Guided Dosing
of Warfarin
Median
21 days
Median
29 days
Median
44 days
Median
59 days
P<0.001
P=0.003

Case/Control=39/833
SNP chip
Chr 6
Discover
Validate
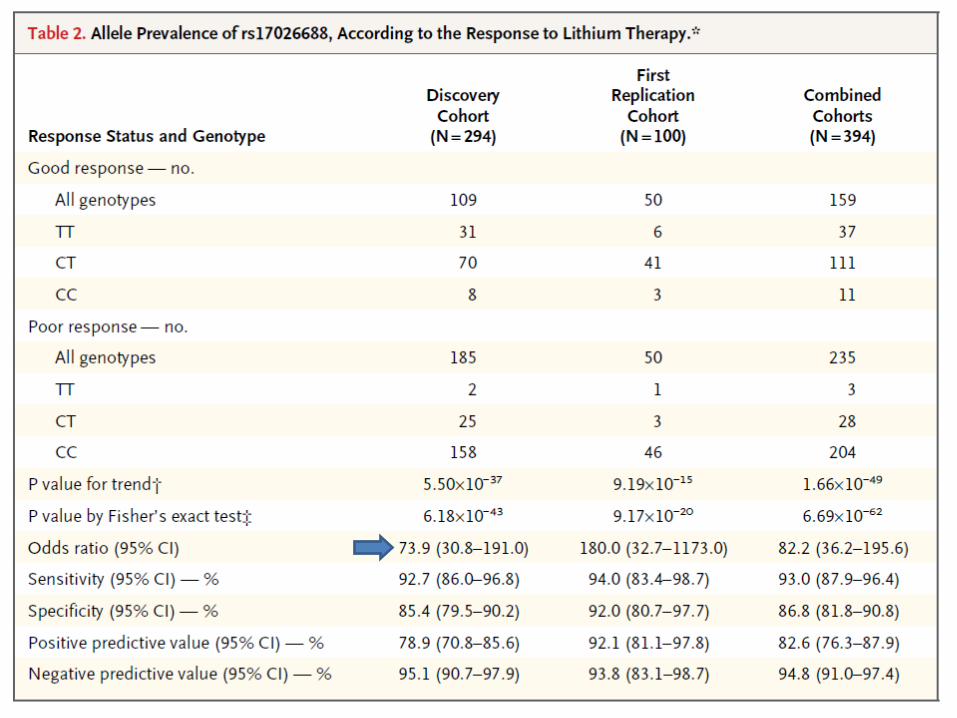
2013/10/24 China
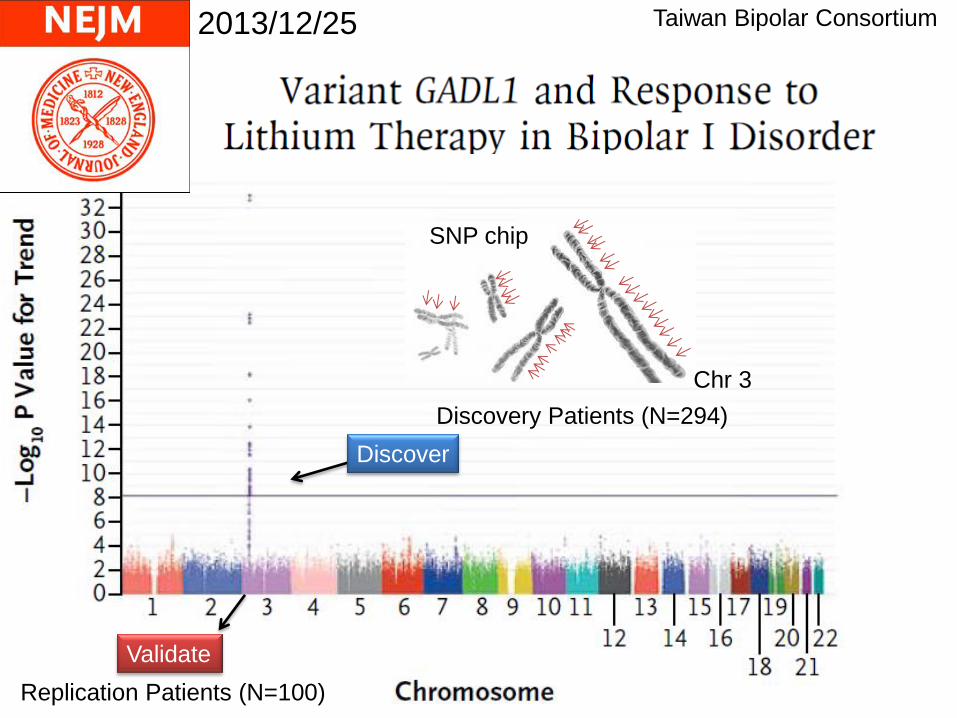
Discovery Patients (N=294)
SNP chip
Chr 3
2013/12/25
Discover
Validate
Replication Patients (N=100)
Taiwan Bipolar Consortium

Anti-thyroid drug related agranulocytosis
Hyperthyroidism Anti-thyroid drug Fatal side effect
Agranulocytosis
Hyperthyroidism: incidence 0.1~0.4 / 1000 / year (M<F)
Rare side effect: 0.3~0.6% among treated
Second exposure Relapse
HLA class II related?
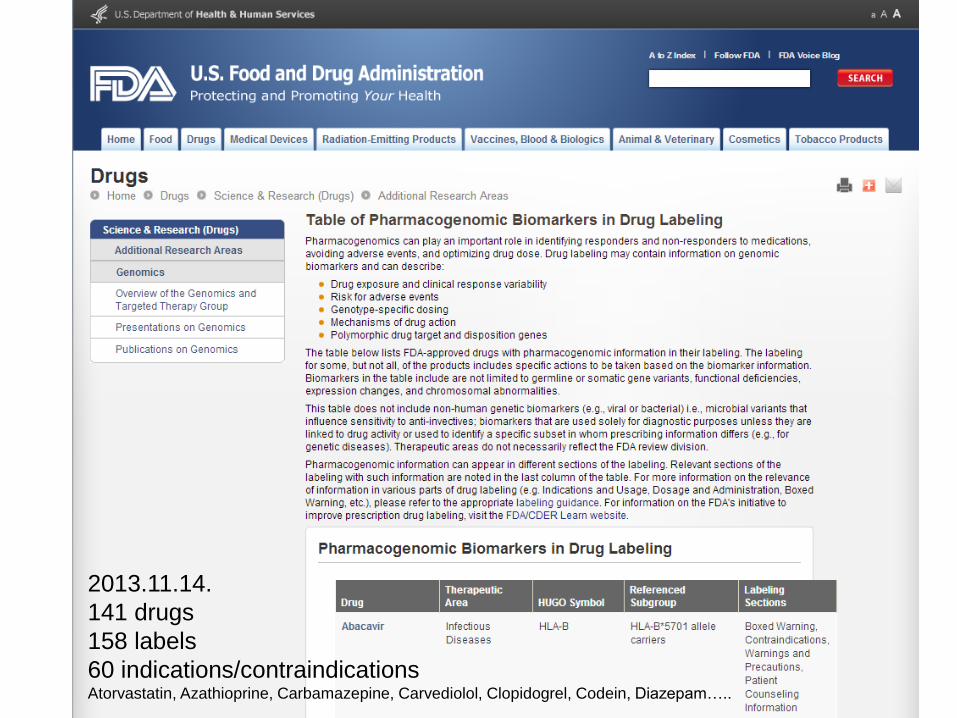
2013.11.14.
141 drugs
158 labels
60 indications/contraindications Atorvastatin, Azathioprine, Carbamazepine, Carvediolol, Clopidogrel, Codein, Diazepam…..
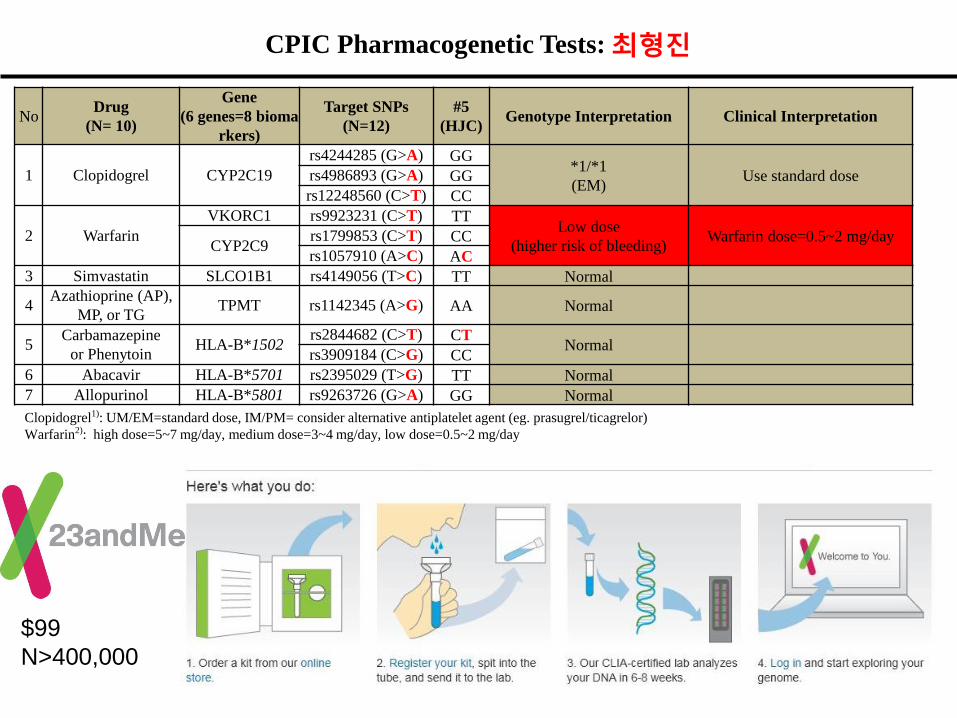
CPIC Pharmacogenetic Tests: 최형진
No Drug
(N= 10)
Gene
(6 genes=8 bioma
rkers)
Target SNPs
(N=12)
#5
(HJC) Genotype Interpretation Clinical Interpretation
1 Clopidogrel CYP2C19
rs4244285 (G>A) GG *1/*1
(EM) Use standard dose rs4986893 (G>A) GG
rs12248560 (C>T) CC
2 Warfarin
VKORC1 rs9923231 (C>T) TT Low dose
(higher risk of bleeding) Warfarin dose=0.5~2 mg/day
CYP2C9 rs1799853 (C>T) CC
rs1057910 (A>C) AC
3 Simvastatin SLCO1B1 rs4149056 (T>C) TT Normal
4 Azathioprine (AP),
MP, or TG TPMT rs1142345 (A>G) AA Normal
5 Carbamazepine
or Phenytoin HLA-B*1502
rs2844682 (C>T) CT Normal
rs3909184 (C>G) CC
6 Abacavir HLA-B*5701 rs2395029 (T>G) TT Normal
7 Allopurinol HLA-B*5801 rs9263726 (G>A) GG Normal
Clopidogrel1): UM/EM=standard dose, IM/PM= consider alternative antiplatelet agent (eg. prasugrel/ticagrelor)
Warfarin2): high dose=5~7 mg/day, medium dose=3~4 mg/day, low dose=0.5~2 mg/day
$99
N>400,000

Point-of-care
Genotyping
HyBeacon Probes

Pharmacogenomics
• Treatment Response
– GGPS1 SNP ↔ Bisphosphonate response
Choi et. al. Yonsei Med J. 2010

Metformin Transporters
AA
AC
CC
MATE1
OCT1
GG GA AA
2011 Nature. Drugs, diabetes and cancer
2013 The Role of Pharmacogenetics in Drug Disposition and Response of Oral Glucose-Lowering Drugs
2010 Interaction between polymorphisms in the OCT1 and MATE1 transporter and metformin response
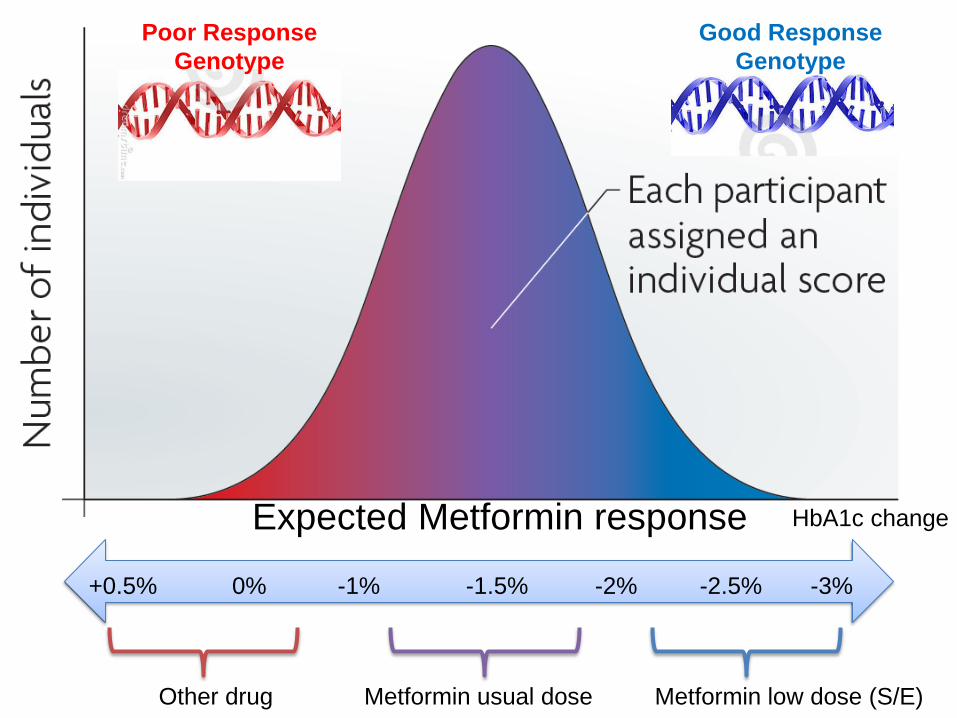
Expected Metformin response
Other drug Metformin usual dose Metformin low dose (S/E)
0% -1% -2% -1.5% -2.5% -3% +0.5%
HbA1c change
Good Response
Genotype
Poor Response
Genotype
2012 Individualized therapy for type 2 diabetes- clinical implications of pharmacogenetic data
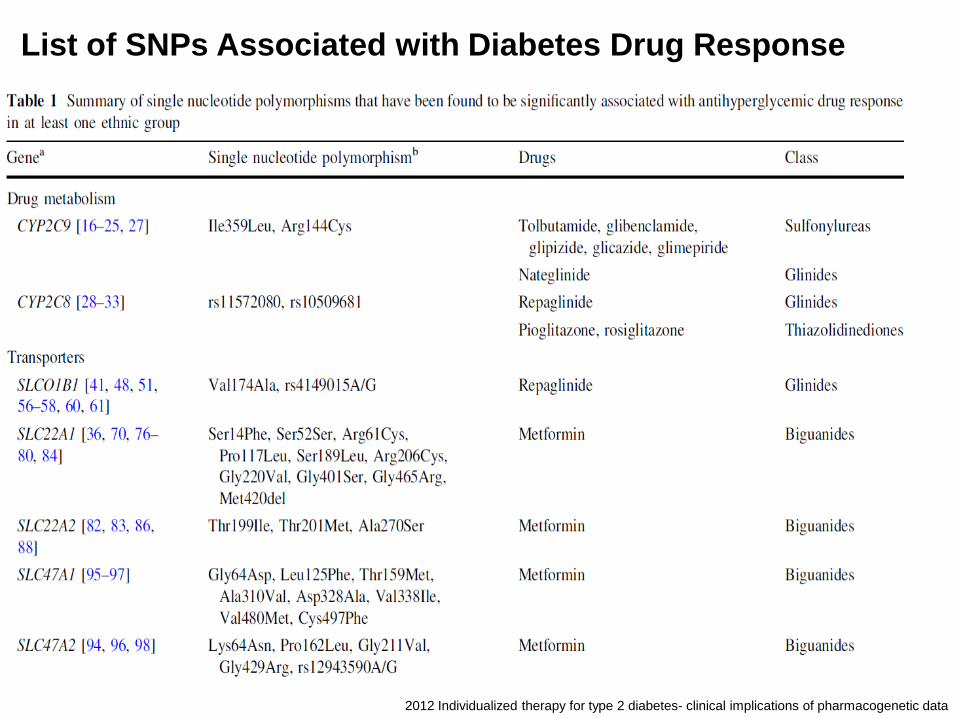
List of SNPs Associated with Diabetes Drug Response
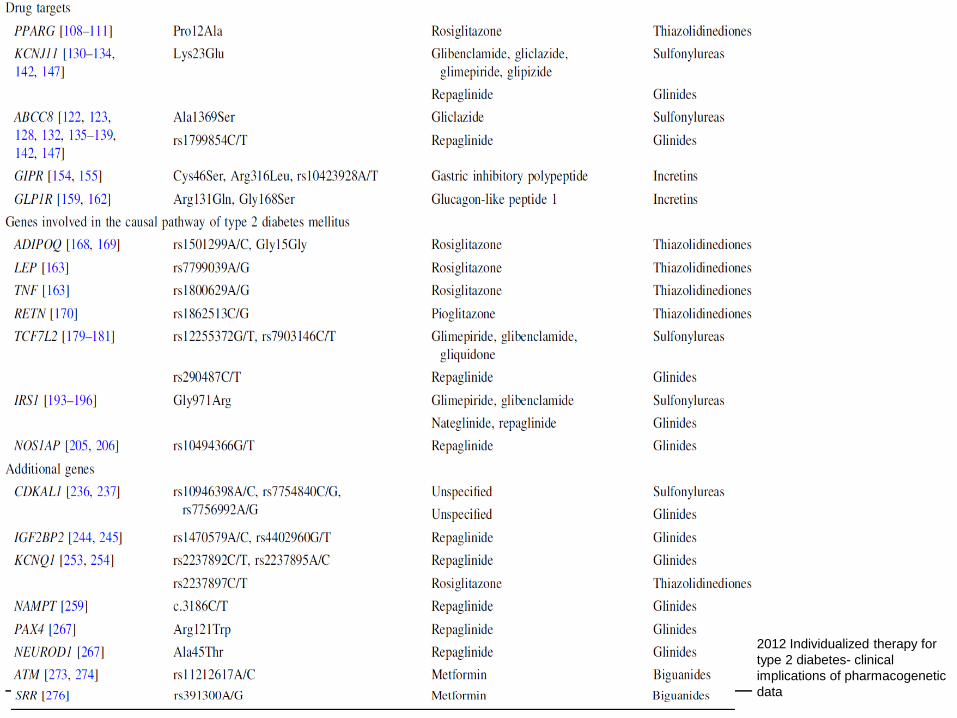
2012 Individualized therapy for
type 2 diabetes- clinical
implications of pharmacogenetic
data

Genotype Guided Personalized Treatment
Baseline
Genotyping
- Drug metabolism
- DM etiology
- DM complication
1 week 3 month Long term
Genotype based treatment strategy
- Drug choice
- Drug dose
- Lifestyle modification
- Complication evaluation
New
T2DM
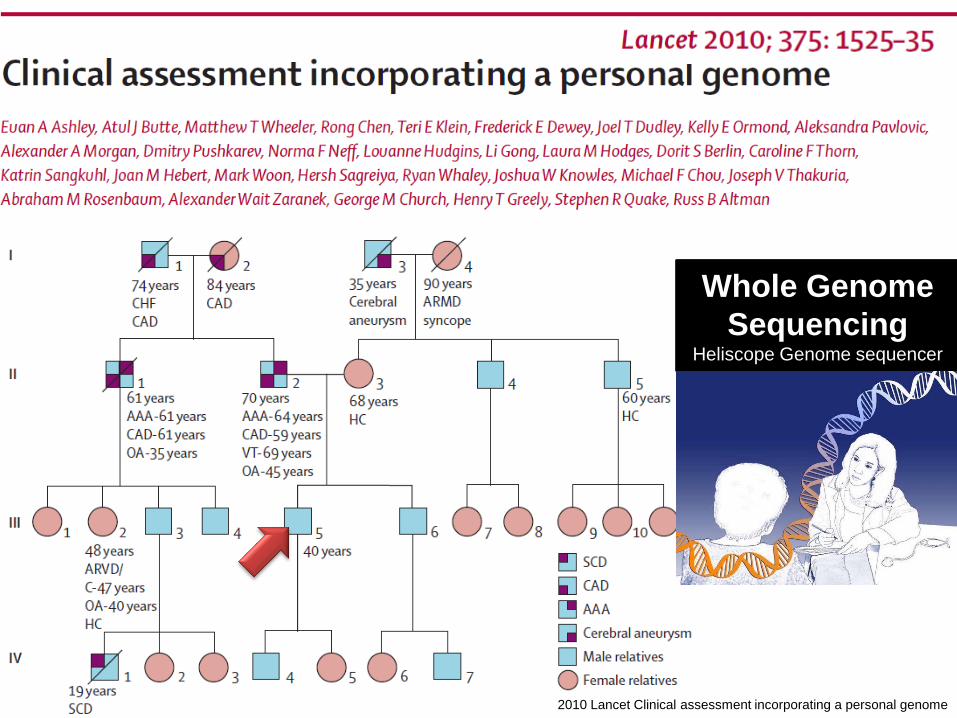
2010 Lancet Clinical assessment incorporating a personal genome
Whole Genome
Sequencing Heliscope Genome sequencer

Pharmacogenomic variants
2010 Lancet Clinical assessment incorporating a personal genome
2010 Lancet Clinical assessment incorporating a personal genome
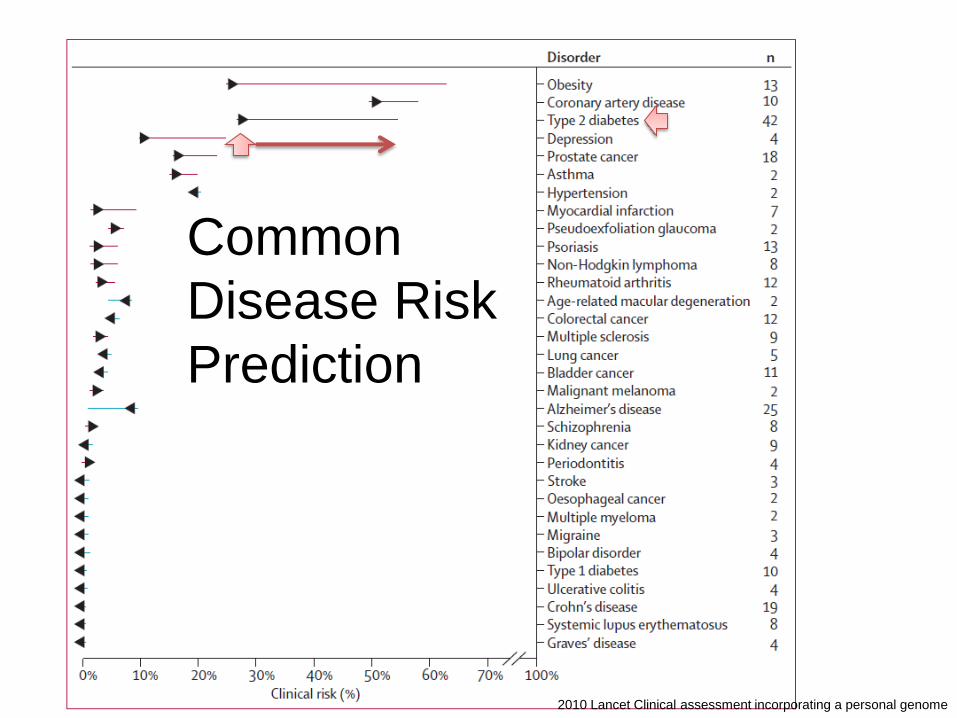
Common
Disease Risk
Prediction
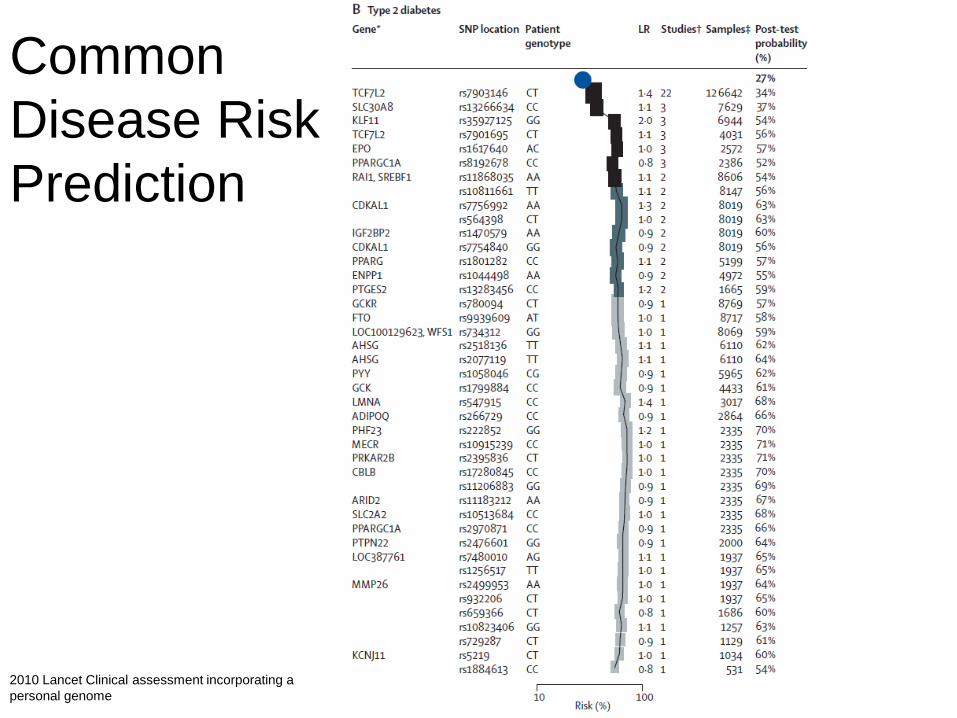
2010 Lancet Clinical assessment incorporating a
personal genome
Common
Disease Risk
Prediction

Rare variants
2010 Lancet Clinical assessment incorporating a personal genome

2010 Lancet Clinical assessment incorporating a personal genome
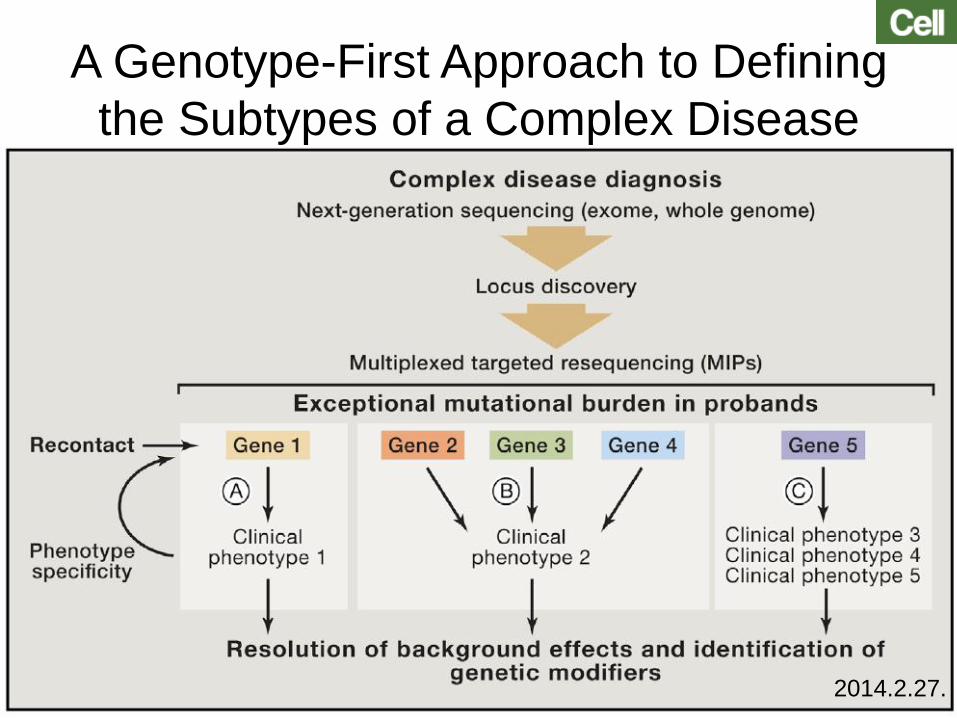
A Genotype-First Approach to Defining
the Subtypes of a Complex Disease
2014.2.27.

Genome-wide Profiling Human Genome(DNA) Study
Microarray
Proteonomics
GWAS, Candidate gene study
Familial study
Linkage study
Genomic Study
Genomic Medicine
Novel Variant(SNP) Discovery Novel Target Discovery
GENE for everyone VARIANT based individualization
Non-responder of treatment
Severe side effect
Anti-oxidant
Monoclonal antibody for osteoporosis
Genetic counseling for rare diseases
Sensitive urine test, DM subtype
Mendelian disease diagnosis
High risk of future osteoporosis
High risk of DM complications
Diagnosis
Treatment
Prevention
Common Disease Risk
Rare Disease Risk
Therapeutic Option
Novel Disease Target Personalized Medicine

Genome Surgery

Future of Genomic Medicine?
Test when needed Without information Know your type
Blood
type
Geno
type
Here is my
sequence