軟體實作與計算實驗 1 lecture 9 classification two mappings from position to color linear...
TRANSCRIPT

軟體實作與計算實驗 1
Lecture 9 Classification
Two mappings from position to color Linear combination of distances to centers RBF: Linear combination of exponential distances
to centers Four computational steps
(A) K-means (B) Cross Distances (C) Optimal Coefficients (D) Coloring
Five flow charts: OC (optimal coefficients), Coloring, ER (error rate), TRAINING & TESTING :
軟體實作與計算實驗 2
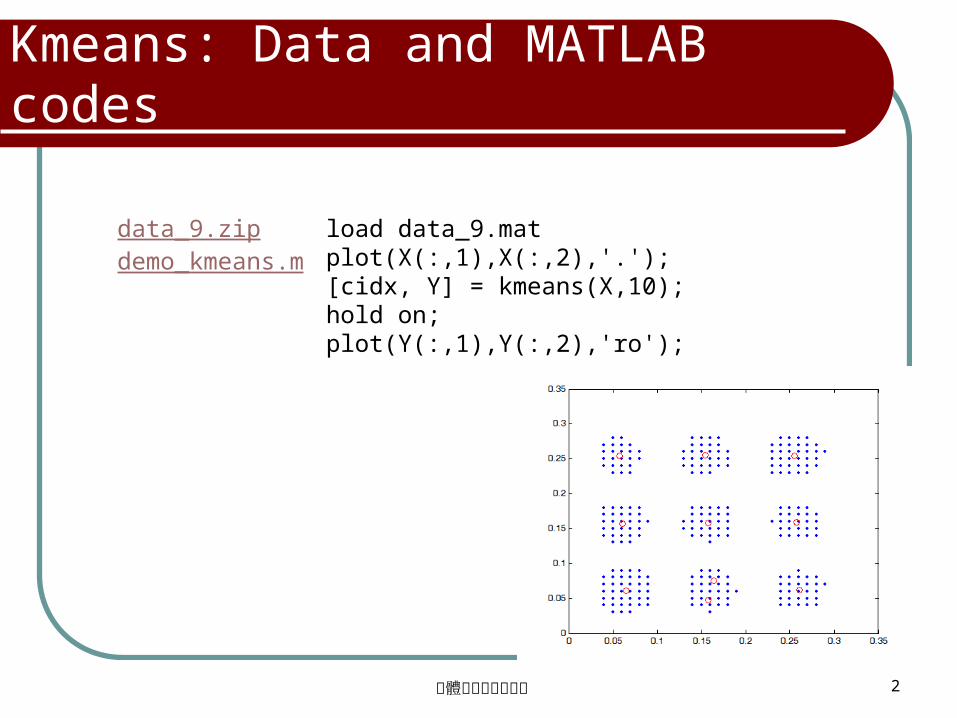
Kmeans: Data and MATLAB codes
data_9.zipdemo_kmeans.m
load data_9.mat plot(X(:,1),X(:,2),'.'); [cidx, Y] = kmeans(X,10); hold on; plot(Y(:,1),Y(:,2),'ro');
軟體實作與計算實驗 3
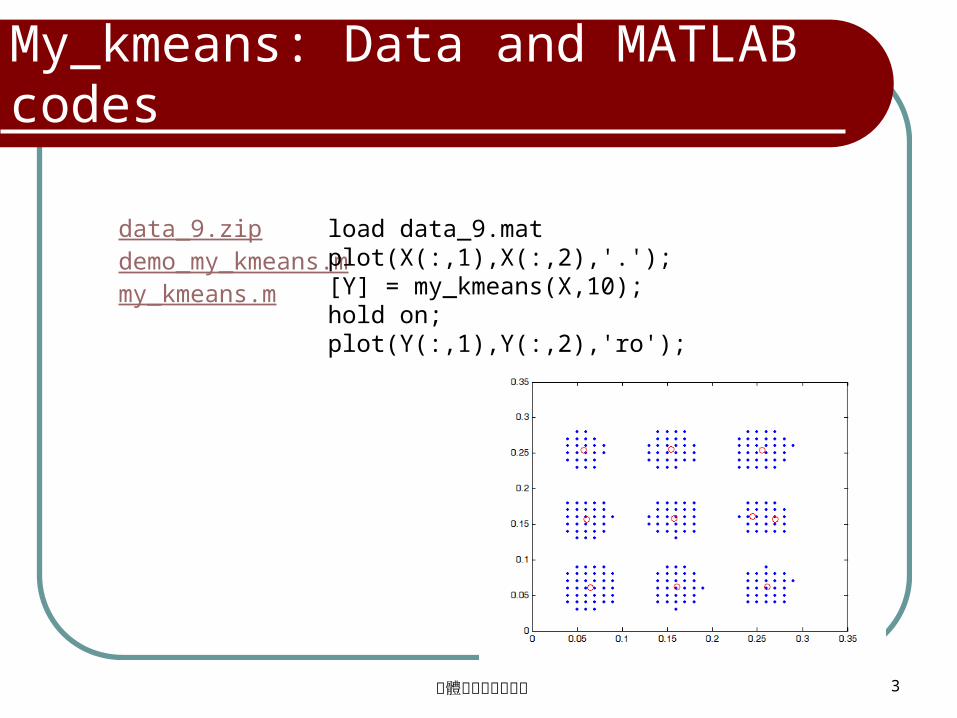
My_kmeans: Data and MATLAB codes
data_9.zipdemo_my_kmeans.mmy_kmeans.m
load data_9.mat plot(X(:,1),X(:,2),'.'); [Y] = my_kmeans(X,10); hold on; plot(Y(:,1),Y(:,2),'ro');

軟體實作與計算實驗 4
ClusteringTest.rarmy_kmeans.m
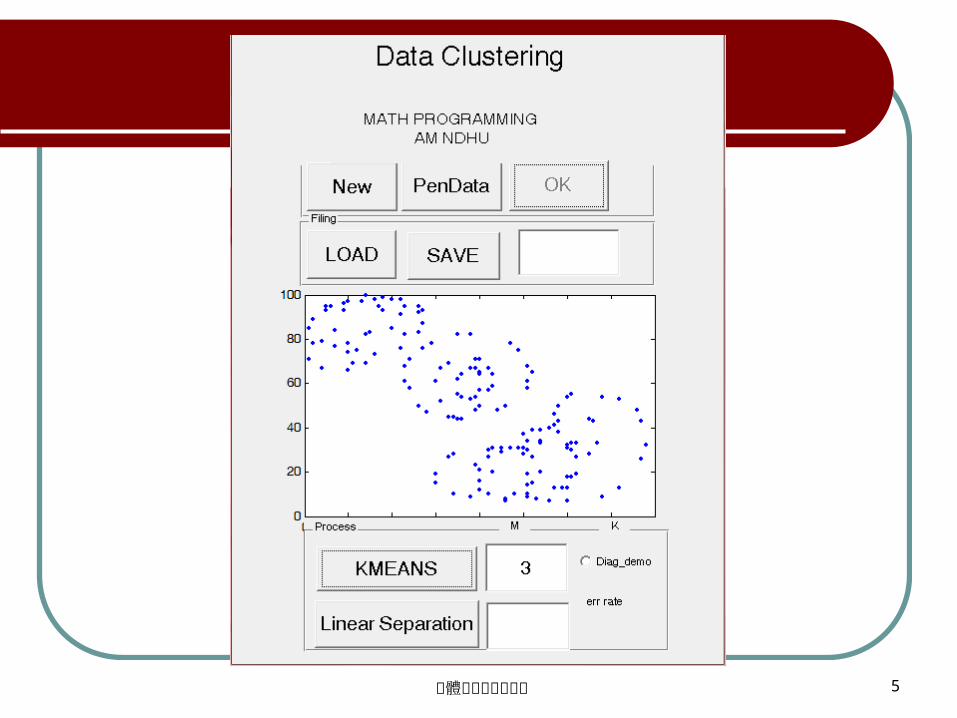
GUI
軟體實作與計算實驗 5

軟體實作與計算實驗 6
Path of 4 means to centers of clusters

軟體實作與計算實驗 7
Tracking Convergence of K means
軟體實作與計算實驗 8
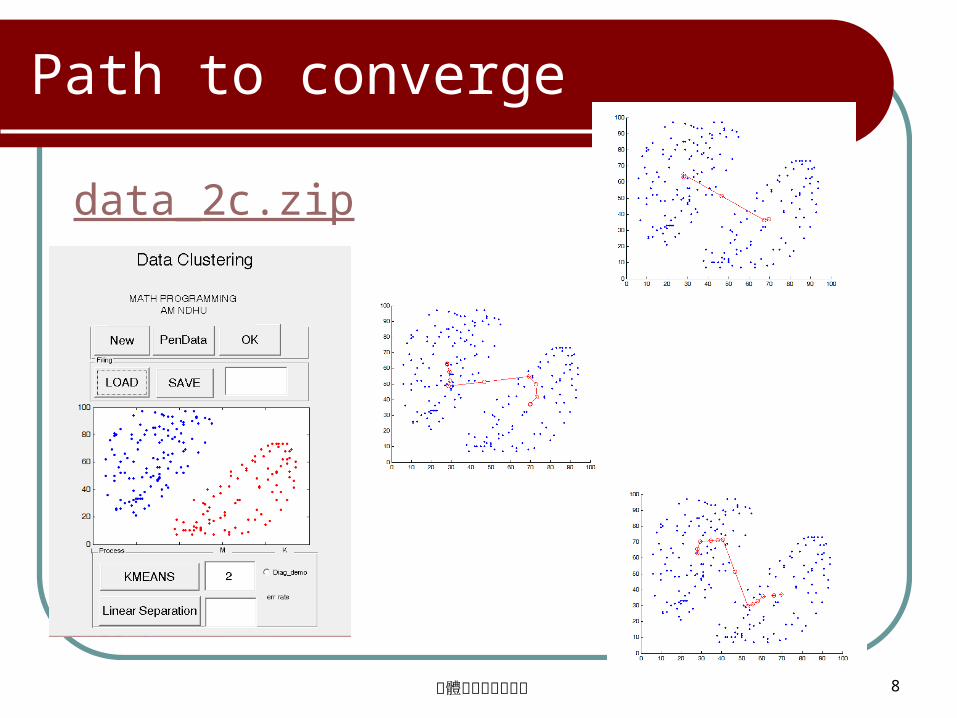
Path to converge
data_2c.zip
軟體實作與計算實驗 9
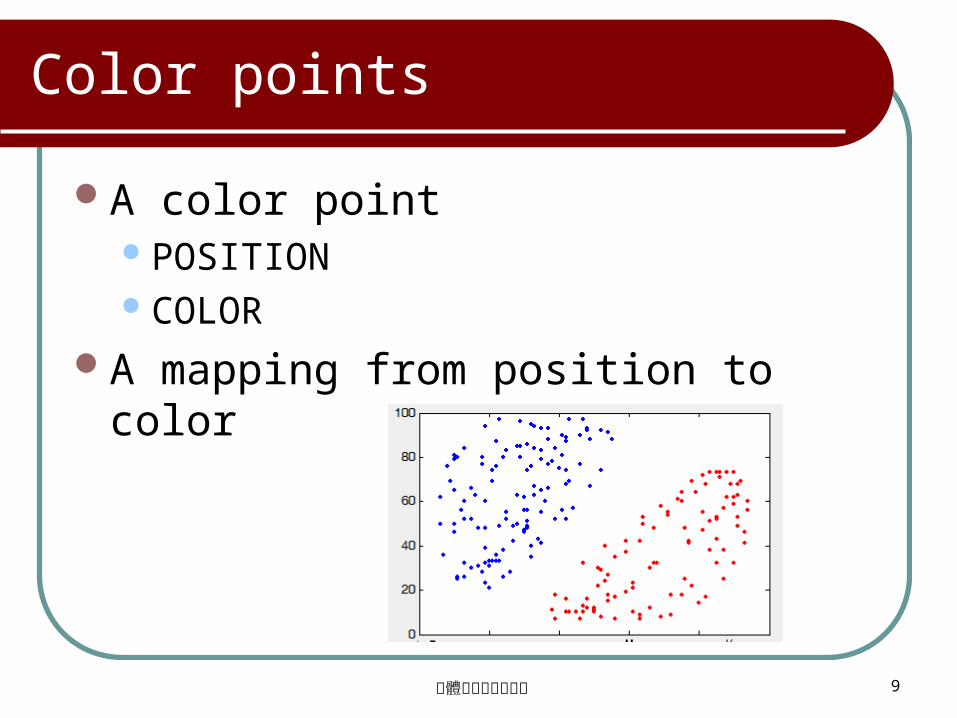
Color points
A color pointPOSITIONCOLOR
A mapping from position to color

軟體實作與計算實驗 10
Classification of color points
A mapping from position to colorA rule for discriminating red points from
blue points
軟體實作與計算實驗 11
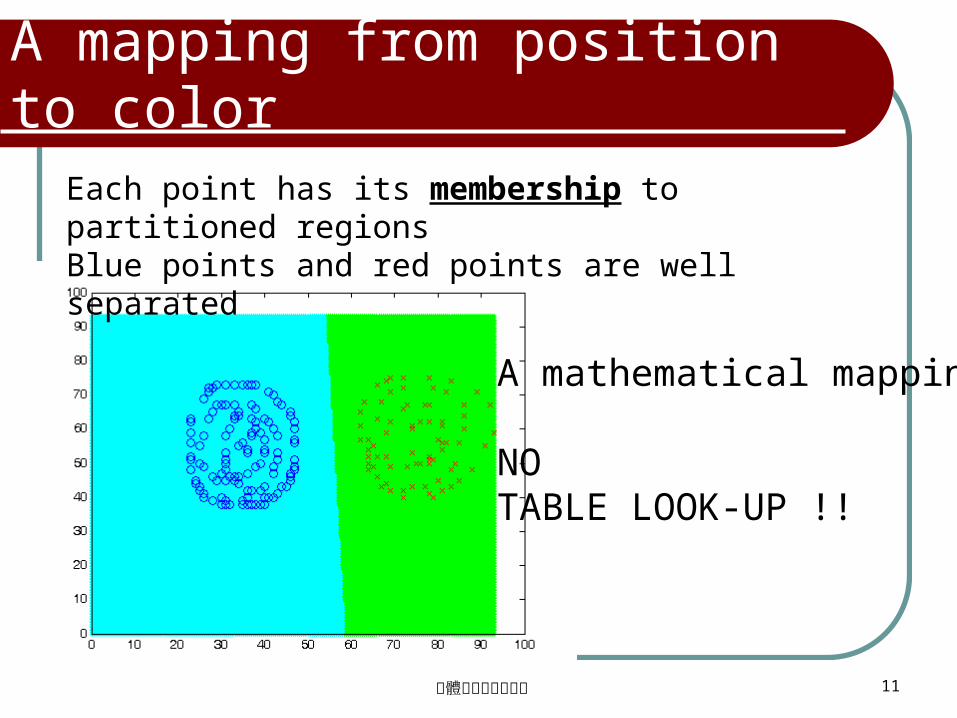
A mapping from position to color
Each point has its membership to partitioned regionsBlue points and red points are well separated
A mathematical mapping
NO TABLE LOOK-UP !!
軟體實作與計算實驗 12
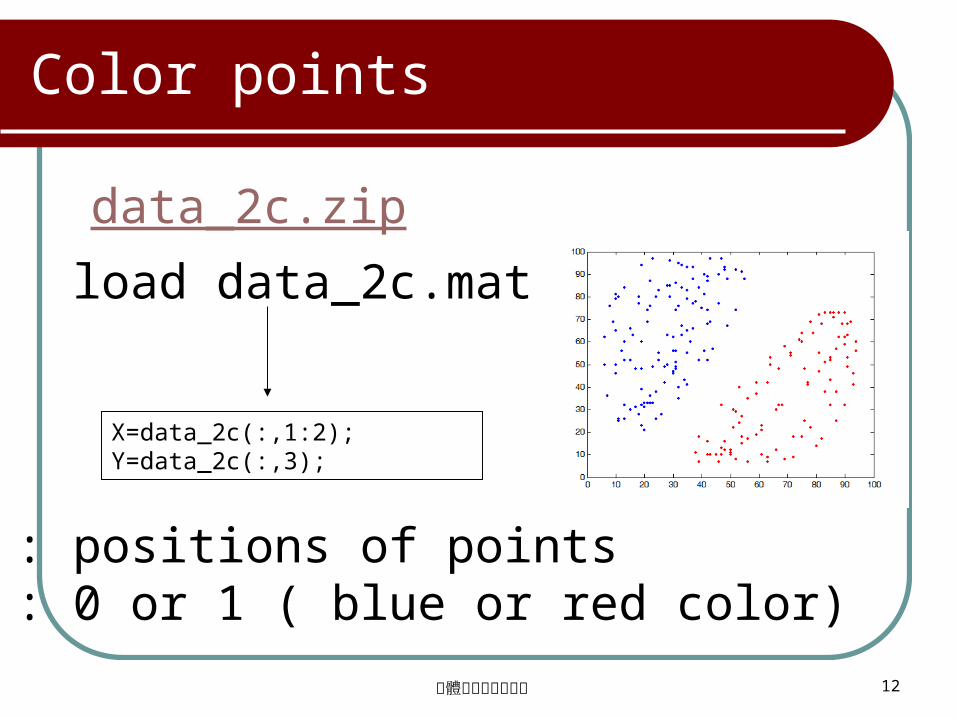
load data_2c.mat
data_2c.zip
X=data_2c(:,1:2);Y=data_2c(:,3);
X : positions of pointsY : 0 or 1 ( blue or red color)
Color points

軟體實作與計算實驗 13
Two-dimensional color points
Load data for classification
function show_color_data(X,Y) figure;ind = find(Y==0);plot(X(ind,1), X(ind,2), 'b. '); hold onind = find(Y==1);plot(X(ind,1), X(ind,2), 'r.')
load data_2cX=data_2c(:,1:2);Y=data_2c(:,3);
show_color_data(X,Y)

軟體實作與計算實驗 14
Position & Color
X and Y are paired dataX collects positions of pointsY collects colors of pointsA mapping from position to color is
derived for classification of color points

軟體實作與計算實驗 15
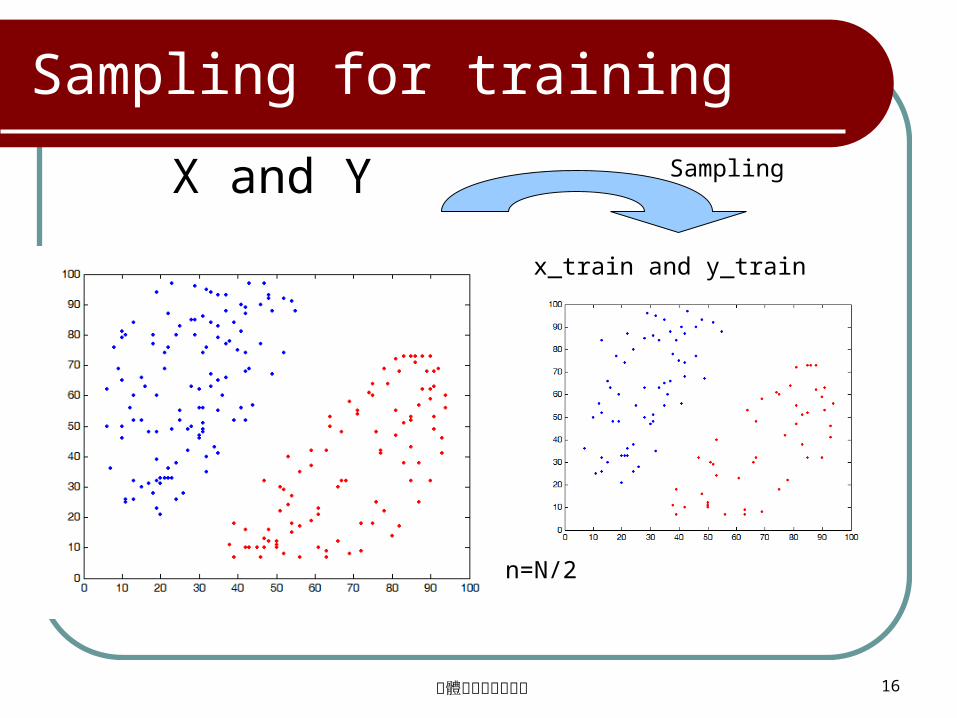
Sampling for training
Sampling one half as training pointsN=size(X,1);ind=randperm(N);n = floor(N/2);x_train=X(ind(1:n),:);y_train=Y(ind(1:n),:);
show_color_data(x_train,y_train)
軟體實作與計算實驗 16
X and Y Sampling
x_train and y_train
Sampling for training
n=N/2
軟體實作與計算實驗 17
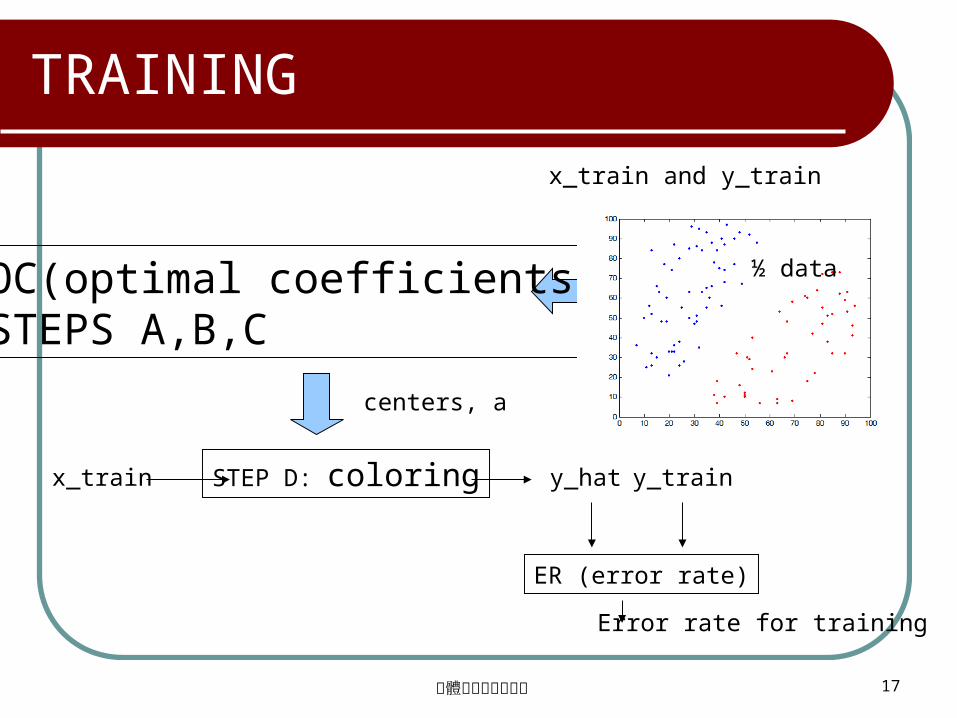
x_train and y_train
OC(optimal coefficients)STEPS A,B,C
TRAINING
STEP D: coloringx_train y_hat y_train
ER (error rate)
Error rate for training
½ data
centers, a
軟體實作與計算實驗 18
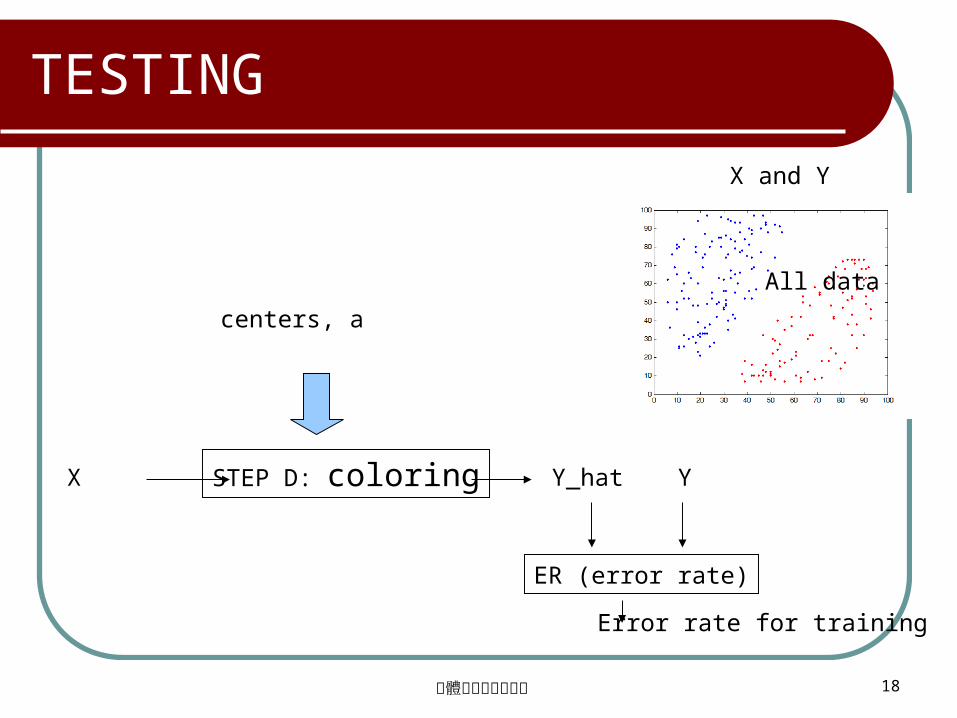
X and Y
TESTING
STEP D: coloringX Y_hat Y
ER (error rate)
Error rate for training
centers, a
All data
軟體實作與計算實驗 19
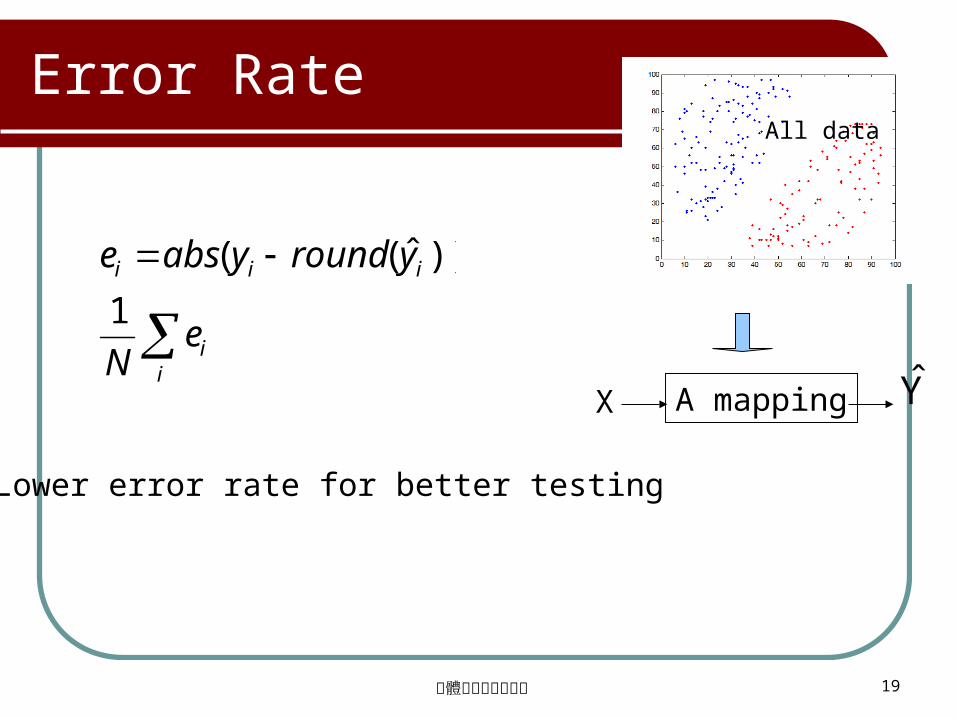
• Lower error rate for better testing
Error Rate
ii
iii
eN
yroundyabse
1
))ˆ((
A mappingX Y
All data
軟體實作與計算實驗 20
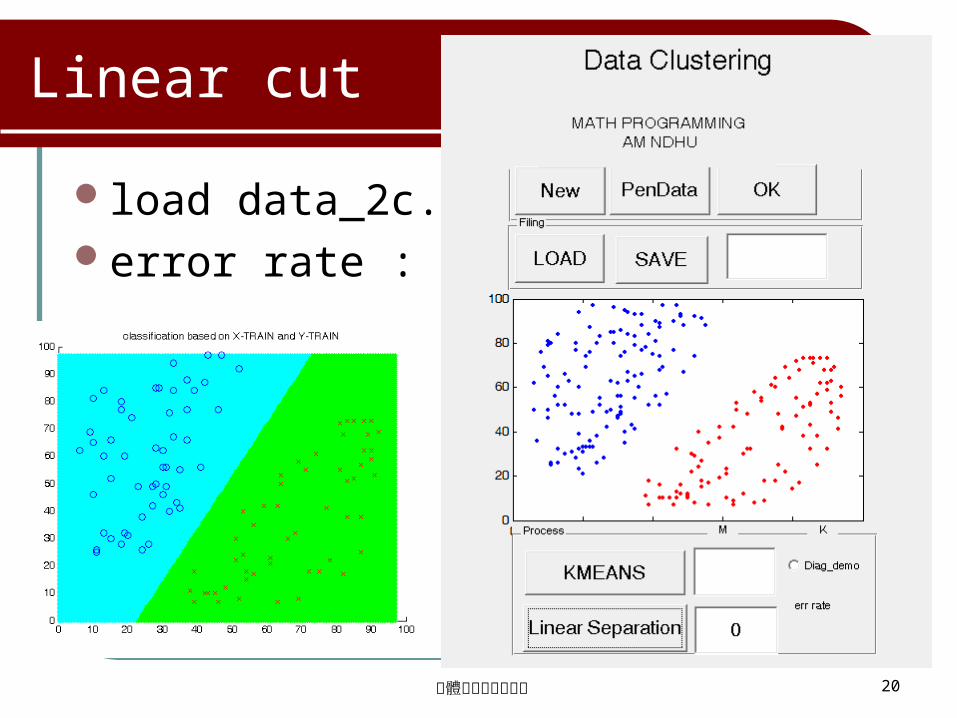
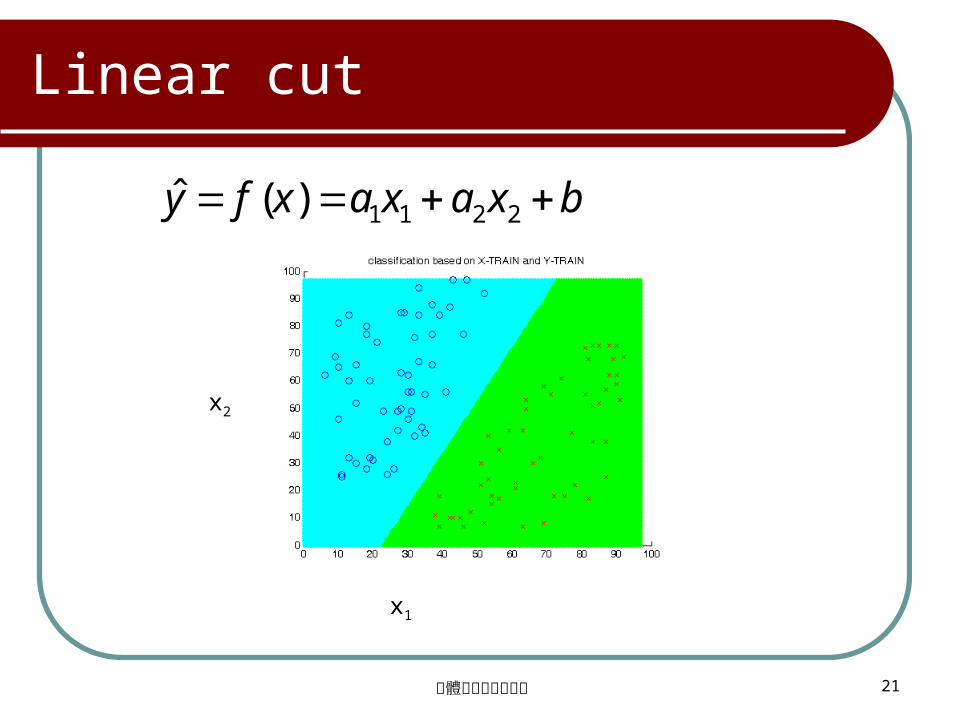
Linear cut
load data_2c.txt error rate : zero
軟體實作與計算實驗 21
Linear cut
x1
x2
bxaxaxfy 2211)(ˆ
軟體實作與計算實驗 22
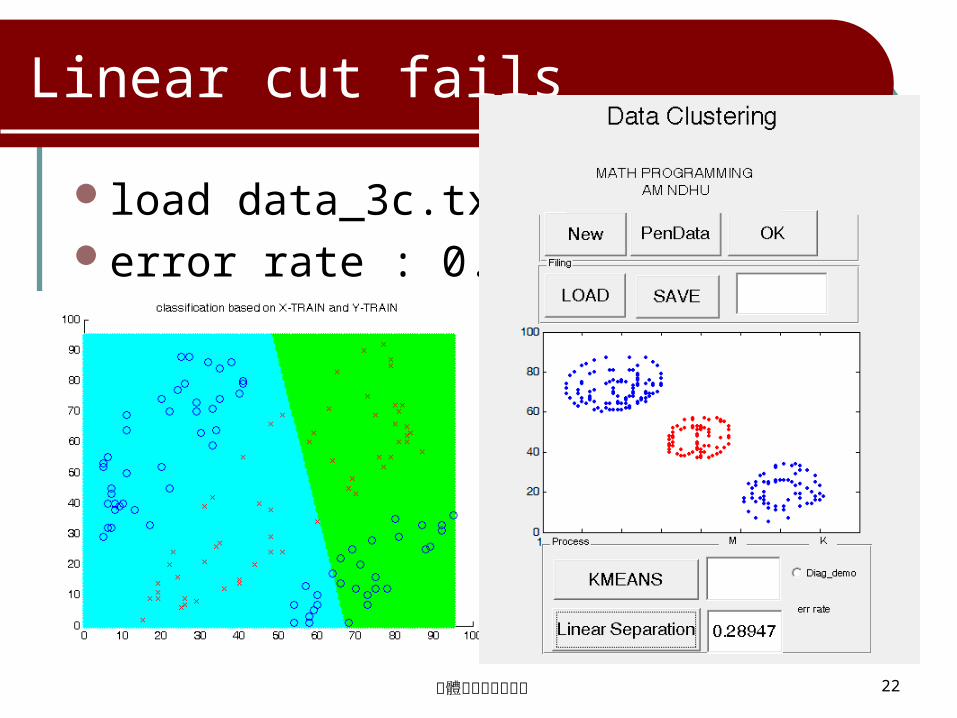
Linear cut fails
load data_3c.txt error rate : 0.289
軟體實作與計算實驗 23
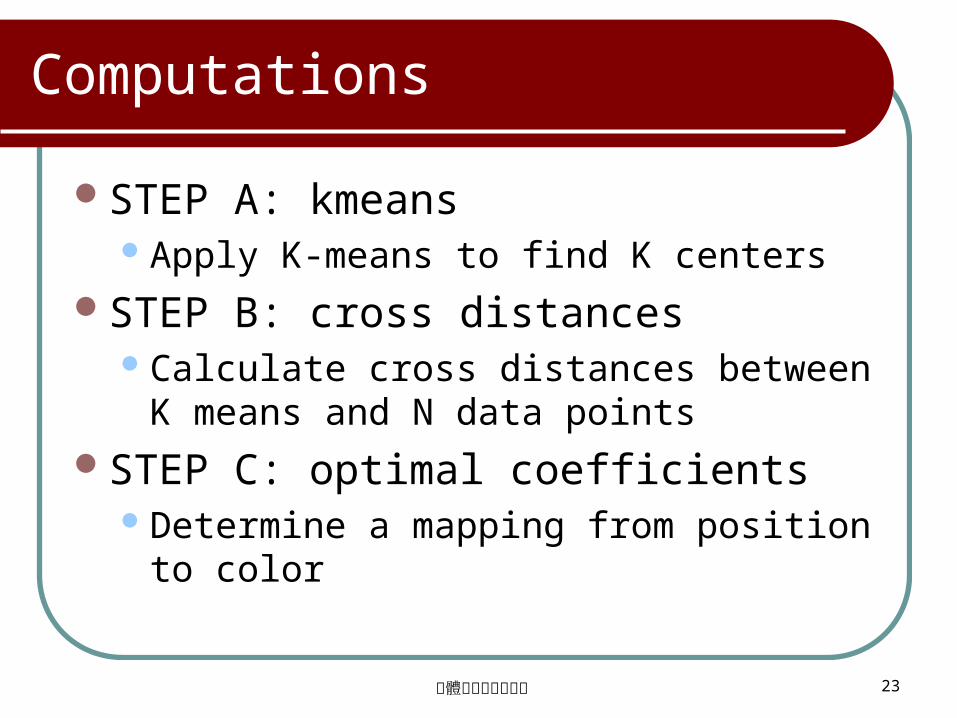
Computations
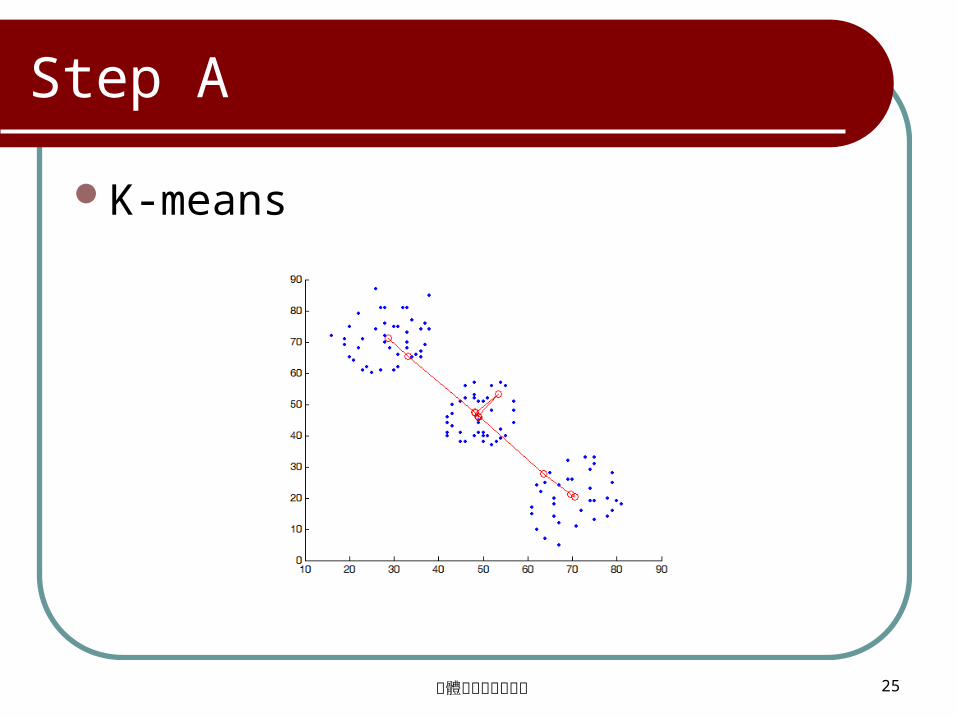
STEP A: kmeansApply K-means to find K centers
STEP B: cross distancesCalculate cross distances between K means
and N data pointsSTEP C: optimal coefficients
Determine a mapping from position to color
軟體實作與計算實驗 24
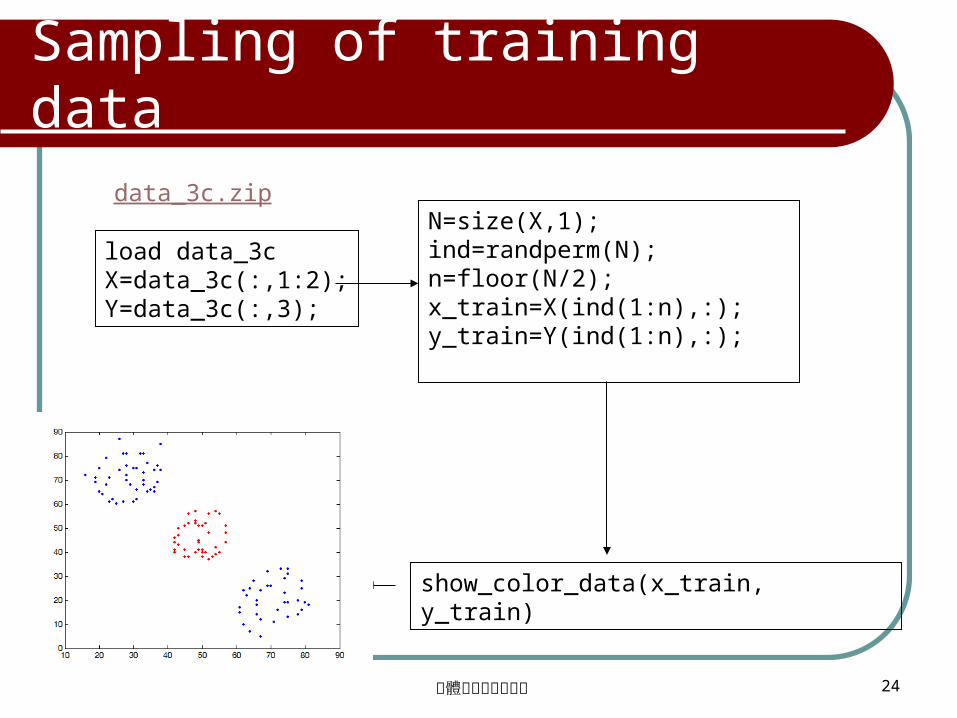
Sampling of training data
data_3c.zip
load data_3cX=data_3c(:,1:2);Y=data_3c(:,3);
N=size(X,1);ind=randperm(N);n=floor(N/2);x_train=X(ind(1:n),:);y_train=Y(ind(1:n),:);
show_color_data(x_train, y_train)
軟體實作與計算實驗 25
Step A
K-means
軟體實作與計算實驗 26
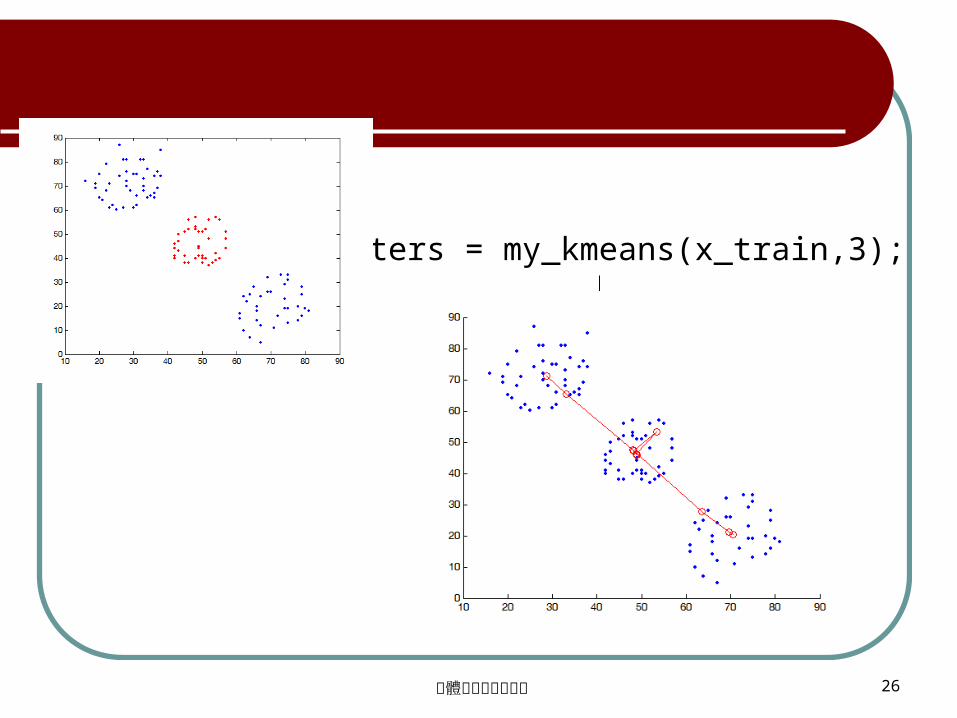
centers = my_kmeans(x_train,3);
軟體實作與計算實驗 27
Step B
Distances between centers and data points
D(i,j) stores the distance between the ith point and the jth center
D = cross_distance(x_train,centers)
cross_distance.m
軟體實作與計算實驗 28
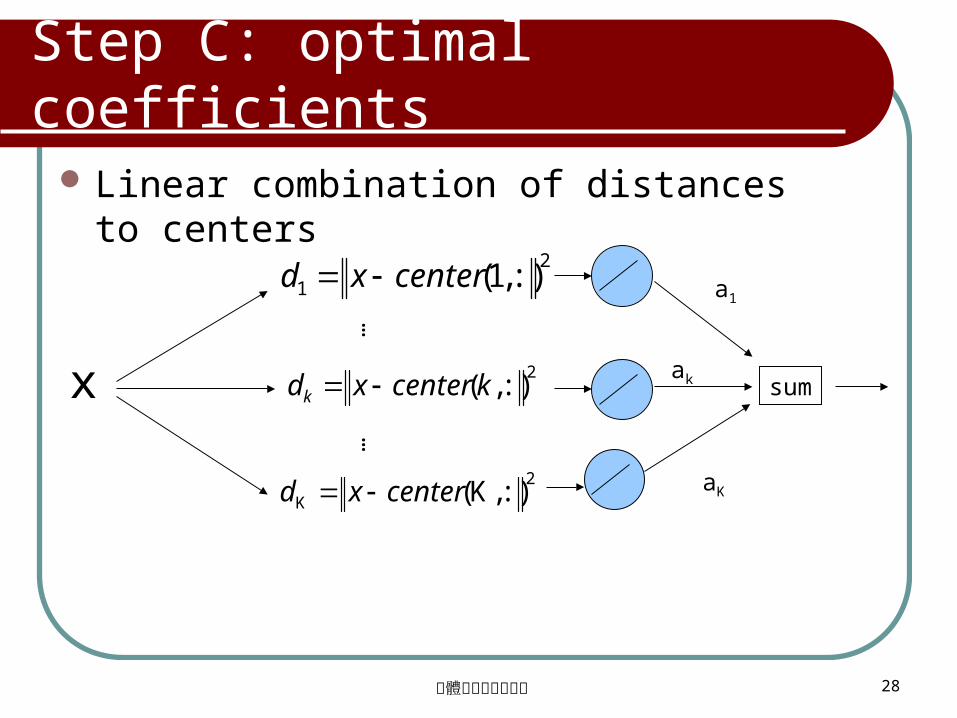
Step C: optimal coefficients
2:),(kcenterxdk
Linear combination of distances to centers
x
2
1 :),1(centerxd
2
K :),K(centerxd
……
a1
ak
aK
sum
軟體實作與計算實驗 29
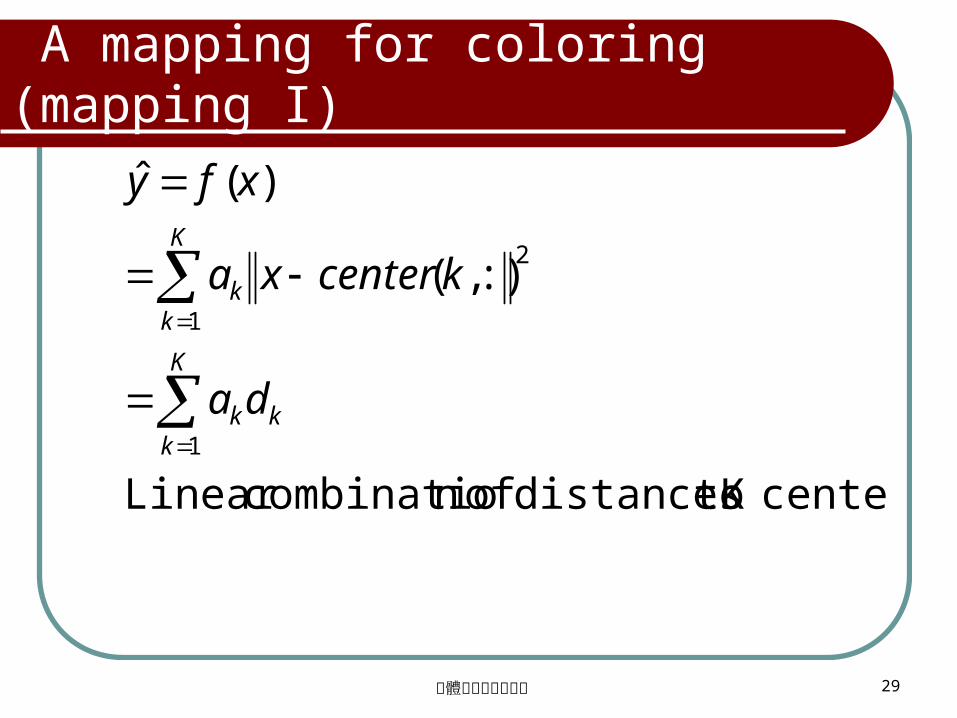
A mapping for coloring (mapping I)
centersK todistances ofn combinatioLinear
:),(
)(ˆ
1
2
1
k
K
kk
K
kk
da
kcenterxa
xfy

軟體實作與計算實驗 30
Coloring one point
ik
K
kk
K
kk
da
kcenterixa
ixfiy
ubstitute
1
2
1
:),(:),(
:)),(()(ˆ
point dataith theS
a*:),()(ˆ iDiy
軟體實作與計算實驗 31
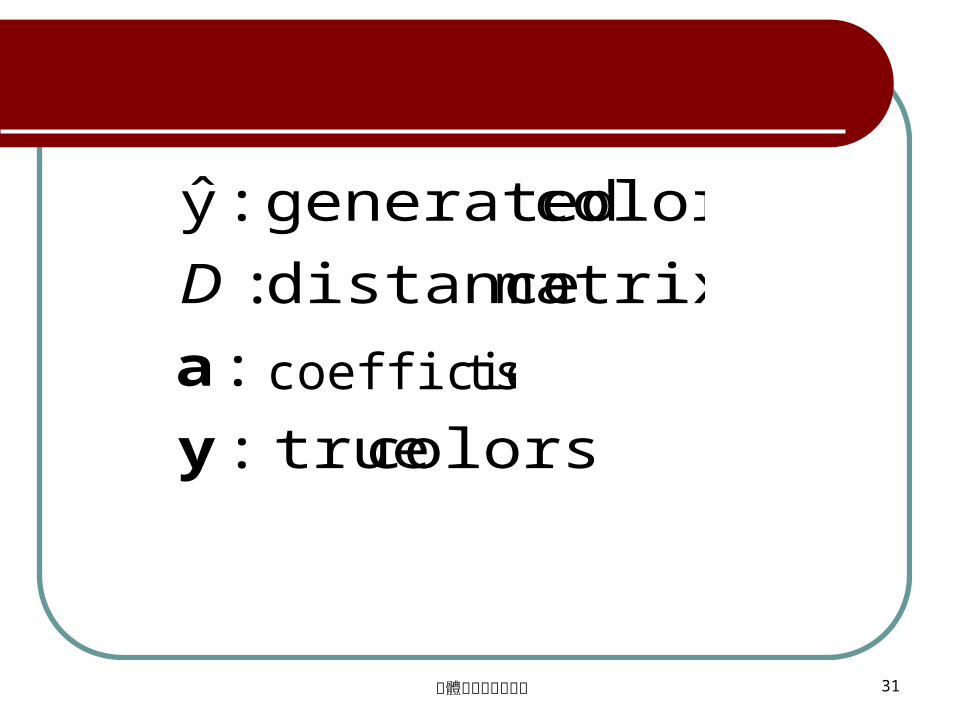
colors true:
:
matrix distance:
colors generated :y
y
a
D
tscoefficien

軟體實作與計算實驗 32
n
k
K
kik
n
k
y
y
y
a
a
a
dD
y
y
y
111
,],[,
ˆ
ˆ
ˆ
ˆ yay
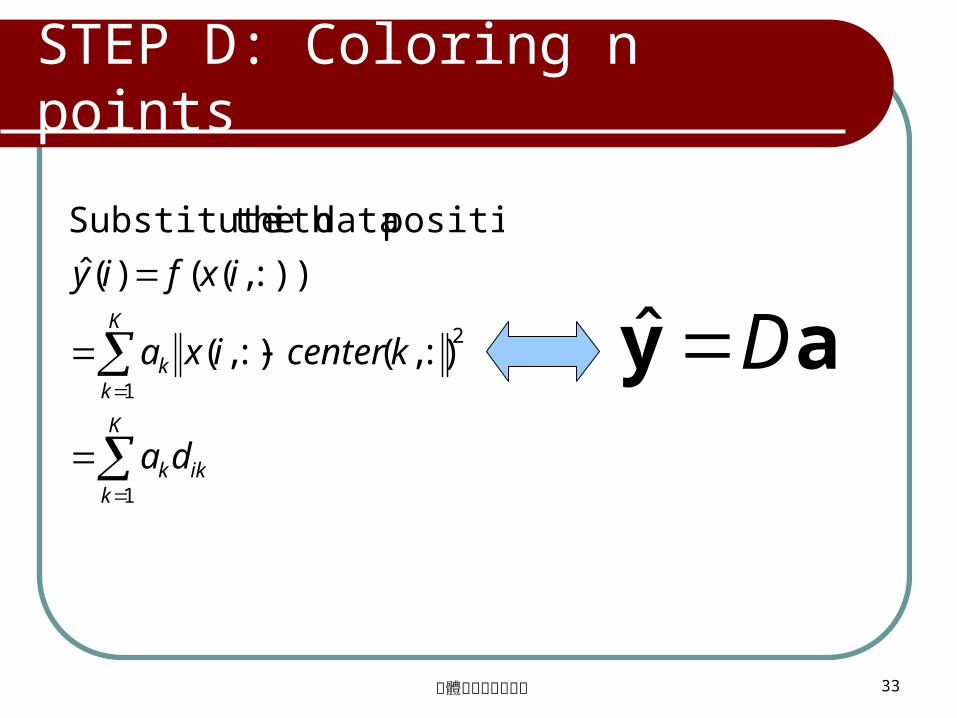
軟體實作與計算實驗 33
ik
K
kk
K
kk
da
kcenterixa
ixfiy
1
2
1
:),(:),(
:)),(()(ˆ
position dataith theSubstitute
ay Dˆ
STEP D: Coloring n points

軟體實作與計算實驗 34
yay Dˆ
ya *)(Dpinv
STEP C: Optimal coefficients
toidentical expected is ˆ yy ˆ yy
軟體實作與計算實驗 35
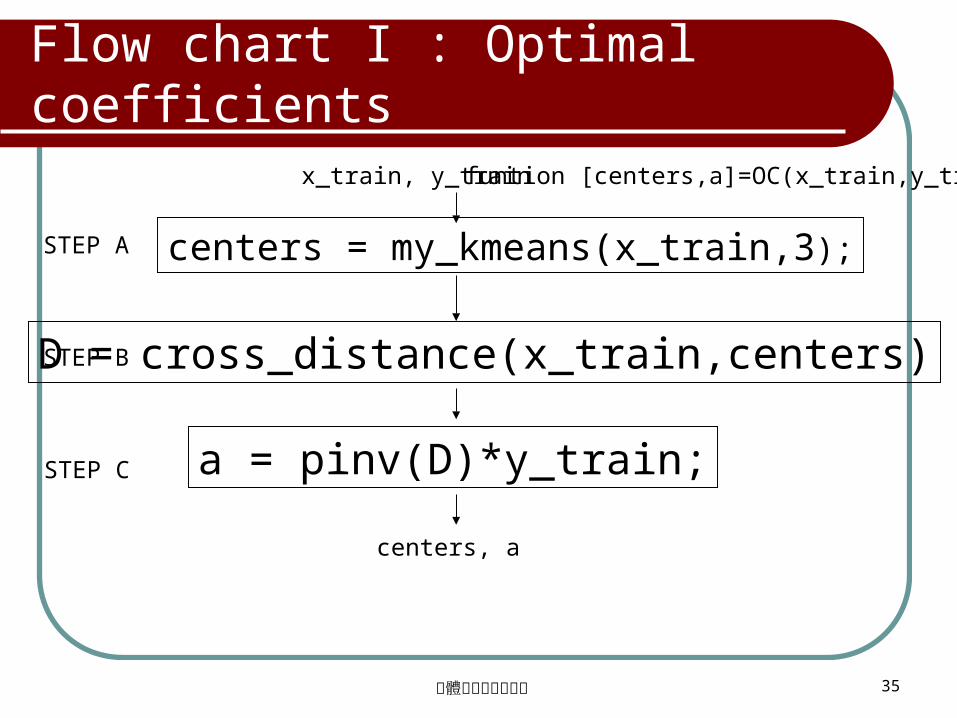
Flow chart I : Optimal coefficients
centers = my_kmeans(x_train,3);
D = cross_distance(x_train,centers)
x_train, y_train
a = pinv(D)*y_train;
centers, a
STEP A
STEP B
STEP C
funtion [centers,a]=OC(x_train,y_train)
軟體實作與計算實驗 36
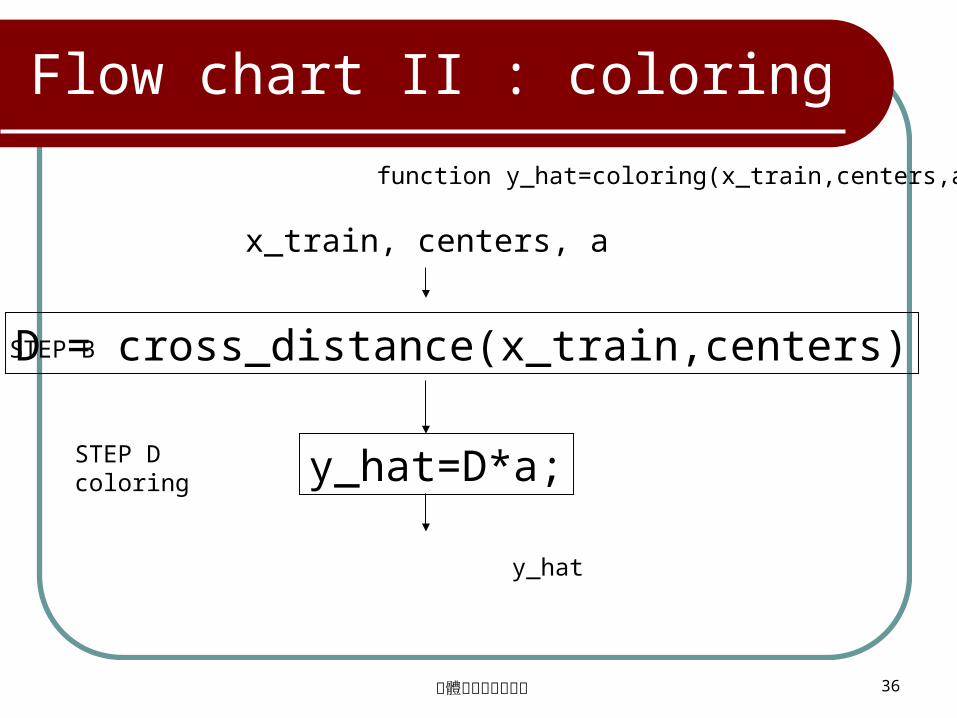
x_train, centers, a
y_hat=D*a;
Flow chart II : coloring
D = cross_distance(x_train,centers)
STEP Dcoloring
y_hat
function y_hat=coloring(x_train,centers,a)
STEP B
軟體實作與計算實驗 37
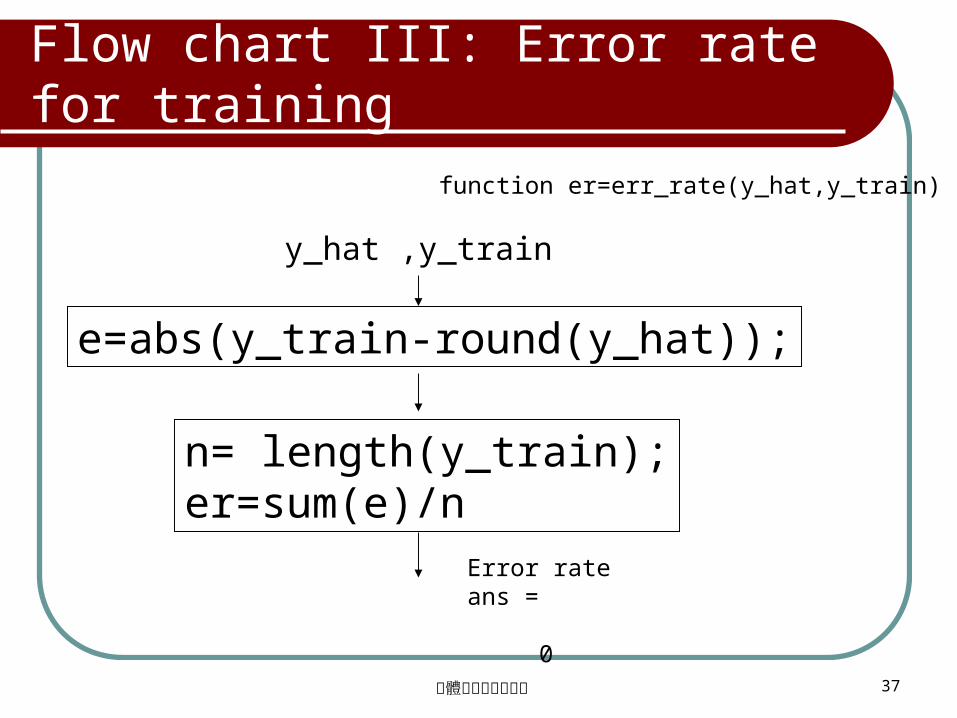
y_hat ,y_train
e=abs(y_train-round(y_hat));
n= length(y_train);er=sum(e)/n
Error rateans =
0
Flow chart III: Error rate for training
function er=err_rate(y_hat,y_train)
軟體實作與計算實驗 38
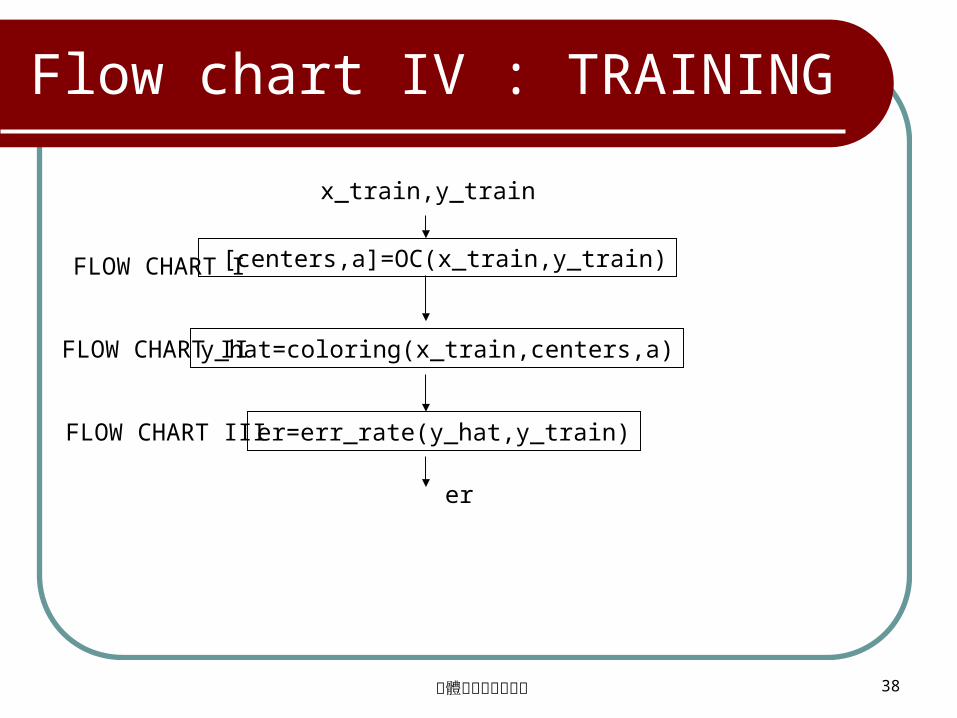
Flow chart IV : TRAINING
[centers,a]=OC(x_train,y_train)
y_hat=coloring(x_train,centers,a)
er=err_rate(y_hat,y_train)
x_train,y_train
er
FLOW CHART I
FLOW CHART II
FLOW CHART III
軟體實作與計算實驗 39
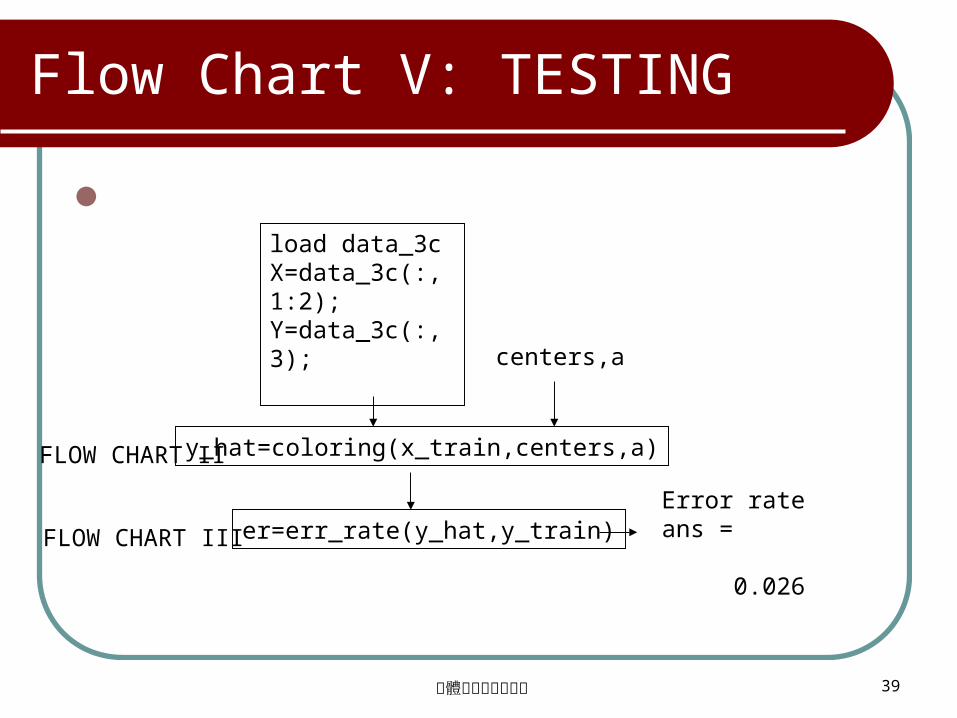
Flow Chart V: TESTING
load data_3cX=data_3c(:,1:2);Y=data_3c(:,3);
Error rateans =
0.026
y_hat=coloring(x_train,centers,a)
er=err_rate(y_hat,y_train)
centers,a
FLOW CHART II
FLOW CHART III

軟體實作與計算實驗 40
Mapping II from position to color
2:),(kcenterxdk x
2
1 :),1(centerxd
2
K :),K(centerxd
……
a1
ak
aK
sum
)exp(21
1
d
)exp(2k
kd
)exp(2k
kd
Linear combination of exponential distances to centers
軟體實作與計算實驗 41
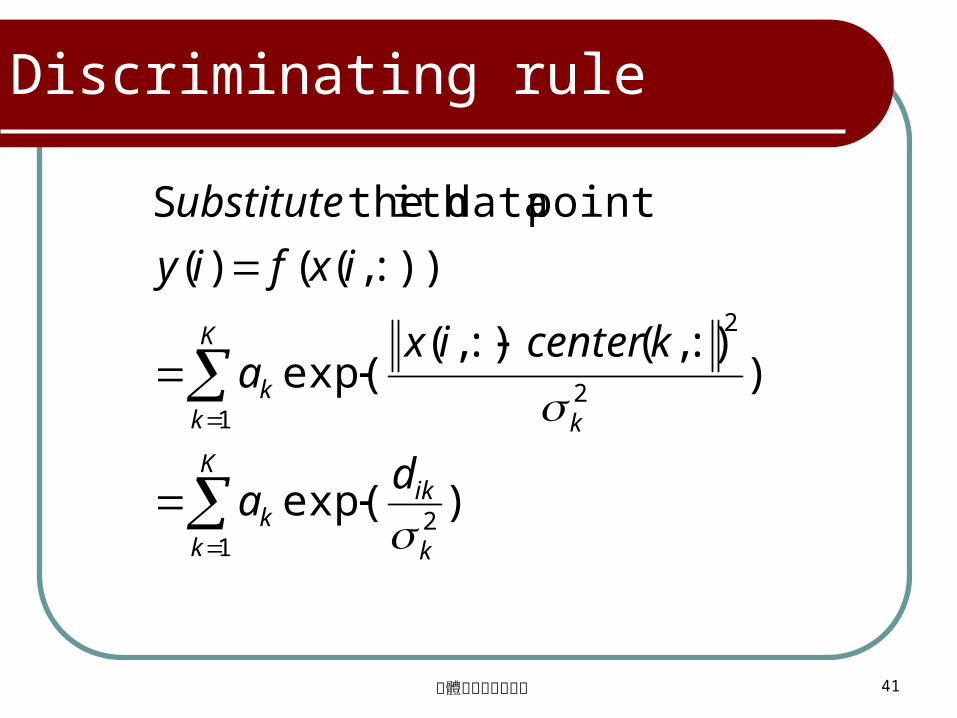
Discriminating rule
)exp(
):),(:),(
exp(
:)),(()(
point dataith theS
21
2
2
1
k
ikK
kk
k
K
kk
da
kcenterixa
ixfiy
ubstitute

軟體實作與計算實驗 42
K
k
K
kik
y
y
y
a
a
a
dD
11
,],[ ya
軟體實作與計算實驗 43
)exp(
):),(:),(
exp(
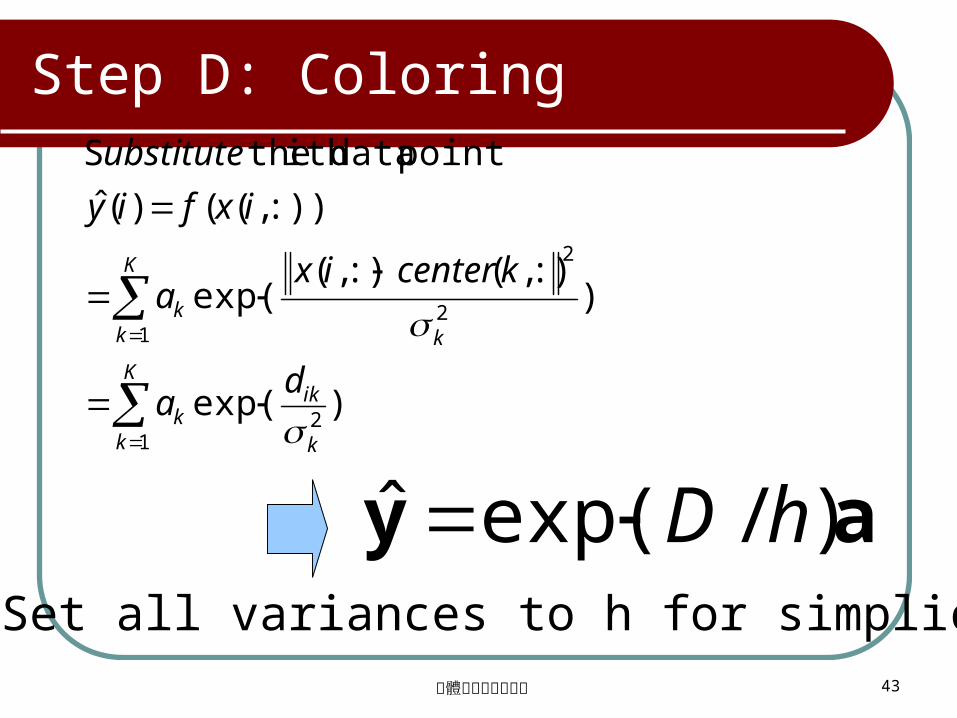
:)),(()(ˆ
point dataith theS
21
2
2
1
k
ikK
kk
k
K
kk
da
kcenterixa
ixfiy
ubstitute
ay )/exp(ˆ hDSet all variances to h for simplicity
Step D: Coloring

軟體實作與計算實驗 44
yay )/exp( ˆ hD
ya *))/(exp( hDpinv
Optimal coefficients
toidentical expected is ˆ yy
ˆ yy
軟體實作與計算實驗 45
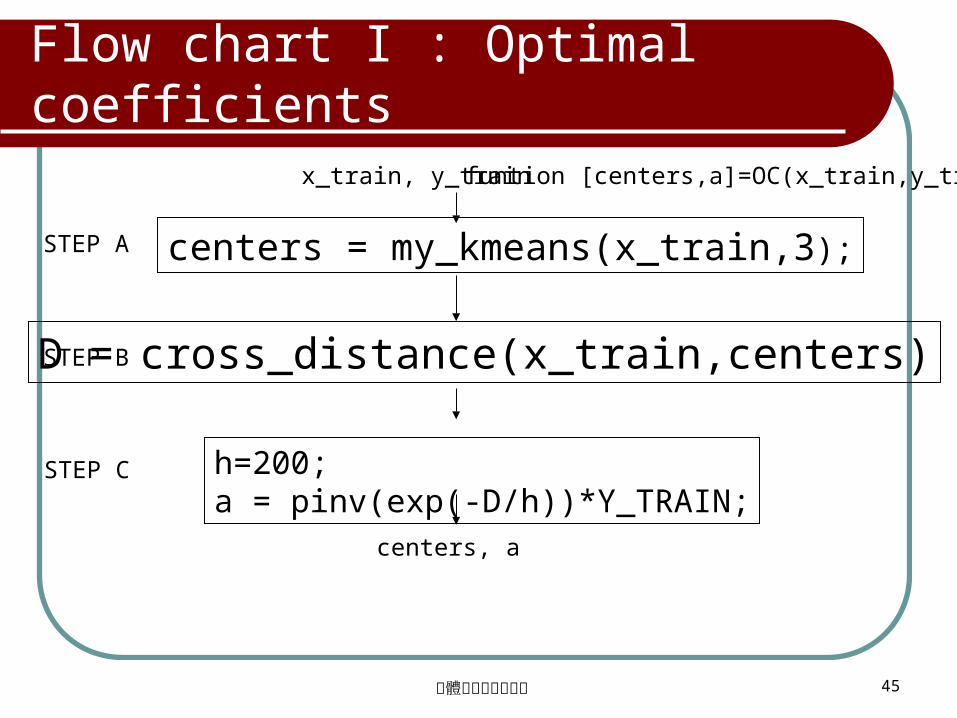
Flow chart I : Optimal coefficients
centers = my_kmeans(x_train,3);
D = cross_distance(x_train,centers)
x_train, y_train
h=200;a = pinv(exp(-D/h))*Y_TRAIN;
centers, a
STEP A
STEP B
STEP C
funtion [centers,a]=OC(x_train,y_train)
軟體實作與計算實驗 46
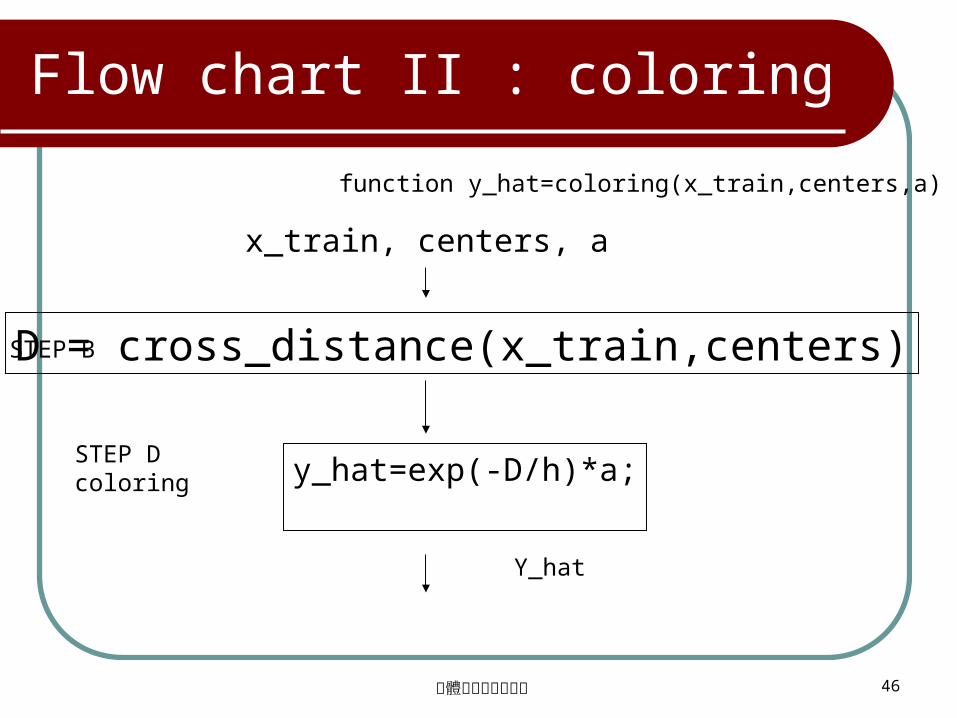
x_train, centers, a
y_hat=exp(-D/h)*a;
Flow chart II : coloring
D = cross_distance(x_train,centers)
STEP Dcoloring
Y_hat
function y_hat=coloring(x_train,centers,a)
STEP B

軟體實作與計算實驗 47
y_hat ,y_train
e=abs(y_train-round(y_hat));
n= length(y_train);er=sum(e)/n
Error rateans =
0
Flow chart III: Error rate for training
function er=err_rate(y_hat,y_train)

軟體實作與計算實驗 48
Flow chart IV: TRAINING
[centers,a]=OC(x_train,y_train)
y_hat=coloring(x_train,centers,a)
er=err_rate(y_hat,y_train)
x_train,y_train
er
FLOW CHART I
FLOW CHART II
FLOW CHART III
軟體實作與計算實驗 49
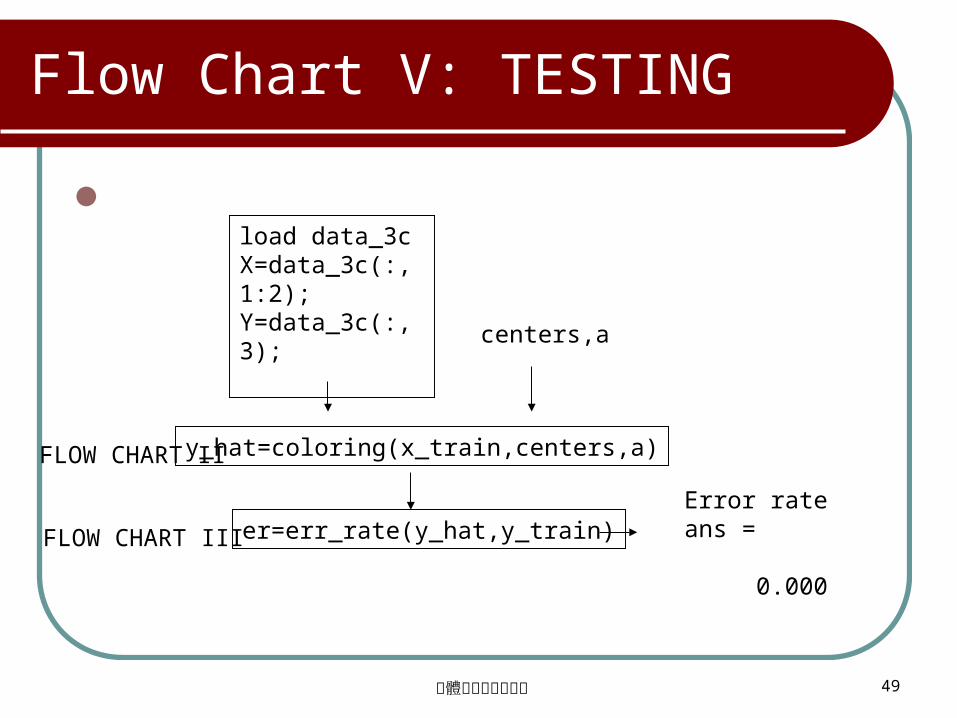
Flow Chart V: TESTING
load data_3cX=data_3c(:,1:2);Y=data_3c(:,3);
y_hat=coloring(x_train,centers,a)
er=err_rate(y_hat,y_train)Error rateans =
0.000
centers,a
FLOW CHART II
FLOW CHART III