: 1208 / : mmg - asx · banco bilbao vizcaya argentaria, s.a. investor and media enquiries sally...
TRANSCRIPT

ANNUALREPORT2015
HKEX: 1208/ASX: MMG
二零一五年年報
香港聯交所: 1208 /澳洲交易所: MMG
五礦資源二零一五年年報
MM
G Annual Report 2015
Cover_TW-EN.indd A4 V2016/4/11 17:54:11
For
per
sona
l use
onl
y

www.colliercreative.com.au #MMG0024
BOARD OF DIRECTORS
Chairman
JIAO Jian (Non-executive Director)
Executive Directors
Andrew MICHELMORE (Chief Executive Officer)
XU Jiqing (Executive General Manager – China and Strategy)
Non-executive Director
GAO Xiaoyu
Independent Non-executive Directors
Peter CASSIDY LEUNG Cheuk Yan Jennifer SEABROOK PEI Ker Wei
AUDIT COMMITTEE
Chairman
Jennifer SEABROOK
Members
GAO Xiaoyu Peter CASSIDY LEUNG Cheuk Yan PEI Ker Wei
GOVERNANCE AND NOMINATION COMMITTEE
Chairman
JIAO Jian
Members
Peter CASSIDY LEUNG Cheuk Yan
REMUNERATION COMMITTEE
Chairman
Peter CASSIDY
Members
JIAO Jian GAO Xiaoyu Jennifer SEABROOK PEI Ker Wei
RISK MANAGEMENT COMMITTEE
Chairman
JIAO Jian
Members
GAO Xiaoyu Peter CASSIDY LEUNG Cheuk Yan PEI Ker Wei
DISCLOSURE COMMITTEE
Members
Andrew MICHELMORE XU Jiqing Ross CARROLL Troy HEY Nick MYERS LEUNG Suet Kam Lucia
GENERAL COUNSEL
Nick MYERS
COMPANY SECRETARY
LEUNG Suet Kam Lucia
LEGAL ADVISER
Linklaters, Hong Kong White & Case, Hong Kong
AUDITOR
PricewaterhouseCoopers Certified Public Accountants
SHARE REGISTRARS
Hong Kong
Computershare Hong Kong Investor Services Limited
17th Floor Hopewell Centre 183 Queen’s Road East Wanchai Hong Kong
Australia
Computershare Investor Services Pty Limited
Yarra Falls 452 Johnston Street Abbotsford Victoria 3067 Australia
PRINCIPAL BANKERS
China Development Bank Corporation
Industrial and Commercial Bank of China Limited
Bank of China Limited
The Export-Import Bank of China
Bank of America Merrill Lynch Limited
Australia and New Zealand Banking Group Limited
Banco Bilbao Vizcaya Argentaria, S.A.
INVESTOR AND MEDIA ENQUIRIES
Sally COX General Manager Corporate Affairs
T +61 3 9288 0850E [email protected]
REGISTERED OFFICE
Units 8501–8503 Level 85 International Commerce Centre 1 Austin Road West Kowloon Hong Kong
CORPORATE OFFICES AND PRINCIPAL PLACE OF BUSINESS
Hong Kong
Units 8501–8503 Level 85 International Commerce Centre 1 Austin Road West Kowloon Hong Kong
T +852 2216 9688F +852 2840 0580
Australia
Level 23 28 Freshwater Place Southbank Victoria 3006 Australia
T +61 3 9288 0888F +61 3 9288 0800E [email protected]
WEBSITE
www.mmg.com
SHARE LISTING
The Stock Exchange of Hong Kong Limited Stock Code: 1208
Australian Securities Exchange Stock Code: MMG
ADDITIONAL SHAREHOLDER INFORMATION
The Chinese version of the Annual Report is prepared based on the English version. If there is any inconsistency between the English and Chinese versions of this Annual Report, the English text shall prevail to the extent of the inconsistency.
CORPORATE INFORMATION
MMG0024 AR15_PFO3.indd 3 8/04/16 4:36 PM
For
per
sona
l use
onl
y

1 AnnuAl RepoRt 2015 1 AnnuAl RepoRt 2015
ContentS
Corporate Information IFCChairman’s Review 2Chief Executive Officer’s Report 4Resources and Reserves 7Management Discussion and Analysis 21Directors and Senior Management 38Directors’ Report 42Corporate Governance Report 55Independent Auditor’s Report 65Financial Statements 67Glossary 132
MMG0024 AR15_PFO3.indd 1 8/04/16 4:37 PM
For
per
sona
l use
onl
y

2 MMG LiMited
Dear ShareholDer
2015 will be a year remembered for its challenges as global market conditions threatened our industry. However for MMG, it will also be remembered for its opportunities.
Our confidence in the long‑term fundamentals of our core commodities, copper and zinc, remains intact. We believe that increasing supply‑side constraints will converge with ongoing consumption demand. With the strategic insight and financial support of our major Shareholder, China Minmetals Corporation (CMC), we are well positioned to maximise potential investment opportunities during this industry down cycle.
Our people demonstrated their resilience and ongoing focus on safety, production volume and costs while we continued to deliver into production Las Bambas, the world’s next major copper mine.
With safety being our most important value, in 2015 we again pursued a reduction in injuries to our employees, contractors and communities. Our CEO Andrew Michelmore discusses our safety performance in the coming pages, which I encourage you to read.
Solid revenue of US$1,950.9 million was achieved primarily as a result of strong copper production. Total copper sales were 2% higher than in
2014 due to outstanding production from Kinsevere and Sepon. Earnings before interest tax, depreciation, amortisation and impairment (EBITDA) were US$420.9 million with an EBITDA margin of 22% as a result of strong cash generation from the operations.
Nevertheless, market conditions and lower realised prices for key commodities impacted our profit in 2015. This, combined with an increase to the Century mine rehabilitation provision, resulted in an underlying after‑tax loss of US$264.4 million. An additional US$784.3 million non‑cash impairment net of tax to asset values as a result of commodity price movements and revaluation of goodwill resulted in a full year loss of US$1,048.7 million (after tax).
We completed the majority of construction works at Las Bambas in late 2015 and the first copper concentrate was produced in December as part of commissioning activities. Shipments to customers commenced in January 2016. These outstanding achievements are a tribute to the operations and project teams who have worked so hard to build and commence commissioning activities at the project. It is living proof of MMG’s value ‘we do what we say’, through honouring our commitments to the market, our Shareholders and our communities.
ChAiRmAn’S Review
the current market environment will continue to pose challenges but also provide significant opportunities, and with mmG’s track record and the support of our major Shareholder, we are well placed among our competitors to emerge from this period as a globally significant base metals producer.
MMG0024 AR15_PFO3.indd 2 8/04/16 4:37 PM
For
per
sona
l use
onl
y

3 AnnuAl RepoRt 2015
As a large‑scale, low‑cost, long‑life asset with strong growth potential, Las Bambas is well positioned to significantly enhance Shareholder returns. Completion of construction and commissioning of this project will be MMG’s biggest achievement, and the project has already contributed significantly to the local communities in which it operates. None of this would have been possible without the support of our joint venture partners CITIC and CNIC.
Our forward‑looking view also supports our decision to approve the development of the Dugald River zinc deposit with an updated development plan. At a time of major zinc mine closures, including our own Century mine, Dugald River, while still subject to final financing arrangements, provides a quality exposure to zinc at a time of shrinking global supply. Once in production the project will be within the world’s top ten zinc mines.
In December 2015 MMG undertook a secondary listing on the Australian Securities Exchange (ASX). A secondary listing on the ASX allows more investors to share in the success of our Company as we continue to grow and unlock greater value from our portfolio. It also provides us with significant flexibility in managing our capital.
We remain committed to generating maximum value from our assets, including by challenging ourselves to achieve further operational efficiencies through ongoing optimisation of assets and careful capital allocation.
The current market environment will continue to pose challenges but also provide significant opportunities, and with MMG’s track record and the support of our major Shareholder, CMC, we are well placed among our competitors to emerge from this period as a globally significant base metals producer. CMC has positioned MMG to serve as its platform for international
growth and diversification in upstream base metals since its formation. While market conditions remain extremely tough and the balance sheet is highly leveraged, that support remains as strong as ever as we pursue continued sustainable growth.
Finally, I would like to thank our Shareholders, our communities and our people for their ongoing support and belief in this business throughout 2015, and for the year ahead as we continue to mine for progress.
Jiao Jian Chairman
MMG0024 AR15_PFO3.indd 3 8/04/16 4:37 PM
For
per
sona
l use
onl
y

4 MMG LiMited
Dear ShareholDer
Among continued market volatility and subdued commodity prices, MMG continued to work toward achieving its vision to build the world’s most respected diversified base metals company.
SAFETY
As our Chairman has noted, our most important value is safety. Tragically, Tshibanda Tshilomba, a contracted security guard at our Kinsevere mine, died in March 2015 as a result of a snake bite and I extend our profound sympathies to his family. Our work does not stop until all of our employees and contractors can return home to their families safely at the end of each day.
Safety is always at the forefront of my mind and that of the leadership team. In 2015 our Total Recordable Injury Frequency (TRIF) was 2.1 per million hours worked including Las Bambas operations. This was an improvement on the TRIF of 2.3 reported for MMG operations excluding Las Bambas at the end of 2014. We are working hard to ensure a committed safety mindset and to ensure that supporting behaviours, cultures and processes are in place across every site and in every area of our operations.
We believe that a workplace with zero incidents and injuries is possible and, with the commitment of management and employees, we will continue to work toward this goal in 2016.
VOLUME
In 2015 all MMG operations met or exceeded production guidance. Outstanding copper production was achieved across the Group with highlights from our copper cathode production facilities. Kinsevere set a new record of 80,169 tonnes and Sepon beat guidance with 89,253 tonnes. These results led to a 2% increase in total copper sales volumes compared to 2014.
The end of open‑pit mining at Century did not stop the team from striving to maximise the benefits from the operation, with the site also producing above guidance for both zinc and lead for the year. Our Rosebery underground polymetallic mine recorded a 10% increase in zinc production, a record, as it celebrated 80 years of continuous operations. However, due to the processing of Century’s final ore in November 2015, our Group zinc sales volumes were 12% lower than the previous year, marginally offset by zinc‑focused production at Golden Grove.
Copper concentrate production commenced at Las Bambas in the fourth quarter of 2015 with 9,121 tonnes of copper in copper concentrate produced as part of commissioning activities. This was an important milestone for commissioning work at the project, with project construction now essentially complete.
Chief exeCutive offiCeR’S RepoRt
Consistent with our long-term outlook and our belief that we mine for progress, mmG continued to contribute to the development of our local communities in 2015.
MMG0024 AR15_PFO3.indd 4 8/04/16 4:37 PM
For
per
sona
l use
onl
y

5 AnnuAl RepoRt 2015
Projected capital cost from 1 January 2015 to completion of the Las Bambas Project remains within the US$1.9–2.4 billion guidance and is expected to be at the lower end of the forecast range. Capital expenditure in 2015 was US$1,684.1 million.
MMG announced first production guidance for the project in January 2016, at 250,000–300,0001 tonnes of copper in copper concentrate in 2016.
COSTS
Continued downward pressure on commodity prices impacted our financial results. However, we continued to manage the key drivers that are in our own hands – operational productivity and cost.
Our operating expenses decreased by 12% or US$178.1 million compared to the same period in 2014, driven by a favourable Australian dollar exchange rate and continued focus on cost efficiency across all operations. We also achieved positive cash generation of US$282.4 million from operating activities in Australia, Lao People’s Democratic Republic (Lao PDR) and the Democratic Republic of the Congo (DRC) in 2015. This was a result of tight cost controls and our ongoing focus on asset utilisation and operational efficiency.
WE MINE FOR PROGRESS
Consistent with our long‑term outlook and our belief that we mine for progress, MMG continued to
contribute to the development of our local communities in 2015.
Century underwent significant change this year as it transitioned to the end of production with the last shipment of Century zinc concentrates setting sail from the Port of Karumba in December. As we shift our focus now to rehabilitation activities at the site, we are working together with the local communities to manage this transition. Century was one of the largest zinc mines in the world for much of its 16 years of operation and a significant contributor to employment and economic development in the Gulf.
In Laos, the neighbouring community of our Sepon mine, Vilabouly, was removed from the list of ‘most poor’ districts in Laos in 2015. This was largely thanks to Sepon’s investments in local infrastructure, health, education, and business development in addition to important partnerships developed with the people of Laos.
Our commitment to enhancing local capability within our workforce through training and development has also led to a Lao national workforce percentage at Sepon of 95%, of which 19% are women. Half of the site’s senior leadership team is also Lao. Embarking on the fourth year of our unique partnership with UNICEF and the Lao Ministry of Health titled the 1000 Day Project, we continued to support the Government of Lao PDR
to meet the United Nations’ Millennium Goals by improving maternal and child nutrition in several Lao provinces.
I would like to thank our major Shareholder, CMC, for their continued commitment and confidence in MMG and our long‑term strategy. I truly believe this partnership is to the benefit of all, particularly at this challenging time for the resources sector. I would also like to formally welcome our new Chief Financial Officer, Ross Carroll, who joined MMG in December 2015.
Finally, I would like to thank our employees for their support in our mission to build wealth for our people, host communities and Shareholders. I am very confident in the opportunities and Shareholder gains to come in the year ahead as we embark upon another exciting year.
andrew Michelmore Chief Executive Officer
1 Production volumes include expected pre and post‑commercial production volumes at Las Bambas. The exact split will be determined prior to Las Bambas declaring commencement of commercial operations.
MMG0024 AR15_PFO3.indd 5 8/04/16 4:37 PM
For
per
sona
l use
onl
y

6 MMG LiMited
Mr JIao Jian Chairman
Mr andrew MIChelMore Chief Executive Officer
Dr Peter CaSSIDY Independent Non‑executive Director
Mr Marcelo BaSToS Chief Operating Officer
Mr andrew MIChelMore Executive Director
Mr ross Carroll Chief Financial Officer
Mr leUNG Cheuk Yan Independent Non‑executive Director
Mr Greg TraVerS Executive General Manager – Business Support
Mr XU Jiqing Executive Director
Mr XU Jiqing Executive General Manager – China and Strategy
Ms Jennifer SeaBrooK Independent Non‑executive Director
Mr Troy heY Executive General Manager – Stakeholder Relations
Mr Gao Xiaoyu Non‑executive Director
Professor PeI Ker Wei Independent Non‑executive Director
BOARD OF DIRECTORS
EXECUTIVE COMMITTEE
MMG0024 AR15_PFO3.indd 6 8/04/16 4:37 PM
For
per
sona
l use
onl
y

7 AnnuAl RepoRt 2015
ReSouRCeS And ReSeRveSexeCutive SummARYMineral Resources and Ore Reserves for MMG have been estimated as at 30 June 2015, and are reported in accordance with the guidelines in the 2012 edition of the ‘Australasian Code for Reporting of Exploration Results, Mineral Resources and Ore Reserves’ (2012 JORC Code) and Chapter 18 of the Rules Governing the Listing of Securities of The Stock Exchange of Hong Kong Limited (Listing Rules). Mineral Resource and Ore Reserve tables are provided on the following pages, which include the 30 June 2015 and 2014 estimates for comparison. The Measured and Indicated Mineral Resources include those Mineral Resources that convert to Ore Reserves. All supporting data is provided in the Technical Appendix on the MMG website.
Mineral Resource and Ore Reserve information in this statement has been compiled by Competent Persons (as defined by the 2012 JORC Code). Each Competent Person consents to the inclusion of the information in this report that they have provided in the form and context in which it appears. Competent Persons are listed on the following pages.
MMG has established processes and structures for the governance of Mineral Resource and Ore Reserve estimation and reporting. MMG has a Mineral Resource and Ore Reserve Committee that regularly convenes for the regulation of estimation and reporting matters; it reports to the MMG Governance and Nomination Committee and the Board of Directors.
Key changes to the Mineral Resources (contained metal) since the 30 June 2014 estimate include increases in copper, gold, silver and molybdenum due to the inclusion of the Las Bambas Mineral Resources for the first time. The contained metal at Las Bambas contributes 78% of the total Group’s Mineral Resources for copper, 44% for gold, 44% for silver and 100% for molybdenum. Decreases in the Group’s Mineral Resources for lead and zinc are due to depletion at Century, Golden Grove and Rosebery, removal of mineralised remnants at Rosebery and the results of technical investigations across all sites. Sepon Copper and Gold Mineral Resources have decreased as a result of technical investigations removing lower‑grade materials and mill depletion.
The MMG Ore Reserves (contained metal) have increased since the 30 June 2014 statement for copper, gold, silver and molybdenum due to the inclusion of Las Bambas Ore Reserve. The contained metal at Las Bambas contributes 87% of the total MMG Ore Reserve for copper, 79% for gold, 60% for silver and 100% for molybdenum.
Compared to the Mineral Resources and Ore Reserves disclosed in the Competent Person’s report prepared for the Circular released by the Company on 30 June 2014 in relation to the Las Bambas acquisition, Mineral Resources (contained metal) at Las Bambas increased for copper (15%), silver (11%) and molybdenum (10%) but decreased for gold (11%).
Ore Reserves (contained metal) at Las Bambas increased for molybdenum (14%), gold (6%) and copper (5%) but decreased for silver (4%).
Tonnes of Mineral Resources and Ore Reserves at Las Bambas have also increased by 226Mt and 127Mt respectively.
Further discussion of the Mineral Resource and Ore Reserve changes is noted on the following pages.
MMG0024 AR15_PFO3.indd 7 8/04/16 4:37 PM
For
per
sona
l use
onl
y

8 MMG LiMited
RESOURCES AnD RESERVES (COnTInUED)
mineRAl ReSouRCeS2
All data reported here is on a 100% asset basis, with MMG’s attributable interest shown against each asset within brackets and in Table 1.
DEpOSIT
2015 2014
TOnnES (MT)
CU (%)
Zn (%)
pB (%)
Ag (g/T)
AU (g/T)
MO (ppM)
TOnnES (MT)
CU (%)
Zn (%)
pB (%)
Ag (g/T)
AU (g/T)
MO (ppM)
Las BamBas3 (62.5%)
Ferrobamba Oxide Copper
Indicated 21 1.9 55 0.9
Inferred 6 1.7 10 0.9
Total 27 1.8 65 0.9
Ferrobamba Primary Copper
Measured 388 0.8 3.7 0.07 204 405 0.7 3.3 0.07 200
Indicated 490 0.6 2.9 0.05 209 365 0.7 4.0 0.08 200
Inferred 452 0.6 2.2 0.03 148 310 0.5 2.1 0.07 200
Total 1,330 0.7 2.9 0.05 187 1,080 0.6 3.2 0.07 200
Ferrobamba Total 1,357 1,145
Chalcobamba Oxide Copper
Indicated 5.9 1.4 35 0.6
Inferred 0.5 1.5 1 0.3
Total 6.4 1.4 36 0.6
Chalcobamba Primary Copper
Measured 96 0.4 1.3 0.02 151 85 0.4 1.4 0.02 140
Indicated 190 0.6 2.3 0.03 138 250 0.6 2.3 0.03 130
Inferred 41 0.5 1.5 0.02 122 45 0.3 1.1 0.02 120
Total 327 0.5 1.9 0.02 140 380 0.5 2.0 0.03 131
Chalcobamba Total 334 416
Sulfobamba Oxide Copper
Inferred 0.02 2.8
Total 0.02 2.8
Sulfobamba Primary Copper
Indicated 102 0.6 4.4 0.02 164 105 0.6 4.6 0.02 200
Inferred 214 0.5 4.2 0.02 117 115 0.4 3.8 0.01 100
Total 315 0.5 4.3 0.02 132 220 0.5 4.2 0.01 148
Sulfobamba Total 315 220
Las Bambas Total 2,007 1,781
2 S.I. units used for metals of value; Zn=zinc, Cu=copper. Pb=lead, Ag=silver, Au=gold, Mo=molybdenum, Ni=nickel.
3 2014 Las Bambas Mineral Resource has been taken from the Competent Person’s report prepared for the Circular released on 30 June 2014.
MMG0024 AR15_PFO3.indd 8 8/04/16 4:37 PM
For
per
sona
l use
onl
y

9 AnnuAl RepoRt 2015
DEpOSIT
2015 2014
TOnnES (MT)
CU (%)
Zn (%)
pB (%)
Ag (g/T)
AU (g/T)
MO (ppM)
TOnnES (MT)
CU (%)
Zn (%)
pB (%)
Ag (g/T)
AU (g/T)
MO (ppM)
Kinsevere (100%)
Stockpiles
Measured 6.4 2.3 5.3 2.7
Total 6.4 2.3 5.3 2.7
Oxide Copper
Measured 3.7 4.5 7.0 3.8
Indicated 11.9 3.4 12.2 3.2
Inferred 4.2 3.3 0.5 2.9
Total 19.8 3.6 19.7 3.4
Primary Copper
Measured 1.6 3.2
Indicated 10.9 2.2
Inferred 14.6 2.4 24.6 2.5
Total 27.1 2.3 24.6 2.5
Kinsevere Total 53.3 49.6
sepon (90%)
Oxide Gold
Measured 0.8 8 2.9
Indicated 1.1 3.0 3.1 4 1.5
Inferred 0.2 2.1 1.4 3 1.2
Total 1.2 2.9 5.3 4 1.6
Partial Oxide Gold
Measured 0.9 13 3.5
Indicated 0.6 5.4 1.6 6 2.3
Inferred 0.01 4.1 1.0 5 1.2
Total 0.6 5.4 3.5 7 2.2
Primary Gold
Indicated 7.5 3.4 11.2 10 3.2
Inferred 0.3 2.5 5.7 8 3.3
Total 7.8 3.4 16.9 9 3.2
Gold Stockpiles
Measured 0.7 1.5
Total 0.7 1.5
Supergene Copper
Indicated 13.4 3.3 30.8 2.2
Inferred 1.0 2.5 11.5 1.4
Total 14.4 3.2 42.2 2.0
MMG0024 AR15_PFO3.indd 9 8/04/16 4:37 PM
For
per
sona
l use
onl
y

10 MMG LiMited
RESOURCES AnD RESERVES (COnTInUED)
DEpOSIT
2015 2014
TOnnES (MT)
CU (%)
Zn (%)
pB (%)
Ag (g/T)
AU (g/T)
MO (ppM)
TOnnES (MT)
CU (%)
Zn (%)
pB (%)
Ag (g/T)
AU (g/T)
MO (ppM)
sepon (90%) continued
Primary Copper
Indicated 7.6 1.0 7.7 0.9 6
Inferred 3.8 1.5 2.4 1.3 5
Total 11.4 1.1 10.1 1.0 6
Copper Stockpiles
Measured 5.9 2.1 8.5 1.5
Total 5.9 2.1 8.5 1.5
Sepon Total 41.4 87.3
DugaLD river (100%)
Primary Zinc
Measured 5.7 14.5 2.0 63 5.6 14.7 2.0 64
Indicated 25.9 13.3 2.2 51 25.2 13.5 2.3 52
Inferred 25.7 12.7 1.8 13 24.4 13.1 1.9 14
Total 57.3 13.2 2.0 35 55.2 13.4 2.1 36
Primary Copper
Inferred 4.4 1.8 0.2 4.4 1.8 0.2
Total 4.4 1.8 0.2 4.4 1.8 0.2
Dugald River Total 61.7 59.6
goLDen grove (100%)
Oxide Gold
Indicated 0.6 89 3.2 0.8 52 3.6
Inferred 0.04 55 2.8 0.3 25 2.1
Total 0.6 87 3.2 1.1 45 3.2
Partial Oxide Gold
Indicated 0.1 130 2.6 0.1 177 2.9
Inferred 0.01 71 2.0 0.1 74 2.1
Total 0.1 123 2.5 0.2 149 2.7
Primary Gold
Indicated 0.1 54 2.2 0.1 39 1.8
Inferred 0.01 49 2.1 0.04 28 1.5
Total 0.1 53 2.2 0.1 35 1.7
Primary Zinc
Measured 2.7 0.5 11.3 1.3 89 1.7 1.5 0.3 13.2 1.6 111 1.4
Indicated 2.0 0.3 11.0 1.5 108 1.5 1.8 0.4 14.4 1.6 103 3.1
Inferred 3.7 0.5 13.7 0.5 40 0.6 5.5 0.4 12.7 0.9 56 0.8
Total 8.4 0.5 12.3 1.0 72 1.1 8.9 0.4 13.2 1.1 75 1.4
MMG0024 AR15_PFO3.indd 10 8/04/16 4:37 PM
For
per
sona
l use
onl
y

11 AnnuAl RepoRt 2015
DEpOSIT
2015 2014
TOnnES (MT)
CU (%)
Zn (%)
pB (%)
Ag (g/T)
AU (g/T)
MO (ppM)
TOnnES (MT)
CU (%)
Zn (%)
pB (%)
Ag (g/T)
AU (g/T)
MO (ppM)
goLDen grove (100%) continued
Oxide Copper
Measured 0.2 3.3
Indicated 0.4 2.0 0.1
Inferred 0.01 1.7 0.02
Total 0.6 2.4 0.1
Partial Oxide Copper
Indicated 0.3 2.2 0.6 3.6
Inferred 0.004 2.1 0.01 3.5
Total 0.3 2.2 0.6 3.6
Primary Copper
Measured 6.2 2.9 2.6 0.3 33 1.3 6.1 2.7 0.5 0.1 19 0.5
Indicated 2.0 2.8 2.0 0.2 29 1.2 2.6 2.8 1.2 0.2 26 1.0
Inferred 8.4 3.3 0.7 0.0 26 0.2 11.5 2.9 0.4 0.0 23 0.3
Total 16.7 3.1 1.6 0.2 29 0.7 20.2 2.8 0.6 0.1 22 0.4
Golden Grove Total 26.2 31.6
roseBery (100%)
Rosebery
Measured 9.0 0.3 8.6 2.8 96 1.2 7.7 0.4 12.6 3.9 127 1.6
Indicated 6.4 0.3 7.3 2.5 103 1.1 4.3 0.3 10.0 3.5 125 1.5
Inferred 7.0 0.3 7.4 2.8 96 1.4 5.2 0.6 10.3 3.4 115 2.2
Total 22.4 0.3 7.9 2.7 98 1.2 17.2 0.4 11.3 3.6 123 1.7
South Hercules
Measured 0.1 0.1 4.6 2.5 151 3.8 0.6 0.1 4.0 2.1 164 3.1
Indicated 0.02 0.1 3.7 1.8 161 4.3 0.1 0.1 2.7 1.3 168 3.0
Total 0.2 0.1 4.5 2.4 152 3.9 0.7 0.1 3.8 2.0 165 3.1
Rosebery Total 22.6 17.9
Century (100%)
Century Pit
Indicated 0.7 9.7 1.4 36 7.9 9.3 1.7 41
Inferred 0.5 9.1 1.5 38
Total 0.7 9.7 1.4 36 8.4 9.3 1.7 41
Eastern Fault Block
Indicated 0.5 11.6 1.1 48
Total 0.5 11.6 1.1 48
Stockpiles
Measured 1.9 6.1 1.7 42 1.1 5.7 2.3 51
Total 1.9 6.1 1.7 42 1.1 5.7 2.3 51
MMG0024 AR15_PFO3.indd 11 8/04/16 4:37 PM
For
per
sona
l use
onl
y

12 MMG LiMited
RESOURCES AnD RESERVES (COnTInUED)
DEpOSIT
2015 2014
TOnnES (MT)
CU (%)
Zn (%)
pB (%)
Ag (g/T)
AU (g/T)
MO (ppM)
TOnnES (MT)
CU (%)
Zn (%)
pB (%)
Ag (g/T)
AU (g/T)
MO (ppM)
Century (100%) continued
Silver King
Inferred 2.7 6.9 12.5 121
Total 2.7 6.9 12.5 121
Century Total 2.6 12.8
HIGH LAKE (100%)
Measured
Indicated 7.9 3.0 3.5 0.3 83 1.3 7.9 3.0 3.5 0.3 83 1.3
Inferred 6.0 1.8 4.3 0.4 84 1.3 6.0 1.8 4.3 0.4 84 1.3
Total 14.0 2.5 3.8 0.4 84 1.3 14.0 2.5 3.8 0.4 84 1.3
High Lake Total 14.0 14.0
Izok Lake (100%)
Measured
Indicated 13.5 2.4 13.3 1.4 73 0.2 13.5 2.4 13.3 1.4 73 0.2
Inferred 1.2 1.5 10.5 1.3 73 0.2 1.2 1.5 10.5 1.3 73 0.2
Total 14.6 2.3 13.1 1.4 73 0.2 14.6 2.3 13.1 1.4 73 0.2
Izok Lake Total 14.6 14.6
DEpOSIT
2015 2014
TOnnES (MT)
nI (%)
TOnnES (MT)
nI (%)
aveBury (100%)
Measured 3.8 1.1 3.8 1.1
Indicated 4.9 0.9 4.9 0.9
Inferred 20.7 0.8 20.7 0.8
Total 29.3 0.86 29.3 0.86
Avebury Total 29.3 29.3
MMG0024 AR15_PFO3.indd 12 8/04/16 4:37 PM
For
per
sona
l use
onl
y

13 AnnuAl RepoRt 2015
oRe ReSeRveSAll data reported here is on a 100% asset basis, with MMG’s attributable interest shown against each asset within brackets and in Table 1.
DEpOSIT
2015 2014
TOnnES (MT)
CU (%)
Zn (%)
pB (%)
Ag (g/T)
AU (g/T)
MO (ppM)
TOnnES (MT)
CU (%)
Zn (%)
pB (%)
Ag (g/T)
AU (g/T)
MO (ppM)
Las BamBas4 (62.5%)Ferrobamba Primary Copper
Proved 424 0.7 3.4 0.08 187 386 0.7 3.4 0.07 180
Probable 360 0.6 2.8 0.06 187 271 0.8 4.5 0.09 210
Total 784 0.7 3.2 0.07 187 657 0.7 3.8 0.08 190
Chalcobamba Primary Copper
Proved 77 0.5 1.5 0.02 155 63 0.5 1.5 0.02 140
Probable 150 0.7 2.6 0.03 137 172 0.7 2.8 0.03 130
Total 227 0.6 2.2 0.03 143 235 0.7 2.4 0.03 140
Sulfobamba Primary Copper
Proved
Probable 68 0.8 5.5 0.03 176 60 0.9 6.6 0.02 140
Total 68 0.8 5.5 0.03 176 60 0.9 6.6 0.02 140
Las Bambas Total 1,079 952
Kinsevere (100%)Stockpiles
Proved 1.4 3.7 1.6 4.6
Probable 3.4 1.4 2.7 1.5
Total 4.8 2.1 4.3 2.6
Oxide Copper
Proved 2.9 4.7 5.2 4.2
Probable 6.6 3.9 6.8 3.6
Total 9.4 4.1 12.0 3.8
Kinsevere Total 14.3 16.4
sepon (90%)Supergene Copper
Probable 8.3 3.6 8.8 4.3
Total 8.3 3.6 8.8 4.3
Primary Copper
Probable 2.9 1.1
Total 2.9 1.1
Copper Stockpiles
Proved 5.7 2.1 5.1 1.8
Total 5.7 2.1 5.1 1.8
Sepon Total 16.9 14.0
4 2014 Las Bambas Ore Reserve has been taken from the Competent Person’s report prepared for the Circular released on 30 June 2014.
MMG0024 AR15_PFO3.indd 13 8/04/16 4:37 PM
For
per
sona
l use
onl
y

14 MMG LiMited
RESOURCES AnD RESERVES (COnTInUED)
oRe ReSeRveS
DEpOSIT
2015 2014
TOnnES (MT)
CU (%)
Zn (%)
pB (%)
Ag (g/T)
AU (g/T)
MO (ppM)
TOnnES (MT)
CU (%)
Zn (%)
pB (%)
Ag (g/T)
AU (g/T)
MO (ppM)
DugaLD river (100%)
Primary Zinc
Proved 0.5 15.5 1.4 38
Probable 22.1 12.3 2.0 50 21.2 12.6 2.2 49
Total 22.5 12.3 2.0 50 21.2 12.6 2.2 49
Dugald River Total 22.5 21.2 12.6 2.2 49
goLDen grove (100%)
Primary Zinc
Proved 1.1 0.5 12.0 1.6 103 3.2 0.9 0.5 12.3 1.7 138 1.7
Probable 0.9 0.3 11.1 1.9 148 1.4 1.0 0.7 12.4 1.5 81 4.0
Total 2.0 0.4 11.6 1.7 123 2.4 1.9 0.6 12.3 1.6 107 2.9
Oxide Copper
Proved 0.2 3.3
Probable
Total 0.2 3.3
Partial Oxide Copper
Proved 0.1 2.8
Probable 0.2 2.1 0.4 3.7
Total 0.3 2.3 0.4 3.7
Primary Copper
Proved 1.8 3.1 2.0 0.2 24 1.3 2.1 2.9 0.4 0.0 17 0.5
Probable 1.0 2.7 3.4 0.4 31 2.2 1.0 3.0 2.9 0.3 30 1.8
Total 2.7 2.9 2.5 0.3 27 1.6 3.1 2.9 1.2 0.1 21 1.0
Golden Grove Total 5.1 5.5
roseBery (100%)
Proved 4.8 0.2 8.2 2.6 85 1.0 3.2 0.3 10.7 3.4 111 1.4
Probable 2.6 0.2 6.0 2.4 100 1.0 2.3 0.3 8.2 3.3 121 1.3
Total 7.4 0.2 7.4 2.6 91 1.0 5.4 0.3 9.7 3.4 115 1.4
Rosebery Total 7.4 5.4
Century (100%)
Century Pit
Proved 1.9 6.1 1.7 42 0.8 6.8 2.6 69
Probable 0.7 8.7 1.1 34 7.2 8.3 1.5 37
Total 2.7 6.8 1.5 40 8.0 8.2 1.6 40
Century Total 2.7 8.0
MMG0024 AR15_PFO3.indd 14 8/04/16 4:37 PM
For
per
sona
l use
onl
y

15 AnnuAl RepoRt 2015
Competent peRSonS
DEpOSIT ACCOUnTABIlITyCOMpETEnT pERSOn
pROFESSIOnAl MEMBERShIp EMplOyER
MMG Mineral Resources and Ore Reserves Committee
Mineral Resources Jared Broome FAusIMM(CP) MMG
MMG Mineral Resources and Ore Reserves Committee
Ore Reserves Richard Butcher FAusIMM(CP) MMG
MMG Mineral Resources and Ore Reserves Committee
Metallurgy: Mineral Resources/Ore Reserves
Geoffrey Senior MAusIMM MMG
Las Bambas Mineral Resources Rex Berthelsen FAusIMM(CP) MMG
Las Bambas Ore Reserves Richard Butcher FAusIMM(CP) MMG
Sepon Mineral Resources Chevaun Gellie MAusIMM MMG
Sepon Ore Reserves Dean Basile MAusIMM(CP) Mining One Pty Ltd
Kinsevere Mineral Resources Douglas Corley MAIG R.P.Geo. MMG
Kinsevere Ore Reserves Dean Basile MAusIMM(CP) Mining One Pty Ltd
Rosebery Mineral Resources Jared Broome FAusIMM(CP) MMG
Rosebery Ore Reserves Karel Steyn MAusIMM MMG
Golden Grove (Underground & Open Pit)
Mineral Resources Paul Boamah MAusIMM MMG
Golden Grove – Underground Ore Reserves Wayne Ghavalas MAusIMM MMG
Golden Grove – Open Pit Ore Reserves Chris Lee MAusIMM MMG
Century Mineral Resources Claudio Coimbra MAusIMM MMG
Century Ore Reserves Claudio Coimbra MAusIMM MMG
Dugald River Mineral Resources Douglas Corley MAIG R.P.Geo. MMG Ltd
Dugald River Ore Reserves Karel Steyn MAusIMM MMG
High Lake, Izok Lake Mineral Resources Allan Armitage MAPEG1 (P.Geo) Formerly by MMG
Avebury Mineral Resources Peter Carolan MAusIMM Formerly by MMG
The information in this report that relates to Mineral Resources and Ore Reserves is based on information compiled by the listed Competent Persons, who are members or fellows of the Australasian Institute of Mining and Metallurgy (AusIMM), the Australian Institute of Geoscientists (AIG) or a recognised professional organisation (RPO), and have sufficient experience that is relevant to the style of mineralisation and type of deposit under consideration and to the activity which they are undertaking to qualify as Competent Persons as defined in the 2012 edition of the Australasian Code for Reporting of Exploration Results, Mineral Resources and Ore Reserves (2012 JORC Code). Each of the Competent Persons has given consent to the inclusion in the report of the matters based on their information in the form and context in which it appears.
1 Member of the Association of Professional Engineers and Geoscientists of British Columbia.
MMG0024 AR15_PFO3.indd 15 8/04/16 4:37 PM
For
per
sona
l use
onl
y

16 MMG LiMited
RESOURCES AnD RESERVES (COnTInUED)
SummARY of SiGnifiCAnt ChAnGeSMINeral reSoUrCeS
The MMG 30 June 2015 Mineral Resources have changed since the 30 June 2014 estimate for a number of reasons with the most significant changes outlined in this section.
The Group’s Mineral Resources (contained metal) have increased for copper (304%), silver (65%) and gold (29%), and molybdenum is being reported first time as a direct result of the inclusion of Las Bambas. Contained metal has decreased for lead (18%) and zinc (7%) due to mill depletion and changes due to technical investigations. Nickel remains unchanged.
Assuming Las Bambas was included in the Group’s Mineral Resources in 20145, the Group’s Mineral Resources (contained metal) has increased for molybdenum (10%), copper (8%); decreased for gold (21%), lead (18%) and zinc (7%) and remains unchanged for silver and nickel.
However, on an individual site‑by‑site basis there are both increases and decreases to the Mineral Resources (contained metal) the significant changes are discussed below.
INCREASES:
Increases to the Mineral Resources (contained metal) for copper, silver and molybdenum at Las Bambas are related to positive drilling results and re‑estimation as a result of changes to modelling techniques.
REDUCTIONS:
Technical investigations and studies have resulted in significant reductions in Mineral Resources for:
› Sepon (copper and gold) through the removal of lower‑grade materials.
Milling depletion at all MMG Operations has reduced Mineral Resources, with the largest impacts on:
› Century (zinc, lead and silver) as a result of mine closure (where all in‑situ Mineral Resources not within the 2015 mine schedule have been removed) and mining depletion;
› Sepon (copper); and
› Rosebery (zinc and copper) as a result of mill depletion and removal of mineralised remnants.
No changes have been made to the Mineral Resources at High Lake, Izok Lake and Avebury.
ore reSerVeS
The MMG 30 June 2015 Ore Reserves increased for contained metal compared to the 2014 Ore Reserves for copper (596%), gold (443%) and silver (149%) and decreased for lead (12%) and zinc (8%). The most significant change is due to the inclusion of the Las Bambas Ore Reserves for the first time.
Assuming Las Bambas was included in the Group’s Mineral Resources in 20146, the Group’s Ore Reserves (contained metal) increased for molybdenum (14%), gold (7%) and copper (2%); and decreased for lead (12%), zinc (8%) and silver (3%), compared to the 2014 Ore Reserves for the Group inclusive of Las Bambas.
Ore Reserves (contained metal) at Las Bambas increased for molybdenum (14%), gold (6%) and copper (5%) but decreased for silver (4%) compared to the Ore Reserves disclosed in the Competent Person’s report prepared for the Circular released by the Company on 30 June 2014 in relation to Las Bambas acquisition. Ore Reserve tonnes at Las Bambas increased by 127Mt.
At all other sites Ore Reserve tonnage increases almost offset mill depletion.
The Ore Reserve (contained metal) increases are due to:
› increases in Mineral Resources at:
– Las Bambas
– Golden Grove – zinc;
› inclusion of new mineralisation zones into the Ore Reserves:
– Sepon – inclusion of primary copper
– Rosebery – inclusion of X lens; and
› technical investigations:
– Las Bambas – Tailings Storage Facility (TSF) Prefeasibility study and metallurgical test work on the Sulfobamba mineralisation.
Contained metal decreases are primarily attributed to milling depletion:
› Century – accounts for the largest reduction, due to the completion of mining with only stockpiles remaining. Ore Reserves will be reconciled after the completion of processing.
› Golden Grove – copper; and
› Kinsevere.
5 For the purpose of comparison, the Mineral Resources used for Las Bambas are those disclosed in the Competent Person’s report prepared for the Circular released by the Company on 30 June 2014 in relation to the Las Bambas acquisition.
6 For the purpose of comparison, the Ore Reserves used for Las Bambas are those disclosed in the Competent Person’s report prepared for the Circular released by the Company on 30 June 2014 in relation to the Las Bambas acquisition.
MMG0024 AR15_PFO3.indd 16 8/04/16 4:37 PM
For
per
sona
l use
onl
y

17 AnnuAl RepoRt 2015
KeY ASSumptionSaTTrIBUTaBle INTereST
The following table details the attributable interest MMG has in all Mineral Resources and Ore Reserves stated in this report.
Table 1: MMG’s attributable interest for all projects
DEpOSITATTRIBUTABlE
InTEREST
Las Bambas 62.5%
Kinsevere 100%
Sepon 90%
Dugald River 100%
Golden Grove 100%
Rosebery 100%
Century 100%
High Lake 100%
Izok Lake 100%
Avebury 100%
PrICeS aND eXChaNGe raTeS
The following price and foreign exchange assumptions, set according to the relevant MMG Standard as at January 2015, have been applied to all Mineral Resource and Ore Reserve estimates.
Table 2: Price (real) and foreign exchange assumptions
ORE RESERVE MInERAl RESOURCE
Cu (US$/lb) 2.95 3.50
Zn (US$/lb) 1.20 (1.18 if < 3 yrs) 1.45
Pb (US$/lb) 1.12 1.35
Au US$/oz 1010 1212
Ag US$/oz 21.10 25.50
Mo (US$/lb) 11.1 15.0
AUD:USD 0.82 (0.85 if < 3 yrs)As per Ore Reserves
CAD:USD 1.09
MMG0024 AR15_PFO3.indd 17 8/04/16 4:37 PM
For
per
sona
l use
onl
y

18 MMG LiMited
RESOURCES AnD RESERVES (COnTInUED)
CUT-off GraDeS
Mineral Resource and Ore Reserve cut‑off values are shown in Table 3 and Table 4 respectively.
Table 3: Mineral resources cut-off grades
SITE MInERAlISATIOn
lIkEly MInIng
METhODa CUT-OFF VAlUE COMMEnTS
Las Bambas Oxide Copper OP 1% Cu In-situ Copper Mineral Resources constrained within US$3.5/lb Cu pit shell.
Primary Copper OP 0.2% Cu
Sepon Oxide Gold & Stockpiles OP 1.2–1.3 g/t Au In-situ Gold Mineral Resources constrained within US$1212/oz Au pit shell. Cut‑off values are dependent on processing costs, haul distance and recovery. No UG gold Mineral Resources have been considered.
Partial Oxide OP 3.3–4.5 g/t Au
Primary Gold OP 1.7–2.3 g/t Au
Supergene Copper – Carbonate OP 1.2% Cu In-situ Copper Mineral Resources constrained within US$3.5/lb Cu pit shell.
Supergene Copper – Chalcocite OP 1.1% Cu
Primary Copper OP 0.5% Cu
Kinsevere Oxide Copper & Stockpiles OP 0.6% ASCub In-situ Copper Mineral Resources constrained within a US$3.5/lb Cu pit shell.
Primary Copper OP 0.8% TCuc
Rosebery Rosebery (Zn, Cu, Pb, Au, Ag) UG A$179/t NSRARd
South Hercules (Zn, Cu, Pb, Au, Ag)
UG A$179/t NSRARd
Golden Grove Primary Zinc & Primary Copper (Zn, Cu, Pb, Au, Ag)
UG A$145/t NSRARd
Oxide & Partial Oxide & Stockpiles – Gossan Hill
OP 1.0% Cu In-situ Mineral Resources constrained within the current mine design based on US$3.33/lb pit shell above the 10255mRL.
Oxide, Partial Oxide & Primary Gold – Gossan Hill
OP 1.1 g/t Au Above 10240m RL reported.
Primary Copper – Gossan Hill OP 1.0% Cu In-situ Mineral Resources constrained within the current mine design based on US$3.33/lb pit shell above the 10255mRL.
Primary Zinc – Gossan Hill OP 3% Zn Above 10240m RL reported.
Century Century Pit, Eastern Fault Block & Stockpiles (Zn, Pb, Ag)
OP 3.5% ZnEqe ZnEqe = Zn + 1.19*Pb based on price and metallurgical recovery constrained within the Century final pit shell.
Dugald River Primary Zinc (Zn, Pb, Ag) UG A$134/t NSRARd
Primary Copper UG 1% Cu
Avebury Ni UG 0.4% Ni
MMG0024 AR15_PFO3.indd 18 8/04/16 4:37 PM
For
per
sona
l use
onl
y

19 AnnuAl RepoRt 2015
SITE MInERAlISATIOn
lIkEly MInIng
METhODa CUT-OFF VAlUE COMMEnTS
High Lake Cu, Zn, Pb, Ag, Au OP 2.0% CuEqf CuEqf = Cu + (Zn×0.30) + (Pb×0.33) + (Au×0.56) + (Ag×0.01): based on long‑term prices and metal recoveries at Au:75%, Ag:83%, Cu:89%, Pb:81% and Zn:93%
UG 4.0% CuEqf
Izok Lake Cu, Zn, Pb, Ag, Au
OP 4.0% ZnEqe
ZnEq = Zn + (Cu×3.31) + (Pb×1.09) + (Au×1.87) + (Ag×0.033); prices and metal recoveries as per High Lake.
a: OP = Open Pit, UG = Underground, ASCub = Acid Soluble Copper, TCuc = Total Copper, NSRARd = Net Smelter Return After Royalty, ZnEqe = Zinc Equivalent, CuEqf = Copper Equivalent, RL = Relative Level
Table 4: ore reserves cut-off grades
SITE MInERAlISATIOnMInIng
METhOD CUT–OFF VAlUE COMMEnTS
Las Bambas Primary Copper Ferrobamba OP 0.16–0.20%Cu Range based on rock type recovery.
Primary Copper Chalcobamba 0.18–0.24%Cu
Primary Copper Sulfobamba 0.22–0.43% Cu
Sepon Copper – LACa sulphide material Copper – HACb sulphide material Copper – LACa carbonate material Copper – HACb carbonate material Primary
OP 1.1% to 1.5% Cu 1.2% to 5.3%Cu 1.4% to 1.5%Cu 1.4% to 5.3% Cu 0.5% Cu
For non‑primary materials, cut‑off values are dependent upon pit haul distance to crusher and its estimated GACc value.
Kinsevere Copper Oxide OP 0.8% to 1.2% ASCud
Cut‑off grade is 1.2% AsCu under current operating conditions and 0.8% at the cessation of mining activities.
Rosebery (Zn, Cu, Pb, Au, Ag) UG A$179/t NSRARe
Stopes with access already available applied a A$165/t cut‑off grade.
Golden Grove Gossan Hill – Primary Zinc and Primary Copper (Zn, Cu, Pb, Au, Ag)
UG A$145/t NSRARe
Scuddles – Primary Zinc and Primary Copper (Zn, Cu, Pb, Au, Ag)
UG A$140/t
Oxide Copper OP 1.76% Cu
Century Zinc OP 4.2% ZnEqf ZnEqf = Zn + (1.19*Pb).
Dugald River Primary Zinc UG A$134/t
LACa = Low Acid Consuming; HACb = High Acid Consuming, GACc = Gangue Acid Consuming, ASCud = Acid Soluble Copper, NSRARe = Net Smelter Return After Royalty7, ZnEqf = Zinc Equivalent
7 Net Smelter Return is a measure of in‑ground value of a metal grade or set of metal grades after all the realisation costs down‑stream of the mill have been accounted for and effectively represents the dollar value at the mine gate of the in‑ground minerals. NSRAR (NSR after Royalties) is similar to NSR but includes the cost effects of Royalties payable. See the following paper for a detailed explanation: Goldie, R. and Tredger, P., 1991. Net Smelter Return Models and Their Use in the Exploration, Evaluation and Exploitation of Polymetallic Deposits, Geoscience Canada, Vol 18, No. 4, pp 159–171
MMG0024 AR15_PFO3.indd 19 8/04/16 4:37 PM
For
per
sona
l use
onl
y

20 MMG LiMited
RESOURCES AnD RESERVES (COnTInUED)
ProCeSSING reCoVerIeS
Output average processing recoveries are shown in Table 5. More detailed processing recovery relationships are provided in the Technical Appendix.
Table 5: Processing recoveries
SITE pRODUCT
RECOVERy COnCEnTRATE MOISTURE
ASSUMpTIOnSCOppER ZInC lEAD SIlVER gOlD MO
Las Bambas Copper Concentrate
82% – – 64% 60% 10%
Molybdenum Concentrate
55% 5%
Century Zinc Concentrate − 79% − 56% − –
Lead Concentrate − − 68% 10% − –
Golden Grove – Underground
Zinc Concentrate 90% − – − 9.5%
Lead Concentrate − − 71% 59% 56% 9.5%
Copper Concentrate
90% − − 59% 50% 9.5%
Golden Grove – Open Cut
Oxide Copper Concentrate
55% − − − − 16%
Transition Copper Concentrate
55% − − 51% 64% 16%
Rosebery Zinc Concentrate – 87% – – – 8%
Lead Concentrate – 6% 76% 40% 16% 6%
Copper Concentrate
64% – – 42% 36% 7%
Gold Doré 0.1% 22%
Dugald River Zinc Concentrate − 87% 30% − 10%
Lead Concentrate − 64% 22% − 12%
Sepon Copper Cathode 86% − − − − −
Kinsevere Copper Cathode 85%
(96% ASCu)
− − − − −
a: Silver for Rosebery Gold Doré is calculated as a constituent ratio to gold in the Doré. Silver is set to 0.17 against gold being 20.7.
The Technical Appendix published on the MMG website contains additional Mineral Resource and Ore Reserve information (including the Table 1 disclosure).
MMG0024 AR15_PFO3.indd 20 8/04/16 4:37 PM
For
per
sona
l use
onl
y
21 AnnuAl RepoRt 2015
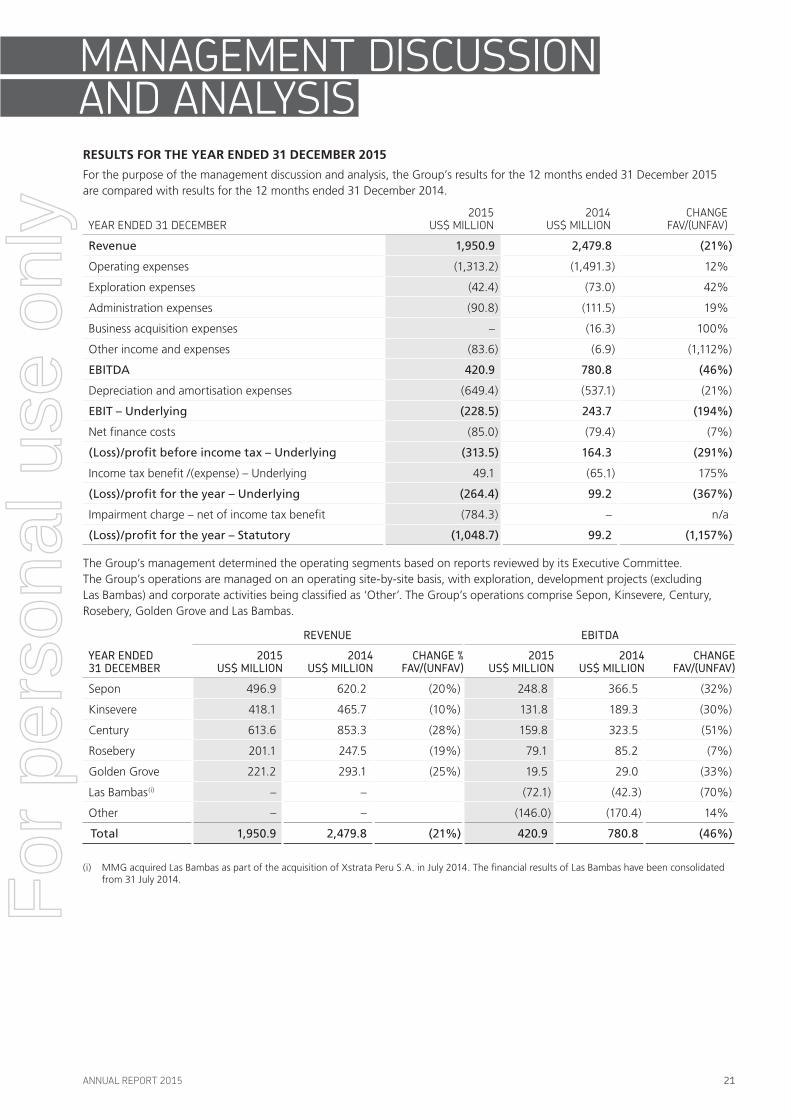
mAnAGement diSCuSSion And AnAlYSiSreSUlTS for The Year eNDeD 31 DeCeMBer 2015
For the purpose of the management discussion and analysis, the Group’s results for the 12 months ended 31 December 2015 are compared with results for the 12 months ended 31 December 2014.
YeAR ended 31 deCembeR2015
uS$ million2014
uS$ millionChAnGe
fAv/(unfAv)
Revenue 1,950.9 2,479.8 (21%)
Operating expenses (1,313.2) (1,491.3) 12%
Exploration expenses (42.4) (73.0) 42%
Administration expenses (90.8) (111.5) 19%
Business acquisition expenses – (16.3) 100%
Other income and expenses (83.6) (6.9) (1,112%)
EBITDA 420.9 780.8 (46%)
Depreciation and amortisation expenses (649.4) (537.1) (21%)
EBIT – Underlying (228.5) 243.7 (194%)
Net finance costs (85.0) (79.4) (7%)
(Loss)/profit before income tax – Underlying (313.5) 164.3 (291%)
Income tax benefit /(expense) – Underlying 49.1 (65.1) 175%
(Loss)/profit for the year – Underlying (264.4) 99.2 (367%)
Impairment charge – net of income tax benefit (784.3) – n/a
(Loss)/profit for the year – Statutory (1,048.7) 99.2 (1,157%)
The Group’s management determined the operating segments based on reports reviewed by its Executive Committee. The Group’s operations are managed on an operating site‑by‑site basis, with exploration, development projects (excluding Las Bambas) and corporate activities being classified as ‘Other’. The Group’s operations comprise Sepon, Kinsevere, Century, Rosebery, Golden Grove and Las Bambas.
yEAR EnDED 31 DECEMBER
REVEnUE EBITDA
2015 US$ MIllIOn
2014 US$ MIllIOn
ChAngE % FAV/(UnFAV)
2015 US$ MIllIOn
2014 US$ MIllIOn
ChAngE FAV/(UnFAV)
Sepon 496.9 620.2 (20%) 248.8 366.5 (32%)
Kinsevere 418.1 465.7 (10%) 131.8 189.3 (30%)
Century 613.6 853.3 (28%) 159.8 323.5 (51%)
Rosebery 201.1 247.5 (19%) 79.1 85.2 (7%)
Golden Grove 221.2 293.1 (25%) 19.5 29.0 (33%)
Las Bambas(i) – – (72.1) (42.3) (70%)
Other – – (146.0) (170.4) 14%
Total 1,950.9 2,479.8 (21%) 420.9 780.8 (46%)
(i) MMG acquired Las Bambas as part of the acquisition of Xstrata Peru S.A. in July 2014. The financial results of Las Bambas have been consolidated from 31 July 2014.
MMG0024 AR15_PFO3.indd 21 8/04/16 4:37 PM
For
per
sona
l use
onl
y

22 MMG LiMited
MAnAgEMEnT DISCUSSIOn AnD AnAlySIS (COnTInUED)
The following discussion and analysis of the financial information and results should be read in conjunction with the financial information.
REVENUE
The Group’s operations revenue decreased by US$528.9 million to US$1,950.9 million due to lower realised prices for all commodities (US$506.4 million) and lower zinc sales volumes (US$109.8 million). These were partially offset by favourable sales volumes of copper (US$35.2 million), lead (US$30.4 million), gold (US$0.4 million) and silver (US$21.3 million).
REVEnUE By COMMODITy yEAR EnDED 31 DECEMBER
2015 US$ MIllIOn
2014 US$ MIllIOn
ChAngE FAV/(UnFAV)
Copper 1,031.0 1,280.7 (20%)
Zinc 618.3 884.7 (30%)
Lead 144.3 142.9 1%
Gold 64.1 73.2 (12%)
Silver 93.2 98.3 (5%)
Total 1,950.9 2,479.8 (21%)
PRICE
Lower average LME prices across all MMG commodities in 2015 compared with 2014 had an unfavourable impact on revenue. Copper average realised price was favourably impacted by a steady decline in copper concentrate treatment charges and refinement charges (TC/RCs) during 2015, while higher TC/RCs for zinc unfavourably impacted the average realised price for the same period.
AVERAgE lME CASh pRICE yEAR EnDED 31 DECEMBER 2015 2014
ChAngE FAV/(UnFAV)
Copper (US$/tonne) 5,495 6,862 (20%)
Zinc (US$/tonne) 1,928 2,164 (11%)
Lead (US$/tonne) 1,784 2,096 (15%)
Gold (US$/ounce) 1,160 1,266 (8%)
Silver (US$/ounce) 15.68 19.08 (18%)
SALES VOLUMES
pAyABlE METAl In pRODUCT SOlD yEAR EnDED 31 DECEMBER 2015 2014
ChAngE FAV/(UnFAV)
Copper (tonnes) 197,338 192,909 2%
Zinc (tonnes) 459,715 524,828 (12%)
Lead (tonnes) 105,710 86,951 22%
Gold (ounces) 61,405 61,028 1%
Silver (ounces) 6,005,765 5,138,014 17%
MMG0024 AR15_PFO3.indd 22 8/04/16 4:37 PM
For
per
sona
l use
onl
y

23 AnnuAl RepoRt 2015
pAyABlE METAl In pRODUCT SOlD yEAR EnDED 31 DECEMBER 2015
COppER TOnnES
ZInC TOnnES
lEAD TOnnES
gOlD OUnCES
SIlVER OUnCES
Sepon 88,752 – – – –
Kinsevere 80,236 – – – –
Century – 343,109 81,014 – 2,603,507
Rosebery 2,749 74,083 19,354 34,302 1,867,721
Golden Grove 25,601 42,523 5,342 27,103 1,534,537
Total 197,338 459,715 105,710 61,405 6,005,765
pAyABlE METAl In pRODUCT SOlD yEAR EnDED 31 DECEMBER 2014
COppER TOnnES
ZInC TOnnES
lEAD TOnnES
gOlD OUnCES
SIlVER OUnCES
Sepon 88,377 – – 524 718
Kinsevere 69,552 – – – –
Century – 419,484 60,786 – 1,626,930
Rosebery 2,351 73,051 22,894 35,572 2,446,196
Golden Grove 32,629 32,293 3,271 24,932 1,064,170
Total 192,909 524,828 86,951 61,028 5,138,014
Record copper sales volumes up 2% compared to 2014 was the result of record production at Kinsevere and stable production at Sepon despite challenging Type II ore that is harder and consumes more acid.
Zinc sales volumes were 12% lower than the previous year due to final processing of Century‑sourced ore in November 2015, marginally offset by Golden Grove’s mine plan favouring zinc production in the fourth quarter.
Lead sales volumes increased by 22% when compared with 2014 due to increased mill throughput.
Operating expenses include expenses of operating sites, excluding depreciation and amortisation. Site expenses include mining and processing expenses, changes in inventories, royalty expenses, selling expenses, corporate recharge expenses and other operating expenses. Operating expenses decreased by US$178.1 million (12%), driven by a favourable Australian dollar exchange rate and a continued focus on strategic cost reduction across all operating sites. Lower freight and royalties costs also contributed to favourable operating expenses. The weaker Australian dollar is estimated to have resulted in a US$114.3 million favourable impact on total operating expenses (AUD:USD average rate of 0.7522 in 2015 versus 0.9022 in 2014).
Exploration expenses decreased by US$30.6 million (42%) to US$42.4 million when compared to 2014. This is consistent with the Company’s plans to reduce discretionary spending in a lower commodity price environment. Exploration focused on mine district exploration in 2015 at Las Bambas, Kinsevere and Sepon.
Project generation spend was down US$2.7 million (69%), particularly in copper (down US$0.9 million) and nickel (down US$0.9 million).
New discovery spend was down US$14.5 million (44%) across all exploration sites, specifically Australia down US$2.1 million (27%), Africa down US$9.3 million (55%) and the Americas down US$3.0 million (37%).
The Group invested US$22.7 million in mine district exploration, a decrease of US$12.3 million (35%) compared to 2014. Exploration in 2015 focused on sustaining current Ore Reserves and increasing the mine life of existing assets with particular focus on Sepon and Kinsevere. Mine district exploration in Australia did not occur in 2015 compared with US$6.5 million invested in 2014.
Administrative expenses decreased by US$20.7 million (19%) to US$90.8 million in 2015. During the year, the Group has been focusing on driving greater business support and operational efficiency at the Las Bambas Project and existing operations. Cost savings were realised due to the absence of significant merger and acquisition costs when compared to 2014 when the Las Bambas asset was acquired.
The weaker Australian dollar also aided the lower administrative expenses.
Other income and expenses had an unfavourable US$83.6 million impact on EBIT in 2015 compared to a negative impact of $US6.9 million in 2014.
The increase in 2015 was largely driven by foreign exchange losses on the translation of Peruvian value‑added tax (VAT) receivables. The VAT is denominated in Peruvian sol which devalued against US dollars by 10% during the year. Other items impacting the result included losses on financial assets recognised at fair value through profit or loss, foreign exchange losses on the translation of monetary items, gains/(losses) on disposal of property, plant and equipment, investments and financial assets.
MMG0024 AR15_PFO3.indd 23 8/04/16 4:37 PM
For
per
sona
l use
onl
y

24 MMG LiMited
MAnAgEMEnT DISCUSSIOn AnD AnAlySIS (COnTInUED)
Depreciation and amortisation expenses increased by US$112.3 million (21%) to US$649.4 million in 2015. This was primarily due to the amortisation expense on the additional mine rehabilitation provision at Century of US$146.3 million, recognised at the end of 2014. Higher depreciation and amortisation expenses were also driven by higher ore mined and ore milled volumes at Sepon and Rosebery and higher ore milled at Kinsevere.
Net finance costs increased by US$5.6 million to US$85.0 million in 2015. The higher cost was driven by an increase of US$7.1 million in interest unwind associated with the increase in the mine rehabilitation provision for Century’s closure in December 2014.
Income tax expense – underlying decreased by US$114.2 million to US$49.1 million tax benefit in 2015 reflecting the decrease in profit before income tax for the Group. The effective tax rate in 2015 was 15.7% and was partly due to the impact of non‑creditable Peruvian withholding tax.
Impairment charge net of income tax benefit in relation to changes to the recoverable amounts comprising the Dugald River (US$462.6 million), Izok Corridor Development Project (US$53.9 million), the Kinsevere exploration tenements (US$52.5 million), Kinsevere goodwill (US$211.4 million) and the Avebury held‑for‑sale asset (US$3.9 million), taking into account the extent of tax deductibility of accounting impairments in the relevant tax jurisdictions.
SeGMeNT aNalYSIS
SEPON
yEAR EnDED 31 DECEMBER 2015 2014ChAngE
FAV/(UnFAV)
Production
Ore mined (tonnes) 1,847,828 1,788,282 3%
Ore milled (tonnes) 2,116,501 1,909,018 11%
Copper cathode (tonnes) 89,253 88,541 1%
Gold (ounces) – 364 (100%)
Payable metal in product sold
Copper (tonnes) 88,752 88,377 0%
Gold (ounces) – 524 (100%)
Silver (ounces) – 718 (100%)
yEAR EnDED 31 DECEMBER2015
US$ MIllIOn2014
US$ MIllIOnChAngE
FAV/(UnFAV)
Revenue 496.9 620.2 (20%)
Operating expenses
Production expenses
Mining(i) (28.9) (24.6) (17%)
Processing(i) (140.4) (132.7) (6%)
Other(i) (44.4) (56.8) 22%
Total production expenses (213.7) (214.1) 0%
Freight (transportation) (5.6) (6.7) 16%
Royalties (22.1) (27.6) 20%
Other(ii) 4.4 (5.0) 188%
Total operating expenses (237.0) (253.4) 6%
Other income/(expenses) (11.1) (0.3) (3,600%)
EBITDA 248.8 366.5 (32%)
Depreciation and amortisation expenses (114.4) (98.9) (16%)
EBIT 134.4 267.6 (50%)
EBITDA margin 50% 59%
(i) The amounts disclosed in the prior period have been restated to align with the current period presentation.
(ii) Other operating expenses include changes in inventories, corporate recharges and other costs of operations.
MMG0024 AR15_PFO3.indd 24 8/04/16 4:37 PM
For
per
sona
l use
onl
y

25 AnnuAl RepoRt 2015
Sepon achieved improved production and milling despite increased blending of harder Type II ore as a result of further improvements to plant optimisation and asset utilisation.
Despite stable copper sales of 88,752 tonnes of copper cathode, revenue decreased by US$123.3 million (20%) compared to 2014 as a result of lower average realised copper price.
Mining and processing costs increased by US$4.3 million (17%) and US$7.7 million (6%) respectively which is in line with increased mining and milling rates, and increased
consumption of acid and grinding media associated with the processing of harder Type II ore.
A focus on managing controllable costs, with a particular emphasis on contractors and employees, assisted in maintaining a strong EBITDA margin of 50% in 2015, down from 59% in 2014.
Depreciation and amortisation expenses have increased by US$15.5 million (16%) due to higher mining and milling volumes.
KINSEVERE
yEAR EnDED 31 DECEMBER 2015 2014ChAngE
FAV/(UnFAV)
Production
Ore mined (tonnes) 2,207,304 2,792,664 (21%)
Ore milled (tonnes) 2,183,905 1,798,258 21%
Copper cathode (tonnes) 80,169 69,624 15%
Payable metal in product sold
Copper (tonnes) 80,236 69,552 15%
yEAR EnDED 31 DECEMBER2015
US$ MIllIOn2014
US$ MIllIOnChAngE
FAV/(UnFAV)
Revenue 418.1 465.7 (10%)
Operating expenses
Production expenses
Mining(i) (28.0) (36.6) 23%
Processing(i) (114.2) (108.1) (6%)
Other(i) (81.3) (65.3) (25%)
Total production expenses (223.5) (210.0) (6%)
Freight (transportation) (45.1) (39.7) (14%)
Royalties (18.5) (19.8) 7%
Other(ii) (1.3) (6.5) 80%
Total operating expenses (288.4) (276.0) (5%)
Other income/(expenses) 2.1 (0.4) 625%
EBITDA 131.8 189.3 (30%)
Depreciation and amortisation expenses (190.1) (140.3) (35%)
EBIT (Underlying) (58.3) 49.0 (219%)
Impairment expenses (263.9) – (758%)
EBIT (Statutory) (322.2) 49.0 n/a
EBITDA margin 32% 41%
(i) The amounts disclosed in the prior period have been restated to align with the current period presentation.
(ii) Other operating expenses include changes in inventories, corporate recharges and other costs of operations.
Kinsevere achieved its third year of record production, producing 80,169 tonnes of copper cathode, as the site delivered on further improvements to asset utilisation
and current efficiency in the electrowinning plant. Lower commodity prices impacted the profitability of Kinsevere in 2015.
MMG0024 AR15_PFO3.indd 25 8/04/16 4:37 PM
For
per
sona
l use
onl
y

26 MMG LiMited
MAnAgEMEnT DISCUSSIOn AnD AnAlySIS (COnTInUED)
Revenue decreased by US$47.6 million (10%) compared to 2014, a result of lower average realised copper prices, partially offset by a 15% increase in copper sales volumes.
The non‑cash impairment losses relate to revaluation of the interest in the exploration tenements obtained as consideration for the Mutoshi Project of US$52.5 million and US$211.4 million goodwill associated with the acquisition of Anvil.
Full‑year ore mined fell 21% compared to the same period in 2014, due to drawing down on stockpiles built up in previous years to maximise cash generation at lower copper prices. This strategic mine plan and lower diesel costs contributed to a US$8.6 million (23%) reduction in mining costs. Processing
costs increased by US$6.1 million (6%) with a corresponding 21% increase in milled tonnes compared to the same period 2014.
Approximately 26% of power requirements were met from electricity sourced via diesel generation during 2015, down from 34% for the same period 2014. This is a result of further negotiations with providers and improved management of supply.
Depreciation and amortisation expenses increased by US$49.8 million (35%) corresponding to the increase in production volumes.
CENTURY
yEAR EnDED 31 DECEMBER 2015 2014ChAngE
FAV/(UnFAV)
Production
Ore mined (tonnes) 4,589,601 7,273,064 (37%)
Ore milled (tonnes) 6,811,181 7,109,879 (4%)
Zinc in zinc concentrate (tonnes) 392,667 465,696 (16%)
Lead in lead concentrate (tonnes) 79,153 64,426 23%
Payable metal in product sold
Zinc (tonnes) 343,109 419,484 (18%)
Lead (tonnes) 81,014 60,786 33%
Silver (ounces) 2,603,507 1,626,930 60%
yEAR EnDED 31 DECEMBER2015
US$ MIllIOn2014
US$ MIllIOnChAngE
FAV/(UnFAV)
Revenue 613.6 853.3 (28%)
Operating expenses
Production expenses
Mining (38.3) (108.0) 65%
Processing (205.6) (244.0) 16%
Other (66.7) (65.2) (2%)
Total production expenses (310.6) (417.2) 26%
Freight (transportation) (33.5) (51.3) 35%
Royalties (29.1) (30.6) 5%
Other(i) (85.9) (32.2) (167%)
Total operating expenses (459.1) (531.3) 14%
Other income/(expenses) 5.3 1.5 253%
EBITDA 159.8 323.5 (51%)
Depreciation and amortisation expenses (224.6) (191.3) (17%)
EBIT (64.8) 132.2 (149%)
EBITDA margin 26% 38%
(i) Other operating expenses include changes in inventories, corporate recharges and other costs of operations.
MMG0024 AR15_PFO3.indd 26 8/04/16 4:37 PM
For
per
sona
l use
onl
y

27 AnnuAl RepoRt 2015
Final ore was extracted from the Century open pit during August 2015, with final processing of Century‑sourced ore occurring in November 2015. Production in 2015 was affected by reduced optionality and higher variability of ore sources that impacted the ability to blend ore for consistency.
Lower revenue was predominantly driven by the impact of lower average realised sales prices of zinc and lead of US$168.2 million and lower zinc sales volumes of US$71.4 million.
Mining costs reduced by US$69.7 million (65%) compared to 2014 as mining for the eight months focused on the last stage of the open‑pit mine, along with benefitting from a
lower strip ratio and subsequent reduction in related mining consumable costs.
Milling tonnes decreased by 4% with an associated US$38.4 million (16%) cost saving resulting from reduced ore availability.
Depreciation and amortisation expenses increased by US$33.3 million (17%) primarily due to the amortisation expense of US$146.3 million on the additional mine rehabilitation provision at the end of 2014. As a result of this mine rehabilitation provision, EBIT was significantly impacted compared to 2014.
ROSEBERY
yEAR EnDED 31 DECEMBER 2015 2014ChAngE
FAV/(UnFAV)
Production
Ore mined (tonnes) 897,516 842,923 6%
Ore milled (tonnes) 898,573 879,288 2%
Copper in copper concentrate (tonnes) 2,937 2,305 27%
Zinc in zinc concentrate (tonnes) 92,104 83,507 10%
Lead in lead concentrate (tonnes) 21,312 23,409 (9%)
Gold (ounces) 13,340 10,164 31%
Silver (ounces) 6,991 5,904 18%
Payable metal in product sold
Copper (tonnes) 2,749 2,351 17%
Zinc (tonnes) 74,083 73,051 1%
Lead (tonnes) 19,354 22,894 (16%)
Gold (ounces) 34,302 35,572 (4%)
Silver (ounces) 1,867,721 2,446,196 (24%)
yEAR EnDED 31 DECEMBER2015
US$ MIllIOn2014
US$ MIllIOnChAngE
FAV/(UnFAV)
Revenue 201.1 247.5 (19%)
Operating expenses
Production expenses
Mining(i) (59.9) (75.1) 20%
Processing(i) (31.5) (29.4) (7%)
Other(i) (14.7) (27.4) 46%
Total production expenses (106.1) (131.9) 20%
Freight (transportation) (5.0) (6.4) 22%
Royalties (4.7) (7.4) 36%
Other(ii) (8.0) (19.5) 59%
Total operating expenses (123.8) (165.2) 25%
Other income/(expenses) 1.8 2.9 (38%)
EBITDA 79.1 85.2 (7%)
Depreciation and amortisation expenses (66.6) (46.5) (43%)
EBIT 12.5 38.7 (68%)
EBITDA margin 39% 34%
(i) The amounts disclosed in the prior period have been restated to align with the current period presentation.
(ii) Other operating expenses include changes in inventories, corporate recharges and other costs of operations.
MMG0024 AR15_PFO3.indd 27 8/04/16 4:37 PM
For
per
sona
l use
onl
y

28 MMG LiMited
MAnAgEMEnT DISCUSSIOn AnD AnAlySIS (COnTInUED)
An annual record in mined tonnes helped Rosebery achieve an annual zinc production record and strong sales for zinc and copper compared to 2014. As a result, Rosebery delivered another reliable EBITDA contribution to the Group, down only US$6.1 million (7%) despite lower average realised commodity prices and lower lead and silver sales volumes.
Mining and milling volumes were 6% and 2% higher respectively than the previous year. This was achieved through
capital development drilling exceeding schedule and enabling constant ore feed, while also benefitting from lower fuel costs and better contractor management contributing to a US$15.2 million saving in mining costs.
Depreciation and amortisation expenses increased by US$20.1 million (43%) due to reductions in Ore Reserves, higher volumes of ore mined and ore milled.
GOLDEN GROVE
yEAR EnDED 31 DECEMBER 2015 2014ChAngE
FAV/(UnFAV)
Production
Ore mined (tonnes) 1,562,232 1,262,975 24%
Ore milled (tonnes) 1,807,866 1,739,111 4%
Copper in copper concentrate (tonnes) 26,047 30,837 (16%)
Zinc in zinc concentrate (tonnes) 55,131 37,896 46%
Lead in lead concentrate (high precious metals, tonnes) 6,847 3,986 72%
Payable metal in product sold
Copper (tonnes) 25,601 32,629 (22%)
Zinc (tonnes) 42,523 32,293 32%
Lead (tonnes) 5,342 3,271 63%
Gold (ounces) 27,103 24,932 9%
Silver (ounces) 1,534,537 1,064,170 44%
yEAR EnDED 31 DECEMBER2015
US$ MIllIOn2014
US$ MIllIOnChAngE
FAV/(UnFAV)
Revenue 221.2 293.1 (25%)
Operating expenses
Production expenses
Mining(i) (78.0) (95.7) 18%
Processing(i) (59.0) (78.6) 25%
Other(i) (28.9) (20.3) (42%)
Total production expenses (165.9) (194.6) 15%
Freight (transportation) (8.6) (11.3) 24%
Royalties (9.0) (13.1) 31%
Other(ii) (22.0) (46.4) 53%
Total operating expenses (205.5) (265.4) 23%
Other income/(expenses) 3.8 1.3 192%
EBITDA 19.5 29.0 (33%)
Depreciation and amortisation expenses (44.6) (44.2) (1%)
EBIT (25.1) (15.2) (65%)
EBITDA margin 9% 10%
(i) The amounts disclosed in the prior period have been restated to align with the current period presentation.
(ii) Other operating expenses include changes in inventories, corporate recharges and other costs of operations.
MMG0024 AR15_PFO3.indd 28 8/04/16 4:37 PM
For
per
sona
l use
onl
y

29 AnnuAl RepoRt 2015
The Golden Grove mine plan focused on lower‑cost zinc ore production in 2015, with a corresponding 46% increase in zinc in zinc concentrate production and 16% reduction in copper in copper concentrate produced.
Multiple factors have contributed to reducing production costs by US$28.7 million (15%), including reduced contractor costs
with the cessation of mining from the copper oxide open pit, strategic cost initiatives and favourable foreign exchange movements compared to the same period in 2014.
Revenue decreased by US$71.9 million (25%) compared to 2014 due to lower average realised prices of all metals partially offset by higher zinc, lead, gold and silver sales volumes.
CaSh floW aNalYSIS
NET CASH FLOW
yEAR EnDED 31 DECEMBER2015
US$ MIllIOn2014
US$ MIllIOn
Net operating cash flows 282.4 666.7
Net investing cash flows (1,997.5) (3,932.8)
Net financing cash flows 2,062.2 3,379.9
Net cash inflows 347.1 113.8
Net operating cash inflows were lower reflecting lower EBITDA. Income tax payments (excluding non‑creditable Peruvian withholding tax) were US$56.5 million, $37.4 million lower than the comparative period, reflecting lower profits and timing of cash flows.
Net investing cash outflows were largely associated with costs relating to the construction of the Las Bambas Project.
During 2015, the Group invested US$1,985.0 million (2014: US$1,085.9 million) in the purchase of property plant and equipment and the development of software. This included US$1,684.1 million (2014: US$772.4 million) on the construction of Las Bambas, US$61.4 million (2014: US$68.0 million) on the Dugald River project and US$90.5 million (2014: US$119.7 million) investment in mine property and development. During the year, the Group made the final instalment payment of US$12.2 million for the acquisition of Las Bambas, which was acquired in July 2014.
Net financing cash flows were an inflow of US$2,062.2 million in 2015 compared to an inflow of US$3,379.9 million in 2014.
Financing cash inflows in 2015 included the drawdown of US$1,540.5 million under the US$5,988.0 million Las Bambas Project Facility with syndicate lenders led by China Development Bank Corporation (CDB) and US$189.0 million under the US$300.0 million facility with Industrial and Commercial Bank of China (ICBC).
Year 2015 inflows also included capital contribution from non‑controlling shareholders of Las Bambas of US$250.5 million, US$417.5 million drawn under the US$2,262.0 million facility with MMG Shareholder Top Create and the proceeds from the repayment of a shareholder loan with Album Enterprises Limited (Album Enterprises) of US$80.0 million.
These were partially offset by repayments of borrowings and payments of interest and financing costs in line with contractual terms.
Financing cash inflows in 2014 included the drawdowns of $5,358.0 million under the Las Bambas Acquisition Facility and the Project Facility, capital contributions from non‑controlling shareholders of Las Bambas of US$1,106.2 million and the drawdown of US$1,843.8 million from MMG Shareholder Top Create.
Financing outflows in 2014 included repayments of Las Bambas Seller’s Group Intragroup loans of US$4,018.1 million, dividend payments by the Company and LXML of US$62.9 million to MMG Shareholders and Sepon minority shareholder, the Government of Laos, repayments of borrowings and payment of interest and financing costs in line with contractual terms.
MMG0024 AR15_PFO3.indd 29 8/04/16 4:37 PM
For
per
sona
l use
onl
y

30 MMG LiMited
MAnAgEMEnT DISCUSSIOn AnD AnAlySIS (COnTInUED)
fINaNCIal reSoUrCeS aND lIqUIDITY
FOR ThE yEAR EnDED 31 DECEMBER2015
US$ MIllIOn2014
US$ MIllIOnChAngE
US$ MIllIOn
Total assets 14,660.0 13,490.0 1,170.0
Total liabilities (12,484.8) (10,515.4) (1,969.4)
Total equity 2,175.2 2,974.6 (799.4)
Total equity decreased by US$799.4 million to US$2,175.2 million as at 31 December 2015, mainly reflecting the loss for the year and the dividends of US$8.0 million paid to the Government of Laos minority share interest holder of LXML, offset by US$250.5 million non‑controlling interests’ contribution to the Las Bambas joint venture.
The Group’s objectives in managing capital are to safeguard its ability to continue as a going concern, support sustainable growth, enhance Shareholder value and provide capital for potential acquisitions and investment.
The Group manages the capital structure and makes adjustments in light of changes in economic conditions and business strategies. To maintain or adjust the capital structure, the Group may adjust the amount of dividend payments to Shareholders, issue new shares or raise/repay debts.
The Group monitors capital and manages its cash flow in accordance with financial covenants contained in Group debt facilities. MMG Group debt facilities (other than those of the MMG South America Group) are not secured against the assets of the MMG South America Group. As a result, the terms of relevant MMG Group debt facilities exclude certain MMG South America Group‑related items for the purposes of measuring covenants.
Consistent with the above, excluded from the MMG Group gearing ratio calculation is shareholder debt held by MMG South America Company Limited. This debt was utilised to fund the MMG Group’s equity contribution to the Las Bambas joint venture company, MMG South America Management Company Limited.
MMg gROUp (EXClUDIng MMg SOUTh AMERICA gROUp)2015
US$ MIllIOn2014
US$ MIllIOn
Total borrowings (excluding prepayments) 1,405.2 1,321.8
Less: cash and cash equivalents 431.2 91.9
Net debt 974.0 1,229.9
Total equity (including Shareholder borrowings) 950.9 1,922.5
Net debt + Total equity 1,924.9 3,152.4
Gearing ratio 0.51 0.39
The Group’s objectives in managing the capital employed by MMG South America Management Group (the Las Bambas joint venture company and its subsidiaries) are to safeguard the MMG South America Management Group’s ability to continue as a going concern, support the development of
projects, enhance Shareholder value and provide capital for further investment.
The process used to manage and monitor the capital for the MMG South America Management Group is consistent with the process applied for the rest of the MMG Group.
MMg SOUTh AMERICA MAnAgEMEnT gROUp2015
US$ MIllIOn2014
US$ MIllIOn
Total borrowings (excluding prepayments) 6,691.4 5,150.8
Less: cash and cash equivalents 167.1 159.3
Net debt 6,524.3 4,991.5
Total equity 3,485.5 2,895.9
Net debt + Total equity 10,009.8 7,887.4
Gearing ratio 0.65 0.63
MMG0024 AR15_PFO3.indd 30 8/04/16 4:37 PM
For
per
sona
l use
onl
y
31 AnnuAl RepoRt 2015
AVAILABLE DEBT FACILITIES
As at 31 December 2015, the MMG Group (excluding the MMG South America Management Group) had available undrawn facilities of US$850.0 million (2014: US$1,040.0 million), including US$750.0 million available under the Dugald River facility, which can only be used for the purpose of funding the Dugald River project. In the event financing arrangements for the Dugald River project cannot be finalised, that facility will no longer be available and amounts already drawn under it will need to be repaid.
As at 31 December 2015, the MMG South America Management Group had available undrawn facilities of US$265.7 million (2014: US$1,806.2 million).
ALTERNATIVE FUNDING OPTIONS
The Group considers it has various alternate funding options available to it should the need arise, including:
› drawing down on the existing US$100 million revolving facility from ICBC;
› utilising the existing transactional and operational banking arrangements that the Group has in place with Bank of America Merrill Lynch for US$20 million;
› borrowing from the Group insurance captive of approximately US$20 million;
› a potential equity raising;
› disposal of investments or sale of non‑core assets;
› traditional working capital and capital expenditure levers; and
› the Company also has the support of its major shareholder, CMC.
As at 31 December 2015, US$0.7 million of the facility provided by Top Create Resources Limited, a Shareholder of the Company, to fund the MMG Group’s equity contributions to the MMG South America Management Group, remained undrawn (2014: US$418.3 million).
The Group’s cash and cash equivalents at 31 December 2015 of US$598.3 million (31 December 2014: US$251.2 million) were denominated mainly in US dollars.
As at 31 December 2015, the Group’s borrowings (excluding finance charge prepayments) were as follows:
› 76.2% were bank borrowings, 21.8% were loans from related parties and 2.0% related to balances associated with convertible redeemable preference shares;
› 100% were denominated in US dollars;
› 98.0% were priced based on floating interest rates and 2.0% based on fixed interest rates; and
› 2.7% were repayable within one year, 8.3% were repayable between one and two years, 39.7% were repayable between two and five years and 49.3% were repayable over five years.
The Group’s capital commitments for purchases of property, plant and equipment and intangible assets as at 31 December 2015 were US$711.0 million (31 December 2014: US$1,229.8 million) as discussed further in Note 16.
ProJeCT UPDaTe
An update on the Company’s major development projects is below:
LAS BAMBAS, PERU
Las Bambas is a large, long‑life copper development project located in the Apurimac region of Peru. It produced its first copper concentrate from commissioning activities in the fourth quarter 2015, with the first shipment of approximately 10,000 tonnes of copper concentrate departing the Port of Matarani in January 2016. The copper concentrate plant has been successfully commissioned and is now under operations management and in production ramp‑up phase.
Project construction is essentially complete with remaining activities largely associated with the molybdenum plant and new facilities at the Port of Matarani. Handover from the construction to operations team is ongoing and there has been significant demobilisation of project‑related personnel.
MMG expects to produce 250,000–300,0008 tonnes of copper in copper concentrate in 2016 as commissioning progresses and production ramps up. At this stage, it is expected that commercial production will be achieved during the second half 2016. C1 costs are expected to be within the range of US$0.80 to US$0.90/lb9 for those tonnes produced once the plant is at a steady state of production. C1 costs are forecast to be within the first quartile of the cost curve.
Projected capital cost from 1 January 2015 to completion of the Las Bambas Project remains within the US$1.9–2.4 billion guidance. Capital expenditure in 2015 was US$1,684.1 million. At the end of 2015 project construction was 98% completed with the molybdenum plant completed in early 2016 and the rail load‑out facility and port expected to be completed in the first half 2016. The final capital cost to completion is expected to be at the lower end of the forecast range.
DUGALD RIVER, AUSTRALIA
Located in north‑west Queensland, the Dugald River project is one of the largest and highest‑grade deposits of zinc, lead and silver in the world. It has a Mineral Resource of 57.3 million tonnes at 13.2% zinc, 2.0% lead and 35g/t silver.
An updated development plan for the Dugald River project was approved by the Board on 28 July 2015, subject to financing. Negotiations are ongoing with existing syndicate members and other banks.
8 Production volumes include expected pre and post‑commercial production volumes at Las Bambas. The exact split will be determined prior to Las Bambas declaring commencement of commercial operations.
9 C1 cost forecast range once at steady state of production, not indicative for full year 2016 given commissioning and ramp‑up activities.
MMG0024 AR15_PFO3.indd 31 8/04/16 4:37 PM
For
per
sona
l use
onl
y

32 MMG LiMited
MAnAgEMEnT DISCUSSIOn AnD AnAlySIS (COnTInUED)
The updated development plan includes a mine production rate of 1.5Mtpa, construction of a concentrator and annual production of approximately 160,000 tonnes of zinc in zinc concentrate over an estimated 28‑year mine life. This places Dugald River within the world’s top ten zinc mines when operational. Dugald River will also produce significant by‑products, including approximately 18,000 tonnes of lead and 981,000 ounces of silver per annum.
Under the updated development plan, construction of remaining infrastructure is to commence during 2016 with first production from a Dugald River concentrator delivered during the first half of 2018.
Remaining capital expenditure to complete the project is expected to be around US$750 million plus interest costs. However, while final financing arrangements are underway MMG continues to review project fundamentals and seek further efficiencies in the development and construction of the Dugald River Project. Recent Australian dollar exchange rate movements and competitive bids from construction contractors are predicted to favourably impact final costs. Total capital expenditure for the Dugald River Project in 2015 totalled US$61.4 million.
CoNTraCTS aND CoMMITMeNTS
SEPON
New and revised agreements were finalised with regard to various goods and services with improved terms and conditions including sulphuric acid, reagents, explosives, mining equipment and related parts and services, plant maintenance related parts and accessories as well as major capital equipment and infrastructure around the new scrubber.
KINSEVERE
New and revised agreements were finalised with regard to various goods and services with improved terms and conditions including sulphuric acid, reagents, camp services, logistics‑related contracts, power generation, explosives, laboratory services and maintenance‑related parts and accessories.
ROSEBERY
New and revised agreements were finalised with regard to various goods and services with improved terms and conditions including mining services, reagents, shotcreting services, camp services, logistics‑related contracts, power generation, explosives and maintenance‑related parts and accessories. An extensive market engagement was conducted prior to the appointment of a provider to construct new tailings storage facilities.
GOLDEN GROVE
New and revised agreements were finalised with regard to various goods and services with improved terms and conditions including reagents, lime and cement, explosives, power, site services and outbound shipping services.
CENTURY/DUGALD RIVER
With Century closure a number of contracts were terminated or revised given changes in activity at the end of the year. These included power‑related contracts including gas contracts and compression services, labour services contracts for catering and transportation related to mining and site services contracts.
With regard to Dugald River, revised agreements were put in place for mine development, underground diamond drilling services and raiseboring. In addition, a competitive process was finalised for the completion of engineering services for the processing plant construction and related construction contracts as well as the commissioning of Primary Surface Ventilation Fans.
LAS BAMBAS
Following extensive market engagements as the project moved into commissioning, a number of contracts were put in place across all areas. The most significant contracts included outbound concentrate logistics contracts relating to the bi‑model (truck and rail) solution, a number of reagents contracts for the processing plant, labour services contracts, sites services contracts including catering and site transport and various parts and services contracts related to mobile and fixed plant.
PeoPle
As at 31 December 2015, the Group employed a total of 5,953 full‑time equivalent employees (31 December 2014: 5,109) in its operations (excluding contractors, casual employees, apprentices and trainees) with the majority of employees based in Australia, Laos, South America and the DRC.
Total employee benefits expenses for the Group’s operations for the 12 months ended 31 December 2015, including Directors’ emoluments, totalled US$381.7 million, a decrease of 15% (2014: US$446.6 million due to favourable foreign exchange movements). Employee short‑term incentive (STI) for the year ended 31 December 2015 was capped at the threshold payment level due to the Company not achieving its overall financial targets.
The Group has remuneration policies that align with market practice and remunerates its employees based on the responsibilities of their role, their performance, market requirements and the performance of the Group. Employee benefits include market‑competitive fixed remuneration, performance‑related incentives, a limited share option scheme and, in specific cases, insurance and medical coverage. A range of targeted training and development programs are provided to employees across the Group that are designed to improve individual capability, and enhance employee and Group performance.
MMG0024 AR15_PFO3.indd 32 8/04/16 4:37 PM
For
per
sona
l use
onl
y

33 AnnuAl RepoRt 2015
MaTerIal aCqUISITIoNS aND DISPoSalS
The Group did not make any material acquisitions or disposals in the 12 months ended 31 December 2015.
eVeNTS afTer The rePorTING DaTe
Other than the matters outlined elsewhere in this announcement, there have been no matters that have occurred subsequent to the reporting date which have significantly affected, or may significantly affect the Group’s operations, results or state of affairs in future years.
fINaNCIal aND CaPITal rISK MaNaGeMeNT
FINANCIAL RISK FACTORS
The Group’s activities expose it to a variety of financial risks, including commodity price risk, interest rate risk, foreign exchange risk, credit risk, liquidity risk, equities price risk and sovereign risk. The Group’s overall risk management program focuses on the unpredictability of financial markets and seeks to minimise potential adverse effects on the Group’s financial performance. The Group does not and is prohibited from entering into derivative contracts for speculative purposes.
Financial risk management is carried out by the Group Treasury function under proposals approved by the Board. Group
Treasury identifies, evaluates and manages financial risks in close cooperation with the Group’s operating units. The Board approves written principles for overall risk management, as well as policies covering specific areas, such as those identified below.
(a) Commodity price risk
The Group is exposed to commodity price volatility on commodity sales made by its operations. This arises from the sale of metal and metal in concentrate products such as zinc, copper, lead, gold and silver, which are priced on, or benchmarked to, open market exchanges. There were no commodity hedges in place as at 31 December 2015 and 2014.
The following table details the sensitivity of the Group’s trade receivables balance to movements in commodity prices. Trade receivables arising from revenue on provisionally priced sales are recognised at the estimated fair value of the total consideration of the receivable and subsequently remeasured at each reporting date. At the reporting date, if the commodity prices increased/(decreased) by 10% and all other variables were held constant, the Group’s after‑tax (loss)/profit would have changed as set out below.
2015 2014
COMMODITy
COMMODITy pRICE
MOVEMEnT
DECREASED lOSS
US$ MIllIOn
InCREASED lOSS
US$ MIllIOn
COMMODITy pRICE
MOVEMEnT
InCREASED pROFIT
US$ MIllIOn
DECREASED pROFIT
US$ MIllIOn
Zinc 10% 0.4 (0.4) 10% 3.5 (3.5)
Copper 10% 1.9 (1.9) 10% 4.7 (4.7)
Lead 10% 0.3 (0.3) 10% 2.3 (2.3)
Total 2.6 (2.6) 10.5 (10.5)
From 2016 the impact of commodity price changes will be significantly different with the closure of Century mine and the commencement of production at Las Bambas.
(b) Interest rate risk
The Group is exposed to interest rate volatility on deposits and borrowings. Deposits and borrowings at variable rates expose the Group to cash flow interest rate risk. Deposits and borrowings at fixed rates expose the Group to fair value interest rate risk. Details of the Group’s cash and cash equivalents have been disclosed in Note 11.
The Group regularly monitors its interest rate risk to ensure that there are no undue exposures to significant interest rate movements. Any decision to hedge interest rate risk is assessed periodically in light of the Group’s overall exposure, the prevailing interest rate market and any funding counterparty requirements. Regular reporting that summarises the Group’s debt and interest rates is provided to the Executive Committee. As at 31 December 2015 and 2014, if the interest rate had increased/(decreased) by 100 basis points with all other variables held constant, post‑tax (loss)/profit and equity for the year would have changed as follows:
2015 2014
US$ MIllIOn
+100 BASIS pOInTS –100 BASIS pOInTS +100 BASIS pOInTS –100 BASIS pOInTS
lOSS EqUITy lOSS EqUITy pROFIT EqUITy pROFIT EqUITy
Financial assets
Cash and cash equivalents 4.2 4.2 (4.2) (4.2) 1.8 1.8 (1.8) (1.8)
Financial liabilities
Borrowings (6.7) (6.7) 6.7 6.7 (6.1) (6.1) 6.1 6.1
Total (2.5) (2.5) 2.5 2.5 (4.3) (4.3) 4.3 4.3
MMG0024 AR15_PFO3.indd 33 8/04/16 4:37 PM
For
per
sona
l use
onl
y

34 MMG LiMited
MAnAgEMEnT DISCUSSIOn AnD AnAlySIS (COnTInUED)
Interest on borrowings in relation to development projects is capitalised into Property, Plant and Equipment, and does not impact profit/loss or equity of the Group so is not included in the sensitivity analysis.
If the sensitivity analysis had included capitalised interest on borrowings in relation to development projects, the rate variation would have increased or decreased Plant, Property and Equipment by US$65.0 million with the corresponding offset in cash and cash equivalents.
(c) foreign exchange risk
The Group operates internationally and is exposed to foreign currency exchange risk. The Group’s reporting currency and functional currency of the majority of subsidiaries within the Group is US dollars. The majority of revenue received by the Group is in US dollars. The Group’s foreign currency exchange risk arises predominantly from the currency of the countries in which the Group’s operations are located. Any decision to hedge foreign currency risk is assessed periodically in light of the Group’s exposure, the prevailing foreign currency market and any counterparty requirements.
The Group is exposed to foreign exchange risk primarily with respect to the Peruvian sol (PEN), Australian dollar (A$), and Hong Kong dollar (HK$). Given the exchange rate peg between HK dollars and US dollars, it is not foreseen that the Group will be exposed to significant exchange rate risk for the transactions conducted in HK dollars or US dollars. However, exchange rate fluctuations of Peruvian sols or Australian dollars against US dollars could affect the Group’s performance and asset value. The Peruvian sol and Australian dollar are the most important currencies influencing costs.
The Group tries to minimise its foreign exchange risk exposures through natural hedges wherever possible. For instance, external debt and surplus cash are denominated in US dollars. A portion of cash may be held in Peruvian sols or Australian dollars to meet operating costs.
The following table shows the foreign currency risk arising from the financial assets and liabilities, which are given in the currency of denomination.
US$ MIllIOn US$ pEn A$ hk$ OThERS TOTAl
As at 31 December 2015
Financial assets
Cash and cash equivalents 583.1 1.7 7.4 – 6.1 598.3
Trade receivables 38.1 38.1
Sundry receivables 134.0 2.9 11.4 – – 148.3
Financial liabilities
Trade and other payables (398.2) (43.9) (85.5) – – (527.6)
Borrowings (excluding prepayments) (10,357.8) – – – – (10,357.8)
(10,000.8) (39.3) (66.7) – 6.1 (10,100.7)
As at 31 December 2014
Financial assets
Cash and cash equivalents 216.6 27.2 6.1 0.1 1.2 251.2
Trade receivables 153.5 – – – – 153.5
Sundry receivables 18.3 6.3 9.6 – – 34.2
Financial liabilities
Trade and other payables (416.5) (52.8) (90.1) – (14.0) (573.4)
Borrowings (excluding prepayments) (8,316.4) – – – – (8,316.4)
(8,344.5) (19.3) (74.4) 0.1 (12.8) (8,450.9)
MMG0024 AR15_PFO3.indd 34 8/04/16 4:37 PM
For
per
sona
l use
onl
y

35 AnnuAl RepoRt 2015
Based on the Group’s net financial assets and liabilities as at 31 December 2015 and 2014, a movement of the US dollar against the principal non‑functional currencies as illustrated
in the table below, with all other variables held constant, would change the (loss)/profit after taxation and equity as follows:
US$ MIllIOn
2015 2014
WEAkEnIng OF US DOllAR
STREngThEnIng OF US DOllAR
WEAkEnIng OF US DOllAR
STREngThEnIng OF US DOllAR
lOSS EqUITy lOSS EqUITy pROFIT EqUITy pROFIT EqUITy
10% movement in A$ (2014: 10%) 4.7 4.7 (4.7) (4.7) (5.2) (5.2) 5.2 5.2
10% movement in PEN (2014: 10%) 2.7 2.7 (2.7) (2.7) (1.3) (1.3) 1.3 1.3
Total 7.4 7.4 (7.4) (7.4) (6.5) (6.5) 6.5 6.5
(d) Credit risk
Credit risk refers to the risk that a counterparty will default on its contractual obligations resulting in financial loss to the Group. The Group is exposed to counterparty credit risk through sales of metal products on normal terms of trade, through deposits of cash and settlement risk on foreign exchange transactions. At the reporting date, the carrying amount of the Group’s financial assets, including cash and cash equivalents, trade and other receivables, loan to a related party and other bank deposits, represents the maximum credit exposure.
The credit risk on investments in cash, short‑term deposits and similar assets is with approved counterparty banks and the intermediate holding company of the Company. Counterparties are assessed prior to, during and after the conclusion of transactions to ensure exposure to credit risk is limited to acceptable levels. The limits are set to minimise the concentration of risks and therefore mitigate the potential for financial loss through counterparty failure.
The Group’s most significant customer is Nyrstar Sales and Marketing AG. The revenue earned from Nyrstar Sales and Marketing AG was approximately 27.6% of revenue for the year (2014: Nyrstar Sales and Marketing AG with 33.4%). The largest debtor at 31 December 2015 was Trafigura Ptd Ltd with a balance of US$9.4 million (2014: Nyrstar Sales and Marketing AB with a balance of US$74.9 million) and the five largest debtors accounted for 48.5% (2014: 88.2%) of the Group’s trade receivables. Credit risk arising from sales to large‑concentrate customers is managed by contracts that stipulate a provisional payment of at least 90% of the estimated value of each sale. This is payable either promptly after vessel loading or upon vessel arriving at the discharge port. Title to the concentrate does not pass to the buyer until this provisional payment is made. For most sales a second provisional payment is received within 60 days of the vessel arriving at the port of discharge. Final payment is made after completion of the quotation period and assaying. The credit risk by geographic location of customer was:
AS AT 31 DECEMBER
2015 2014
Australia 5.9 2.5
Europe 26.0 118.2
Asia 6.2 32.8
38.1 153.5
MMG0024 AR15_PFO3.indd 35 8/04/16 4:37 PM
For
per
sona
l use
onl
y

36 MMG LiMited
MAnAgEMEnT DISCUSSIOn AnD AnAlySIS (COnTInUED)
(e) liquidity risk
Liquidity risk is the risk that the Group will encounter difficulty in meeting obligations associated with financial liabilities.
Management utilises short and long‑term cash flow forecasts and other consolidated information to ensure that appropriate liquidity buffers are maintained to support the Group’s activities.
The table below analyses the Group’s financial liabilities into relevant maturity groupings based on the remaining period at the balance sheet date to the contractual maturity date. The amounts disclosed in the table are the contractual undiscounted cash flows.
US$ MIllIOnWIThIn 1 yEAR
BETWEEn 1 AnD 2
yEARS
BETWEEn 2 AnD 5
yEARSOVER
5 yEARS TOTAl
At 31 December 2015
Financial liabilities
Trade and other payables (including accrued interest) 420.2 107.4 – – 527.6
Borrowings (including unaccrued interest) 383.1 1,350.9 5,097.3 6,781.5 13,612.8
Forward foreign exchange contracts net settled 0.3 – – – 0.3
803.6 1,458.3 5,097.3 6,781.5 14,140.7
At 31 December 2014
Financial liabilities
Trade and other payables 508.5 37.0 27.9 – 573.4
Borrowings (including unaccrued interest) 205.0 360.1 2,720.8 9,006.1 12,292.0
713.5 397.1 2,748.7 9,006.1 12,865.4
The amounts presented in the tables above comprise the contractual undiscounted cash flows, and therefore will not agree with the amounts presented in the balance sheet.
(f) equities price risk
Equity securities price risk arising from investments held by the Group is classified in the balance sheet as available‑for‑sale and fair value through profit and loss financial assets. All the Group’s equity investments are publicly traded. The price risk of the Group’s equity securities was not significant as at 31 December 2015 and 2014.
(g) Sovereign risk
The Group has operations in countries that carry higher levels of sovereign risk. Political and administrative change and reforms in law, regulations or taxation may impact the Group’s future performance.
CoNTINGeNT aSSeTS aND lIaBIlITIeS
LEGAL PROCEEDINGS
The Company and its subsidiaries are defendants from time to time in legal proceedings arising from the conduct of their businesses. The Group does not consider that the outcome of any of these proceedings ongoing at balance date, either individually or in aggregate, is likely to have a material effect on its financial position. Where appropriate, provisions have been made.
BANK GUARANTEES
Certain bank guarantees have been provided in connection with the operations of certain subsidiaries of the Company primarily associated with the terms of mining leases, mining concessions, exploration licences or key contracting arrangements. At the end of the year, no claims have been made under these guarantees. The amount of these guarantees may vary from time to time depending upon the requirements of the relevant regulatory authority. These guarantees amount to US$491.2 million (2014: US$442.9 million). Provision is made in the financial statements for the anticipated costs of the mine rehabilitation obligations under the mining leases and exploration licences.
CONTINGENT ASSETS – TAx INDEMNITIES
The Group has been granted warranties and indemnities in relation to certain tax matters. No formal claims for reimbursement or compensation were made under tax warranties and indemnities by the Group during 31 December 2015.
CONTINGENT LIABILITIES – TAx‑RELATED CONTINGENCIES
Tax authorities conduct regular routine tax reviews and audits on the Group. The final outcome cannot be determined with sufficient reliability. The balance sheet currently reflects all probable taxation liabilities and reasonable steps are being undertaken in relation to all outstanding matters.
MMG0024 AR15_PFO3.indd 36 8/04/16 4:37 PM
For
per
sona
l use
onl
y

37 AnnuAl RepoRt 2015
CharGeS oN aSSeTS
As at 31 December 2015, the following banking facilities granted to the Group required certain assets to be charged:
› the US$751.0 million facility granted by CDB and BOC Sydney to Album Resources Private Limited (Album Resources) and MMG Management Pty Ltd (MMG Management) dated 12 June 2012 (US$751.0 million Facility), with respect to a borrowing of US$600.8 million;
› the US$200.0 million facility granted by CDB to Album Resources dated 12 June 2009 (US$200.0 million Facility), with respect to a borrowing of US$120.0 million;
› the A$400.0 million bank guarantee facility between MMG Management and BOC Sydney (A$400.0 million Facility);
› the US$1.0 billion facility granted by CDB and BOC Sydney to MMG Dugald River Pty Ltd (MMG Dugald River) dated 27 June 2013 (US$1.0 billion Facility), with respect to a borrowing of US$250.0 million; and
› the US$969.0 million acquisition facility and US$5,988.0 million project facility granted by CDB, ICBC, BOC Sydney and EXIM to Minera Las Bambas SA with respect to a borrowing of approximately US$5,538.7 million, and the US$380.0 million bank guarantee facility between Minera Las Bambas SA and ICBC (together, the Las Bambas Facilities).
The charges in respect of the US$751.0 million and US$200.0 million Facilities are:
› a first‑ranking equitable mortgage over 100% of the shares held in Album Resources’ wholly owned subsidiary, Album Investment Private Limited (Album Investment);
› a first‑ranking equitable mortgage over 100% of the shares in certain wholly owned subsidiaries of Album Investment including MMG Laos Holdings Limited (MMG Laos Holdings); and
› a share charge over 70% of the shares in certain other subsidiaries of Album Investment including MMG Laos Holdings.
The security in respect of the A$400.0 million Facility is a second‑ranking equitable mortgage over the assets described above.
The charges in place for the US$1.0 billion Facility are the same as those existing in respect of the US$751.0 million Facility. In addition, certain subsidiaries of the Company that relate to the Dugald River project have provided asset security in respect of their assets. Following successful commissioning of the Dugald River project, and subject to meeting certain agreed conditions, the financing will be limited recourse to the assets and shares of MMG Dugald River.
The charges in respect of the Las Bambas Facilities are:
› share security over 100% of the shares held in MMG South America Management Company Limited and each of its subsidiaries, including the borrower, Minera Las Bambas SA;
› a debenture over the assets of MMG South America Management Company Limited and an assets pledge agreement and production unit mortgage in respect of all of the assets of Minera Las Bambas SA; and
› assignments of Shareholder loans between MMG South America Management Company and its subsidiaries and security agreements over bank accounts of Minera Las Bambas SA.
fUTUre ProSPeCTS
MMG expects to produce 415,000–477,000 tonnes of copper10 and 120,000–135,000 tonnes of zinc in 2016.
Once commercial production has been declared at Las Bambas, currently estimated to occur in the second half 2016, and final financing arrangements have been made for the Dugald River Project, MMG will update the market on total capital expenditure guidance for 2016. In the interim, capital expenditure for all other operations for 2016 is expected to be approximately US$207 million.
MMG currently has no future plans for material investments or capital assets sanctioned by the Board other than those detailed in this report or announced to the market.
10 Production volumes include expected pre and post‑commercial production volumes at Las Bambas. The exact split will be determined prior to Las Bambas declaring commencement of commercial operations.
MMG0024 AR15_PFO3.indd 37 8/04/16 4:37 PM
For
per
sona
l use
onl
y

38 MMG LiMited
diReCtoRS And SenioR mAnAGementdiReCtoRS’ bioGRAphieSChaIrMaN
MR JIAO JIAN
Mr Jiao, aged 47, was appointed as the Chairman of the Company in August 2014. He is the Chairman of the Company’s Governance and Nomination Committee and Risk Management Committee and a member of the Company’s Remuneration Committee.
Prior to his appointment as the Chairman, Mr Jiao served as a Non‑executive Director of the Company from December 2010. He has also served as a director of certain subsidiaries of the Company. Mr Jiao was appointed as the Vice President of China Minmetals Corporation (CMC) in December 2015 and the Chairman of China Minmetals Non‑ferrous Metals Company Limited (CMN) in February 2016. He has been a director of CMN since December 2009. Mr Jiao has been the Chairman of Album Enterprises Limited (Album Enterprises) and a director of Top Create Resources Limited (Top Create) since November 2011 and February 2012 respectively. He has been a director of Hunan Nonferrous Metals Holding Group Co., Ltd. (HNG) and China Minmetals Rare Earth Group Co., Ltd. since July 2010 and December 2011 respectively. Mr Jiao is also the Chairman of Copper Partners Investment Co., Ltd. (Copper Partners Investment).
Mr Jiao holds a Bachelor’s degree in International Economics from the Nankai University in the People’s Republic of China (PRC) and a Master of Business Administration degree from Saint Mary’s University in Canada. He has extensive experience in international trade, investment and corporate management.
Mr Jiao joined CMC and its subsidiaries (CMC Group) in 1992. He was the Vice President of CMN from 2007 to May 2010. Mr Jiao was the President of CMN from May 2010 to January 2016. He was a director and the President of China Minmetals Non‑ferrous Metals Holding Company Limited (CMNH) from December 2009 to February and January 2016, respectively. Mr Jiao was the Chairman of China Minmetals Rare Earth Co., Ltd. (CMRE) (a company listed on the Shenzhen Stock Exchange) and China Tungsten and Hightech Materials Co., Ltd. (a company listed on the Shenzhen Stock Exchange) from April 2010 to April 2014 and from April 2013 to March 2014 respectively. He was also a director of Jiangxi Tungsten Industry Group Co., Ltd. (Jiangxi Tungsten) from November 2009 to August 2014.
eXeCUTIVe DIreCTorS
MR ANDREW MICHELMORE
Mr Michelmore, aged 63, was appointed as an Executive Director and the Chief Executive Officer (CEO) of the Company in December 2010.
He is also a director of a number of subsidiaries of the Company. He was the managing director and CEO of Minerals and Metals Group from its formation in June 2009 until its
acquisition by the Company in December 2010. Prior to joining Minerals and Metals Group, Mr Michelmore was the CEO of Zinifex Limited followed by OZ Minerals Limited. He was a director of Century Aluminum Company (a company listed on the NASDAQ and the Iceland Stock Exchange). Prior to his role as the CEO of Zinifex Limited, Mr Michelmore spent two years working in London and Russia as the CEO of En+ Group.
Mr Michelmore has more than 30 years’ experience in the metals and mining industry including 12 years at WMC Resources Limited, where he was the CEO, and prior to that, he held senior roles in the company’s nickel, gold, alumina, copper, uranium and fertiliser businesses.
He holds a First Class Honours degree in Engineering (Chemical) from the University of Melbourne and a Master of Arts in Politics, Philosophy and Economics from Oxford University. He is a fellow of the Institution of Chemical Engineers, the Institution of Engineers Australia and the Australian Academy of Technological Sciences and Engineering.
Mr Michelmore is also Chairman of the International Council on Mining and Metals, Chairman of the Minerals Council of Australia, Chairman of the International Zinc Association, a member of the Business Council of Australia, Chairman of the Jean Hailes Foundation for Women’s Health and Chairman of the Council of Ormond College at the University of Melbourne.
MR xU JIqING
Mr Xu, aged 48, was appointed as an Executive Director and Executive General Manager – Strategic Planning of the Company in May 2013. His role title changed to Executive General Manager – China and Group Strategy in August 2014. In July 2015, Mr Xu’s role title changed to Executive General Manager – China and Strategy. Prior to that, he served as a Non‑executive Director of the Company from May 2009 until May 2013 and a member of the Company’s Audit Committee from July 2009 until May 2013. Mr Xu is a director of a number of subsidiaries of the Company. He was also appointed as a director of CMN in February 2016.
Mr Xu holds a Bachelor’s degree in Accounting from the University of International Business and Economics in the PRC, and a Master of Business Administration degree from Saint Mary’s University in Canada. He is a qualified senior accountant in the PRC and is a fellowship member of the Certified General Accountants Association of Canada. Mr Xu has extensive experience in accounting and corporate financial management.
Mr Xu joined the CMC Group in 1991. He was appointed as the Manager of Finance at Minmetals Development Co. Ltd. in 1997, and was promoted to Vice General Manager in 1999 and General Manager in 2000. Mr Xu was also the General Manager of Finance at China National Nonferrous Metals Industry Trading Group Corporation from July 2001 to April 2002, and the General Manager of Finance at CMN from
MMG0024 AR15_PFO3.indd 38 8/04/16 4:37 PM
For
per
sona
l use
onl
y

39 AnnuAl RepoRt 2015
April 2002 to December 2007. He was the Chief Financial Officer (CFO) of CMN from December 2005 to November 2007 and the Vice President and CFO of CMN from December 2007 until May 2013. Mr Xu was the Vice President and CFO of CMNH from January 2011 until May 2013. He was the director of Album Enterprises and Top Create from December 2005 to October 2013 and from February 2012 to October 2013 respectively. Mr Xu was the director of Copper Partners Investment and HNG from March 2009 to December 2013 and from July 2010 to October 2013 respectively. He was also the director of CMNH and Jiangxi Tungsten from December 2009 to December 2014 and from April 2010 to August 2014 respectively.
NoN-eXeCUTIVe DIreCTor
MR GAO xIAOYU
Mr Gao, aged 46, was appointed as a Non‑executive Director of the Company in April 2011. He is a member of the Company’s Audit Committee, Remuneration Committee and Risk Management Committee.
Mr Gao is a director of a number of subsidiaries of the Company. He was appointed as the President and a director of CMN in February 2016. Mr Gao has been a director of Top Create since February 2012. He is also a director of certain subsidiaries of the CMC Group.
He holds a Master’s degree in Business Management from The Renmin University of China in the PRC. He has extensive experience in enterprise risk management and control.
Mr Gao joined the CMC Group in 1993. He worked in the Futures department of China Nonferrous Metals Import and Export Corporation from 1993 to 1997. He was the General Manager of the Risk Management department of CMN from 2000 to 2009 and Vice President of CMNH from January 2011 to January 2016. He was also Vice President of CMN from January 2008 to February 2016.
INDePeNDeNT NoN-eXeCUTIVe DIreCTorS
DR PETER CASSIDY
Dr Cassidy, aged 70, was appointed as an Independent Non‑executive Director of the Company in December 2010. He is the Chairman of the Company’s Remuneration Committee. Dr Cassidy is also a member of the Company’s Audit Committee, Governance and Nomination Committee and Risk Management Committee.
He has also been an independent non‑executive director of Kerry Gold Mines Limited since September 2010.
Dr Cassidy is a metallurgical engineer with more than 40 years’ experience in the resource and energy sectors, including more than 20 years as a director of major public companies. He was an independent non‑executive director of Oxiana Limited (2002 to 2007); Zinifex Limited (2004 to 2008); Sino Gold Mining Limited (2002 to 2009); Lihir Gold Limited (2003
to 2010); OZ Minerals Limited (2008 to 2009); and Energy Developments Limited (2003 to 2009).
Dr Cassidy was also Non‑executive Chairman of Allegiance Mining NL (April to July 2008) and a director of Eldorado Gold Corporation (2009 to 2010). He was CEO of Goldfields Limited from 1995 until its merger with Delta Gold Limited in 2002 to form Aurion Gold Limited where he remained a director until 2003. Prior to 1995, Dr Cassidy was executive director – Operations of RGC Limited. He was also a member of the Board of Advice of the Monash University Division of Mining and Resources Engineering.
Dr Cassidy has most recently been involved in the development and operation of major mining and processing projects in Australia, the PRC, Laos, Papua New Guinea and the Cote d’Ivoire.
MR LEUNG CHEUK YAN
Mr Leung, aged 64, was appointed as an Independent Non‑executive Director of the Company in July 2012. He is a member of the Company’s Audit Committee, Governance and Nomination Committee and Risk Management Committee.
Mr Leung has also been an independent non‑executive director of Bank of China Limited (a company listed on The Stock Exchange of Hong Kong Limited (Stock Exchange) and the Shanghai Stock Exchange) since September 2013.
Mr Leung is a solicitor admitted to practise law in Hong Kong, England and Wales, and Victoria and the Australian Capital Territory, Australia. He holds a Bachelor of Social Science (First Class Honours) degree from the Chinese University of Hong Kong, and a Master of Philosophy degree from the University of Oxford. Mr Leung, a corporate finance and capital markets specialist, was a partner at Baker & McKenzie and for many years the head of its securities practice group in Hong Kong. He retired from Baker & McKenzie in 2011.
MS JENNIFER SEABROOK
Ms Seabrook, aged 59, was appointed as an Independent Non‑executive Director of the Company in July 2015. She is the Chair of the Company’s Audit Committee and a member of the Company’s Remuneration Committee. Ms Seabrook holds a Bachelor’s degree in Commerce from the University of Western Australia and is a chartered accountant (fellow) admitted by the Institute of Chartered Accountants in Australia, a fellow of the Australian Institute of Company Directors and a senior fellow of the Financial Services Institute of Australia (Finsia).
Ms Seabrook qualified as a chartered accountant with Touche Ross, after which she worked at senior levels in chartered accounting, capital markets and investment banking businesses. She is an experienced independent non‑executive director across a wide range of industries, including mining and metals, and has significant experience as the chair and as a member of audit and risk committees for listed and unlisted public, private and government corporations. Ms Seabrook
MMG0024 AR15_PFO3.indd 39 8/04/16 4:37 PM
For
per
sona
l use
onl
y

40 MMG LiMited
has also been a member of several advisory groups and panels including ASIC’s External Advisory Group (2009 to 2013) and the Australian Takeovers Panel (2000 to 2012).
Ms Seabrook is currently an independent non‑executive director of Iluka Resources Limited, a company listed on the Australian Securities Exchange (ASX), chairing its Audit and Risk Committee and being a member of its People and Performance Committee and Nominations Committee. She joined the Iluka Board in May 2008. Ms Seabrook is also an independent non‑executive director of IRESS Limited, also listed on the ASX, chairing its People and Performance Committee and being a member of its Audit Committee. She joined the IRESS Limited Board in August 2008. Ms Seabrook has been a special advisor to Gresham Partners Limited since 2008 after being an executive director with Gresham Partners Limited from 1998 to 2008. She has been an independent non‑executive director of Western Australia Treasury Corporation since October 2015 and is a member of its Audit Committee.
PROFESSOR PEI KER WEI
Professor Pei, aged 58, was appointed as an Independent Non‑executive Director of the Company in July 2015. He is a member of the Company’s Audit Committee, Remuneration Committee and Risk Management Committee.
Professor Pei holds a PhD degree in Accounting from University of North Texas, a Master’s degree in Accountancy from Southern Illinois University and a Bachelor’s degree in Accounting from National Chung‑Hsing University (Taipei University). Professor Pei is a member of American Accounting Association.
Professor Pei is a Professor of Accountancy and the Executive Dean of China Programs at W.P. Carey School of Business at Arizona State University. He is also the director of the W.P. Carey EMBA program in Shanghai, MiM Custom Corporate Program in China and the Co‑director of W.P. Carey DBA in Global Financial Management. Professor Pei has also acted as a consultant for a number of multi‑national companies, including Motorola Inc., Intel Corporation, Bank of America Corporation, Dial Corporation, Raytheon Company, Cisco Systems Inc. and Honeywell International Inc.
Professor Pei has also been a Director of Baoshan Iron & Steel Co, Ltd (a company listed on the Shanghai Stock Exchange) since April 2012 and an external director of Baosteel Group Corporation (the holding company of Baoshan Iron & Steel Co, Ltd) since February 2012, chairing its Audit Committee and is a member of its Strategy Committee and Nomination Committee. Prior to this, he served as an independent director, the Chairman of the Audit Committee and a member of the Compensation Committee of Baoshan Iron & Steel Co. Ltd. from 2006 to 2012.
Professor Pei has also acted as an independent non‑executive director of Want Want China Holdings Limited (a company listed on the Stock Exchange) since November 2007, chairing its Nomination Committee and is a member of its Audit Committee, Remuneration Committee and Strategy Committee. He has been an independent non‑executive director of Zhong An Real Estate Limited (a company listed on the Stock Exchange) since October 2007, chairing its Remuneration Committee and is a member of its Audit Committee, Nomination Committee and Governance Committee; and an independent non‑executive director of Zhejiang Expressway Co., Ltd. (a company listed on the Stock Exchange) since June 2012, chairing its Remuneration Committee and is a member of its Audit Committee and Nomination Committee. Professor Pei is also an external director of China Merchants Group.
SenioR mAnAGement’S bioGRAphieSMR ROSS CARROLL, CHIEF FINANCIAL OFFICER
Mr Carroll, aged 51, was appointed as CFO and a member of the Executive Committee of the Company in December 2015, with responsibility for Commercial and Finance, Mergers and Acquisitions, Project Delivery and Exploration. He is also a director of a number of subsidiaries of the Company.
Prior to joining the Company, Mr Carroll was CEO and managing director of Macmahon Holdings Limited (a company listed on the Australian Securities Exchange), and previously held the positions of CFO and director of International Mining, and Chief Operating Officer of Mining at Macmahon Holdings Limited. Prior to that, he was CFO of Woodside Petroleum Limited, and also worked in senior financial roles within BHP Billiton Limited and Foster’s Brewing Group.
Mr Carroll has extensive experience in the mining industry and in corporate finance, capital management and business development. He holds a Bachelor of Commerce from the University of Melbourne and is a Certified Public Accountant with the Australian Society of Certified Practising Accountants. Mr Carroll is a member of the Australian Institute of Company Directors, and was previously a member of the Executive Committee of the Western Australian Chamber of Mines.
MR MARCELO BASTOS, CHIEF OPERATING OFFICER
Mr Bastos, aged 53, has served on the Executive Committee of the Company since June 2011 in his capacity as the Chief Operating Officer with responsibility for all operating assets. He is also a director of a number of subsidiaries of the Company.
DIRECTORS AnD SEnIOR MAnAgEMEnT (COnTInUED)
MMG0024 AR15_PFO3.indd 40 8/04/16 4:37 PM
For
per
sona
l use
onl
y

41 AnnuAl RepoRt 2015
Prior to joining the Company, Mr Bastos was CEO of BHP Billiton Mitsubishi Alliance from 2008 to 2011 and before that, President of BHP Billiton Nickel West from 2007 to 2008. He was also President of Cerro Matoso Nickel, a BHP Billiton company in Colombia, from 2004 to 2006.
Mr Bastos began his career at Vale and worked with iron ore, gold and copper from 1985 to 2004. His most senior roles at Vale were General Manager at the Carajas mines complex in Brazil and director of Non‑ferrous Operations.
He has 30 years’ international mining experience in the iron ore, gold, copper, nickel and coal sectors. He holds a Bachelor’s degree in Mechanical Engineering from Federal University of Minas Gerais State, and a Master of Business Administration in Management from Fundação Dom Cabral – INSEAD associated, both in Brazil.
Mr Bastos has also been a non‑executive director and a member of the Audit Committee of Iluka Resources Limited (a company listed on the ASX) since February 2014.
Mr Bastos has trained at the Columbia Business School and Kellogg School of Management in the United States, Cranfield Business School in the United Kingdom and INSEAD in France. He was a member of the Western Australia Chamber of Mines and Energy from 2007 to 2008 and was the Vice President of the Queensland Resources Council from 2008 to 2010, both in Australia. Mr Bastos was a non‑executive director of Golding Contractors Pty Ltd in Queensland, Australia, from 2012 to 2013.
MR GREG TRAVERS, ExECUTIVE GENERAL MANAGER – BUSINESS SUPPORT
Mr Travers, aged 57, has served on the Executive Committee of the Company since May 2014 in his capacity as Executive General Manager – Business Support. In this role, he is responsible for Human Resources, Remuneration and Benefits, Shared Business Services, Information Technology, Legal, Supply Chain, Enterprise Risk, Safety, Health, Environment and Community functions.
Mr Travers previously worked at Myer Limited from 2006 to 2014. He was director of Strategic Planning and Human Resources before being appointed Executive General Manager Business Services and Strategic Planning in 2010, responsible for a range of business areas similar to his current position (including throughout his time at Myer, Procurement, Human Resources, Occupational Health and Safety, Sustainability, Shared Services, Corporate Affairs and the company’s Program Management Office) as well as leading the Office of the CEO from 2012, where he was responsible for the review and delivery of new business opportunities and strategy.
Mr Travers has experience in the mining sector, having worked with BHP in the Minerals division for seven years, mostly in human resources roles in manganese, coal and iron ore. Following this he worked for six years at Pratt Group, a privately owned paper and packaging business, and subsequently 11 years at WMC Resources.
He is a former director of the Institute of Public Affairs and the Australian Mines and Metals Association.
Mr Travers holds a Bachelor of Arts degree majoring in Economics from the University of Adelaide.
MR TROY HEY, ExECUTIVE GENERAL MANAGER – STAKEHOLDER RELATIONS
Mr Hey, aged 45, has served on the Executive Committee of the Company since August 2013 in his capacity as the Executive General Manager – Stakeholder Relations.
Prior to joining the Company as General Manager – Stakeholder and Investor Relations in April 2011, Mr Hey was the General Manager – Media and Reputation at Foster’s Group since 2005. He was previously the Group Manager – Public Affairs for WMC Resources Limited, up to its acquisition by BHP Billiton in 2005. He began his career in economic and public policy consultancy at the Allen Consulting Group and Australian Centre for Corporate Public Affairs, before working across the aviation, entertainment and mining sectors.
Mr Hey has over 20 years’ experience in government, media, community and investor relations, economic and public policy, industry association and communications management and is current Chair of the Principal Liaisons’ Committee of the International Council on Mining and Metals.
He has dual degrees in Law and Commerce from the University of Melbourne and is the recipient of an Australia‑Japan Foundation Language Scholarship at Kwansei Gakuin University, Nishinomiya, Japan.
MMG0024 AR15_PFO3.indd 41 8/04/16 4:37 PM
For
per
sona
l use
onl
y
42 MMG LiMited
diReCtoRS’ RepoRtThe Board of Directors of the Company (Board) is pleased to present the Annual Report together with the audited Financial Statements of the Group for the year ended 31 December 2015.
PrINCIPal aCTIVITIeS
The principal activities of the Group during the financial year were exploration, development and mining of zinc, copper, gold, silver and lead deposits around the world.
The full details of the principal activities of the Company’s subsidiaries are set out in Note 15 to the Financial Statements.
An analysis of the Group’s revenue for the year ended 31 December 2015 by reportable segments, together with their respective contributions to profit from operations (EBIT), is set out in Note 4 to the Financial Statements.
BUSINeSS reVIeW
A review of the business of the Group during the year, possible risks and uncertainties that the Group may be facing, and a discussion on the Group’s future business development are provided in the Chairman’s Review, CEO’s Report and the Management Discussion and Analysis sections.
Other than financial performance, the Group believes that a high standard of corporate social responsibility is essential for building good corporate and social relationships, motivating staff and creating a sustainable return to the Group. Discussions on the Group’s environmental policies and performance, relationships with its key Stakeholders and compliance with relevant laws and regulations which have a significant impact on the Group are provided on page 64 of this Annual Report.
MaJor CUSToMerS aND SUPPlIerS
During the year, sales to the largest customer and the five largest customers in aggregate accounted for approximately 27.6% and approximately 72.3% of the total sales of the Group respectively. Purchases from the five largest suppliers to the Group in aggregate accounted for approximately 14.5% of the total purchases of the Group during the year.
Apart from CMC, the ultimate controlling Shareholder, having an interest of approximately 88.4% in one of the five largest customers, none of the Directors or any of their close associates or any Shareholders (which to the knowledge of the Directors, owned more than 5% of the total number of issued shares of the Company) had any beneficial interest in any of the five largest customers or suppliers of the Group.
reSUlTS aND aPProPrIaTIoNS
The results of the Group for the year ended 31 December 2015 are set out in the Consolidated Income Statement in the Financial Statements on page 68 of this Annual Report.
No interim dividend was declared for 2015 (2014: nil). The Board does not recommend the payment of a final dividend for the year ended 31 December 2015 (2014: nil).
reSerVeS
Movements in reserves of the Group during the year are set out in Note 23 to the Financial Statements.
DISTrIBUTaBle reSerVeS
Details of the distributable reserves of the Company as at 31 December 2015 are set out in Note 23 to the Financial Statements.
ProPerTY, PlaNT aND eqUIPMeNT
Movements in property, plant and equipment during the year are set out in Note 13 to the Financial Statements.
BorroWINGS
Particulars of borrowings of the Group as at 31 December 2015 are set out in Note 24 to the Financial Statements.
During 2015 the Company and its subsidiaries did not enter into any new loan agreement that includes a condition imposing specific performance obligations on any controlling Shareholder and a breach of such an obligation would cause a default in respect of loans that are significant to the operations of the issuer.
LOAN AGREEMENTS WITH COVENANTS RELATING TO SPECIFIC PERFORMANCE OF THE CONTROLLING SHAREHOLDER
In accordance with the continuing disclosure requirements under Rule 13.21 of the Listing Rules, below are the details of the Group’s facility agreements that contain covenants requiring specific performance obligations of the controlling Shareholders.
FACILITIES GRANTED BY CHINA DEVELOPMENT BANK CORPORATION AND BANK OF CHINA LIMITED
On 13 June 2012, Album Resources and MMG Management, each a wholly owned subsidiary of the Company, entered into the US$751.0 million Facility, pursuant to which:
› CDB agreed to provide Album Resources with a US$366.0 million cash facility (Tranche A Facility). Such loan is to be repaid by instalment on the specified dates set out in the facility agreement, the last date of such repayment being 10 June 2017. Such facility has been fully drawn down and applied towards the refinancing of the US$366.0 million facility granted by CDB to Album Resources in 2009; and
MMG0024 AR15_PFO3.indd 42 8/04/16 4:37 PM
For
per
sona
l use
onl
y

43 AnnuAl RepoRt 2015
› BOC Sydney agreed to provide MMG Management with a US$385.0 million cash facility (Tranche B Facility). Such loan is to be repaid by instalment on the specified dates set out in the facility agreement, the last date of such repayment being 10 June 2017. Such facility has been fully drawn down and applied to an intra‑group loan extended by MMG Management to MMG Century Limited (MMG Century) to repay the US$385.0 million facility granted by BOC Sydney to MMG Century in 2010.
Pursuant to the terms of the US$751.0 million Facility, on the occurrence of the following events (among others), CDB and/or BOC Sydney may declare all outstanding loans under the Tranche A Facility and/or the Tranche B Facility immediately due and payable:
› CMN ceases to legally and beneficially own at least 51% of the total number of issued shares of the Company; or
› CMN (a) ceases to beneficially hold at least 51% of the total number of issued shares of Album Resources; or (b) does not have any of the following: (1) the power to cast, or control the casting of, at least 51% of the maximum number of votes that might be cast at a general meeting of Album Resources; or (2) the ability to appoint or remove all, or the majority, of the Directors of Album Resources; or (3) the power to give directions with respect to the operating and financial policies of Album Resources with which the Directors of Album Resources are obliged to comply.
On 27 June 2013, the Company, MMG Dugald River and certain other subsidiaries entered into a facility agreement with CDB and BOC Sydney in relation to the financing of the development and construction of the Dugald River project for an amount up to US$1 billion (Dugald River Facility). The Dugald River Facility will be available for drawdown until 27 June 2016, and is to be repaid by 26 June 2026. As at 31 December 2015, the amount of US$250.0 million was drawn under the Dugald River Facility.
Pursuant to the terms of the Dugald River Facility, on the occurrence of the following events (among others), CDB and/or BOC Sydney may declare all outstanding loans under the facility immediately due and payable:
› CMN ceases to legally and beneficially own, directly or indirectly, at least 51% of the total number of issued shares of the Company; or
› CMN ceases to have the power to (a) cast, or control the casting of, more than one half of the maximum number of votes that might be cast at a general meeting of the Company; or (b) appoint or remove all, or the majority, of the Directors or other equivalent officers of the Company; or (c) give directions with respect to the Company’s operating and financial policies with which the Directors or other equivalent officers of the Company are obliged to comply.
FACILITIES GRANTED BY CHINA DEVELOPMENT BANK
Album Resources has been granted by CDB a loan not exceeding US$200.0 million for a term of not more than seven years from 12 June 2009, during which the loan is to be repaid over the last five years, on the specified dates set out in the facility agreement (CDB 7‑year Facility). The CDB 7‑year Facility has been fully drawn down.
Pursuant to the CDB 7‑year Facility, CMN undertook, among other undertakings, that prior to repayment under the facility, CMN would remain a controlling Shareholder of certain subsidiaries of the Company, namely, Album Resources, Album Investment and MMG Century.
FACILITY GRANTED BY BANK OF CHINA LIMITED, SINGAPORE BRANCH
Album Resources has been granted by Bank of China Limited, Singapore Branch (BOC Singapore) a US$144.0 million cash facility, which is to be repaid by instalment on the specified dates set out in such facility agreement, the last date of such repayment being 10 June 2016 (BOC Singapore Facility). CMN acted as the guarantor of such facility.
Under the BOC Singapore Facility, a review event will occur in the event that Album Resources ceases to be a subsidiary of CMN, which event entitles the borrower to elect to repay all outstanding monies, or if such election is not made, the lender may declare all of the outstanding monies due and payable.
FACILITY GRANTED BY INDUSTRIAL AND COMMERCIAL BANK OF CHINA LIMITED
On 22 August 2012, MMG Finance Limited was granted by ICBC a US$150.0 million one‑year term facility. On 20 August 2013, ICBC agreed to extend its facility for a further term of one year. On 20 May 2014, ICBC and MMG Finance Limited entered into a US$300.0 million three‑year loan facility, to replace the US$150.0 million loan facility, which consists of a US$200.0 million term facility along with a US$100.0 million revolving facility for discretionary working capital. Under the facility, an event of default will occur in the event that the Company ceases to be a subsidiary of CMN or MMG Finance Limited ceases to be a wholly owned subsidiary of the Company, and the lender may declare all outstanding loans under the facilities immediately due and payable.
Please refer to the announcements of the Company on 10 January 2011, 14 June 2012, 22 August 2012, 27 June 2013, 20 August 2013 and 20 May 2014 for further details of the facilities referred to above.
MMG0024 AR15_PFO3.indd 43 8/04/16 4:37 PM
For
per
sona
l use
onl
y

44 MMG LiMited
fIVe-Year fINaNCIal SUMMarY
A summary of the results and of the assets and liabilities of the Group for the past five financial years is set out on pages 130 to 131 of this Annual Report.
Share CaPITal
Details of the movements in the Company’s share capital are set out in Note 22 to the Financial Statements.
DoNaTIoNS
Donations made by the Group during the year for charitable and community purposes amounted to approximately US$1.4 million.
DIreCTorS
The Directors of the Company who held office during the year and up to the date of this report are as follows:
CHAIRMAN
Mr Jiao Jian (Non‑executive Director)
ExECUTIVE DIRECTORS
Mr Andrew Michelmore (CEO)
Mr David Lamont (CFO) (Resigned on 9 December 2015)
Mr Xu Jiqing (Executive General Manager – China and Strategy)
NON‑ExECUTIVE DIRECTORS
Mr Wang Lixin (Resigned on 29 June 2015)
Mr Gao Xiaoyu
INDEPENDENT NON‑ExECUTIVE DIRECTORS
Dr Peter Cassidy
Mr Anthony Larkin (Retired on 20 May 2015)
Mr Leung Cheuk Yan
Ms Jennifer Seabrook (Appointed on 17 July 2015)
Professor Pei Ker Wei (Appointed on 24 July 2015)
In accordance with article 77 of the articles of association of the Company, Ms Jennifer Seabrook and Professor Pei Ker Wei will retire at the forthcoming annual general meeting (AGM) of the Company and, being eligible, offer themselves for re‑election.
In accordance with article 98 of the articles of association of the Company and Code Provision A.4.2 in Appendix 14 of the Listing Rules, Mr Andrew Michelmore, Dr Peter Cassidy and Mr Leung Cheuk Yan will retire by rotation at the Company’s forthcoming AGM and, being eligible, offer themselves for re‑election.
The Company has received from each of the Independent Non‑executive Directors an annual confirmation of independence pursuant to Rule 3.13 of the Listing Rules and considers them to be independent.
DIreCTorS’ SerVICe CoNTraCTS
No Director proposed for re‑election at the Company’s forthcoming AGM has an unexpired service contract that is not determinable by the Company or any of its subsidiaries within one year without payment of compensation, other than normal statutory compensation.
DIreCTorS’ INTereSTS IN CoNTraCTS of SIGNIfICaNCe
No contracts of significance to which the Company, any of its holding companies, or any of their subsidiaries was a party, in which a Director had a material interest, subsisted at the end of the year or at any time during the year.
DIreCTorS’ INTereSTS aND ShorT PoSITIoNS IN ShareS, UNDerlYING ShareS aND DeBeNTUreS
As at 31 December 2015, the interests and short positions of the Directors and the CEO of the Company or any of their associates in the shares, underlying shares and debentures of the Company or any of its associated corporations (within the meaning of Part XV of the Securities and Futures Ordinance (SFO)), which were required to be notified to the Company and the Stock Exchange pursuant to Divisions 7 and 8 of Part XV of the SFO (including interests and short positions which they are taken or deemed to have under such provisions of the SFO), or which were required to be recorded in the register required to be kept pursuant to Section 352 of the SFO or which were required to be notified to the Company and the Stock Exchange pursuant to the Model Code for Securities Transactions by Directors of Listed Issuers (Model Code) as set out in Appendix 10 of the Listing Rules were as follows:
DIRECTORS’ REpORT (COnTInUED)
MMG0024 AR15_PFO3.indd 44 8/04/16 4:37 PM
For
per
sona
l use
onl
y

45 AnnuAl RepoRt 2015
LONG POSITION IN THE SHARES AND THE UNDERLYING SHARES OF THE COMPANY AS AT 31 DECEMBER 2015
nAME OF DIRECTORnATURE OFInTEREST
nUMBER OF ShARES hElD1
nUMBER OF UnDERlyIng ShARES hElD
AppROXIMATE pERCEnTAgE OF TOTAl nUMBER
OF ISSUED ShARES (%)4OpTIOnS2
pERFORMAnCE AWARDS3
Andrew MICHELMORE Personal 1,463,000 28,150,200 15,100,000 0.85
XU Jiqing Personal – – 1,800,000 0.03
Notes:
1. The number of shares held by Mr Andrew Michelmore has increased to 1,463,000 following additional purchases of 572,000 shares of the Company in 2015.
2. The Directors’ interests in the underlying ordinary shares of the Company are through share options granted by the Company pursuant to the 2013 Share Option Scheme, details of which are set out under the section headed ’2013 Share Option Scheme’ on page 46 of this Annual Report.
3. The Directors’ interests in the underlying ordinary shares of the Company are through performance awards granted by the Company pursuant to the Long Term Incentive Equity Plan, details of which are set out under the section headed ’2015 Performance Awards’ on page 48 of this Annual Report.
4. The calculation is based on the number of ordinary shares and/or underlying ordinary shares as a percentage of the total number of issued ordinary shares of the Company (that is, 5,290,069,889 shares) as at 31 December 2015.
Save as disclosed above, as at 31 December 2015, none of the Directors or the CEO of the Company or any of their associates had any interests or short positions in any shares, underlying shares or debentures of the Company or any of its associated corporations (within the meaning of Part XV of the SFO), which were required to be notified to the Company and the Stock Exchange pursuant to Divisions 7 and 8 of Part XV of the SFO (including interests and short positions which they are taken or deemed to have under such provisions of the SFO), or which were required to be entered in the register required to be kept pursuant to Section 352 of the SFO or which were required to be notified to the Company and the Stock Exchange pursuant to the Model Code. In addition, none of the Directors or the CEO of the Company or any of their associates had been granted or had exercised any rights to subscribe for any equity or debt securities of the Company or any of its associated corporations (within the meaning of Part XV of the SFO) during the year ended 31 December 2015.
DIreCTorS’ INTereSTS IN CoMPeTING BUSINeSSeS
During the year ended 31 December 2015, the interests of Directors of the Company in a business that competes or is likely to compete with the businesses of the Group, as defined in the Listing Rules, are as follows:
1. Mr Jiao Jian, a Non‑executive Director and Chairman of the Company, is:
› the Vice President of CMC;
› a director and the President of CMNH (resigned as a director and President in February and January 2016, respectively);
› the Chairman and a director of CMN (resigned as President in January 2016);
› the Chairman of Album Enterprises;
› a director of Top Create;
› a director of HNG; and
› the Chairman of Copper Partners Investment.
2. Mr Xu Jiqing, an Executive Director of the Company, is:
› a director of CMN.
3. Mr Gao Xiaoyu, a Non‑executive Director of the Company, is:
› the Vice President of CMNH (resigned in January 2016);
› a director and the President of CMN (appointed as a director and President in February 2016); and
› a director of Top Create.
4. Mr Wang Lixin, a Non‑executive Director of the Company who resigned on 29 June 2015, is:
› an independent director of Maike Metals International Limited.
Although the Group and the above companies are involved in businesses in the same industry, they are separate companies operated by separate and independent management. The Company is therefore capable of carrying on its business independently of, and at arm’s length from, the CMC Group, HNG, Copper Partners Investment and Maike Metals International Limited.
PerMITTeD INDeMNITY aND DIreCTorS’ aND offICerS’ lIaBIlITY INSUraNCe
Pursuant to the articles of association of the Company and subject to the provisions of the Companies Ordinance, every Director or other officer of the Company shall be indemnified out of the assets of the Company against all loss and liabilities which he/she may sustain or incur in or about the execution of the duties of his/her office or otherwise in relation thereto, provided that such Article shall only have effect in so far as its provisions are not avoided by the Companies Ordinance. The Company has arranged appropriate Directors’ and officers’ liability insurance coverage for the Directors and officers of the Company during the year.
MMG0024 AR15_PFO3.indd 45 8/04/16 4:37 PM
For
per
sona
l use
onl
y

46 MMG LiMited
Share oPTIoN SCheMe
2004 SHARE OPTION SCHEME
The share option scheme adopted at the Company’s AGM held on 28 May 2004 (2004 Share Option Scheme) expired on 27 May 2014. No further options have been granted in accordance with the provisions thereunder but in all other respects the provisions of the 2004 Share Option Scheme shall remain in force to govern the exercise of all the options granted prior to such expiry. The exercise period for all options granted under the 2004 Share Option Scheme expired on 3 June 2015 and accordingly all options granted under the 2004 Share Option Scheme have lapsed due to the expiry of the exercise period.
During the year ended 31 December 2015, the movements of the options that have been granted under the 2004 Share Option Scheme were as follows:
CATEgORy AnD nAME OF pARTICIpAnT
DATE OF gRAnT1
EXERCISE pRICE pER
ShARE hk$
EXERCISE pERIOD
nUMBER OF OpTIOnS
BAlAnCE AS AT
1 JAnUARy 2015
gRAnTED DURIng
ThE yEAR
EXERCISED DURIng
ThE yEAR
CAnCEllED DURIng
ThE yEAR
lApSED DURIng
ThE yEAR2
BAlAnCE AS AT
31 DECEMBER 2015
DIRECTORS
JIAO Jian 3 June 2010
2.75 3 June 2012 to 2 June 2015
1,200,000 – – – (1,200,000) –
XU Jiqing 3 June 2010
2.75 3 June 2012 to 2 June 2015
1,000,000 – – – (1,000,000) –
EMPLOYEES OF THE GROUP
3 June 2010
2.75 3 June 2012 to 2 June 2015
1,400,000 – (462,000) – (938,000) –
TOTAL 3,600,000 – (462,000) – (3,138,000) –
Notes:
1. The closing price of the shares of the Company immediately before the date on which the options were granted was HK$2.69 per share.
2. This refers to options lapsed due to expiry of the exercise period.
2013 SHARE OPTION SCHEME
Pursuant to the share option scheme adopted at the extraordinary general meeting (EGM) of the Company held on 26 March 2013 (2013 Share Option Scheme), there were 138,711,140 options outstanding as at 31 December 2015, which represented approximately 2.62% of the total number of issued shares of the Company as at that date.
The following is a summary of the principal terms of the 2013 Share Option Scheme:
1. Purpose
The purpose of the 2013 Share Option Scheme is to enable the Company to grant awards to selected employees of the Group as incentives or rewards for their contribution or potential contribution to the development and growth of the Group.
2. Participants
The Company may grant an option to anyone who is an employee of the Company, its subsidiaries or any other company that is associated with the Company and is so designated by the Directors of the Company on the date of grant.
3. Total number of shares available for issue under the 2013 Share option Scheme
The total number of shares available for issue under the 2013 Share Option Scheme is 388,341,648 shares, representing approximately 7.34% of the total number of issued shares of the Company as at the date of this report.
4. Maximum entitlement of each participant
No option may be granted to any eligible person which, if exercised in full, would result in the total number of shares issued and to be issued upon exercise of the options already granted and to be granted to such eligible person under the 2013 Share Option Scheme (including exercised, cancelled and outstanding options) in the 12‑month period up to and including the date of such new grant exceeding 1% of the total number of issued shares of the Company as at the date of such new grant. Any grant of further options above this limit shall be subject to the requirements under the Listing Rules.
5. Period within which the shares must be taken up under an option
The Board may in its absolute discretion determine the period during which an option may be exercised, save that such period shall not be more than 10 years from the date on which such option is granted and accepted subject to the provisions for early termination.
DIRECTORS’ REpORT (COnTInUED)
MMG0024 AR15_PFO3.indd 46 8/04/16 4:37 PM
For
per
sona
l use
onl
y

47 AnnuAl RepoRt 2015
6. Minimum period for which an option must be held before it can be exercised
The minimum period for which an option must be held before it can be exercised is 12 months from the date of grant, subject to the Board having the right to determine a longer minimum period at the time of granting the option.
7. Time of acceptance and the amount payable on acceptance of the option
No amount is payable upon application or acceptance of an option.
8. Basis of determining the exercise price
The exercise price shall be determined by the Board at the time of grant of the relevant option and shall not be less than the highest of:
(i) the closing price per share of the Company as stated in the Stock Exchange’s daily quotations sheet on the date of grant of the relevant option; and
(ii) an amount equivalent to the average closing price per share of the Company as stated in the Stock Exchange’s daily quotations sheets for the five business days immediately preceding the date of grant of the relevant option.
9. The remaining life of the 2013 Share option Scheme
The 2013 Share Option Scheme will terminate on 26 March 2023 unless terminated earlier by the Board.
During the year ended 31 December 2015, the movements of the options that have been granted under the 2013 Share Option Scheme were as follows:
CATEgORy AnD nAME OF pARTICIpAnT
DATE OF gRAnT1
EXERCISE pRICE pER
ShARE hk$
EXERCISE pERIOD2
nUMBER OF OpTIOnS
BAlAnCE AS AT
1 JAnUARy 2015
gRAnTED DURIng
ThE yEAR
EXERCISED DURIng
ThE yEAR
CAnCEllED DURIng
ThE yEAR
lApSED DURIng
ThE yEAR3
BAlAnCE AS AT
31 DECEMBER 2015
DIRECTORS
Andrew MICHELMORE
9 April 2013
2.62 9 April 2016 to 8 April 2020
28,150,200 – – – – 28,150,200
David LAMONT
9 April 2013
2.62 9 April 2016 to 8 April 2020
6,240,582 – – – (6,240,582) –
EMPLOYEES OF THE GROUP
9 April 2013
2.62 9 April 2016 to 8 April 2020
119,451,940 – – – (8,891,000) 110,560,940
TOTAL 153,842,722 – – – (15,131,582) 138,711,140
Notes:
1. The closing price of the shares of the Company immediately before the date on which the options were granted was HK$2.45 per share.
2. The vesting period of the options is three years from the date of grant. The vesting of options is conditional upon the achievement of certain performance conditions as set out in the respective letters of grant, including among others, achievement of financial, reserves and market‑related performance targets during the vesting period. Achievement of Company and individual performance conditions has resulted in 65.9% of the 2013 options granted to participants to vest on or about 9 April 2016. The vested options cannot be exercised until the first occasion the MMG share price exceeds the exercise price of $HK2.62.
3. Options lapsed due to cessation of employment.
MMG0024 AR15_PFO3.indd 47 8/04/16 4:37 PM
For
per
sona
l use
onl
y

48 MMG LiMited
PerforMaNCe aWarDS
2015 PERFORMANCE AWARDS
On 19 May 2015 the Company granted performance awards to the eligible participants pursuant to the long‑term incentive equity plan (Long Term Incentive Equity Plan) adopted by the Company (2015 performance awards). There were 76,087,500 performance awards outstanding as at 31 December 2015, representing approximately 1.44% of the total number of issued shares of the Company as at that date.
During the year ended 31 December 2015, the movements of the 2015 performance awards were as follows:
CATEgORy AnD nAME OF pARTICIpAnT
DATE OF gRAnT
nUMBER OF pERFORMAnCE AWARDS
BAlAnCE AS AT
1 JAnUARy 2015
gRAnTED DURIng ThE
yEAR
EXERCISED DURIng ThE
yEAR
CAnCEllED DURIng
ThE yEAR
lApSED DURIng ThE
yEAR
BAlAnCE AS AT
31 DECEMBER 2015
DIRECTORS
Andrew MICHELMORE
19 May 2015 – 15,100,000 – – – 15,100,000
David LAMONT 19 May 2015 – 2,600,000 – – (2,600,000) –
XU Jiqing 19 May 2015 – 1,800,000 – – – 1,800,000
EMPLOYEES OF THE GROUP
19 May 2015 – 60,267,500 – – (1,080,000) 59,187,500
TOTAL – 79,767,500 – – (3,680,000) 76,087,500
The performance awards are granted for nil cash consideration. The vesting of the performance awards will be subject to the achievement by each participant of certain performance conditions, among other things, independently assessed measures of achievement of resources growth and financial and market‑related targets. The performance period is a three‑year period from 1 January 2015 to 31 December 2017. Time of vesting will be on or around April 2018. Portions of the vested performance awards will be subject to holding locks for various periods of up to three years after vesting.
SUBSTaNTIal ShareholDerS’ INTereSTS aND ShorT PoSITIoNS IN The ShareS aND UNDerlYING ShareS of The CoMPaNY
So far as is known to the Directors and CEO of the Company, as at 31 December 2015, the following persons had interests or short positions in the shares or underlying shares of the Company that were required to be disclosed to the Company under the provisions of Divisions 2 and 3 of Part XV of the SFO, or, that were recorded in the register required to be kept by the Company under Section 336 of the SFO:
DIRECTORS’ REpORT (COnTInUED)
MMG0024 AR15_PFO3.indd 48 8/04/16 4:37 PM
For
per
sona
l use
onl
y

49 AnnuAl RepoRt 2015
LONG POSITION IN THE SHARES OF THE COMPANY AS AT 31 DECEMBER 2015
nAME CApACITynUMBER OF
ShARES hElD
AppROXIMATE pERCEnTAgE OF
TOTAl nUMBER OF ISSUED ShARES (%)1
China Minmetals Corporation (CMC) Interest of controlled corporations 2,3,4 3,898,110,916 73.69
China Minmetals Corporation Limited (CMCL) Interest of controlled corporations 2,3,4 3,898,110,916 73.69
China Minmetals Non‑ferrous Metals Holding Company Limited (CMNH) Interest of controlled corporations 2,3,4 3,898,110,916 73.69
China Minmetals Non‑ferrous Metals Company Limited (CMN) Interest of controlled corporations 2,3,4 3,898,110,916 73.69
Album Enterprises Limited (Album Enterprises) Beneficial owner2,4 2,276,800,860 43.04
Top Create Resources Limited (Top Create) Beneficial owner3,4 1,621,310,056 30.65
China Minmetals H.K. (Holdings) Limited (Minmetals HK) Beneficial owner4 3,898,110,916 73.69
Notes:
1. The calculation is based on the number of ordinary shares that each person is interested in (whether directly/indirectly interested or deemed to be interested) as a percentage of the total number of issued ordinary shares (that is, 5,290,069,889 shares) of the Company as at 31 December 2015.
2. Album Enterprises is a wholly owned subsidiary of CMN, which in turn is owned as to approximately 99.999% by CMNH and approximately 0.001% by CMCL. CMNH is a wholly owned subsidiary of CMCL. CMCL is owned as to approximately 87.5% by CMC and approximately 0.8% by China National Metal Products Co. Ltd., which in turn is a wholly owned subsidiary of CMC. Accordingly, CMN, CMNH, CMCL and CMC were by virtue of the SFO deemed to be interested in the 2,276,800,860 shares of the Company held by Album Enterprises as at 31 December 2015.
3. Top Create is a wholly owned subsidiary of CMN. Accordingly, CMN, CMNH, CMCL and CMC were by virtue of the SFO deemed to be interested in the 1,621,310,056 shares of the Company held by Top Create as at 31 December 2015.
4. As disclosed in the Company’s announcement dated 7 January 2016, a conditional sale and purchase agreement (SP Agreement) dated 31 December 2015 was entered into among Album Enterprises and Top Create as vendors and Minmetals HK as purchaser in relation to the share transfer under which each of Album Enterprises and Top Create has agreed to transfer all its shares in the Company, that is, approximately 43.04% and 30.65%, respectively, to Minmetals HK (Share Transfer). The consideration for the Share Transfer will be settled by Minmetals HK issuing new shares to Album Enterprises and Top Create in proportion to their respective existing shareholdings in the Company. After the Share Transfer, Minmetals HK will hold in total approximately 73.69% of the shares of the Company and be owned by Album Enterprises, Top Create and CMCL as to approximately 34.59%, 24.63% and 40.78%, respectively. The Share Transfer is subject to, among other conditions precedent, waiver by the Securities and Futures Commission of Hong Kong of the mandatory general offer obligation of Minmetals HK and persons acting in concert with it for the shares of the Company as a result of the Share Transfer pursuant to Note 6 to Rule 26.1 of the Hong Kong Code on Takeovers and Mergers having been obtained. Such condition cannot be waived by the parties to the SP Agreement.
Save as disclosed above, as at 31 December 2015, there was no other person who was recorded in the register of the Company, as having an interest or short positions in the shares or underlying shares of the Company who was required to be disclosed to the Company under the provisions of Divisions 2 and 3 of Part XV of the SFO, or, who was recorded in the register required to be kept by the Company under Section 336 of the SFO.
CoNNeCTeD TraNSaCTIoNS
During the year ended 31 December 2015 the Group had the following material connected transactions, details of which are set out below:
1. On 22 July 2014, MMG SA entered into an unsecured acquisition finance facility agreement for a four‑year term with Top Create pursuant to which Top Create agreed to make available to MMG SA up to US$2,262 million for the purpose of contributing the equity interest of MMG
SA to the joint venture established for the purpose of the acquisition of the Las Bambas Project (Las Bambas Facility). During the year ended 31 December 2015, approximately US$418 million was advanced under the Las Bambas Facility. The Las Bambas Facility is now fully drawn.
Top Create is a substantial Shareholder, and is therefore a connected person of the Company under the Listing Rules. Accordingly, the Las Bambas Facility constitutes a connected transaction for the Company under Chapter 14A of the Listing Rules.
2. On 17 December 2014 MMG Finance Limited entered into a one‑year loan facility agreement with Album Enterprises pursuant to which MMG Finance Limited agreed to make available to Album Enterprises up to US$80 million for the working capital requirements of Album Enterprises (Album Loan Facility). During the year ended 31 December 2015, US$70 million was advanced under the Album Loan Facility.
MMG0024 AR15_PFO3.indd 49 8/04/16 4:37 PM
For
per
sona
l use
onl
y

50 MMG LiMited
Album Enterprises is a substantial Shareholder, and is therefore a connected person of the Company under the Listing Rules. Accordingly, the Album Loan Facility constitutes a connected transaction for the Company under Chapter 14A of the Listing Rules.
3. During 2015, the Group sold copper, zinc and lead concentrates to Minmetals North‑Europe AB (Concentrate Sale Agreements). Each of the Concentrate Sale Agreements was required to be aggregated with each other. Details of the Concentrate Sale Agreements are set out below:
DATE pRODUCT* gROUp MEMBER
2 June 2015 20,000 tonnes Zinc Concentrate
MMG Century
29 July 2015 10,000 tonnes Lead Concentrate
MMG Century
30 September 2015
5,000 tonnes Lead Concentrate
MMG Century
30 September 2015
4,000 tonnes Lead Concentrate
MMG Golden Grove
30 September 2015
10,000 tonnes Copper Concentrate
MMG Golden Grove
* Tonnes are approximate dry metric tonnes.
The total value of sales to Minmetals North‑Europe AB under the Concentrate Sale Agreements up to 31 December 2015 was approximately US$39.8 million.
Minmetals North‑Europe AB is a subsidiary of CMC and is therefore an associate of CMC and a connected person of the Company under the Listing Rules. Accordingly, the Concentrate Sale Agreements each constitute a connected transaction for the Company under Chapter 14A of the Listing Rules.
4. On 23 January 2015 MMG Exploration Pty Ltd entered into an option and joint venture agreement (Option and Joint Venture Agreement) with Abra Mining Pty Ltd (Abra Mining) granting MMG Exploration Pty Ltd an option to form an unincorporated joint venture with Abra Mining in relation to the Abra Mining exploration project located in Western Australia, and the option to acquire a mining lease at a price to be agreed.
During the option period (of up to two years from the date of the Option and Joint Venture Agreement) MMG Exploration has the exclusive right to carry out exploration on the tenements at its sole discretion and has the obligation to, among other things, keep the tenements in good standing. Required expenditure to maintain the tenements in good standing in the
amount of approximately A$1.9 million (equivalent to approximately US$1.4 million) was spent in 2015.
Abra Mining is a wholly owned subsidiary of Hunan Non‑Ferrous Metals Corporation Ltd, which is an indirectly owned subsidiary of CMC, the ultimate controlling Shareholder. As Abra Mining is an associate of CMC it is therefore a connected person of the Company under the Listing Rules and the Option and Joint Venture Agreement constitutes a connected transaction for the Company under Chapter 14A of the Listing Rules.
5. On 19 May 2015 the Company announced that it had granted performance awards to Executive Directors of the Company. Of the total 84,087,500 performance awards granted, 15,100,000 were granted to Mr Andrew Michelmore, CEO and an Executive Director of the Company, who is a connected person of the Company.
Based on the closing price of HK$3.30 per share as quoted on the Stock Exchange on 19 May 2015, the market value of the underlying award shares that are the subject of the performance awards granted to Mr Andrew Michelmore was approximately HK$49.8 million (equivalent to approximately US$6.4 million).
CoNTINUING CoNNeCTeD TraNSaCTIoNS
During the year ended 31 December 2015, the Group had the following material continuing connected transactions, details of which are set out below:
1. On 27 June 2014, MMG SA entered into an agreement with CMN in relation to the sale of copper concentrate to be purchased by MMG SA from the Las Bambas Project to the CMN Group (Las Bambas CMN Copper Sale Framework Agreement), subject to the approval of the Independent Shareholders. The Independent Shareholders approved the Las Bambas CMN Copper Sale Framework Agreement, and the proposed annual caps on sales, at the EGM held on 21 July 2014.
The term of the Las Bambas CMN Copper Sale Framework Agreement is for the term of the life of the Las Bambas mine. Under the Las Bambas CMN Copper Sale Framework Agreement, the annual caps are set as a fixed quantity of copper contained in copper concentrate from the Las Bambas Project to be sold by MMG SA to members of the CMN Group in a year, which for the year commencing 1 January 2015 was set at 143,000 tonnes. No products sales by MMG SA to CMN during the year ended 31 December 2015 occurred as the Las Bambas Project was not in production.
CMN is a controlling Shareholder, and is therefore a connected person of the Company under the Listing Rules. Accordingly, the Las Bambas CMN Copper Sale Framework Agreement constitutes a continuing connected transaction for the Company under Chapter 14A of the Listing Rules.
DIRECTORS’ REpORT (COnTInUED)
MMG0024 AR15_PFO3.indd 50 8/04/16 4:37 PM
For
per
sona
l use
onl
y

51 AnnuAl RepoRt 2015
2. On 23 December 2014 LXML entered into an agreement with CMN in relation to the sale of copper cathodes by LXML to the CMN Group (LXML Copper Cathode Sale Agreement) for the period from 1 January 2015 to 30 June 2015.
The maximum aggregate amount to be paid under the LXML Copper Cathode Sale Agreement for the period from 1 January 2015 to 30 June 2015 was US$80 million. The total value of sales of copper cathode by the Company to CMN during the period from 1 January 2015 to 30 June 2015 under the LXML Copper Cathode Sale Agreement was approximately US$72.8 million. The transactions under this agreement became subject to the caps imposed by the agreement described in paragraph 3 below.
CMN is a controlling Shareholder, and is therefore a connected person of the Company under the Listing Rules. Accordingly, the LXML Copper Cathode Sale Agreement constitutes a continuing connected transaction for the Company under Chapter 14A of the Listing Rules.
3. On 24 March 2015 the Company announced that it had entered into an agreement with CMN in relation to the sale of copper cathodes by LXML to the CMN Group (Copper Cathode Sales Framework Agreement), subject to the approval of the Independent Shareholders, for the period from 1 January 2015 to 31 December 2017. The Independent Shareholders approved the Copper Cathode Sales Framework Agreement, and the proposed annual caps on sales, at the Company’s AGM held on 20 May 2015.
The annual cap for sales under the Copper Cathode Sales Framework Agreement for the year ended 31 December 2015 was US$188 million. The total value of sales of copper cathode by the Company to CMN during the year ended 31 December 2015, including those under the LXML Copper Cathode Sale Agreement (which became subject to the annual caps following approval of the Copper Cathode Sales Framework Agreement) was approximately US$130.5 million.
CMN is a controlling Shareholder, and is therefore a connected person of the Company under the Listing Rules. Accordingly, the Copper Cathode Sales Framework Agreement constitutes a continuing connected transaction for the Company under Chapter 14A of the Listing Rules.
4. On 12 January 2015 the Company announced that it had entered into a framework agreement with Minmetals Shipping (Singapore) Pte Ltd (Minmetals Shipping) in relation to the provision of ocean transport by Minmetals Shipping for the shipment of the products of the Group (Shipping Framework Agreement) for the period from 13 January 2015 to 31 December 2015.
The maximum aggregate amount to be paid under the Shipping Framework Agreement for the period ended
31 December 2015 was US$5.0 million. The total value of services provided under the Shipping Framework Agreement during the year ended 31 December 2015 was nil.
Minmetals Shipping is a wholly owned subsidiary of CMC and is therefore an associate of CMC and a connected person of the Company under the Listing Rules. Accordingly, the Shipping Framework Agreement constitutes a continuing connected transaction for the Company under Chapter 14A of the Listing Rules.
5. On 20 December 2010 MMG Management, a wholly owned subsidiary of the Company, entered into an agreement for the supply of goods with Minmetals Australia Pty Ltd pursuant to which MMG Management agreed to purchase hot roll‑forged and hand‑forged grinding media from Minmetals Australia Pty Ltd (Minmetals Supply Agreement) for a term of two years commencing 20 December 2010.
Since December 2012 the Minmetals Supply Agreement has been renewed each year for a further year effective from 1 January, for each of the 2013, 2014 and 2015 financial years. The maximum aggregate amount to be paid under the Minmetals Supply Agreement in 2015 was US$4.0 million. For the year ended 31 December 2015, there were transactions under the Minmetals Supply Agreement to the value of approximately US$1.9 million.
On 28 December 2015 MMG Management agreed to further renew the Minmetals Supply Agreement for a further year effective from 1 January 2016. The maximum aggregate amount to be paid under the Minmetals Supply Agreement in 2015 is US$2.0 million.
Minmetals Australia Pty Ltd is a subsidiary of CMC and is therefore an associate of CMC and a connected person of the Company under the Listing Rules. Accordingly, the Minmetals Supply Agreement constitutes a continuing connected transaction for the Company under Chapter 14A of the Listing Rules.
Upon the completion of the acquisition of Minerals and Metals Group on 31 December 2010 (Completion Date), the following material continuing transactions became continuing connected transactions with effect from the Completion Date (Grandfathered Continuing Connected Transactions) and details of these transactions for the year ended 31 December 2015 are set out below:
6. On 10 June 2010 MMG Management, a wholly owned subsidiary of the Company, entered into a loan facility agreement with Album Enterprises (Grandfathered MMG Loan Facility) pursuant to which MMG Management agreed to make loan facilities available to Album Enterprises on an uncommitted basis. During the year ended 31 December 2015, no amounts were advanced or outstanding under the Grandfathered MMG Loan Facility.
MMG0024 AR15_PFO3.indd 51 8/04/16 4:37 PM
For
per
sona
l use
onl
y

52 MMG LiMited
Album Enterprises is a substantial Shareholder, and is therefore a connected person of the Company under the Listing Rules. Accordingly, the Grandfathered MMG Loan Facility constitutes a Grandfathered Continuing Connected Transaction for the Company under Chapter 14A of the Listing Rules, and the Company will comply with Listing Rule 14A.60 in respect of this transaction.
7. MMG Laos Holdings is a party to a Mineral Exploration and Production Agreement (MEPA) with the Government of Laos dated 15 June 1993 (as amended). The MEPA, among other things, grants a licence to operate the project contemplated by the MEPA, being the Sepon project in Laos, which licence terms are in addition to rights granted by relevant Lao law in respect of mining operations. In accordance with the terms of the MEPA, LXML was established and incorporated in Laos to conduct the activities contemplated under the MEPA. Under the MEPA, LXML is appointed the sole contractor for the Government of Laos with respect to the area on which the Sepon project is located. The MEPA sets out the terms and conditions for LXML’s mining and processing operations, and exploration activity, with respect to gold and copper in Laos, and confirms the taxes payable by LXML and concessions granted by the Government of Laos to LXML in respect of such taxes. For the year ended 31 December 2015, the actual amount payable under the MEPA was approximately US$66.5 million, being an aggregated amount of all taxes and royalties payable to the Government of Laos pursuant to the MEPA.
The Government of Laos holds a 10% equity interest in LXML, and is therefore a connected person of the Company under the Listing Rules. Accordingly, the transactions under the MEPA constitute Grandfathered Continuing Connected Transactions for the Company under Chapter 14A of the Listing Rules. The transactions between LXML and the Government of Laos became connected transactions for the Company on 31 December 2010 following the acquisition of Minerals and Metals Group by the Company, and the Company will comply with Listing Rule 14A.60 in respect of these transactions subject to Listing Rule 14A.101 and the terms of the waiver of the Listing Rules discussed below.
8. On 26 February 2004 LXML, a 90% owned subsidiary of the Company, entered into a Power Purchase Agreement with Electricité Du Laos (EDL), pursuant to which LXML agreed to purchase energy from EDL for the purposes of operating the Sepon mine in Laos (Power Purchase Agreement). The total consideration payable under the Power Purchase Agreement is subject to levels of energy consumption which vary from year to year. The Power Purchase Agreement was amended by agreement of the parties in July 2012 to include the provision by EDL of operations and maintenance services to LXML, including maintenance of transmission lines and the
power substation. For the year ended 31 December 2015, the actual amount payable under the Power Purchase Agreement was approximately US$29.4 million.
EDL is a state‑owned corporation operated by the Ministry for Energy and Mines, which is a department of the Government of Laos. The Government of Laos is a connected person of the Company under the Listing Rules. Accordingly, the transactions under the Power Purchase Agreement constitute Grandfathered Continuing Connected Transactions for the Company under Chapter 14A of the Listing Rules, and the Company will comply with Listing Rule 14A.60 in respect of these transactions subject to the terms of Listing Rule 14A.101 and the waiver of the Listing Rules discussed below.
The Company has followed its pricing policies and guidelines when determining the price and terms of the connected transactions and continuing connected transactions conducted during the year.
WaIVer of lISTING rUleS
On 12 April 2012 the Company announced that it had applied to the Stock Exchange, and the Stock Exchange had agreed to waive the announcement, annual review and Independent Shareholders’ approval requirements under Chapter 14A of the Listing Rules for any connected transactions or continuing connected transactions entered into or to be entered into between the Company and the Government of Laos and its associates in relation to the Sepon mine and other mines in Laos, which are of a revenue nature in the ordinary and usual course of the Company’s business and on normal commercial terms (Laos Waiver).
The Laos Waiver is subject to certain conditions, including that the Company is required to disclose details of connected transactions and continuing connected transactions with the Government of Laos and its associates in the Company’s annual reports under Rule 14A.71 of the Listing Rules. The continuing connected transactions described above in items 7 and 8 have been reported in accordance with these requirements.
reVIeW of CoNTINUING CoNNeCTeD TraNSaCTIoNS
The continuing connected transactions described above for the year ended 31 December 2015 have been reviewed by the Independent Non‑executive Directors of the Company. As noted above, the Independent Non‑executive Directors of the Company were not required to review continuing connected transactions that were subject to the Laos Waiver.
The Independent Non‑executive Directors of the Company have confirmed that the continuing connected transactions have been entered into:
(a) in the ordinary and usual course of business of the Group;
(b) either on normal commercial terms or better; and
DIRECTORS’ REpORT (COnTInUED)
MMG0024 AR15_PFO3.indd 52 8/04/16 4:37 PM
For
per
sona
l use
onl
y

53 AnnuAl RepoRt 2015
(c) in accordance with the respective terms of the LXML Copper Cathode Sale Agreement, the Copper Cathode Sales Framework Agreement, the Minmetals Supply Agreement and the MEPA that are fair and reasonable, in the interests of the Shareholders as a whole.
The Company’s auditor was engaged to report on the Group’s continuing connected transactions in accordance with the Hong Kong Standard on Assurance Engagements 3000: ‘Assurance Engagements Other Than Audits or Reviews of Historical Financial Information’ and with reference to Practice Note 740 Auditor’s Letter on Continuing Connected Transactions under the Hong Kong Listing Rules issued by the Hong Kong Institute of Certified Public Accountants. The auditor was not required to review continuing connected transactions that were subject to the Laos Waiver. The auditor has issued their unqualified letter containing their findings and conclusions in respect of the continuing connected transactions for the year ended 31 December 2015 disclosed above in accordance with Rule 14A.56 of the Listing Rules. A copy of the auditor’s letter has been provided by the Company to the Stock Exchange.
In addition, the auditor of the Company has confirmed to the Board that nothing has come to their attention that causes them to believe that the above continuing connected transactions for the year ended 31 December 2015:
(a) have not been approved by the Board;
(b) were not, in all material respects, in accordance with the pricing policies of the Group where the transactions involve the provision of goods by the Group;
(c) were not entered into, in all material respects, in accordance with the relevant agreements governing the transactions; and
(d) the Las Bambas CMN Copper Sale Framework Agreement, the LXML Copper Cathode Sale Agreement, the Copper Cathode Sales Framework Agreement, the Shipping Framework Agreement, the Minmetals Supply Agreement and the Grandfathered MMG Loan Facility have not exceeded the respective annual caps as disclosed in the announcements of the Company dated 27 June 2014 (for the Las Bambas CMN Copper Sale Framework Agreement), 23 December 2014 (for the LXML Copper Cathode Sale Agreement), 13 January 2015 (for the Shipping Framework Agreement), 24 March 2015 (for the Copper Cathode Sales Framework Agreement), 28 December 2015 (for the Minmetals Supply Agreement) and 28 March 2011 (for the Grandfathered MMG Loan Facility).
CoNTrollING ShareholDerS’ INTereSTS IN CoNTraCTS
On 22 July 2014 Top Create, a subsidiary of CMN, a controlling Shareholder, extended a loan facility in the principal sum of US$2,262.0 million to MMG SA for a term of four years for the purpose of acquiring the Las Bambas Project. MMG SA drew approximately US$1,844.0 million on 22 July 2014 and US$417.5 million on 16 February 2015. Such loan facility was exempt from the announcement and reporting requirements of the Listing Rules with respect to connected transactions on the basis that it was unsecured and on normal commercial terms.
Particulars of other contracts of significance that exist between the Company (or one of its subsidiary companies) and a controlling Shareholder (or any of its subsidiaries) are set out under Connected Transactions on pages 49 to 52 of this Annual Report.
relaTeD ParTY TraNSaCTIoNS
Details of the related party transactions undertaken in the normal course of business are set out in Note 30 to the Financial Statements.
Related party transactions set out in Notes 30(a) and 30(d) to the Financial Statements also constitute connected transactions and continuing connected transactions of the Company under the Listing Rules. The Company has complied with the disclosure requirements in accordance with Chapter 14A of the Listing Rules except for those transactions that are exempt from the disclosure requirements in Chapter 14A of the Listing Rules.
MaNaGeMeNT CoNTraCTS
No contracts concerning the management and administration of the whole or any substantial part of the business of the Company were entered into or existed during the year.
PUrChaSe, Sale or reDeMPTIoN of The CoMPaNY’S lISTeD SeCUrITIeS
During the year ended 31 December 2015, neither the Company nor any of its subsidiaries purchased, sold or redeemed any of the Company’s listed securities.
MMG0024 AR15_PFO3.indd 53 8/04/16 4:37 PM
For
per
sona
l use
onl
y

54 MMG LiMited
eMolUMeNT PolICY
The Group’s Emolument Policy is formulated by the Remuneration Committee on the basis of employees’ merit, market practice, qualifications and competence.
The determination of remuneration for the Directors of the Company takes into consideration factors such as remuneration paid by comparable companies, accountabilities of the Directors, applicable regional employment conditions and appropriate ’at‑risk’ performance‑based remuneration.
The Company has adopted share option schemes and performance awards as incentives to the Executive Directors and eligible employees. Details of the share option schemes and performance awards are set out under the sections headed ‘Share Option Schemes’ and ‘Performance Awards’. In relation to MMG, it has adopted both long‑term and short‑term ’at‑risk’ incentive plans to reward its Directors and eligible employees and to align their incentive remuneration with the performance of MMG.
reTIreMeNT SCheMeS
Details of the Group’s retirement schemes are set out in Note 11(B) to the Financial Statements.
DIreCTorS aND SeNIor MaNaGeMeNT
Particulars of the Directors and senior management of the Company are set out on pages 38 to 41 of this Annual Report.
aUDITor
The consolidated Financial Statements have been audited by PricewaterhouseCoopers, which has been continuously engaged since 2002. PricewaterhouseCoopers will retire at the forthcoming AGM due to their years of audit service exceeding the time limit prescribed by the State‑owned Assets Supervision and Administration Commission of the State Council of the PRC (SASAC). The Board has resolved to propose the appointment of Deloitte Touche Tohmatsu as the auditor of the Company following the retirement of PricewaterhouseCoopers subject to the approval of the Shareholders at the forthcoming AGM.
CorPoraTe GoVerNaNCe rePorT
Details of the Corporate Governance Report are set out on pages 55 to 64 of this Annual Report.
SUffICIeNCY of PUBlIC floaT
Based on information that is publicly available to the Company and within the knowledge of its Board, as at the latest practicable date prior to the printing of this report, the Company has maintained sufficient public float of not less than 25% of the Company’s issued shares as required under the Listing Rules.
eVeNT afTer The BalaNCe SheeT DaTe
Other than the matters outlined elsewhere in this report, there have been no matters that have occurred subsequent to the reporting date which have significantly affected, or may significantly affect the Group’s operations, results or state of affairs in future years.
STraTeGY
MMG’s objective is to be valued as one of the world’s top mid‑tier miners by 2020.
To achieve this objective, we deliver value through four strategic drivers:
› Growth – we acquire and discover base metals assets that transform our business. We unlock the potential value of our project pipeline;
› Operations Transformation – we develop effective plans to deliver innovative growth opportunities and improve productivity;
› People and Organisation – we provide a healthy, secure and safe workplace and a culture that values collaboration, accountability and respect; and
› Reputation – we are valued for our commitment to progress, long‑term partnerships and international management.
By order of the Board
Jiao Jian Chairman 9 March 2016
DIRECTORS’ REpORT (COnTInUED)
MMG0024 AR15_PFO3.indd 54 8/04/16 4:37 PM
For
per
sona
l use
onl
y

55 AnnuAl RepoRt 2015
The Company is committed to maintaining a high standard of corporate governance practices by emphasising a quality Board, sound internal controls, and transparency and accountability to all Shareholders.
CorPoraTe GoVerNaNCe
The Company has complied with all the code provisions set out in the Corporate Governance Code and Corporate Governance Report contained in Appendix 14 of the Listing Rules throughout the year ended 31 December 2015, except for the deviations from code provisions as explained and disclosed below in this Corporate Governance Report.
On 20 May 2015 Mr Anthony Larkin resigned as an Independent Non‑executive Director, Chairman of the Audit Committee and a member of the Remuneration and Nomination Committee of the Company. For a brief period due to the time taken to appoint a suitable replacement, the Company did not meet the requirements under Rules 3.10, 3.10A, 3.21, 3.25 and Code Provision A.5.1 in Appendix 14 of the Listing Rules until Ms Jennifer Seabrook was appointed as Independent Non‑executive Director and the Chair of the Audit Committee of the Company on 17 July 2015. Following Ms Seabrook’s appointment, the Company also appointed Professor Pei Ker Wei as an Independent Non‑executive Director of the Company on 24 July 2015, increasing the total number of Independent Non‑executive Directors of the Company to four.
On 29 June 2015 Mr Wang Lixin resigned as Non‑executive Director of the Company. Following his resignation, the Remuneration and Nomination Committee of the Company comprises a majority of Independent Non‑executive Directors as required under Rule 3.25 and Code Provision A.5.1 in Appendix 14 of the Listing Rules respectively.
The Company adopted a Board Charter to outline the manner in which its constitutional powers and responsibilities will be exercised, delegated and/or discharged, having regard to principles of good corporate governance, international best practice and applicable laws. The Board Charter is adopted on the basis that strong corporate governance can add to the performance of the Company, create Shareholder value and engender the confidence of the investment market.
DIreCTorS’ SeCUrITIeS TraNSaCTIoNS
The Company has adopted a model code for securities trading by Directors of the Company (Securities Trading Model Code) on terms no less exacting than the required standard of the Model Code as set out in Appendix 10 of the Listing Rules.
Specific enquiry was made with all the Directors and all confirmed that they have complied with the requirements set out in the Model Code and the Securities Trading Model Code during the year ended 31 December 2015.
BoarD
COMPOSITION
The Board currently comprises eight Directors of which two are Executive Directors, two are Non‑executive Directors and four are Independent Non‑executive Directors. Independent Non‑executive Directors represent half of the Board.
The members of the Board as at the date of this report are as follows:
executive Directors
Mr Andrew MICHELMORE (CEO)
Mr XU Jiqing (Executive General Manager – China and Strategy)
Non-executive Directors
Mr JIAO Jian (Chairman)
Mr GAO Xiaoyu
Independent Non-executive Directors
Dr Peter CASSIDY
Mr LEUNG Cheuk Yan
Ms Jennifer SEABROOK
Professor PEI Ker Wei
The current Board possesses an appropriate balance of skills, experience and diversity of perspectives relevant to the management of the Company’s business. The Directors’ biographical information is set out on pages 38 to 41 under the section headed ‘Directors and Senior Management’ of this Annual Report.
ROLE AND FUNCTION
The Board formulates overall strategies and policies of the Group. It also ensures the availability of adequate capital and managerial resources to implement the strategies adopted, the adequacy of systems of financial and internal control and the conduct of business in conformity with applicable laws and regulations. The Board members are fully committed to their roles and have acted in the best interests of the Group and its Shareholders at all times. There is no financial, business, family or other material/relevant relationship among the Directors.
All Directors are required to comply with Rule 3.08(d) of the Listing Rules to avoid actual and potential conflicts of interest and duty at all times. Directors are required to declare their interest in the matters to be considered at each Board meeting and Board committee meeting. If a Director or any of his/her associates has material interest in the matter to be considered, the Director will not be counted in the quorum, nor allowed to vote at the meeting. The Director may also be required to withdraw from the meeting during discussion of the matter.
CoRpoRAte GoveRnAnCe RepoRt
MMG0024 AR15_PFO3.indd 55 8/04/16 4:37 PM
For
per
sona
l use
onl
y

56 MMG LiMited
Board meetings are held regularly, approximately six times a year, and are also held on an ad hoc basis as required by business needs. Regular Board meetings and ad hoc Board meetings are attended by a majority of the Directors in person or through electronic means of communication.
During the year ended 31 December 2015, other than resolutions passed in writing by all the Directors, the Company held six regular Board meetings and one ad hoc Board meeting. The Company also held one AGM on 20 May 2015.
The attendance of each Director at the Board meetings and the AGM is set out below. Figures in brackets indicate the maximum number of meetings held in the period in which the individual was a Board member.
DIRECTORS
nUMBER OF MEETIngS ATTEnDED
BOARD MEETIngS AgM
ExECUTIVE DIRECTORS
Andrew MICHELMORE 7/(7) 1/(1)
David LAMONT1 7/(7) 1/(1)
XU Jiqing 7/(7) 1/(1)
NON‑ExECUTIVE DIRECTORS
JIAO Jian (Chairman) 7/(7) 1/(1)
WANG Lixin2,3 1/(2) 1/(1)
GAO Xiaoyu 7/(7) 1/(1)
INDEPENDENT NON‑ExECUTIVE DIRECTORS
Peter CASSIDY 7/(7) 1/(1)
Anthony LARKIN4 2/(2) 1/(1)
LEUNG Cheuk Yan 7/(7) 1/(1)
Jennifer SEABROOK5 4/(4) 0/(0)
PEI Ker Wei6 4/(4) 0/(0)
Notes:
1. Resigned as an Executive Director on 9 December 2015.
2. Resigned as a Non‑executive Director on 29 June 2015.
3. Due to other business commitments, Mr Wang Lixin appointed Mr Jiao Jian, the Chairman and a Non‑executive Director, to act as his Alternate Director to attend one of the regular Board meetings held during the year.
4. Retired as an Independent Non‑executive Director on 20 May 2015.
5. Appointed as an Independent Non‑executive Director on 17 July 2015.
6. Appointed as an Independent Non‑executive Director on 24 July 2015.
BOARD DIVERSITY
The Company has developed the Board Diversity Statement recognising and embracing the benefits of having a diverse Board to enhance the quality of its performance. With a view to achieving a sustainable and balanced development, the Company sees increasing diversity at the Board level as an essential element in supporting the attainment of its strategic objectives and its sustainable development.
In designing the Board’s composition, the Company has considered Board diversity from a number of aspects, including but not limited to gender, age, cultural and educational background, ethnicity, professional experience, skills, knowledge and length of service. All Board appointments will be based on meritocracy, and candidates will be considered against objective criteria, having due regard for the benefits of diversity on the Board. The ultimate decision will be based on merit and contribution that the selected candidate will bring to the Board.
The Board comprises members from a diverse background. Two of the Independent Non‑executive Directors (one of whom is also the Chair of the Audit Committee) are qualified accountants. Another Independent Non‑executive Director is a qualified solicitor. Seven Directors have experience sitting on the boards of other companies listed on the stock exchange of Hong Kong, the PRC and Australia. Collectively the Directors have extensive experience in the metals and mining industry, trading, finance and accounting, business strategy, enterprise risk management and exposure or experience in various countries. Some of them are members of various professional and/or industry bodies and/or academic institutions.
CHAIRMAN OF THE BOARD AND CHIEF ExECUTIVE OFFICER
The Chairman of the Board is Mr Jiao Jian and the CEO of the Company is Mr Andrew Michelmore. The roles of the Chairman of the Board and the CEO of the Company are segregated to ensure their respective independence, accountability and responsibility.
The Chairman takes the lead in formulating the Group’s overall strategies and policies, ensures the Board’s effective performance of its functions, including compliance with good corporate governance practices, and encourages and facilitates active contribution of Directors in Board activities. Directors with different views are encouraged to voice their concerns. They are allowed sufficient time for discussion of issues so as to ensure that Board decisions fairly reflect Board consensus. A culture of openness and debate is promoted to facilitate the effective contribution of Non‑executive Directors and ensure constructive relations between Executive and Non‑executive Directors.
The Chairman also ensures that all Directors are properly briefed on issues arising at Board meetings and have received in a timely manner, adequate information, which must be accurate, clear, complete and reliable.
CORpORATE gOVERnAnCE REpORT (COnTInUED)
MMG0024 AR15_PFO3.indd 56 8/04/16 4:37 PM
For
per
sona
l use
onl
y

57 AnnuAl RepoRt 2015
The CEO, supported by a management committee comprising Executive Directors and senior management (Executive Committee), is responsible for managing day‑to‑day operations of the Group and executing the strategies adopted by the Board. The CEO is also accountable to the Board for the implementation of the Group’s overall strategies, and coordination of overall business operations.
ExECUTIVE DIRECTORS AND ExECUTIVE COMMITTEE
The Board has delegated the management of the Group’s day‑to‑day operations to the CEO and his Executive Committee. The Executive Committee is also required to report regularly to the Board on the progress being made by the Group’s businesses.
The members of the Executive Committee are:
› Andrew MICHELMORE (CEO and Executive Director);
› XU Jiqing (Executive General Manager – China and Strategy and Executive Director);
› Ross CARROLL (CFO);
› Marcelo BASTOS (Chief Operating Officer);
› Greg TRAVERS (Executive General Manager – Business Support); and
› Troy HEY (Executive General Manager – Stakeholder Relations).
NON‑ExECUTIVE DIRECTORS
The Non‑executive Directors (including the Independent Non‑executive Directors) provide a wide range of expertise and experience and bring independent judgement on issues relating to the Group’s strategies, development, performance and risk management through their contribution at Board and committee meetings.
INDEPENDENT NON‑ExECUTIVE DIRECTORS
The Independent Non‑executive Directors serve the important function of ensuring and monitoring the basis for an effective corporate governance framework. Their participation provides adequate checks and balances to safeguard the interests of Shareholders. The Board has four Independent Non‑executive Directors and two of them have accounting or related financial management expertise. The Board confirms that the Company has received from each of the Independent Non‑executive Directors a confirmation of independence for the year ended 31 December 2015 pursuant to Rule 3.13 of the Listing Rules and considers such Directors to be independent.
RE‑ELECTION OF DIRECTORS
Each of the Non‑executive Directors entered into a service agreement with the Company for a specific term of three years, except for Dr Peter Cassidy and Mr Anthony Larkin. Dr Cassidy’s appointment agreement commenced on 31 December 2010 and continues until either the Company or he terminates such agreement by serving on the other not less than one month’s prior written notice. Mr Larkin was on a continuing contract terminable upon reasonable notice by either party prior to his resignation on 20 May 2015.
In accordance with the Company’s articles of association, each Director appointed by the Board shall be subject to re‑election by Shareholders at the next general meeting (in the case of filling a casual vacancy) or at the next AGM (in the case of an addition to the Board), and thereafter be subject to retirement by rotation at least once every three years at the AGM. Dr Cassidy, who was appointed by the Board on 31 December 2010 to fill a casual vacancy, is also subject to retirement from the Board by rotation at least once every three years at the AGM. He was re‑elected by the Shareholders at the AGM held on 16 May 2011 and 22 May 2013 respectively. Dr Cassidy will retire by rotation at the forthcoming AGM and, being eligible, offer himself for re‑election.
DIRECTORS’ TRAINING AND CONTINUOUS PROFESSIONAL DEVELOPMENT
Every newly appointed Director receives a briefing and orientation on their legal and other responsibilities as a listed company director and the role of the Board. They also receive a comprehensive induction package covering the statutory and regulatory obligations of a director, organisational structure, policies, procedures and codes of the Company, terms of reference of Board committees and charter of responsibilities. All Directors are encouraged to participate in continuous professional development and refresh their knowledge and skills.
All Directors have been updated on the latest developments regarding the Listing Rules and other applicable regulatory requirements to ensure compliance and enhance their awareness of good corporate governance practices.
All Directors have participated in continuous professional development by attending seminars and/or conferences and/or forums and/or in‑house trainings to develop and refresh their knowledge and skills. In addition, attendance at briefing sessions (including the delivery of speeches) and the provision of reading materials on the relevant topics contributed toward continuous professional training. All Directors provided a record of training to the Company. A summary of training attended by the Directors during the year is as follows:
MMG0024 AR15_PFO3.indd 57 8/04/16 4:37 PM
For
per
sona
l use
onl
y

58 MMG LiMited
DIRECTORS
TypES OF TRAInIng
(nOTE)
ExECUTIVE DIRECTORS
Andrew MICHELMORE 1, 2, 3
David LAMONT (resigned on 9 December 2015) 1, 2, 3
XU Jiqing 1, 2, 3
NON‑ExECUTIVE DIRECTORS
JIAO Jian (Chairman) 1, 2, 3
WANG Lixin (resigned on 29 June 2015) 1, 2, 3
GAO Xiaoyu 1, 2, 3
INDEPENDENT NON‑ExECUTIVE DIRECTORS
Peter CASSIDY 1, 2, 3
Anthony LARKIN (retired on 20 May 2015) 1, 2, 3
LEUNG Cheuk Yan 1, 2, 3
Jennifer SEABROOK 1, 2, 3
PEI Ker Wei 1, 2, 3
Notes:
1. Attending seminars and/or conferences and/or forums and/or in‑house trainings.
2. Delivering speeches/presentations at seminars and/or conferences and/or forums.
3. Reading journals, documentaries, books, newspapers relating to the director’s duties and responsibilities.
DIRECTORS’ AND OFFICERS’ LIABILITIES INSURANCE
The Company has arranged appropriate directors’ and officers’ liabilities insurance in respect of legal action against the Directors and officers of the Company.
The BoarD CoMMITTeeS
To further enhance the corporate governance practices of the Company and to comply with the new provisions addressing risk management in Appendix 14 of the Listing Rules, which came into effect on 1 January 2016, the Board has approved a restructuring and re‑constitution of its Board committees with effect from 20 October 2015. There are four standing Board committees after the restructure of the Board Committees, namely, the Audit Committee, the Remuneration Committee, the Governance and Nomination Committee and the Risk Management Committee, for overseeing particular aspects of the Company’s affairs.
AUDIT COMMITTEE
The Audit Committee comprises five members including four Independent Non‑executive Directors, namely Dr Peter Cassidy, Mr Leung Cheuk Yan, Ms Jennifer Seabrook and Professor Pei Ker Wei and one Non‑executive Director, Mr Gao Xiaoyu. Ms Seabrook is the Chair of the Audit Committee.
The Audit Committee is accountable to the Board. After the restructure of the Board committees in October 2015 and effective from 1 January 2016, the Audit Committee Terms of Reference have been amended so that the Audit Committee now focuses primarily on financial reporting‑related matters, such as reviewing financial information and overseeing financial reporting‑related systems and controls and the newly formed Risk Management Committee will now advise the Board on high‑level, risk‑related matters, risk management and internal control, including advising on strategy and risk assessment. The revised terms of reference of the Audit Committee are available on the websites of the Stock Exchange and the Company.
During the year ended 31 December 2015, the Audit Committee held five meetings. The Audit Committee reviewed with the senior management and auditor of the Company the accounting policies and practices adopted by the Group and discussed auditing, the internal control system and financial reporting matters. It also reviewed the Company’s Financial Statements, annual and interim reports, the management letter from the auditor of the Company, the connected transactions and the continuing connected transactions entered into by the Group and the audit scope and fees for the year ended 31 December 2015.
The attendance of each member at the Audit Committee meetings is set out below. Figures in brackets indicate the maximum number of meetings held in the period in which the individual was a member of the Audit Committee.
MEMBERS
nUMBER OF MEETIngS ATTEnDED
NON‑ExECUTIVE DIRECTOR
GAO Xiaoyu 4/(5)
INDEPENDENT NON‑ExECUTIVE DIRECTORS
Peter CASSIDY 5/(5)
Anthony LARKIN1 2/(2)
LEUNG Cheuk Yan 5/(5)
Jennifer SEABROOK (Chair)2 3/(3)
PEI Ker Wei3 3/(3)
Notes:
1. Ceased as the Chairman of the Audit Committee on 20 May 2015.
2. Appointed as the Chair of the Audit Committee on 17 July 2015.
3. Appointed as a member of the Audit Committee on 28 July 2015.
CORpORATE gOVERnAnCE REpORT (COnTInUED)
MMG0024 AR15_PFO3.indd 58 8/04/16 4:37 PM
For
per
sona
l use
onl
y

59 AnnuAl RepoRt 2015
REMUNERATION AND NOMINATION COMMITTEE
Prior to the restructure of Board committees on 20 October 2015, the Remuneration and Nomination Committee comprised six members including four Independent Non‑executive Directors, namely Dr Peter Cassidy, Mr Leung Cheuk Yan, Ms Jennifer Seabrook and Professor Pei Ker Wei, and two Non‑executive Directors, Mr Jiao Jian and Mr Gao Xiaoyu. Dr Cassidy was the Chairman of the Remuneration and Nomination Committee.
For the period from 1 January 2015 to 19 October 2015, other than resolutions passed in writing by all the Committee members, the Remuneration and Nomination Committee held six meetings. The Committee reviewed the Company’s Remuneration Policy, the remuneration of Directors and senior management and made recommendations to the Board and also reviewed the proposal for grant of performance awards to eligible persons of the Company pursuant to the long‑term incentive equity plan adopted by the Company. The Committee also reviewed the Board structure, size and composition, assessed the independence of the Independent Non‑executive Directors, recommended Ms Jennifer Seabrook and Professor Pei Ker Wei to the Board for appointment as Independent Non‑executive Directors of the Company.
The attendance of each member at the Remuneration and Nomination Committee meetings during the period from 1 January 2015 to 19 October 2015 is set out below. Figures in brackets indicate the maximum number of meetings held in the period in which the individual was a member of the Remuneration and Nomination Committee.
MEMBERS
nUMBER OF MEETIngS ATTEnDED
NON‑ExECUTIVE DIRECTORS
JIAO Jian 5/(6)
WANG Lixin1 4/(4)
GAO Xiaoyu2 2/(2)
INDEPENDENT NON‑ExECUTIVE DIRECTORS
Peter CASSIDY (Chairman) 5/(6)
Anthony LARKIN3 4/(4)
LEUNG Cheuk Yan4 6/(6)
Jennifer SEABROOK5 1/(1)
PEI Ker Wei6 1/(1)
Notes:
1. Ceased as a member of the Remuneration Committee on 29 June 2015.
2. Appointed as a member of the Remuneration Committee on 18 August 2015.
3. Ceased as a member of the Remuneration Committee on 20 May 2015.
4. Ceased as a member of the Remuneration Committee on 20 October 2015.
5. Appointed as a member of the Remuneration Committee on 18 August 2015.
6. Appointed as a member of the Remuneration Committee on 18 August 2015.
Further particulars regarding the emoluments of the Directors and senior management as required to be disclosed pursuant to Appendices 14 and 16 of the Listing Rules respectively are set out in Note 32 to the Financial Statements.
REMUNERATION COMMITTEE
Following the restructure on 20 October 2015, the remuneration responsibilities of the Remuneration and Nomination Committee have been assumed by the Remuneration Committee. The Remuneration Committee comprises five members including three Independent Non‑executive Directors, namely Dr Peter Cassidy, Ms Jennifer Seabrook and Professor Pei Ker Wei and two Non‑executive Directors, namely Mr Jiao Jian and Mr Gao Xiaoyu. Dr Cassidy is the Chairman of the Remuneration Committee.
The Remuneration Committee is principally responsible for determining, with delegated responsibility, the remuneration packages of individual Executive Directors and senior management and making recommendations to the Board on the Group remuneration policy and the remuneration of Non‑executive Directors. The terms of reference of the Remuneration Committee are available on the websites of the Stock Exchange and the Company.
For the period from 20 October 2015 to 31 December 2015, the Remuneration Committee held one meeting. It reviewed and discussed the long‑term incentive equity plan for the year 2016, the senior management market remuneration and the executive retention plan.
The attendance of each member at the Remuneration Committee meetings during the period from 20 October 2015 to 31 December 2015 is set out below. Figures in brackets indicate the maximum number of meetings held in the period in which the individual was a member of the Remuneration Committee.
MEMBERS
nUMBER OF MEETIngS ATTEnDED
NON‑ExECUTIVE DIRECTORS
JIAO Jian 1/(1)
GAO Xiaoyu 1/(1)
INDEPENDENT NON‑ExECUTIVE DIRECTORS
Peter CASSIDY (Chairman) 1/(1)
Jennifer SEABROOK 1/(1)
PEI Ker Wei 1/(1)
MMG0024 AR15_PFO3.indd 59 8/04/16 4:37 PM
For
per
sona
l use
onl
y

60 MMG LiMited
GOVERNANCE AND NOMINATION COMMITTEE
The Governance and Nomination Committee was established on 20 October 2015 after the restructure of the Board Committees. It assumes the previous nomination responsibilities of the Remuneration and Nomination Committee as well as the corporate governance responsibilities. The Governance and Nomination Committee comprises three members including two Independent Non‑executive Directors, namely Dr Peter Cassidy and Mr Leung Cheuk Yan, and one Non‑executive Director, Mr Jiao Jian. Mr Jiao is the Chairman of the Governance and Nomination Committee.
The Governance and Nomination Committee is principally responsible for developing and reviewing the Group’s policies and practices on corporate governance, the Code of Conduct, monitoring the Group’s compliance with the Listing Rules and other applicable laws, monitoring the training and continuous professional development of Directors and senior management, reviewing all the terms of references of all the committees and reviewing and recommending to the Board for approval the Corporate Governance Report for inclusion in the Company’s Annual Report. The Governance and Nomination Committee is also responsible for formulating the policy for nomination of Directors and to lead the process of identifying and nominating candidates suitably qualified to become Board members. It also reviews the structure, size and composition of the Board and succession plans for senior management. The terms of reference of the Governance and Nomination Committee are available on the websites of the Stock Exchange and the Company.
For the period from 20 October 2015 to 31 December 2015, the Governance and Nomination Committee held one meeting. It reviewed the proposed program for Governance and Nomination Committee activities for the year 2016, the Mineral Resources and Ore Reserves Statement as at 30 June 2015 and the replacement update of the CFO arising from his resignation.
The attendance of each member at the Governance and Nomination Committee meetings during the period from 20 October 2015 to 31 December 2015 is set out below. Figures in brackets indicate the maximum number of meetings held in the period in which the individual was a member of the Governance and Nomination Committee.
MEMBERS
nUMBER OF MEETIngS ATTEnDED
NON‑ExECUTIVE DIRECTOR
JIAO Jian (Chairman) 1/(1)
INDEPENDENT NON‑ExECUTIVE DIRECTORS
Peter CASSIDY 1/(1)
LEUNG Cheuk Yan 1/(1)
The Company’s Mineral Resources and Ore Reserves Committee and the Disclosure Committee also report to the Governance and Nomination Committee.
The Mineral Resources and Ore Reserves Committee is responsible for overseeing the Mineral Resources and Ore Reserves reporting process and ensuring its compliance with the Listing Rules and JORC Code.
The Disclosure Committee is responsible for advising on disclosure obligations of the Company. The Company has adopted a Disclosure Framework to ensure its compliance with the disclosure obligations under the Listing Rules and the timely disclosure of inside information to the market. The Disclosure Committee comprises the CEO, CFO, Executive General Manager – Stakeholder Relations, the General Counsel and the Company Secretary. The Disclosure Framework requires employees to refer all information that potentially requires disclosure to a member of the Disclosure Committee.
RISK MANAGEMENT COMMITTEE
The Risk Management Committee was established on 20 October 2015. It comprises five members including three Independent Non‑executive Directors, namely Dr Peter Cassidy, Mr Leung Cheuk Yan and Professor Pei Ker Wei and two Non‑executive Directors, namely Mr Jiao Jian and Mr Gao Xiaoyu. Mr Jiao is the Chairman of the Risk Management Committee.
The Risk Management Committee is principally responsible for overseeing the Company’s risk management and internal control systems and reviewing the Group Strategy, and making recommendations to the Board for consideration and approval. The terms of reference of the Risk Management Committee are available on the websites of the Stock Exchange and the Company.
For the period from 20 October 2015 to 31 December 2015, the Risk Management Committee held one meeting. It reviewed the risk management report and the new risk management framework.
The attendance of each member at the Risk Management Committee meetings during the period from 20 October 2015 to 31 December 2015 is set out below. Figures in brackets indicate the maximum number of meetings held in the period in which the individual was a member of the Risk Management Committee.
CORpORATE gOVERnAnCE REpORT (COnTInUED)
MMG0024 AR15_PFO3.indd 60 8/04/16 4:37 PM
For
per
sona
l use
onl
y

61 AnnuAl RepoRt 2015
MEMBERS
nUMBER OF MEETIngS ATTEnDED
NON‑ExECUTIVE DIRECTORS
JIAO Jian (Chairman) 1/(1)
GAO Xiaoyu 1/(1)
INDEPENDENT NON‑ExECUTIVE DIRECTORS
Peter CASSIDY 1/(1)
LEUNG Cheuk Yan 1/(1)
PEI Ker Wei 1/(1)
SAFETY, HEALTH, ENVIRONMENT AND COMMUNITY COMMITTEE
The Safety, Health, Environment and Community (SHEC) Committee has become a management committee and not a board committee after the restructure of the Board Committee on 20 October 2015, reporting directly to the CEO. This allows for streamlined reporting of all material SHEC matters to the Board. The Board receives SHEC reports along with the CEO monthly reports, providing an overview of any material SHEC matters. Any material SHEC matters are referred to the Board through the CEO’s report section of the Board agenda as a standing item. The provision of the SHEC report along with CEO report to the Board for each Board meeting ensures that the Board stays close to material issues arising in the SHEC area.
aCCoUNTaBIlITY aND aUDIT
FINANCIAL REPORTING
The Directors acknowledge their responsibility for preparing all information and representations contained in the Financial Statements for the year ended 31 December 2015 as disclosed in this Annual Report. The Directors consider that the Financial Statements have been prepared in conformity with Hong Kong Financial Reporting Standards (HKFRS) issued by the Hong Kong Institute of Certified Public Accountants and Companies Ordinance, and reflect amounts that are based on the best estimates and reasonable, informed and prudent judgement of the Board and management with an appropriate consideration to materiality. The Directors, having made appropriate enquiries, were not aware of any material uncertainties relating to events or conditions that might cast significant doubt upon the Group’s and the Company’s ability to continue as a going concern. Please refer to Note 2.1 of the Financial Statements for further details.
Accordingly, the Directors have prepared the Financial Statements on a going‑concern basis.
The statement of the Company’s auditor regarding its responsibilities for the Financial Statements is set out in the Independent Auditor’s Report on page 65 of this Annual Report.
Management has provided all members of the Board with monthly updates giving a balanced and comprehensible assessment of the Company’s performance, position and prospects in sufficient detail to enable the Board as a whole and each Director to discharge their duties.
INTERNAL CONTROLS
The Board is entrusted with overall responsibility for establishing and maintaining the Group’s internal control system and reviewing its effectiveness to safeguard the Group’s assets and to protect Shareholders’ interests. The management throughout the Group maintains and monitors the internal control system on an ongoing basis. During the year, the Group engaged an international independent external professional consultant to perform the internal control reviews over the Group’s operations.
The reviews were based on the internal control framework recommended by the Committee of Sponsoring Organizations of the Treadway Commission (COSO), a globally recognised framework. The internal control reviews covered certain key operational and financial processes of the selected entities of the Group and a follow‑up review of the action plans to address the findings from last year’s review. The consultant reported its findings and recommendations directly to the Audit Committee. The Audit Committee reported the findings to the Board.
During the year, the Board commissioned an investigation into an incident of employee fraud with respect to certain activities carried out at the Group’s Sepon operations which involved two then employees of one of the Group’s Laos subsidiaries, Lane Xang Minerals Limited. The investigation confirmed that the Group had been the victim of a fraud involving misappropriation of funds from copper cathode sales by the two then employees. The main, alleged perpetrator is being held in custody pending the outcome of the judicial process. The overall financial consequence to the Group as a result of this fraud is expected to be approximately US$1.1 million post mitigation steps and insurance recovery (US$11.1 million pre‑mitigating steps and insurance recovery). This is subject to confirmation of acceptance of our claim by the insurer. However, the investigation identified and recommended a number of internal control and process improvements, which the Group is implementing as a priority in order to continue to enhance and improve its internal controls and processes. Having considered the final results of the investigation, the Board is of the view that the Laos fraud was an isolated issue and not representative of a broader, systemic issue with respect to the Group’s internal controls and processes. The Board supports the further improvements in the Group’s internal controls and processes, and considers its internal control system to be effective and adequate to meet the general principles and obligations regarding corporate governance issues under the Listing Rules.
MMG0024 AR15_PFO3.indd 61 8/04/16 4:37 PM
For
per
sona
l use
onl
y

62 MMG LiMited
AUDITOR’S REMUNERATION
An analysis of the remuneration of the external auditor, PricewaterhouseCoopers (which for these purposes includes any entity under common control, ownership or management with the external auditors or any entity that a reasonable and informed third party having knowledge of all relevant information would reasonably conclude as part of the audit firm nationally or internationally), for the year ended 31 December 2015 is set out as follows:
SERVICES REnDERED
FEE pAID/ pAyABlE 2015
US$’000
Statutory audit services 1,892.3
Other audit services 25.5
NON‑AUDIT SERVICES
Other tax services 120.4
Other services 400.8
2,439.0
CoMPaNY SeCreTarY
Ms Leung Suet Kam Lucia was appointed as Company Secretary of the Company in June 2001. She is a fellow of The Hong Kong Institute of Chartered Secretaries and The Institute of Chartered Secretaries and Administrators. Ms Leung assists the Board by ensuring good information flow within the Board and that the Board policy and procedures including those on governance matters are followed. All the Directors are entitled access to the advice and services of the Company Secretary. She reports to the Chairman of the Board and also the CEO. Ms Leung has attended various professional seminars during the year ended 31 December 2015, which exceed the requirements of the Listing Rules.
ShareholDerS’ rIGhTS
PROCEDURES FOR SHAREHOLDERS TO CONVENE A GENERAL MEETING
Shareholders holding at least 5% of the total voting rights of all Shareholders having a right to vote at the Company’s general meeting can deposit a written request to convene a general meeting at Units 8501–8503, Level 85, International Commerce Centre, 1 Austin Road West, Kowloon, Hong Kong, the registered office of the Company, for the attention of the Company Secretary or by sending the written request to the Company by fax at +852 2840 0580.
The written request: (i) must state the general nature of the business to be dealt with at the meeting, and (ii) may include the text of a resolution that may properly be moved and is intended to be moved at the meeting and signed by the Shareholders concerned.
The request will be verified with the Company’s Share Registrar and upon their confirmation that the request is proper and in order, the Board will convene a general meeting by serving sufficient notice to all the registered Shareholders.
However, if the request has been verified as not in order, the Shareholders concerned will be advised of this outcome and accordingly, a general meeting will not be convened as requested.
Pursuant to the articles of association of the Company and the Companies Ordinance, the notice period to be given to all the registered Shareholders for consideration of the proposed resolutions at a general meeting is not less than 14 days in writing.
If the Directors do not within 21 days after the date on which they become subject to the requirement to call a general meeting to be held on a date not more than 28 days after the date of the notice convening the meeting, the Shareholders concerned or any of them representing more than one half of the total votes of all of them, may themselves call a general meeting, provided that such general meeting must be called for a date not more than three months after the date on which the Directors become subject to the requirement to call a meeting.
Any reasonable expenses incurred by the Shareholders concerned by reasons of the failure of the Directors duly to call a general meeting shall be repaid to the Shareholders concerned by the Company.
The procedures for Shareholders to convene a general meeting are available on the Company’s website.
PROCEDURES FOR SHAREHOLDERS TO PUT FORWARD PROPOSALS AT THE ANNUAL GENERAL MEETING
Shareholders holding at least 2.5% of the total voting rights of all Shareholders having the right to vote at the AGM, or at least 50 Shareholders who have a right to vote on the resolution at the AGM to which the requests relate can submit a written request to move a resolution at the AGM.
The written request must state the resolution and be signed by all the Shareholders concerned.
The written request must be deposited at Units 8501–8503, Level 85, International Commerce Centre, 1 Austin Road West, Kowloon, Hong Kong, the registered office of the Company, for the attention of the Company Secretary or sending the written request to the Company by fax at +852 2840 0580 not later than six weeks before the AGM to which the requests relate or if later, the time at which notice is given of that meeting.
The request will be verified with the Company’s Share Registrar and upon their confirmation that the request is proper and in order, the Board will include the resolution in the agenda for the next AGM in accordance with statutory requirements. However, if the request has been verified as not in order, the Shareholders concerned will be advised of this outcome and accordingly, the proposed resolution will not be included in the agenda for the AGM.
CORpORATE gOVERnAnCE REpORT (COnTInUED)
MMG0024 AR15_PFO3.indd 62 8/04/16 4:37 PM
For
per
sona
l use
onl
y

63 AnnuAl RepoRt 2015
The Company will be responsible for the expenses in serving the notice of the resolution and circulating the statement submitted by the Shareholders concerned.
The procedures for Shareholders to put forward proposals at the AGM are available on the Company’s website.
PROCEDURES FOR SHAREHOLDERS TO PROPOSE A PERSON FOR ELECTION AS A DIRECTOR
If a Shareholder wishes to propose a person other than a Director for election as a Director at the AGM or general meeting, he/she can deposit a written notice to that effect signed by the Shareholder concerned at Units 8501–8503, Level 85, International Commerce Centre, 1 Austin Road West, Kowloon, Hong Kong, the registered office of the Company, for the attention of the Company Secretary.
The written notice must:
› state the full name of the person proposed for election as a Director;
› state the person’s biographical details as required by Rule 13.51(2) of the Listing Rules; and
› be accompanied by a confirmation signed by the candidate indicating his/her willingness to be appointed.
The notice should be lodged for a period of seven clear calendar days commencing from the date of dispatch of the AGM/general meeting notice and no later than seven clear calendar days prior to the date of AGM/general meeting.
If the written notice is received after the AGM/general meeting notice has been dispatched but later than seven clear calendar days prior to the date of the AGM/general meeting, the Company may need to consider the adjournment of the AGM/general meeting in order to allow a sufficient period of notice.
The procedures for Shareholders to propose a person for election as a Director at an AGM/general meeting are available on the Company’s website.
PROCEDURES FOR DIRECTING SHAREHOLDERS’ ENqUIRIES TO THE BOARD
Shareholders may at any time send their enquiries and concerns to the Board in writing through the Company Secretary to the registered office of the Company at Units 8501–8503, Level 85, International Commerce Centre, 1 Austin Road West, Kowloon, Hong Kong.
Shareholders may also make enquiries with the Board at the AGM/general meetings of the Company.
Shareholders’ questions in relation to their shareholdings should be directed to the Company’s Share Registrar, Computershare Hong Kong Investor Services Limited, at 17th Floor, Hopewell Centre, 183 Queen’s Road East, Wanchai, Hong Kong.
CoMMUNICaTIoN WITh ShareholDerS aND INVeSTorS
The Company endeavours to develop and maintain continuing relationships and effective communication with its Shareholders and investors. In an effort to facilitate and enhance the relationships and communication, the Company has adopted a Shareholder Communication Policy, which is available on the Company’s website. The principles of the Shareholder Communication Policy are:
CORPORATE COMMUNICATIONS
The Company will generally communicate with Shareholders and the investing public through the following corporate communication materials:
› financial reports (interim and annual reports), quarterly production reports and sustainability reports;
› announcements, Shareholder circulars and other disclosures through the website of the Stock Exchange and the Company; and
› other corporate communications, presentations, publications and media releases of the Company.
The Company endeavours to use plain, non‑technical language in all its communication materials provided to Shareholders and where possible the communication materials are made available in both English and Chinese.
INVESTOR RELATIONS
The Company may from time to time conduct investor/analyst briefings and presentations, road shows, site visits, or marketing activities for the financial community.
Communications and dialogues with Shareholders, investors, analysts, media or other parties will be conducted in compliance with the disclosure obligations and requirements under the Disclosure Framework, which aims to ensure equal, fair and timely dissemination of information.
CORPORATE WEBSITE
A dedicated ‘Investors and Media’ section is available on the Company’s website where all corporate communication materials including materials published on the website of the Hong Kong Exchanges and Clearing Limited (www.hkexnews.hk) are posted as soon as practicable after their release.
The following information is available on the Company’s website:
› the articles of association of the Company;
› terms of reference of the Audit Committee, Remuneration Committee, Governance and Nomination Committee and Risk Management Committee;
› a summary of the procedures for Shareholders to convene a general meeting, to put forward proposals at the AGM, and to propose a person for election as a Director;
› a news archive of stock exchange announcements and media releases; and
MMG0024 AR15_PFO3.indd 63 8/04/16 4:37 PM
For
per
sona
l use
onl
y
64 MMG LiMited
› an event calendar setting out important dates and forthcoming events of the Company.
Information on the Company’s website is updated on a regular basis. Shareholders are encouraged to subscribe to news updates.
SHAREHOLDER MEETINGS
Shareholders are encouraged to participate in AGM/general meetings or appoint proxies to attend and vote at meetings for and on their behalf if they are unable to attend.
Board members including the Chairman of the Board, and where appropriate, Chairmen and other members of the relevant Board committees or their delegates, appropriate management executives and an external auditor will attend AGM/general meetings to answer Shareholders’ questions.
In addition, separate resolutions are proposed at the AGM/general meetings on each substantially separate issue.
eNVIroNMeNTal PolICIeS aND PerforMaNCe
Respect for the environment is a core part of MMG’s business strategy – the Company is committed to minimising its environmental footprint and use of natural resources.
The environmental management approach is based on the principles of plan, do, check, act and aligns to the principles of ISO14001. The approach involves identification, assessment and control of material risks across all phases of our business, from exploration through to development, operation and then closure. The Company works in partnership with its Stakeholders to understand the challenges and opportunities of its activities, and how best to manage them.
The MMG Environment Standard defines MMG’s minimum requirements and provides the basis for sustainable environmental management through its deployment at its operations. These requirements are audited as part of an integrated assurance process.
Through the application of the MMG Operating Model, operations focus on essential environmental delivery work, supported by functional excellence that drives continual improvement of our management processes.
KeY STaKeholDer relaTIoNShIPS
The Company seeks Stakeholder relationships based on trust, transparency and mutual respect for culture, values and heritage. Understanding the needs, expectations and aspirations of communities impacted by its operations is vital for the Company to achieve its vision and growth objectives.
The Company’s key relationships are with its employees, communities, suppliers, governments, Shareholders, non‑government organisations, industry and customers.
Areas of interest vary between each Stakeholder group but cover topics including economic performance, safety and health management, employee development and wellbeing,
environmental management and compliance and support for community and regional development.
Stakeholders interact with the Company through a variety of avenues including direct communication and meetings, receipt of newsletters and corporate publications, disclosures to the Stock Exchange and membership and representation on industry associations.
MMG has relationships with a range of customers globally for the sale of its products. The sales and marketing of all products is managed by a Group Sales and Marketing function that negotiates all terms and conditions at arm’s length arrangements. All prices are referenced to LME or London Bullion Market Association market prices for the appropriate product sold. Further information is discussed in the Management Discussion and Analysis on pages 21 to 37 of this Annual Report.
Information on MMG’s approach to health and safety, workplace quality and community development will be reported in the 2015 MMG Sustainability Report available on the Company’s website at www.mmg.com in the Second Quarter 2016.
CoMPlIaNCe WITh laWS aND reGUlaTIoNS
The Company has adopted the Corporate Legal Compliance Standard and other practices to ensure adherence to applicable legal and regulatory requirements and in particular, those that have a significant impact on the operations of the Group. Our Governance and Nomination Committee is delegated by the Board to review and monitor the Group’s policies and practices on compliance with legal and regulatory requirements and such policies and practices are regularly reviewed. Any changes in the applicable laws, rules and regulations are brought to the attention of relevant employees and business units from time to time.
CoNSTITUTIoNal DoCUMeNTS
On 10 March 2015 the Board approved certain amendments to the articles of association of the Company in order to bring the articles of association in line with the new Companies Ordinance, which came into effect on 3 March 2014, as well as to modernise and update the articles of association generally. A special resolution for the adoption of the new articles of association was passed by the Shareholders at the AGM of the Company held on 20 May 2015. The new articles of association of the Company are available on the websites of the Stock Exchange and the Company.
aSX SeCoNDarY lISTING
The Company was admitted to the official list of ASX Limited (ASX) on 10 December 2015 as an ASX Foreign Exempt Listing. The secondary listing on the ASX will enable more Australian investors to participate in MMG’s growth. The Company’s primary listing remains with the Stock Exchange.
CORpORATE gOVERnAnCE REpORT (COnTInUED)
MMG0024 AR15_PFO3.indd 64 8/04/16 4:37 PM
For
per
sona
l use
onl
y

65 AnnuAl RepoRt 2015
PricewaterhouseCoopers, 22/F, Prince’s Building, Central, Hong Kong T: +852 2289 8888, F:+852 2810 9888, www.pwchk.com
INDEPENDENT AUDITOR’S REPROT TO THE MEMBERS OF MMG LIMITED (INCORPORATED IN HONG KONG WITH LIMITED LIABILITY) We have audited the consolidated financial statements of MMG Limited (the “Company”) and its subsidiaries set out on pages 68 to 129, which comprise the consolidated balance sheet as at 31 December 2015, and the consolidated income statement, the consolidated statement of comprehensive income, the consolidated statement of changes in equity and the consolidated cash flow statement for the year then ended, and a summary of significant accounting policies and other explanatory information. Directors’ Responsibility for the Consolidated Financial Statements The directors of the Company are responsible for the preparation of consolidated financial statements that give a true and fair view in accordance with Hong Kong Financial Reporting Standards issued by the Hong Kong Institute of Certified Public Accountants, and the Hong Kong Companies Ordinance, and for such internal control as the directors determine is necessary to enable the preparation of consolidated financial statements that are free from material misstatement, whether due to fraud or error. Auditor’s Responsibility Our responsibility is to express an opinion on these consolidated financial statements based on our audit and to report our opinion solely to you, as a body, in accordance with section 405 of the Hong Kong Companies Ordinance and for no other purpose. We do not assume responsibility towards or accept liability to any other person for the contents of this report. We conducted our audit in accordance with Hong Kong Standards on Auditing issued by the Hong Kong Institute of Certified Public Accountants. Those standards require that we comply with ethical requirements and plan and perform the audit to obtain reasonable assurance about whether the consolidated financial statements are free from material misstatement. An audit involves performing procedures to obtain audit evidence about the amounts and disclosures in the consolidated financial statements. The procedures selected depend on the auditor’s judgment, including the assessment of the risks of material misstatement of the consolidated financial statements, whether due to fraud or error. In making those risk assessments, the auditor considers internal control relevant to the entity’s preparation of consolidated financial statements that give a true and fair view in order to design audit procedures that are appropriate in the circumstances, but not for the purpose of expressing an opinion on the effectiveness of the entity’s internal control. An audit also includes evaluating the appropriateness of accounting policies used and the reasonableness of accounting estimates made by the directors, as well as evaluating the overall presentation of the consolidated financial statements. We believe that the audit evidence we have obtained is sufficient and appropriate to provide a basis for our audit opinion.
MMG0024 AR15_PFO3.indd 65 8/04/16 4:37 PM
For
per
sona
l use
onl
y

66 MMG LiMited
2 of 2
Opinion In our opinion, the consolidated financial statements give a true and fair view of the financial position of the Company and its subsidiaries as at 31 December 2015, and of their financial performance and cash flows for the year then ended in accordance with Hong Kong Financial Reporting Standards and have been properly prepared in compliance with the Hong Kong Companies Ordinance. PricewaterhouseCoopers Certified Public Accountants Hong Kong, 9 March 2016
MMG0024 AR15_PFO3.indd 66 8/04/16 4:37 PM
For
per
sona
l use
onl
y

67 AnnuAl RepoRt 2015
finAnCiAl StAtementS
ConsoLiDateD inCome statement 68
ConsoLiDateD statement of Comprehensive inCome 69
ConsoLiDateD BaLanCe sheet 70
ConsoLiDateD statement of Changes in equity 72
ConsoLiDateD Cash fLow statement 73
notes to ConsoLiDateD finanCiaL statements 74
1. GeneRAl infoRmAtion 74
2. SummARY of SiGnifiCAnt ACCountinG poliCieS 74
3. CRitiCAl ACCountinG eStimAteS And JudGementS 85
4. SeGment infoRmAtion 86
5. otheR inCome 89
6. expenSeS 89
7. finAnCe CoStS – net 91
8. inCome tAx CRedit/(expenSe) 92
9. (loSS)/eARninGS peR ShARe 92
10. dividendS 93
11. emploYee benefit expenSeS, inCludinG diReCtoRS’ emolumentS 93
12. deRivAtive finAnCiAl inStRumentS 94
13. pRopeRtY, plAnt And eQuipment 94
14. intAnGible ASSetS 96
15. inveStment in SubSidiARieS 98
16. pRinCipAl SubSidiARieS with mAteRiAl non-ContRollinG inteReStS 99
17. inventoRieS 101
18. defeRRed inCome tAx 101
19. tRAde And otheR ReCeivAbleS 102
20. otheR finAnCiAl ASSetS 103
21. CASh And CASh eQuivAlentS 103
22. ShARe CApitAl 104
23. ReSeRveS And RetAined pRofitS 104
24. boRRowinGS 106
25. pRoviSionS 108
26. tRAde And otheR pAYAbleS 109
27. noteS to ConSolidAted CASh flow StAtement 109
28. buSineSS CombinAtion 110
29. ASSetS And liAbilitieS held foR SAle 111
30. SiGnifiCAnt RelAted pARtY tRAnSACtionS 112
31. finAnCiAl RiSK mAnAGement 114
32. diReCtoRS’ And SenioR mAnAGement’S emolumentS 121
33. ShARe option SCheme 124
34. CommitmentS 126
35. ContinGent ASSetS And liAbilitieS 127
36. eventS AfteR bAlAnCe Sheet dAte 127
37. CompAnY bAlAnCe Sheet And ReSeRveS 128
five‑year finanCiaL summary 130
MMG0024 AR15_PFO3.indd 67 8/04/16 4:37 PM
For
per
sona
l use
onl
y

68 MMG LiMited
yEAR EnDED 31 DECEMBER
Note2015
US$ million2014
US$ million
Revenue 4 1,950.9 2,479.8
Other income 5 1.7 16.8
Expenses (excluding depreciation, amortisation and impairment expenses) 6.1 (1,531.7) (1,715.8)
Earnings before interest, income tax, depreciation, amortisation and impairment expenses – EBITDA 420.9 780.8
Depreciation and amortisation expenses 6.1 (649.4) (537.1)
Impairment expenses 6 (897.0) –
(Loss)/earnings before interest and income tax – EBIT (1,125.5) 243.7
Finance income 7 3.8 3.3
Finance costs 7 (88.8) (82.7)
(Loss)/profit before income tax (1,210.5) 164.3
Income tax credit/(expense) 8 161.8 (65.1)
(Loss)/profit for the year (1,048.7) 99.2
(Loss)/profit for the year attributable to:
Equity holders of the Company (1,026.5) 103.8
Non‑controlling interests (22.2) (4.6)
(1,048.7) 99.2
(LOSS)/EARNINGS PER SHARE FOR (LOSS)/PROFIT ATTRIBUTABLE TO THE EqUITY HOLDERS OF THE COMPANY
Basic (loss)/earnings per share 9 (US 19.4 cents) US 1.96 cents
Diluted (loss)/earnings per share 9 (US 19.4 cents) US 1.96 cents
The accompanying notes are an integral part of these consolidated financial statements.
COnSOlIDATED InCOME STATEMEnT COnSOlIDATED STATEMEnT OF COMpREhEnSIVE InCOME
MMG0024 AR15_PFO3.indd 68 8/04/16 4:37 PM
For
per
sona
l use
onl
y

69 AnnuAl RepoRt 2015
yEAR EnDED 31 DECEMBER
Note2015
US$ million2014
US$ million
(Loss)/profit for the year (1,048.7) 99.2
Other comprehensive (loss)/income
Items that may subsequently be reclassified to profit or loss
Change in fair value of available‑for‑sale financial assets 23 (11.4) 26.1
Items reclassified to profit or loss
Gain on disposal of available‑for‑sale financial assets 23 – (10.9)
Other comprehensive (loss)/income for the year, net of tax (11.4) 15.2
Total comprehensive (loss)/income for the year (1,060.1) 114.4
Total comprehensive (loss)/income attributable to:
Equity holders of the Company (1,037.9) 119.0
Non‑controlling interests (22.2) (4.6)
(1,060.1) 114.4
The accompanying notes are an integral part of these consolidated financial statements.
COnSOlIDATED STATEMEnT OF COMpREhEnSIVE InCOME
MMG0024 AR15_PFO3.indd 69 8/04/16 4:37 PM
For
per
sona
l use
onl
y

70 MMG LiMited
AS AT 31 DECEMBER
Note2015
US$ million2014
US$ million
ASSETS
Non‑current assets
Property, plant and equipment 13 11,873.0 11,100.8
Intangible assets 14 628.6 839.0
Inventories 17 61.2 47.8
Deferred income tax assets 18 368.5 173.6
Other receivables 19 82.0 107.1
Other financial assets 20 12.4 12.3
13,025.7 12,280.6
Current assets
Inventories 17 281.7 285.1
Trade and other receivables 19 719.2 513.3
Loan to a related party 30(d) – 80.0
Current income tax assets 1.4 28.6
Other financial assets 20 14.9 26.8
Cash and cash equivalents 21 598.3 251.2
1,615.5 1,185.0
Assets of disposal group classified as held for sale 29 18.8 24.4
1,634.3 1,209.4
Total assets 14,660.0 13,490.0
EqUITY
Capital and reserves attributable to equity holders of the Company
Share capital 22 2,359.1 2,358.9
Reserves and retained profits 23 (1,692.5) (672.6)
666.6 1,686.3
Non‑controlling interests 16 1,508.6 1,288.3
Total equity 2,175.2 2,974.6
The accompanying notes are an integral part of these consolidated financial statements.
COnSOlIDATED BAlAnCE ShEET
MMG0024 AR15_PFO3.indd 70 8/04/16 4:37 PM
For
per
sona
l use
onl
y

71 AnnuAl RepoRt 2015
AS AT 31 DECEMBER
Note2015
US$ million2014
US$ million
LIABILITIES
Non‑current liabilities
Borrowings 24 9,986.2 8,092.2
Provisions 25 775.8 784.2
Other payables 26 134.6 64.9
Deferred income tax liabilities 18 744.0 769.9
11,640.6 9,711.2
Current liabilities
Borrowings 24 276.9 116.7
Provisions 25 137.7 102.6
Trade and other payables 26 393.0 508.5
Current income tax liabilities 31.8 71.9
Derivative financial instruments 12 0.3 –
839.7 799.7
Liabilities of disposal group classified as held for sale 29 4.5 4.5
844.2 804.2
Total liabilities 12,484.8 10,515.4
Total equity and liabilities 14,660.0 13,490.0
The accompanying notes are an integral part of these consolidated financial statements.
Andrew Michelmore Jiqing xu CEO and Executive Director Executive Director
MMG0024 AR15_PFO3.indd 71 8/04/16 4:37 PM
For
per
sona
l use
onl
y

72 MMG LiMited
ATTRIBUTABlE TO EqUITy hOlDERS OF ThE COMpAny
US$ million Note
Share Capital
(Note 22)
Total Reserves
(Note 23)
Retained Profits
(Note 23)
Non‑ Controlling
Interests(Note 16) Total
At 1 January 2015 2,358.9 (1,932.9) 1,260.3 1,288.3 2,974.6
Loss for the year – – (1,026.5) (22.2) (1,048.7)
Other comprehensive loss – (11.4) – – (11.4)
Total comprehensive loss for the year – (11.4) (1,026.5) (22.2) (1,060.1)
Employee share options 0.2 18.0 – – 18.2
Contribution from non‑controlling interests 16 – – – 250.5 250.5
Dividends paid to non‑controlling interests – – – (8.0) (8.0)
Total transactions with owners 0.2 18.0 – 242.5 260.7
At 31 December 2015 2,359.1 (1,926.3) 233.8 1,508.6 2,175.2
The accompanying notes are an integral part of these consolidated financial statements.
ATTRIBUTABlE TO EqUITy hOlDERS OF ThE COMpAny
US$ million Note
Share Capital
(Note 22)
Total Reserves
(Note 23)
Retained Profits
(Note 23)
Non‑ Controlling
Interests(Note 16) Total
At 1 January 2014 33.9 376.8 1,209.4 196.7 1,816.8
Profit for the year – – 103.8 (4.6) 99.2
Other comprehensive income – 15.2 – – 15.2
Total comprehensive income for the year – 15.2 103.8 (4.6) 114.4
Employee share options – 0.1 – – 0.1
Non‑controlling interest arising on business combination 28 – – – 1,106.2 1,106.2
Dividends paid by the Company 10 – – (52.9) – (52.9)
Dividends paid to non‑controlling interests – – – (10.0) (10.0)
Transition to no‑par value regime on 3 March 2014 22 2,325.0 (2,325.0) – – –
Total transactions with owners 2,325.0 (2,324.9) (52.9) 1,096.2 1,043.4
At 31 December 2014 2,358.9 (1,932.9) 1,260.3 1,288.3 2,974.6
The accompanying notes are an integral part of these consolidated financial statements.
COnSOlIDATED STATEMEnT OF ChAngES In EqUITy COnSOlIDATED CASh FlOW STATEMEnT
MMG0024 AR15_PFO3.indd 72 8/04/16 4:37 PM
For
per
sona
l use
onl
y

73 AnnuAl RepoRt 2015
yEAR EnDED 31 DECEMBER
Note2015
US$ million2014
US$ million
Cash flows from operating activities
Receipts from customers 2,289.0 2,578.4
Payments to suppliers (1,875.2) (1,744.8)
Payments for exploration expenditure (42.4) (73.0)
Income tax paid (89.0) (93.9)
Net cash generated from operating activities 27(a) 282.4 666.7
Cash flows from investing activities
Purchase of property, plant and equipment 27(b) (1,959.0) (1,037.9)
Purchase of intangible assets 14 (26.0) (48.0)
Purchase of financial assets (1.8) (1.0)
Acquisition of subsidiaries, net of cash acquired 28 (12.2) (2,950.1)
Proceeds from disposal of financial assets 0.2 101.2
Proceeds from disposal of property, plant and equipment 1.3 –
Proceeds from disposal of subsidiaries – 3.0
Net cash used in investing activities (1,997.5) (3,932.8)
Cash flows from financing activities
Proceeds from borrowings 1,729.5 5,358.0
Repayments of borrowings (109.5) (519.5)
Repayments of loans to former parent of acquired subsidiaries 28 – (4,018.1)
Proceeds from repayments of loan to a related party 30(d) 80.0 –
Loan to a related party 30(d) – (80.0)
Proceeds from related party borrowings 30(d) 417.5 1,843.8
Repayments of related party borrowings – (75.0)
Capital contribution from non‑controlling interests 16 250.5 1,106.2
Proceeds from shares issued upon exercise of employee share options 0.2 –
Dividends paid to non‑controlling interests 16 (8.0) (10.0)
Dividends paid to the owners of the Company 10 – (52.9)
Repayments of finance lease liabilities – (0.6)
Interest and financing costs paid (301.4) (174.1)
Interest received 3.4 2.1
Net cash generated from financing activities 2,062.2 3,379.9
Net increase in cash and cash equivalents 347.1 113.8
Cash and cash equivalents at 1 January 251.2 137.4
Cash and cash equivalents at 31 December 21 598.3 251.2
The accompanying notes are an integral part of these consolidated financial statements.
COnSOlIDATED CASh FlOW STATEMEnT
MMG0024 AR15_PFO3.indd 73 8/04/16 4:37 PM
For
per
sona
l use
onl
y

74 MMG LiMited
1. GeNeral INforMaTIoN
MMG Limited (the Company) is a limited liability company and was incorporated in Hong Kong on 29 July 1988. The address of its registered office is Units 8501–8503, Level 85, International Commerce Centre, 1 Austin Road West, Kowloon, Hong Kong.
The Company is an investment holding company and is listed on the main board of The Stock Exchange of Hong Kong Limited (HKEx) and on the Australian Securities Exchange (ASX). The Company was admitted to the official list of the ASX on 10 December 2015 as a Foreign Exempt Listing, and commenced trading on 14 December 2015. This is a secondary listing and the Company’s primary listing remains with the HKEx.
The Group is engaged in the exploration, development and mining of zinc, copper, silver and lead deposits around the world.
The consolidated financial statements for the year ended 31 December 2015 are presented in United States dollars (US$) unless otherwise stated and were approved for issue by the Board of Directors (the Board) on 9 March 2016.
2. SUMMarY of SIGNIfICaNT aCCoUNTING PolICIeS
The principal accounting policies applied in the preparation of these consolidated financial statements are set out below. These policies have been consistently applied to all the years presented, unless otherwise stated.
2.1 BASIS OF PREPARATION
The consolidated financial statements of the Group have been prepared in accordance with Hong Kong Financial Reporting Standards (HKFRS) – a collective term that includes all applicable individual Hong Kong Financial Reporting Standards, Hong Kong Accounting Standards (HKAS) and Interpretations issued by the Hong Kong Institute of Certified Public Accountants (HKICPA). These consolidated financial statements have been prepared under the historical cost convention, as modified by the revaluation of available‑for‑sale financial assets, financial assets at fair value through profit or loss and derivative financial instruments.
This report has been prepared on the going‑concern basis which assumes the continuity of normal business activity and the realisation of assets and the settlement of liabilities in the normal course of business.
Cash flow forecasting for the 12 months from the approval of the consolidated financial statements of the Company indicates that the Group will have sufficient liquidity to meet its operational, existing contractual debt service and capital expenditure requirements for the twelve month period from the approval of the consolidated financial statements, however, the Group may breach certain financial covenants based on the projection. The Group is currently in negotiation with its lenders in view of its various funding requirements. The Group also considers it has various contingencies available to it should a need arise, which are set out in Note 31.4.
Based on the reasons set out above, the Directors are of the view that the Group will be able to meet its debts as and when they fall due and accordingly the Directors have prepared the financial report on a going‑concern basis.
The financial report does not contain any adjustments relating to the recoverability or classification of recorded assets nor to the amounts or classification of recorded assets or liabilities that might be necessary should the consolidated entity not be able to continue as a going concern.
The preparation of financial statements in conformity with HKFRS requires the use of certain critical accounting estimates. It also requires management to exercise their judgement in the process of applying the Group’s accounting policies. The areas involving a higher degree of judgement or complexity, or areas where assumptions and estimates are significant to the consolidated financial statements are disclosed in Note 3.
(a) New standards, amendments and interpretations to existing standards effective in 2015 but not relevant or significant to the Group
HKAS 19 (Amendment) Defined benefit plans: employee contribution
HKFRS (Amendment) Annual improvements to HKFRS 2010 – 2012 cycle
HKFRS (Amendment) Annual improvements to HKFRS 2011 – 2013 cycle
nOTES TO COnSOlIDATED FInAnCIAl STATEMEnTS
MMG0024 AR15_PFO3.indd 74 8/04/16 4:37 PM
For
per
sona
l use
onl
y

75 AnnuAl RepoRt 2015
(b) The following new standards and amendments to standards have been issued but are not effective for the financial year beginning 1 January 2015 and have not been early adopted.
The Group is in the process of assessing their impact on the Group’s results and financial position.
HKAS 1 (Amendment) Disclosure initiative(i)
HKAS 16 and HKAS 38 (Amendment)
Clarification of acceptable methods of depreciation and amortisation(i)
HKAS 16 and HKAS 41 (Amendment)
Agriculture: bearer plants(i)
HKAS 27 (Amendment) Equity method in separate financial statements(i)
HKAS 28 and HKFRS 10 (Amendment)
Sale of contribution of assets between an investor and its associate or joint venture(i)
HKAS 28, HKFRS 10 and HKFRS 12 (Amendment)
Investment entities: applying the consolidation exception(i)
HKFRS 11 (Amendment)
Accounting for acquisition of interests in joint operation(i)
HKFRS 14 Regulatory deferral accounts(i)
HKFRS (Amendment) Annual improvements to HKFRS 2012 – 2014 cycle(i)
HKFRS 15 Revenue from contracts with customers(ii)
HKFRS 9 Financial instruments(ii)
HKFRS 16 Leases(iii)
Effective for the Group for the annual period beginning:
(i) 1 January 2016
(ii) 1 January 2018
(iii) 1 January 2019
(c) The Companies ordinance (Cap. 622)
The requirements of Part 9 ‘Accounts and Audit’ of the new Hong Kong Companies Ordinance (Cap. 622) became applicable during the year. As a result, there have been changes to the presentation and disclosures of certain information in the consolidated financial statements.
2.2 CONSOLIDATION
(a) acquisition method of accounting for non-common control combination
The Group applies the acquisition method of accounting to account for business combinations other than common control combinations. The purchase consideration for the acquisition of a subsidiary is the fair value of the assets transferred, the liabilities incurred to the former owners of the acquiree and the equity interests issued by the Group.
The purchase consideration includes the fair value of any asset or liability resulting from a contingent consideration arrangement and the fair value of any pre‑existing equity interest in the subsidiaries. Acquisition‑related costs are expensed as incurred. Identifiable assets acquired and liabilities and contingent liabilities assumed in a business combination are measured initially at their fair values at the acquisition date, which is the date on which control is obtained. On an acquisition‑by‑acquisition basis, the Group recognises any non‑controlling interest in the acquiree either at fair value or at the non‑controlling interest’s proportionate share of the recognised amounts of the acquiree’s identifiable net assets.
If the business combination is achieved in stages, the acquisition date carrying value of the acquirer’s previously held equity interest in the acquiree is remeasured to fair value at the acquisition date; any gains or losses arising from such remeasurement are recognised in profit or loss.
Any contingent purchase consideration payable by the Group is recognised at fair value at the acquisition date. Subsequent changes to the fair value of the contingent consideration that is deemed to be an asset or liability is recognised in accordance with HKAS 39 either in profit or loss or as a change to other comprehensive income. Contingent consideration that is classified as equity is not remeasured, and its subsequent settlement is accounted for within equity.
The excess of purchase consideration, the amount of any non‑controlling interest in the acquiree and the acquisition‑date fair value of any previous equity interest in the acquiree over the fair value of the identifiable net assets acquired are recorded as goodwill. If the total of purchase consideration, non‑controlling interest recognised and previously held interest measured are less than the fair value of the net assets of the subsidiary acquired in the case of a bargain purchase, the difference is recognised directly in the consolidated income statement.
(b) Merger accounting for common control combination
The consolidated financial statements incorporate the financial statements of the combining entities or businesses in which the common control combination occurs as if they had been combined from the date when the combining entities or businesses first came under the control of the controlling party.
The net assets of the combining entities or businesses are consolidated using the existing book values from the perspective of the controlling party. No amount is recognised in respect of goodwill or excess of the interest of the acquirer in the net fair value of the identifiable assets, liabilities and contingent liabilities of the acquirer over cost at the time of the common control combination, to the extent of the continuation of the interest of the controlling party.
The consolidated income statement includes the results of each of the combining entities or businesses from the earliest date presented or since the date when the combining entities
MMG0024 AR15_PFO3.indd 75 8/04/16 4:37 PM
For
per
sona
l use
onl
y

76 MMG LiMited
nOTES TO COnSOlIDATED FInAnCIAl STATEMEnTS (COnTInUED)
or businesses first came under common control, where this is a shorter period, regardless of the date of the common control combination.
The comparative amounts in the consolidated financial statements are presented as if the entities or businesses had been combined at the previous balance sheet date unless they first came under common control at a later date.
Transaction costs, including professional fees, registration fees, costs of furnishing information to Shareholders, costs or losses incurred in combining operations of the previously separate businesses, incurred in relation to the common control combination that is to be accounted for by using merger accounting are recognised as expenses in the year in which they are incurred.
(c) Subsidiaries
Subsidiaries are all entities (including structured entities) over which the Group has control. The Group controls an entity when the Group is exposed to, or has rights to, variable returns from its involvement with the entity and has the ability to affect those returns through its power over the entity. The Group has power over an entity when it has existing rights to direct the relevant activities that significantly affect the entity’s returns. The subsidiaries are fully consolidated from the date on which control is transferred to the Group. They are deconsolidated from the date that control ceases.
Inter‑company transactions, balances, income and expenses on transactions between Group companies are eliminated. Profits and losses resulting from inter‑company transactions that are recognised in assets are also eliminated. Accounting policies of subsidiaries have been changed where necessary to ensure consistency with the policies adopted by the Group.
(d) Transactions with non-controlling interests
Transactions with non‑controlling interests that do not result in loss of control are accounted for as equity transactions – that is, as transactions with the owners in their capacity as owners. The difference between fair value of any consideration paid and the relevant share acquired of the carrying value of net assets of the subsidiary is recorded in equity. Gains or losses on disposals to non‑controlling interests are also recorded in equity.
When the Group ceases to have control, any retained interest in the entity is remeasured to its fair value, with the change in carrying amount recognised in profit or loss. The fair value is the initial carrying amount for the purposes of subsequently accounting for the retained interest as an associate, joint arrangement or financial asset. In addition, any amounts previously recognised in other comprehensive income in respect of that entity are accounted for as if the Group had directly disposed of the related assets or liabilities. This may mean that amounts previously recognised in other comprehensive income are reclassified to profit or loss.
(e) Separate financial statements
Investments in subsidiaries are accounted for at cost less impairment. Cost is adjusted to reflect changes in consideration arising from contingent consideration amendments. Cost also includes direct attributable costs of the investment. The results of subsidiaries are accounted for by the Company on the basis of dividend received and receivable.
Impairment testing of the investments in subsidiaries is required upon receiving a dividend from these investments if the dividend exceeds the total comprehensive income of the subsidiary in the period the dividend is declared or if the carrying amount of the investment in the separate financial statements exceeds the carrying amount in the consolidated financial statements of the investee’s net assets including goodwill.
2.3 SEGMENT REPORTING
Operating segments are reported in a manner consistent with the internal reporting provided to the chief operating decision‑maker. The chief operating decision‑maker, who is responsible for allocating resources and assessing performance of the operating segments, has been identified as the Executive Committee of the Company.
2.4 FOREIGN CURRENCY TRANSLATION
(a) functional and presentation currency
Items included in the financial statements of each Group entity are measured using the currency of the primary economic environment in which the entity operates (functional currency). The functional currency of the Company is US dollars, which is the presentation currency of the Group.
(b) Transactions and balances
Foreign currency transactions are translated into the functional currency using the exchange rates prevailing at the dates of the transactions or reporting date where items are remeasured. Foreign exchange gains and losses resulting from the settlement of such transactions and from the translation of monetary assets and liabilities denominated in foreign currencies at year‑end exchange rates are recognised in the consolidated income statement, with the exception of foreign exchange gains and losses on foreign currency provisions for mine rehabilitation, restoration and dismantling, which are capitalised in property, plant and equipment for operating sites.
Translation differences on non‑monetary financial assets and liabilities such as equities held at fair value through profit or loss are recognised in profit or loss as part of the fair value gain or loss. Translation differences on non‑monetary financial assets such as equities classified as available‑for‑sale are included in the available‑for‑sale financial assets reserve in equity.
MMG0024 AR15_PFO3.indd 76 8/04/16 4:37 PM
For
per
sona
l use
onl
y

77 AnnuAl RepoRt 2015
(c) Group companies
The results and financial position of all Group entities (none of which has the currency of a hyperinflationary economy) that have a functional currency different from the presentation currency are translated into the presentation currency as follows:
(i) Assets and liabilities for each balance sheet presented are translated at the closing rate at the date of that balance sheet;
(ii) Income and expenses for each income statement are translated at average exchange rates (unless this average is not a reasonable approximation of the cumulative effect of the rates prevailing at the dates of the transactions, in which case income and expenses are translated at the dates of the transactions); and
(iii) All resulting exchange differences are recognised in other comprehensive income.
Goodwill and fair value adjustments arising on the acquisition of a foreign entity are treated as assets and liabilities of the foreign entity and translated at the closing rate.
On the disposal of a foreign operation (that is, a disposal of the Group’s entire interest in a foreign operation, or a disposal involving loss of control over a subsidiary that includes a foreign operation, a disposal involving loss of joint control over a joint arrangement that includes a foreign operation, or a disposal involving loss of significant influence over an associate that includes a foreign operation), all of the exchange differences accumulated in equity in respect of that operation attributable to the equity holders of the Company are reclassified to profit or loss.
2.5 PROPERTY, PLANT AND EqUIPMENT
Cost
Property, plant and equipment is stated at historical cost less accumulated depreciation and impairment losses. Historical cost includes expenditure that is directly attributable to the acquisition of the items and costs incurred in bringing the asset to the location and condition necessary for it to be capable of operating in the manner intended by management. The cost of property, plant and equipment includes the estimated cost of mine rehabilitation, restoration and dismantling.
Depreciation and amortisation
The major categories of property, plant and equipment are depreciated over the estimated useful lives of the assets on a unit of production or reducing balance basis as indicated below. The useful lives below are subject to the lesser of the asset categories’ useful life and the life of the mine:
› Freehold land – Not depreciated;
› Buildings – Reducing balance 2.5%;
› Plant and machinery (mining and processing) – Unit of production (tonnes mined and milled);
› Plant and machinery (other) – Reducing balance 3–5 years;
› Mine property and development assets – Unit of production (tonnes mined);
› Exploration and evaluation assets – Not depreciated; and
› Construction in progress – Not depreciated.
Depreciation and amortisation commences when an asset is available for use.
The unit of production method is applied based on assessments of proven and probable Ore Reserves and a portion of Mineral Resources available to be mined or processed by the current production equipment to the extent that such resources are considered to be economically recoverable. Resource and Reserves estimates are reviewed annually. The depreciation and amortisation expense calculation reflects the estimates in place at the balance sheet date, prospectively.
(a) exploration and evaluation expenditure
Exploration and evaluation activities include expenditure to identify potential Mineral Resources, determine the technical feasibility and assess the commercial viability of the potential Mineral Resources.
Exploration and evaluation costs that are incurred before the Group has obtained the legal right to explore an area, or are incurred up to and including the pre‑feasibility phase, are recognised in the consolidated income statement.
Exploration and evaluation costs are capitalised as exploration and evaluation assets on an area‑of‑interest basis:
› Once an area has been deemed technically feasible and commercially viable, and the feasibility phase has been approved; or
› The expenditure relates to an area of interest acquired as part of an asset acquisition or business combination and the exploration and evaluation asset was measured at fair value on acquisition.
Exploration and evaluation assets are treated as tangible assets and classified as part of property, plant and equipment. As the assets are not yet ready for use they are not depreciated.
Exploration and evaluation assets are carried forward if the rights to the area of interest are current and the expenditures are expected to be recouped through successful development and exploitation of the area of interest, or alternatively by the sale of the asset.
The assets are monitored for indications of impairment and an assessment is performed where a potential indicator of impairment exists. For the purpose of the impairment testing, exploration and evaluation assets are allocated to
MMG0024 AR15_PFO3.indd 77 8/04/16 4:37 PM
For
per
sona
l use
onl
y

78 MMG LiMited
nOTES TO COnSOlIDATED FInAnCIAl STATEMEnTS (COnTInUED)
cash‑generating units to which the exploration activity relates. Refer to Note 2.7 for further details.
(b) Development expenditure
Once the technical feasibility and commercial viability of the development of an area of interest are demonstrable, exploration and evaluation assets attributable to that area of interest are first tested for impairment and then reclassified to construction in progress within property, plant and equipment.
The following assets are classified directly as mine property and development assets from the commencement of development:
› Mineral rights balances representing identifiable exploration and evaluation assets including Mineral Resources and Ore Reserves acquired as part of a business combination and recognised at fair value at the date of acquisition; and
› Mine rehabilitation, restoration and dismantling assets.
All subsequent expenditure to develop the mine to the production phase is capitalised and classified as construction in progress. On completion of development, construction in progress balances are reclassified to land and buildings, plant and machinery or mine property and development categories of property, plant and equipment as appropriate.
(c) overburden and waste removal
Overburden and other waste removal costs incurred in the development phase of a mine before production commences are initially capitalised as part of construction in progress. At the completion of development, costs are transferred to the mine property and development category of property, plant and equipment.
The Group defers a portion of waste removal costs incurred during the production phase of an open‑pit operation as part of determining the cost of inventories. Current period waste mining expenses are allocated between current period inventory and deferred waste assets based on the ratio of waste tonnes mined to ore tonnes mined (waste to ore ratio). The amount of deferred waste asset is calculated for each separate component of the ore body identified based on mine plans. Current period expenses are deferred to the extent that the current period waste‑to‑ore ratio exceeds the life‑of‑mine waste‑to‑ore ratio for the identified component. Deferred waste assets are categorised in the mine, property and development category of property, plant and equipment and are amortised over the life of the component on a units‑of‑production basis. Changes to estimates are accounted for prospectively.
(d) other expenditure
When further development expenditure is incurred in respect of the mine property after the commencement of the production phase, or additional property, plant and equipment are acquired, such expenditure is capitalised and
carried forward only when it is probable that future economic benefits associated with the item will flow to the Group and the cost of the item can be measured reliably.
Major spare parts are carried as property, plant and equipment when an entity expects to use them during more than one period or when they can be used only in connection with an item of property, plant and equipment. The carrying amount of the replaced part is derecognised. All other repairs and maintenance are expensed in the consolidated income statement during the accounting period in which they are incurred.
(e) Disposal of property, plant and equipment
On disposal of an item of property, plant and equipment, the difference between the disposal proceeds and the carrying amount of the asset is recognised in the consolidated income statement within other income.
2.6 INTANGIBLE ASSETS
Goodwill
Goodwill arises on the acquisition of subsidiaries, associates and joint ventures and represents the excess of the purchase consideration over the interest of the Group in the fair value of the identifiable assets, liabilities and contingent liabilities of the acquiree and the non‑controlling interest in the acquiree.
Goodwill is not amortised and is tested for impairment annually (refer to Note 2.7). For the purpose of impairment testing, goodwill acquired in a business combination is allocated to each of the cash‑generating units (CGUs), or groups of CGUs, that is expected to benefit from the synergies of the combination. Each unit or group of units to which the goodwill is allocated, represents the lowest level within the entity at which the goodwill is monitored for internal management purposes. Goodwill is monitored at the operating segment level.
Software development
Development costs that are directly attributable to the design, testing and deployment of identifiable and unique software products controlled by the Group are recognised as intangible assets when the following criteria are met:
› It is technically feasible to complete the software product so that it will be available for use;
› Management intends to complete the software product and use or sell it;
› There is an ability to use or sell the software product;
› It can be demonstrated how the software product will generate probable future economic benefits;
› Adequate technical, financial and other resources to complete the development and to use or sell the software product are available; and
› The expenditure attributable to the software product during its development can be reliably measured.
MMG0024 AR15_PFO3.indd 78 8/04/16 4:37 PM
For
per
sona
l use
onl
y

79 AnnuAl RepoRt 2015
Directly attributable costs include direct materials, employee costs, services and an appropriate portion of relevant overheads.
Other development expenditure that does not meet these criteria and costs associated with maintaining computer software programs is recognised as an expense as incurred. Development costs previously recognised as an expense are not recognised as an asset in a subsequent period.
Software development assets are amortised over their estimated useful lives, which does not exceed seven years.
2.7 IMPAIRMENT OF NON‑FINANCIAL ASSETS
All intangible assets that have an indefinite useful life, for example goodwill, or are not ready for use are tested annually for impairment or more frequently if events or changes in circumstances indicate a potential impairment.
Other non‑financial assets are reviewed for impairment whenever events or changes in circumstances indicate that the carrying amount may not be recoverable.
An impairment loss is recognised for the amount by which the carrying amount of the asset exceeds its recoverable amount. The recoverable amount is the higher of the fair value less costs to sell and value in use of an asset. For the purposes of impairment assessment, assets are grouped at the lowest levels for which there are separately identifiable cash flows. Note 6.2 outlines impairment charges in 2015.
Any impairment loss related to goodwill is recognised immediately as an expense and is not subsequently reversed. Any impairment loss related to non‑financial assets other than goodwill is reviewed and may be reversed at subsequent reporting dates. A reversal of previously recognised impairment loss is limited to the lesser of the amount that would not cause the carrying amount to exceed its recoverable amount or the carrying amount that would have been determined (net of accumulated depreciation) had no impairment loss been recognised.
2.8 ASSETS HELD FOR SALE
Assets (or disposal groups) are classified as assets (and liabilities) held for sale when their carrying amount is to be recovered principally through a sale transaction and a sale is considered highly probable. They are stated at the lower of the carrying amount and fair value less costs to sell.
2.9 FINANCIAL ASSETS
Classification
The Group classifies its financial assets in the following categories: at fair value through profit or loss, loans and receivables and available‑for‑sale. The classification depends on the purpose for which the financial assets were acquired. Management determines the classification of its financial assets at initial recognition.
(a) financial assets at fair value through profit or loss
Financial assets at fair value through profit or loss are financial assets held for trading. A financial asset is classified in this category if acquired principally for the purpose of selling in the short term. Derivatives are also categorised as held for trading unless they are designated as hedges. Assets in this category are classified as current assets if expected to be settled within 12 months; otherwise, they are classified as non‑current.
(b) loans and receivables
Loans and receivables are non‑derivative financial assets with fixed or determinable payments that are not quoted in an active market. They are included in current assets, except for the amounts that are settled or expected to be settled more than 12 months after the end of the reporting period, in which case they are classified as non‑current assets.
(c) available-for-sale financial assets
Available‑for‑sale financial assets are non‑derivatives that are either designated in this category or not classified in any of the other categories. They are included in non‑current assets unless management intends to dispose of the investment within 12 months of the end of the reporting period.
Recognition and measurements
Regular purchases and sales of financial assets are recognised on the trade date being the date on which the Group commits to purchase or sell the asset. Investments are initially recognised at fair value plus transaction costs for all financial assets not carried at fair value through profit or loss. Financial assets carried at fair value through profit or loss are initially recognised at fair value and transaction costs are expensed in the consolidated income statement. Financial assets are derecognised when the rights to receive cash flows from the investments have expired or have been transferred and the Group has transferred substantially all risks and rewards of ownership. Available‑for‑sale financial assets and financial assets at fair value through profit or loss are subsequently carried at fair value. Loans and receivables are subsequently carried at amortised cost using the effective interest method.
Gains or losses arising from changes in the fair value of the financial assets at fair value through profit or loss are presented in the consolidated income statement within expenses in the period in which they arise. Dividend income from financial assets at fair value through profit or loss is recognised in the consolidated income statement as part of other income when the right of the Group to receive payment is established.
Changes in the fair value of available‑for‑sale assets are recognised in other comprehensive income. When investments classified as available‑for‑sale are sold or impaired, the accumulated fair value adjustments recognised in equity are included in the consolidated income statement as gains and losses from investment securities. Dividend income from available‑for‑sale equity instruments are recognised in the
MMG0024 AR15_PFO3.indd 79 8/04/16 4:37 PM
For
per
sona
l use
onl
y

80 MMG LiMited
nOTES TO COnSOlIDATED FInAnCIAl STATEMEnTS (COnTInUED)
consolidated income statement as part of other income when the right of the Group to receive payment is established.
Offsetting financial instruments
Financial assets and liabilities are offset and the net amount reported in the balance sheet when there is a legally enforceable right to offset the recognised amounts and there is an intention to settle on a net basis or realise the asset and settle the liability simultaneously. The legally enforceable right must not be contingent on future events and must be enforceable in the normal course of business and in the event of default, insolvency or bankruptcy of the company or the counterparties.
Impairment of financial assets
(a) assets carried at amortised cost
The Group assesses at the end of each reporting period whether there is objective evidence that a financial asset or group of financial assets is impaired. A financial asset or a group of financial assets is impaired and impairment losses are incurred only if there is objective evidence of impairment as a result of one or more events that occurred after the initial recognition of the asset (loss event) and that loss event (or events) has an impact on the estimated future cash flows of the financial asset or group of financial assets that can be reliably estimated.
Evidence of impairment may include indications that the debtors or a group of debtors is experiencing significant financial difficulty, default or delinquency in interest or principal payments, the probability that they will enter bankruptcy or other financial reorganisation, and where observable data indicates that there is a measurable decrease in the estimated future cash flows, such as changes in arrears or economic conditions that correlate with defaults.
For the loans and receivables category, the amount of the loss is measured as the difference between the asset’s carrying amount and the present value of estimated future cash flows (excluding future credit losses that have not been incurred) discounted at the financial asset’s original effective interest rate. The carrying amount of the asset is reduced and the amount of the loss is recognised in the consolidated income statement. If a loan or held‑to‑maturity investment has a variable interest rate, the discount rate for measuring any impairment loss is the current effective interest rate determined under the contract. As a practical expedient, the Group may measure impairment on the basis of an instrument’s fair value using an observable market price.
If, in a subsequent period, the amount of the impairment loss decreases and the decrease can be related objectively to an event occurring after the impairment was recognised (such as an improvement in the debtor’s credit rating), the reversal of the previously recognised impairment loss is recognised in the consolidated income statement.
(b) assets classified as available-for-sale
The Group assesses at the end of each reporting period whether there is objective evidence that a financial asset or a group of financial assets is impaired. In the case of equity investments classified as available‑for‑sale, a significant or prolonged decline in the fair value of the security below its cost is also evidence that the assets are impaired. If any such evidence exists for available‑for‑sale financial assets, the cumulative loss – measured as the difference between the acquisition cost and the current fair value, less any impairment loss on that financial asset previously recognised in profit or loss – is removed from equity and recognised in the consolidated income statement. Impairment losses recognised in the consolidated income statement on equity instruments are not reversed through the consolidated income statement.
2.10 DERIVATIVE FINANCIAL INSTRUMENTS AND HEDGING ACTIVITIES
Derivatives are initially recognised at fair value on the date a derivative contract is entered into and are subsequently remeasured at their fair value. The method of recognising the resulting gain or loss depends on whether the derivative is designated as a hedging instrument, and if so, the nature of the item being hedged. The Group designates certain derivatives as:
› hedges of the fair value of recognised assets or liabilities or a firm commitment (fair value hedge); or
› hedges of a particular risk associated with a recognised asset or liability or a highly probable forecast transaction (cash flow hedge); or
› hedges of a net investment in a foreign operation (net investment hedge).
The Group documents at the inception of the transaction the relationship between hedging instruments and hedged items, as well as its risk management objectives and strategy for undertaking various hedge transactions. The Group also documents its assessment, both at hedge inception and on an ongoing basis, of whether the derivatives that are used in hedging transactions are highly effective in offsetting changes in fair value or cash flows of hedged items.
Certain derivatives instruments do not qualify for hedge accounting and are accounted for at fair value through profit or loss. Changes in the fair value of these derivative instruments are recognised immediately in the consolidated income statement within expenses.
2.11 FINANCIAL GUARANTEE CONTRACT
A financial guarantee contract is a contract that requires the issuer to make specified payments to reimburse the holder for a loss it incurs because a specified debtor fails to make payment when due in accordance with the original or modified terms of a debt instrument. A financial guarantee contract issued by the Group is recognised initially at its fair
MMG0024 AR15_PFO3.indd 80 8/04/16 4:37 PM
For
per
sona
l use
onl
y

81 AnnuAl RepoRt 2015
value less transaction costs that are directly attributable to the issue of the financial guarantee contract. Subsequent to initial recognition, the Group measures the financial guarantee contract at the higher of: (i) the amount determined in accordance with HKAS 37 Provisions, Contingent Liabilities and Contingent Assets; and (ii) the amount initially recognised less, when appropriate, cumulative amortisation recognised in accordance with HKAS 18 Revenue.
2.12 INVENTORIES
Inventories comprise raw materials, stores and consumables, work in progress and finished goods. Inventories are stated at the lower of cost and net realisable value.
Net realisable value is the estimated selling price in the ordinary course of business, less estimated costs of completion and less applicable variable selling expenses.
Costs are assigned to individual items of inventory on the basis of weighted average costs. Costs include the costs of direct materials, overburden removal, mining, processing, labour, related transportation costs to the point of sale, an appropriate proportion of related production overheads, mine rehabilitation costs incurred in the extraction process and other fixed and variable costs directly related to mining activities. They exclude borrowings costs.
2.13 TRADE AND OTHER RECEIVABLES
Trade and other receivables are recognised initially at fair value and subsequently measured at amortised cost using the effective interest method, less provision for impairment. If collection of trade and other receivables is expected in one year or less (or in the normal operating cycle of the business if longer), trade and other receivables are classified as current assets. If not, they are presented as non‑current assets.
2.14 CASH AND CASH EqUIVALENTS
Cash and cash equivalents include cash in hand, deposits held at call with banks, other short‑term highly liquid investments with original maturities of three months or less, and bank overdrafts. In the consolidated balance sheet, bank overdrafts, if any, are shown within borrowings in current liabilities.
2.15 FINANCIAL LIABILITIES AND EqUITY
Financial liabilities and equity instruments issued by the Group are classified according to the substance of the contractual arrangements entered into and the definitions of a financial liability and an equity instrument. Financial liabilities are initially measured at fair value, and are subsequently measured at amortised cost, using the effective interest method. Equity instruments (including ordinary shares and perpetual subordinated convertible securities) are any contract that does not meet the definition of financial liability and evidences a residual interest in the assets of the Group after deducting all of its liabilities. Subsequent to initial recognition, the equity instrument is not remeasured.
2.16 SHARE CAPITAL
Ordinary shares are classified as equity. Incremental costs directly attributable to the issue of new shares or options are shown in equity as a deduction, net of tax, from the proceeds.
Where any group company purchases the Company’s equity share capital (treasury shares), the consideration paid, including any directly attributable incremental costs (net of income taxes), is deducted from equity attributable to the Company’s equity holders until the shares are cancelled or reissued. Where such shares are subsequently reissued, any consideration received, net of any directly attributable incremental transaction costs and the related income tax effects, is included in equity attributable to the Company’s equity holders.
2.17 COMPOUND FINANCIAL INSTRUMENTS
The liability component of a compound financial instrument is recognised initially at the fair value of a similar liability that does not have an equity conversion option. The equity component is recognised initially as the difference between the fair value of the compound financial instrument as a whole and the fair value of the liability component. Any directly attributable transaction costs are allocated to the liability and equity components in proportion to their initial carrying amounts.
Subsequent to initial recognition, the liability component of a compound financial instrument is measured at amortised cost using the effective interest method. The equity component of a compound financial instrument is not remeasured subsequent to initial recognition except on conversion or expiry.
Borrowings are classified as current liabilities unless the Group has an unconditional right to defer settlement of the liability for at least 12 months after the end of the reporting period.
2.18 MINE REHABILITATION, RESTORATION AND DISMANTLING OBLIGATIONS
Provisions are made for the estimated cost of rehabilitation, restoration and dismantling relating to areas disturbed during the mine’s operations up to the reporting date but not yet rehabilitated. Provision has been made in full for all the disturbed areas at the reporting date based on current estimates of costs to rehabilitate such areas, discounted to their present value based on expected future cash flows. The estimated cost of rehabilitation includes the current cost of recontouring, top soiling and revegetation to meet legislative requirements. Changes in estimates are dealt with on a prospective basis as they arise.
Uncertainty exists as to the amount of rehabilitation obligations that will be incurred due to the impact of changes in environmental legislation, and many other factors, including future developments, changes in technology, price increases and changes in interest rates. The amount of the provision relating to mine rehabilitation, restoration and dismantling
MMG0024 AR15_PFO3.indd 81 8/04/16 4:37 PM
For
per
sona
l use
onl
y

82 MMG LiMited
nOTES TO COnSOlIDATED FInAnCIAl STATEMEnTS (COnTInUED)
obligations is recognised at the commencement of the mining project and/or construction of the assets where a legal or constructive obligation exists at that time.
The provision is recognised as a liability, separated into current (estimated costs arising within 12 months) and non‑current components, based on the expected timing of these cash flows. A corresponding asset is included in mine property and development assets, only to the extent that it is probable that future economic benefits associated with the restoration expenditure will flow to the entity, otherwise a corresponding expense is recognised in the income statement. The capitalised cost of this asset is recognised in property, plant and equipment and is amortised over the life of the mine.
At each reporting date, the rehabilitation liability is remeasured in line with changes in discount rates, and timing or amounts of the costs to be incurred. Rehabilitation, restoration and dismantling provisions are adjusted for changes in estimates. Adjustments to the estimated amount and timing of future rehabilitation and restoration cash flows are a normal occurrence in light of the significant judgements and estimates involved. Changes in the liability relating to mine rehabilitation, restoration and dismantling obligations are added to or deducted from the related asset (where it is probable that future economic benefits will flow to the entity), other than the unwinding of discount on provisions, which is recognised as a finance cost in the consolidated income statement. Changes to capitalised cost result in an adjustment to future depreciation charges.
The provisions referred to above do not include any amounts related to remediation costs associated with unforeseen circumstances.
2.19 PROVISIONS AND CONTINGENT LIABILITIES
Provisions are recognised when the Group has a present legal or constructive obligation as a result of past events, it is probable that an outflow of resources will be required to settle the obligation, and the amount has been reliably estimated.
Where there are a number of similar obligations, the likelihood that an outflow will be required in settlement is determined by considering the class of obligations as a whole. A provision is recognised even if the likelihood of an outflow with respect to any one item included in the same class of obligations may be small.
Provisions are measured at the present value of the expenditures expected to be required to settle the obligation using a pre‑tax rate that reflects current market assessments of the time value of money and the risks specific to the obligation. The increase in the provision due to the passage of time is recognised as an interest expense.
A provision for onerous contracts is recognised when the expected benefits to be derived by the Group from a contract are lower than the unavoidable cost of meeting its obligations under the contract. The provision is measured at the present
value of the lower of the expected cost of terminating the contract and the expected net cost of continuing with the contract.
A provision is recognised for the amount expected to be paid under short‑term or long‑term bonus entitlements if the Group has a present legal or constructive obligation to pay this amount as a result of past service provided by the Director or employee and the obligation can be estimated reliably.
Contingent liabilities are possible obligations that arise from past events and whose existence will only be confirmed by the occurrence of one or more future events not wholly within the control of the Group. Where it is not probable that an outflow of economic benefits will be required, or the amount cannot be estimated reliably, the obligation is disclosed as a contingent liability, unless the probability of outflow of economic benefits is remote.
2.20 BORROWINGS
Borrowings are recognised initially at fair value, net of transaction costs incurred. Borrowings are subsequently stated at amortised cost; any difference between the proceeds (net of transaction costs) and the redemption value is recognised in the consolidated income statement over the period of the borrowings using the effective interest method.
Borrowings are removed from the balance sheet when the obligation specified in the contract is discharged, cancelled or expired. The difference between the carrying amount of the financial liability and the consideration paid, including any non‑cash assets, is recognised in the consolidated income statement as finance costs.
Borrowings are classified as current liabilities unless the Group has an unconditional right to defer settlement of the liability for at least 12 months after the balance sheet date.
Borrowing costs
General and specific borrowing costs directly attributable to the acquisition, construction or production of qualifying assets, which are assets that necessarily take a substantial period of time to get ready for their intended use or sale, are added to the cost of those assets, until such time as the assets are substantially ready for their intended use or sale.
Investment income earned on the temporary investment of specific borrowings pending their expenditure on qualifying assets is deducted from the borrowing costs eligible for capitalisation.
All other borrowing costs are recognised in profit or loss in the period in which they are incurred.
2.21 CURRENT AND DEFERRED INCOME TAx
The tax expense recognised for the year comprises current and deferred tax. Tax is recognised in the consolidated income statement, except to the extent that it relates to items recognised in other comprehensive income or directly
MMG0024 AR15_PFO3.indd 82 8/04/16 4:37 PM
For
per
sona
l use
onl
y
83 AnnuAl RepoRt 2015
in equity. In this case, the tax is also recognised in other comprehensive income or directly in equity, respectively.
The current income tax charge is calculated on the basis of the tax laws enacted or substantially enacted at the balance sheet date in the places where the Company’s subsidiaries, joint arrangements and associates operate and generate taxable income. Management periodically evaluates positions taken in tax returns with respect to situations in which applicable tax regulation is subject to interpretation. It establishes provisions where appropriate on the basis of amounts expected to be paid to the tax authorities.
Deferred income tax is recognised, using the liability method, on temporary differences arising between the tax bases of assets and liabilities and their carrying amounts in the consolidated financial statements. However, the deferred income tax is not accounted for if it arises from initial recognition of an asset or a liability in a transaction other than a business combination that at the time of the transaction affects neither accounting nor taxable profit or loss. Deferred income tax is determined using tax rates (and laws) that have been enacted or substantively enacted by the balance sheet date and are expected to apply when the related deferred income tax asset is realised or the deferred income tax liability is settled.
Deferred income tax assets are recognised only to the extent that it is probable that future taxable profit will be available against which the temporary differences can be utilised.
Deferred income tax is provided on temporary differences arising on investments in subsidiaries, joint arrangements and associates, except where the timing of the reversal of the temporary difference is controlled by the Group and it is probable that the temporary difference will not reverse in the foreseeable future.
Deferred income tax assets and liabilities are offset when there is a legally enforceable right to offset current tax assets against current tax liabilities, and when the deferred income tax assets and liabilities relate to income taxes levied by the same taxation authority on either the taxable entity or different taxable entities where there is an intention to settle the balances on a net basis.
Tax consolidation – Australia
The Australian subsidiaries of the Company are an income tax consolidated group and are taxed as a single entity. MMG Australia Limited is the head company of the Australian tax consolidated group.
The subsidiaries in the Australian tax consolidated group account for their own current and deferred tax amounts. These tax amounts are measured as if each entity in the tax consolidated group continues to be a stand‑alone tax payer in its own right. In addition to its own current and deferred tax amounts, the head entity recognises the current tax liabilities (or assets) and the deferred tax assets arising from unused tax
losses and unused tax credits assumed from the other entities in the tax consolidated group.
Assets or liabilities arising under tax funding agreements between entities within the tax consolidated group entities are utilised as amounts receivable from or payable to other entities within the tax consolidated group.
2.22 TRADE AND OTHER PAYABLES
Trade and other payables are recognised initially at fair value and subsequently measured at amortised cost using the effective interest method.
Trade and other payables are classified as current liabilities if payment is due within one year or less (or in the normal operating cycle of the business if longer). If not, they are presented as non‑current liabilities.
2.23 EMPLOYEE BENEFITS
(a) employee leave entitlements
Employee entitlements to annual leave are recognised when they are accrued by employees. A provision is made for the estimated liability for annual leave as a result of services rendered by employees up to the balance sheet date. Employee entitlements to sick leave and maternity leave are not recognised until the time of leave.
(b) Pension obligations – defined contribution plans
Arrangements for staff retirement benefits are made in accordance with local regulations and customs.
For defined contribution plans, the Group pays contributions to publicly or privately administered pension insurance plans on a mandatory, contractual or voluntary basis. The Group has no further payment obligations once the contributions have been paid. The contributions are recognised as an employee benefit expense when they are due. Prepaid contributions are recognised as an asset to the extent that a cash refund or a reduction in future payment is available.
(c) long-term employee benefits
Long service leave is a period of paid leave granted to an employee in recognition of a long period of service to an employer. The liability for long service leave is recognised in the provision for employee benefits and measured as the present value of expected future payments to be made in respect of services provided by employees up to the reporting date using the projected unit credit method. Consideration is given to expected future wage and salary levels, experience of employee departures and periods of service. Expected future payments are discounted using market yields at the reporting date on national government bonds with terms to maturity and currency that match, as closely as possible, the estimated future cash outflows.
(d) Share-based compensation
The Group operates two equity‑settled, share‑based compensation plans, under which the entity receives services
MMG0024 AR15_PFO3.indd 83 8/04/16 4:37 PM
For
per
sona
l use
onl
y

84 MMG LiMited
nOTES TO COnSOlIDATED FInAnCIAl STATEMEnTS (COnTInUED)
from employees as consideration for equity instruments (options) of the Group. The fair value of the employee services received in exchange for the grant of the options is recognised as an expense. The total amount to be expensed over the vesting period is determined by reference to the fair value of the options granted, excluding the impact of any non‑market service and performance vesting conditions (for example, profitability and remaining employees of the entity over a specified period). Non‑market vesting conditions are included in assumptions about the number of options that are expected to vest. The total amount expensed is recognised over the vesting period, which is the period over which all of the specified vesting conditions are to be satisfied. At each balance sheet date, the Group revises its estimates of the number of options that are expected to vest based on the non‑market vesting conditions. It recognises the impact of the revision of original estimates, if any, in the consolidated income statement with a corresponding adjustment to equity.
The proceeds received net of any directly attributable transaction costs are credited to share capital when the options are exercised.
2.24 REVENUE RECOGNITION
Revenue comprises the fair value of the consideration received or receivable for the sale of goods and services in the ordinary course of the Group’s activities. Revenue is shown, net of value‑added tax, returns, rebates and discounts and after eliminating sales within the Group.
The Group recognises revenue when the amount of revenue can be reliably measured, it is probable that future economic benefits will flow to the entity and when specific criteria have been met for each of the Group’s activities as described below. The Group bases its estimates on historical results, taking into consideration the type of customer, the type of transaction and the specifics of each arrangement.
(a) Sales of goods
Revenue from the sale of goods and disposal of other assets is recognised when persuasive evidence of an arrangement exists, usually in the form of an executed sales agreement, indicating there has been a transfer of the significant risks and rewards to the customer, recovery of the consideration is probable, the associated costs and possible return of goods can be estimated reliably, there is no continuing management involvement with the goods, and the amount of revenue can be measured reliably. This is generally when title passes, which for the majority of commodity sales is the bill of lading date when the commodity is delivered for shipment. For non‑commodity sales, it is usually the date when a Group entity has delivered products to the customer, the customer has accepted the products, and there are no unfulfilled obligations that could affect the customer’s acceptance of the products.
Revenue on provisionally priced sales is recognised at the estimated fair value of the total consideration received or receivable. Contract terms for the Group’s concentrate sales allow for a price adjustment based on a final assay of the goods determined after discharge. Recognition of the sales revenue for these products is based on the most recently determined estimate of product assays with a subsequent adjustment made to revenue upon final determination.
The terms of sales contracts with third parties contain provisional pricing arrangements whereby the selling price for contained metal is based on prevailing spot prices during a specified future date range after shipment to the customer (quotational period). Adjustment to the sales price occurs based on movements in quoted market prices up to the completion of the quotational period. The period between provisional invoicing and quotational period completion is typically between 30 and 120 days.
The fair value of the final sales price adjustment is re‑estimated continually and changes in fair value are recognised as an adjustment to revenue. In all cases, fair value is estimated by reference to forward market prices.
Revenue is reported net of discounts and pricing adjustments. Royalties paid and payable are separately reported as expenses.
(b) Servicing income
Revenue from sales of services is recognised when the related services are rendered.
(c) Interest income
Interest income is recognised on a time‑proportion basis, using the effective interest method.
(d) rental income
Operating lease rental income is recognised on a straight‑line basis over the lease periods.
2.25 LEASES
Leases of property, plant and equipment where the Group has substantially assumed all the risks and rewards of ownership are classified as finance leases. Finance leases are capitalised at the lease inception at the lower of the fair value of the leased property and the present value of the minimum lease payments.
The corresponding rental obligations, net of finance charges, are included as interest‑bearing liabilities. Each lease payment is allocated between the liability and finance cost. The finance cost is charged to the consolidated income statement over the lease period so as to produce a constant periodic rate of interest on the remaining balance of the liability for each period. The property, plant and equipment acquired under finance leases is depreciated over the asset’s useful life or over the shorter of the asset’s useful life and the lease term if there is no reasonable certainty that the Group will obtain ownership at the end of the lease term.
MMG0024 AR15_PFO3.indd 84 8/04/16 4:37 PM
For
per
sona
l use
onl
y

85 AnnuAl RepoRt 2015
Leases in which a significant portion of the risks and rewards of ownership are retained by the lessor are classified as operating leases. Payments made under operating leases (net of any incentives received from the lessor), including upfront payment made for leasehold land and land use rights, are charged to the consolidated income statement on a straight‑line basis over the period of the lease.
2.26 DIVIDEND DISTRIBUTION
Dividend distribution to the Company’s Shareholders is recognised as a liability in the Group’s and the Company’s financial statements in the period in which the dividends are approved by the Company’s Shareholders or the Board, as appropriate.
3. CrITICal aCCoUNTING eSTIMaTeS aND JUDGeMeNTS
Estimates and judgements are continually evaluated and are based on historical experience and other factors, including expectations of future events that are believed to be reasonable under the circumstances.
The Group makes estimates and assumptions concerning the future. The resulting accounting estimates will, by definition, seldom equal the related actual results. The estimates and assumptions that have a significant risk of causing a material adjustment to the carrying amounts of assets and liabilities within the next financial year are discussed below.
(a) Mine rehabilitation, restoration and dismantling obligations
Provision is made for the anticipated costs of future restoration, rehabilitation and dismantling of mining areas from which natural resources have been extracted in accordance with the accounting policy in Note 2.18. These provisions include future cost estimates associated with reclamation, plant closures, waste site closures, monitoring, demolition, decontamination, water purification and permanent storage of historical residues. These future cost estimates are discounted to their present value. The calculation of these provision estimates requires assumptions such as the application of environmental legislation, the scope and timing of planned activities, available technologies, engineering cost estimates and discount rates. A change in any of the assumptions used may have a material impact on the carrying value of mine rehabilitation, restoration and dismantling provisions. For non‑operating sites, changes to estimated costs are recognised immediately in the consolidated income statement.
(b) Mineral resources and ore reserves estimates
The estimated quantities of economically recoverable Mineral Resources and Ore Reserves are based upon interpretations of geological and geophysical models and require assumptions to be made regarding factors such as estimates of short and long‑term exchange rates, estimates of short and long‑term commodity prices, future capital requirements and future
operating performance. Changes in reported Reserves and Resources estimates can impact the carrying value of property, plant and equipment, provisions for mine rehabilitation, restoration and dismantling obligations, the recognition of deferred tax assets, as well as the amount of depreciation and amortisation charged to the consolidated income statement. The changes are effective from the month following Board approval of the revised Reserves and Resources estimates.
(c) Income taxes and other taxes
The Group is subject to taxes in a number of jurisdictions. Some of these are in countries that carry higher levels of sovereign risk. Management continually assesses the levels of sovereign risk in other jurisdictions in determining whether political and administrative changes and reforms in laws, regulations or taxation may impact the Group’s future performance.
Significant judgement is required in determining the tax position and the estimates and assumptions in relation to the provision for taxes and the recovery of tax assets, having regard to the nature and timing of their origination and compliance with the relevant tax legislation. There are some tax matters for which the ultimate tax determination is uncertain during the ordinary course of business. Where the final tax outcome of these matters is different from the amounts that were initially recorded, such differences will impact the tax balances in the accounting period in which such determination is made.
Deferred tax assets are recognised for deductible temporary differences and unused tax losses only if it is probable that future taxable profits will be available to utilise those temporary differences and losses, and the tax losses continue to be available having regard to the nature and timing of their origination and compliance with the relevant tax legislation associated with their recoupment.
(d) recoverability of non-financial assets
The recoverable amount of each of the Group’s cash‑generating units and development projects is determined as the higher of the asset’s fair value less costs to sell and its value in use in accordance with the accounting policy in Note 2.7. These calculations require the use of estimates and assumptions including discount rates, exchange rates, commodity prices, future capital requirements and future operating performance. Impairment charges are outlined in Note 6.2.
(e) functional currency
An entity’s functional currency is the currency of the primary economic environment in which the entity operates in accordance with the accounting policy in Note 2.4. Determination of an entity’s functional currency requires management judgement when considering a number of factors including the currency that mainly influences sales prices, costs of production, and competitive forces and regulations that impact sales prices. In addition, consideration
MMG0024 AR15_PFO3.indd 85 8/04/16 4:37 PM
For
per
sona
l use
onl
y

86 MMG LiMited
nOTES TO COnSOlIDATED FInAnCIAl STATEMEnTS (COnTInUED)
must be given to the currency in which financing and operating activities are undertaken. Applying the principles described above, management has come to the conclusion that the functional currency of the majority of subsidiaries within the Group is US dollars based on the following factors:
› Sales are predominantly denominated in US dollars;
› A significant portion of costs are denominated in US dollars;
› A significant portion of debt and finance costs are denominated in US dollars; and
› Senior management and Board reporting is conducted in US dollars.
(f) Determination of control of subsidiaries
The Group exercises judgement to determine when MMG has control of subsidiaries in accordance with the accounting policy outlined in Note 2.2(c). This control assessment considers whether the Group has the power to direct the relevant activities that significantly affect the returns of subsidiaries.
As outlined in Note 16, the Group has assessed the investment holding company of the Las Bambas Project, MMG South America Management Company (Las Bambas Joint Venture Company), to be a subsidiary of the Group. The Group holds a 62.5% equity interest in the Las Bambas Joint Venture Company and controls the simple majority of votes cast on the board of directors. Under the terms of the Shareholders’ Agreement, decisions on certain matters require prior approval of the Las Bambas Joint Venture Company board by such number of the directors that together hold more than 85% of the total voting entitlements of all directors entitled to vote. The Group has judged that the clauses related to these matters convey in principle protective rights to other investors and not substantive rights. This judgement will be reassessed by the Group on an ongoing basis. Different conclusions around these judgements may materially impact how Las Bambas balance sheet items, comprehensive income items and cash flows are presented in the consolidated financial statements; whether amounts are presented under the full consolidation method or presented in line with the equity accounting method.
(g) Determining whether an arrangement contains a lease
The Group exercises significant judgement in the application of HKAS 17 ‘Leases’ and HK(IFRIC) Interpretation 4 ‘Determining whether an Arrangement contains a Lease’ in assessing the accounting for arrangements which may contain a lease.
4. SeGMeNT INforMaTIoN
HKFRS 8 Operating Segments requires operating segments to be identified on the basis of internal reports about operations of the Group that are regularly reviewed by the chief operating decision‑maker in order to allocate resources to the segment and assess its performance.
The chief operating decision‑maker has been identified as the Company’s Executive Committee, which consists of all Executive Directors of the Company being CEO and Executive General Manager – China and Group Strategy, Chief Financial Officer, Chief Operating Officer, Executive General Manager – Business Support and Executive General Manager – Stakeholder Relations. They review the Group’s internal reporting of these operations in order to assess performance and allocate resources.
The Group’s reportable segments are as follows:
Sepon Sepon is an open‑pit copper mining operation located in southern Laos.
Kinsevere Kinsevere is an open‑pit copper mining operation located in the Katanga Province of the Democratic Republic of the Congo (DRC).
Century Century is an open‑pit zinc mining operation located in north‑west Queensland.
Rosebery Rosebery is an underground polymetallic base metal mining operation located on Tasmania’s west coast.
Golden Grove
Golden Grove is an underground and open‑pit base and precious metals mining operation located in Western Australia’s mid‑west.
Las Bambas The Las Bambas Project is a large, scalable, long‑life copper development project with prospective exploration options. It is located in Cotabambas, Apurimac region of Peru. The project is at an advanced stage of construction.
Other Includes exploration and development projects and other corporate entities that are not disclosed as separate segments. All other segments are immaterial by location.
A segment result represents the EBIT by each segment. This is the measure reported to the chief operating decision‑maker for the purposes of resource allocation and assessment of segment performance. Other information provided, except as disclosed in the following paragraph, to the chief operating decision‑maker is measured in a manner consistent with that in the financial statements.
Segment assets exclude current income tax assets and deferred income tax assets. Segment liabilities exclude current income tax liabilities, deferred income tax liabilities and net inter‑segment loans. The excluded assets and liabilities are presented as part of the reconciliation to total balance sheet assets or liabilities.
MMG0024 AR15_PFO3.indd 86 8/04/16 4:37 PM
For
per
sona
l use
onl
y

87 AnnuAl RepoRt 2015
The segment revenue and results for the years ended 31 December 2015 and 2014 are as follows:
FOR ThE yEAR EnDED 31 DECEMBER 2015
US$ million Sepon Kinsevere Century RoseberyGolden
GroveLas
Bambas1
Other unallocat‑ed items/ elimina‑
tions Group
External revenue 366.4 418.1 591.7 201.1 214.3 – – 1,791.6
Revenue from related parties 130.5 – 21.9 – 6.9 – – 159.3
Revenue 496.9 418.1 613.6 201.1 221.2 – – 1,950.9
EBITDA 248.8 131.8 159.8 79.1 19.5 (72.1) (146.0) 420.9
Depreciation and amortisation expenses (114.4) (190.1) (224.6) (66.6) (44.6) – (9.1) (649.4)
EBIT (underlying) 134.4 (58.3) (64.8) 12.5 (25.1) (72.1) (155.1) (228.5)
Finance income 3.8
Finance costs (88.8)
Income tax credit (underlying) 49.1
Loss for the year (underlying) (264.4)
Impairment of assets – (52.5) – – – – (633.1) (685.6)
Impairment of goodwill – (211.4) – – – – – (211.4)
Income tax credit on impairment charge 112.7 112.7
Loss for the year (1,048.7)
Loss attributable to equity holders of the Company (1,026.5)
Loss attributable to non‑controlling interests (22.2)
(1,048.7)
Other segment information:
Additions to non‑current assets 99.3 100.7 (42.3) 45.5 22.8 1,758.0 119.7 2,103.7
AS AT 31 DECEMBER 2015
US$ million Sepon Kinsevere Century RoseberyGolden
GroveLas
Bambas1
Other unallocat‑ed items/ elimina‑
tions Group
Segment assets 787.1 1,244.4 33.0 389.8 291.0 10,901.8 643.02 14,290.1
Deferred income tax assets 368.5
Current income tax assets 1.4
14,660.0
Segment liabilities 227.2 177.3 391.1 106.6 70.4 6,913.3 3,823.13 11,709.0
Deferred income tax liabilities 744.0
Current income tax liabilities 31.8
12,484.8
MMG0024 AR15_PFO3.indd 87 8/04/16 4:37 PM
For
per
sona
l use
onl
y

88 MMG LiMited
nOTES TO COnSOlIDATED FInAnCIAl STATEMEnTS (COnTInUED)
FOR ThE yEAR EnDED 31 DECEMBER 2014
US$ million Sepon Kinsevere Century RoseberyGolden
GroveLas
Bambas1
Other unallocat‑ed items/ elimina‑
tions Group
External revenue 532.7 465.7 845.1 247.5 226.9 – – 2,317.9
Revenue from related parties 87.5 – 8.2 – 66.2 – – 161.9
Revenue 620.2 465.7 853.3 247.5 293.1 – – 2,479.8
EBITDA 366.5 189.3 323.5 85.2 29.0 (42.3) (170.4) 780.8
Depreciation and amortisation expenses (98.9) (140.3) (191.3) (46.5) (44.2) – (15.9) (537.1)
EBIT 267.6 49.0 132.2 38.7 (15.2) (42.3) (186.3) 243.7
Finance income 3.3
Finance costs (82.7)
Income tax expense (65.1)
Profit for the year 99.2
Profit attributable to equity holders of the Company 103.8
Loss attributable to non‑controlling interests (4.6)
99.2
Other segment information:
Additions to non‑current assets 117.7 72.8 171.6 98.9 58.7 897.4 55.9 1,473.0
AS AT 31 DECEMBER 2014
US$ million Sepon Kinsevere Century RoseberyGolden
GroveLas
Bambas1
Other unallocat‑ed items/ elimina‑
tions Group
Segment assets 796.8 1,575.4 388.2 426.6 335.3 8,827.4 938.12 13,287.8
Deferred income tax assets 173.6
Current income tax assets 28.6
13,490.0
Segment liabilities 214.4 160.6 428.5 121.1 73.7 5,429.9 3,245.43 9,673.6
Deferred income tax liabilities 769.9
Current income tax liabilities 71.9
10,515.4
1. Las Bambas segment refers to MMG South America Management Company Limited and its subsidiaries. MMG South America Company Limited holds 62.5% of MMG South America Management Company Limited and is included in ‘Other unallocated items/eliminations’ segment.
2. Included in segment assets of US$643.0 million (2014: US$938.1 million) for the Other segment are cash of US$381.9 million (2014: US$66.2 million) mainly held at Group treasury entities, property, plant and equipment of US$125.6 million (2014: US$626.7 million) for Dugald River, capitalised borrowing cost of US$107.4 million (2014: US$27.9 million) in MMG South America Company Limited in relation to Las Bambas Project and other financial assets of US$17.0 million (2014: US$30.6 million) (Note 31.3). These items do not fall into any of the six reportable segments.
3. Included in segment liabilities of US$3,823.1 million (2014: US$3,245.4 million) for the Other segment are borrowings of US$3,649.4 million (2014: US$3,086.0 million), which are managed at Group level, and do not fall into any of the six reportable segments.
MMG0024 AR15_PFO3.indd 88 8/04/16 4:37 PM
For
per
sona
l use
onl
y

89 AnnuAl RepoRt 2015
5. oTher INCoMe
2015 US$ MILLION
2014 US$ MILLION
Gain on disposal of financial assets 0.2 10.7
Gain/(loss) on disposal of property, plant and equipment 0.1 (0.9)
Other income 1.4 7.0
Total other income 1.7 16.8
6. eXPeNSeS
6.1 (LOSS)/PROFIT BEFORE INCOME TAx INCLUDES THE FOLLOWING SPECIFIC ExPENSES:
2015 US$ MILLION
2014 US$ MILLION
Changes in inventories of finished goods and work in progress 16.7 (42.5)
Write‑down of inventories to net realisable value (27.5) (5.7)
Employee benefit expenses1 (269.7) (327.1)
Contracting and consulting expenses (201.3) (235.6)
Energy costs (176.7) (214.4)
Stores and consumables costs (331.4) (358.6)
Depreciation and amortisation expenses2 (640.3) (521.2)
Operating lease rental3 (31.4) (17.3)
Other production expenses (9.6) (14.8)
Cost of goods sold (1,671.2) (1,737.2)
Other operating expenses (100.8) (61.4)
Royalty expenses (83.6) (98.5)
Selling expenses (97.9) (115.4)
Impairment expenses (Note 6.2) (263.9) –
Operating expenses including depreciation, amortisation and impairment (2,217.4) (2,012.5)
Exploration expenses1,3 (42.4) (73.0)
Administrative expenses1,3 (90.8) (111.5)
Business acquisition expenses – (16.3)
Auditor’s remuneration (1.9) (1.9)
Foreign exchange (losses)/gains – net (56.4) 1.4
Loss on financial assets at fair value through profit or loss (2.2) (10.9)
Impairment expenses in non‑operating entities (Note 6.2) (633.1) –
Other expenses1,2,3 (33.9) (28.2)
Total expenses (3,078.1) (2,252.9)
Total expenses comprise:
2015 US$ MILLION
2014US$ MILLION
Expenses (excluding depreciation, amortisation and impairment expenses) (1,531.7) (1,715.8)
Depreciation, amortisation and impairment expenses (1,546.4) (537.1)
Total expenses (3,078.1) (2,252.9)
1. In aggregate US$112.0 million (2014: US$119.5 million) employee benefits expense by nature is included in the administrative expenses, exploration expenses and other expenses categories. Total employee benefits expenses are US$381.7 million (2014: US$446.6 million) (Note 11).
2. In aggregate US$9.1 million (2014: US$15.9 million) depreciation and amortisation expenses are included in other expenses category. Total depreciation and amortisation expenses are US$649.4 million (2014: US$537.1 million).
3. In aggregate, an additional US$7.9 million (2014: US$10.3 million) operating lease rentals are included in administrative expenses, exploration expenses and other expenses categories. Total operating lease rentals are US$39.3 million (2014: US$27.6 million).
MMG0024 AR15_PFO3.indd 89 8/04/16 4:37 PM
For
per
sona
l use
onl
y
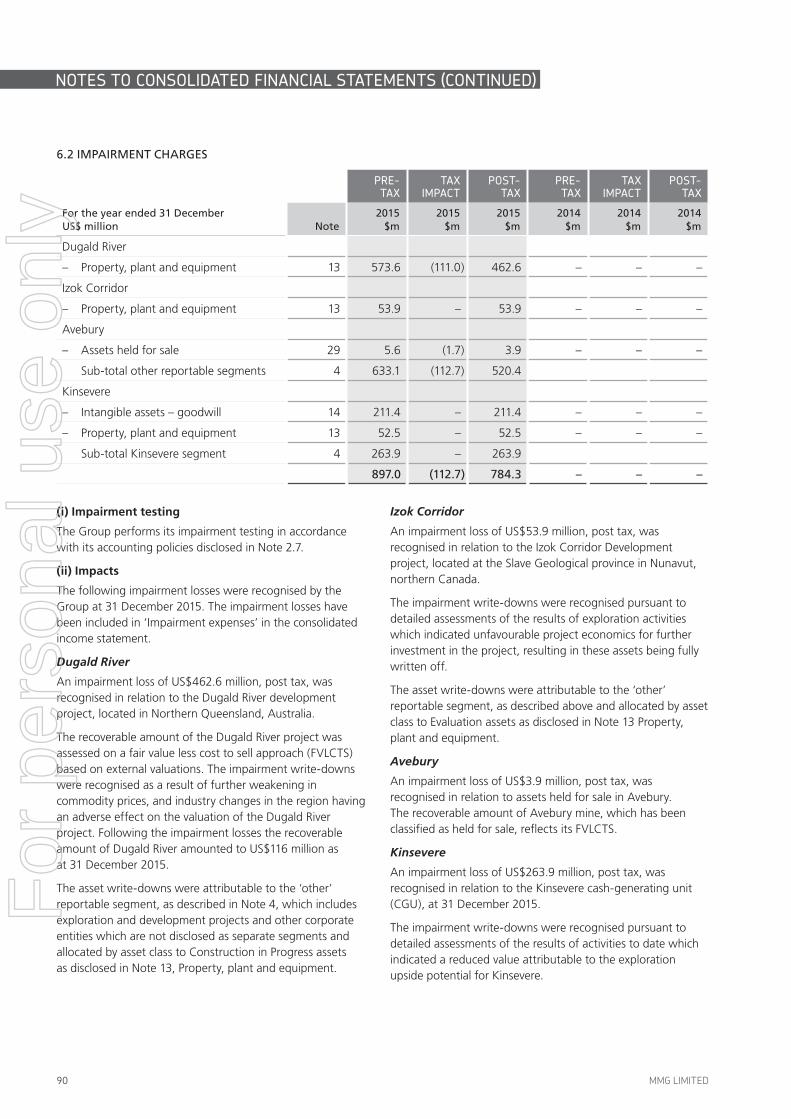
90 MMG LiMited
nOTES TO COnSOlIDATED FInAnCIAl STATEMEnTS (COnTInUED)
6.2 IMPAIRMENT CHARGES
For the year ended 31 December US$ million
pRE- TAX
TAX IMpACT
pOST- TAX
pRE- TAX
TAX IMpACT
pOST- TAX
Note2015
$m2015
$m2015
$m2014
$m2014
$m2014
$m
Dugald River
– Property, plant and equipment 13 573.6 (111.0) 462.6 – – –
Izok Corridor
– Property, plant and equipment 13 53.9 – 53.9 – – –
Avebury
– Assets held for sale 29 5.6 (1.7) 3.9 – – –
Sub‑total other reportable segments 4 633.1 (112.7) 520.4
Kinsevere
– Intangible assets – goodwill 14 211.4 – 211.4 – – –
– Property, plant and equipment 13 52.5 – 52.5 – – –
Sub‑total Kinsevere segment 4 263.9 – 263.9
897.0 (112.7) 784.3 – – –
(i) Impairment testing
The Group performs its impairment testing in accordance with its accounting policies disclosed in Note 2.7.
(ii) Impacts
The following impairment losses were recognised by the Group at 31 December 2015. The impairment losses have been included in ‘Impairment expenses’ in the consolidated income statement.
Dugald River
An impairment loss of US$462.6 million, post tax, was recognised in relation to the Dugald River development project, located in Northern Queensland, Australia.
The recoverable amount of the Dugald River project was assessed on a fair value less cost to sell approach (FVLCTS) based on external valuations. The impairment write‑downs were recognised as a result of further weakening in commodity prices, and industry changes in the region having an adverse effect on the valuation of the Dugald River project. Following the impairment losses the recoverable amount of Dugald River amounted to US$116 million as at 31 December 2015.
The asset write‑downs were attributable to the ‘other’ reportable segment, as described in Note 4, which includes exploration and development projects and other corporate entities which are not disclosed as separate segments and allocated by asset class to Construction in Progress assets as disclosed in Note 13, Property, plant and equipment.
Izok Corridor
An impairment loss of US$53.9 million, post tax, was recognised in relation to the Izok Corridor Development project, located at the Slave Geological province in Nunavut, northern Canada.
The impairment write‑downs were recognised pursuant to detailed assessments of the results of exploration activities which indicated unfavourable project economics for further investment in the project, resulting in these assets being fully written off.
The asset write‑downs were attributable to the ‘other’ reportable segment, as described above and allocated by asset class to Evaluation assets as disclosed in Note 13 Property, plant and equipment.
Avebury
An impairment loss of US$3.9 million, post tax, was recognised in relation to assets held for sale in Avebury. The recoverable amount of Avebury mine, which has been classified as held for sale, reflects its FVLCTS.
Kinsevere
An impairment loss of US$263.9 million, post tax, was recognised in relation to the Kinsevere cash‑generating unit (CGU), at 31 December 2015.
The impairment write‑downs were recognised pursuant to detailed assessments of the results of activities to date which indicated a reduced value attributable to the exploration upside potential for Kinsevere.
MMG0024 AR15_PFO3.indd 90 8/04/16 4:37 PM
For
per
sona
l use
onl
y

91 AnnuAl RepoRt 2015
Goodwill arising on acquisition of Anvil Mining, in 2012, of US$211.4 million post tax, was fully written down and a write‑off of US$52.5 million, post tax, was made in relation to the exploration tenements, located adjacent to the Kinsevere mine. Following the above impairment losses the recoverable amount of the CGU amounted to US$1,080 million, equating to its FVLCTS.
The determination of FVLCTS used level 3 valuation techniques estimating post‑tax cash flows in real terms until the end of life of mine plan including anticipated expansions. Commodity price and exchange rate assumptions are based on the latest internal forecasts benchmarked to analyst consensus forecasts. The long‑term copper price assumption applied in determination of the FVLTCS was $2.95 per pound of copper. The long‑term cost assumptions have been based on past experience. The real post‑tax cash flow forecasts are discounted at the real post‑tax discount rate of 8.0% (2014: 8.0%).
The key assumptions to which the calculation of FVLCTS for Kinsevere is most sensitive are copper price, operating costs and post‑tax discount rate. An adverse change of 5% in copper prices would decrease the recoverable amount by approximately US$180 million, an adverse change of 5% in operating costs would decrease the recoverable amount by
approximately US$60 million, and an adverse change of 0.5% in post‑tax discount rate would reduce the recoverable amount by approximately US$40 million. This sensitivity analysis assumes that the adverse change in the key assumptions occurs in isolation of changes to other key assumptions and that no mitigating action is taken by management.
The asset write‑downs were attributable to the Kinsevere reportable segment, as disclosed in Note 4, with the impairment allocated between Intangible assets, in Note 14 and Evaluation assets, in Note 13.
(iii) Sensitivity analysisSepon, Rosebery and Golden Grove CGUs
In addition to the impairment testing performed at 31 December 2015, the Group also undertook a sensitivity analysis on its Sepon, Rosebery, and Golden Grove CGUs. These CGUs have fair values that exceed their carrying value. The recoverable amounts of these CGUs were assessed on a FVLCTS approach using level 3 valuation techniques including using a real post‑tax discount rate of 8% and a long‑term copper price of $2.95 per pound of copper. The valuations of these CGUs remain sensitive to price and a further deterioration in long‑term prices may result in future impairment write‑downs.
7. fINaNCe CoSTS – NeT
2015 US$ million
2014 US$ million
Finance income
Interest income on cash and cash equivalents 3.8 3.3
3.8 3.3
Finance costs
Interest expense on bank borrowings (23.3) (30.6)
Interest expense on convertible redeemable preference shares (19.6) (19.6)
Interest expense on related party borrowings (Note 30(a)) – (0.5)
Unwinding of discount on provisions (Note 25(a)) (33.6) (25.1)
Other finance cost on external borrowings (12.3) (4.3)
Other finance cost on related party borrowings (Note 30(a)) – (2.6)
(88.8) (82.7)
Finance costs – net (85.0) (79.4)
Borrowing costs capitalised
Borrowing costs capitalised on qualifying assets1 352.2 135.8
1. Borrowing costs capitalised include finance costs on borrowings held to specifically fund the assets, net of interest income earned on the temporary investment of those funds, and finance costs on general borrowings capitalised at the rate of 3.2% (2014: 3.0%) per annum representing the average interest rate on relevant general borrowings.
MMG0024 AR15_PFO3.indd 91 8/04/16 4:37 PM
For
per
sona
l use
onl
y

92 MMG LiMited
nOTES TO COnSOlIDATED FInAnCIAl STATEMEnTS (COnTInUED)
8. INCoMe TaX CreDIT/(eXPeNSe)
Hong Kong profits tax is provided at a rate of 16.5% where there are net assessable profits derived for the year. Taxation on profits arising from other jurisdictions has been calculated on the estimated assessable profits for the year at the rates prevailing in the relevant jurisdictions.
2015 US$ million
2014 US$ million
Current income tax
– Hong Kong income tax – –
– Overseas income tax (69.5) (101.0)
(69.5) (101.0)
Deferred income tax
– Hong Kong income tax – –
– Overseas income tax 231.3 35.9
231.3 35.9
Income tax credit/(expense) 161.8 (65.1)
There is no deferred tax impact relating to items of other comprehensive income (2014: US$nil).
The tax on the Group’s profit before income tax differs from the theoretical amount that would arise using the applicable tax rate to profits of the consolidated companies as follows:
2015 US$ million
2014 US$ million
(Loss)/profit before income tax (1,210.5) 164.3
Calculated at domestic tax rates applicable to profits in the respective countries1 347.8 (65.4)
Net (non‑deductible)/non‑taxable amounts2 (84.4) 1.6
Net (unrecognised)/recognised deferred tax assets3 (77.5) 13.0
(Under)/overprovision in prior years (1.8) 7.8
Non‑creditable withholding tax4 (22.3) (22.1)
Income tax credit/(expense) 161.8 (65.1)
1. The income tax rates applicable for the main jurisdictions in which the Group operates are: Australia (30.0%), Laos (33.3%), Peru (32.0%) and the DRC (30.0%). Tax rates for some jurisdictions are covered by historical legal agreements with governments.
2. Non‑deductible amounts in 2015 comprise primarily of the tax effect impact of impairment to goodwill and African evaluation assets.
3. Amounts in 2015 are mainly due to unrecognised temporary differences arising in relation to MMG’s Australian and Canadian assets.
4. Non‑recoverable withholding tax paid under Peruvian tax law.
9. (loSS)/earNINGS Per Share
Basic (loss)/earnings per share is calculated by dividing the (loss)/profit attributable to equity holders of the Company by the weighted average number of ordinary shares in issue during the year.
Diluted (loss)/earnings per share is calculated by adjusting the weighted average number of ordinary shares outstanding to assume conversion of all dilutive potential ordinary shares. For the Company’s share options and performance awards in issue, a calculation is performed to determine the number of shares that could have been acquired at fair value (determined at the average market share price of the
Company’s shares) based on the monetary value of the subscription rights attached to outstanding share options and performance awards. The number of shares calculated as above is compared with the number of shares that would have been issued assuming the exercise of the share options and performance awards.
The Group has also chosen to present an alternative earnings per share measure, with (loss)/profit adjusted for non‑recurring items because it better reflects the Group’s underlying performance.
MMG0024 AR15_PFO3.indd 92 8/04/16 4:37 PM
For
per
sona
l use
onl
y

93 AnnuAl RepoRt 2015
nUMBER OF ShARES
2015 ‘000
2014 ‘000
Weighted average number of ordinary shares used in the calculation of the basic earnings per share 5,290,070 5,289,608
Weighted average number of ordinary shares used in the calculation of the diluted earnings per share1 5,290,070 5,289,608
1. Diluted earnings per share is the same as basic earnings per share for the years ended 31 December 2015 and 31 December 2014. The computation of diluted earnings per share does not assume the exercise of the Company’s outstanding share options and performance awards since these are in an out‑of‑the‑money position as at 31 December 2014 and 31 December 2015. The computation of diluted earnings per share does not assume the exercise of the Company’s outstanding share options and performance awards since their exercise would result in an anti‑dilutive effect on the basic earnings per share for the years ended 31 December 2015 and 31 December 2014.
2015 US$ million
2014 US$ million
(Loss)/profit attributable to equity holders of the Company (1,026.5) 103.8
Non‑recurring items
Impairment (Note 6) 897.0 –
Tax associated with impairment (Note 6.2) (112.7) –
Underlying (loss)/profit before non‑recurring items (242.2) 103.8
Earnings per share is calculated as follows:
2015 2014
Basic (loss)/earnings per share (US 19.4 cents) US 1.96 cents
Diluted (loss)/earnings per share (US 19.4 cents) US 1.96 cents
Basic (loss)/earnings per share pre impairment charge (US 4.6 cents) US 1.96 cents
Diluted (loss)/earnings per share pre impairment charge (US 4.6 cents) US 1.96 cents
10. DIVIDeNDS
The Directors of the Company did not recommend the payment of a final dividend for the year ended 31 December 2015. (2014: US$nil).
2015 US$ million
2014 US$ million
Dividends paid/payable during the year
MMG Limited 2013 final dividend – 52.9
– 52.9
11. eMPloYee BeNefIT eXPeNSeS, INClUDING DIreCTorS’ eMolUMeNTS
(A) TOTAL EMPLOYEE BENEFIT ExPENSES
2015 US$ million
2014 US$ million
Salaries and other benefits 361.3 424.0
Retirement scheme contributions (Note 11(b)) 20.4 22.6
Total employee benefit expenses (Note 6) 381.7 446.6
MMG0024 AR15_PFO3.indd 93 8/04/16 4:37 PM
For
per
sona
l use
onl
y

94 MMG LiMited
nOTES TO COnSOlIDATED FInAnCIAl STATEMEnTS (COnTInUED)
(B) RETIREMENT SCHEMES
The Group provides retirement benefits to all Hong Kong eligible employees under the Mandatory Provident Fund (MPF Scheme). Under the MPF Scheme, the Group and its employees make monthly contributions to the MPF Scheme at 5% of the employees’ salaries as defined under the Mandatory Provident Fund legislation. Contributions of both the Hong Kong subsidiaries and their employees are subject to a maximum of HK$1,500 per month and thereafter contributions are voluntary and are not subject to any limitation. The MPF Scheme is administered by an independent trustee and its assets are held separately from those of the
Group. The Group provides a superannuation contribution for all Australian‑based employees to their nominated superannuation fund. This contribution is to provide benefits for employees and their dependants in retirement, and for relevant employees, disabilities or death. In accordance with the applicable regulation in Australia, the Group is required to contribute at a minimum rate of 9.5% of ordinary time earnings of the Australian‑based employee.
Total contributions made for the year ended 31 December 2015 amounted to US$20.4 million (2014: US$22.6 million).
12. DerIVaTIVe fINaNCIal INSTrUMeNTS
2015 US$ million
2014 US$ million
Forward foreign exchange contracts – cash flow hedges 0.3 –
The notional principal amounts and the fair value of the outstanding forward foreign exchange contracts at 31 December 2015 were US$7.0 million (2014: nil) and $0.3 million liability (2014: nil) respectively.
13. ProPerTY, PlaNT aND eqUIPMeNT
US$ millionLand and buildings
Plant and machinery
Mine property
and development Evaluation
Construction in progress
Total property, plant and
equipment
As at 1 January 2015
Cost 162.9 1,875.3 3,997.1 107.9 6,858.4 13,001.6
Accumulated depreciation and amortisation (91.5) (965.7) (843.6) – – (1,900.8)
Net book amount at 1 January 2015 71.4 909.6 3,153.5 107.9 6,858.4 11,100.8
Year ended 31 December 2015
At the beginning of the year 71.4 909.6 3,153.5 107.9 6,858.4 11,100.8
Additions1 0.6 56.4 65.8 – 1,954.9 2,077.7
Depreciation and amortisation (19.8) (201.3) (403.4) – – (624.5)
Disposals (net) – (0.4) – (0.3) (0.3) (1.0)
Impairment (Note 6.2) – – – (106.4) (573.6) (680.0)
Transfers (net) 5.2 67.4 37.2 (1.2) (108.6) –
At the end of the year 57.4 831.7 2,853.1 – 8,130.8 11,873.0
As at 31 December 2015
Cost 168.7 1,982.3 4,099.9 106.7 8,704.2 15,061.8
Accumulated depreciation, amortisation and impairment (111.3) (1,150.6) (1,246.8) (106.7) (573.4) (3,188.8)
Net book amount at 31 December 2015 57.4 831.7 2,853.1 – 8,130.8 11,873.0
MMG0024 AR15_PFO3.indd 94 8/04/16 4:37 PM
For
per
sona
l use
onl
y

95 AnnuAl RepoRt 2015
US$ millionLand and buildings
Plant and machinery
Mine property
and development Evaluation
Construction in progress
Total property, plant and
equipment
As at 1 January 2014
Cost 259.9 1,789.1 1,926.3 55.6 689.6 4,720.5
Accumulated depreciation and amortisation (104.8) (742.0) (549.8) (0.8) – (1,397.4)
Net book amount at 1 January 2014 155.1 1,047.1 1,376.5 54.8 689.6 3,323.1
Year ended 31 December 2014
At the beginning of the year 155.1 1,047.1 1,376.5 54.8 689.6 3,323.1
Acquisition of subsidiaries (Note 28) 3.4 1.4 1,682.2 – 5,181.1 6,868.1
Additions1 2.9 69.5 281.8 53.7 1,017.1 1,425.0
Depreciation and amortisation (29.4) (236.1) (249.0) – – (514.5)
Disposals (net) – (0.9) – – – (0.9)
Transfers (net) (60.6) 28.6 62.0 (0.6) (29.4) –
At the end of the year 71.4 909.6 3,153.5 107.9 6,858.4 11,100.8
As at 31 December 2014
Cost 162.9 1,875.3 3,997.1 107.9 6,858.4 13,001.6
Accumulated depreciation and amortisation (91.5) (965.7) (843.6) – – (1,900.8)
Net book amount at 31 December 2014 71.4 909.6 3,153.5 107.9 6,858.4 11,100.8
1. During the year, the Group capitalised borrowing costs of US$352.2 million (2014: US$135.8 million) on qualifying assets, which form part of the additions to the cost of property, plant and equipment. The cash payment of interest capitalised is included within ‘Interest and financing costs paid’ in the cash flow statement.
MMG0024 AR15_PFO3.indd 95 8/04/16 4:37 PM
For
per
sona
l use
onl
y

96 MMG LiMited
nOTES TO COnSOlIDATED FInAnCIAl STATEMEnTS (COnTInUED)
14. INTaNGIBle aSSeTS
US$ million Goodwill (a)Software
development Total
As at 1 January 2015
Cost 739.9 127.0 866.9
Accumulated amortisation – (27.9) (27.9)
Net book amount at 1 January 2015 739.9 99.1 839.0
Year ended 31 December 2015
At the beginning of the year 739.9 99.1 839.0
Additions – 26.0 26.0
Amortisation – (25.0) (25.0)
Impairment (Note 6.2) (211.4) – (211.4)
At the end of the year 528.5 100.1 628.6
As at 31 December 2015
Cost 528.5 153.0 681.5
Accumulated amortisation and impairment – (52.9) (52.9)
Net book amount at 31 December 2015 528.5 100.1 628.6
As at 1 January 2014
Cost 211.4 77.6 289.0
Accumulated amortisation – (5.0) (5.0)
Net book amount at 1 January 2014 211.4 72.6 284.0
Year ended 31 December 2014
At the beginning of the year 211.4 72.6 284.0
Acquisition of subsidiaries (Note 28) 528.5 1.4 529.9
Additions – 48.0 48.0
Amortisation – (22.9) (22.9)
At the end of the year 739.9 99.1 839.0
As at 31 December 2014
Cost 739.9 127.0 866.9
Accumulated amortisation – (27.9) (27.9)
Net book amount at 31 December 2014 739.9 99.1 839.0
MMG0024 AR15_PFO3.indd 96 8/04/16 4:37 PM
For
per
sona
l use
onl
y
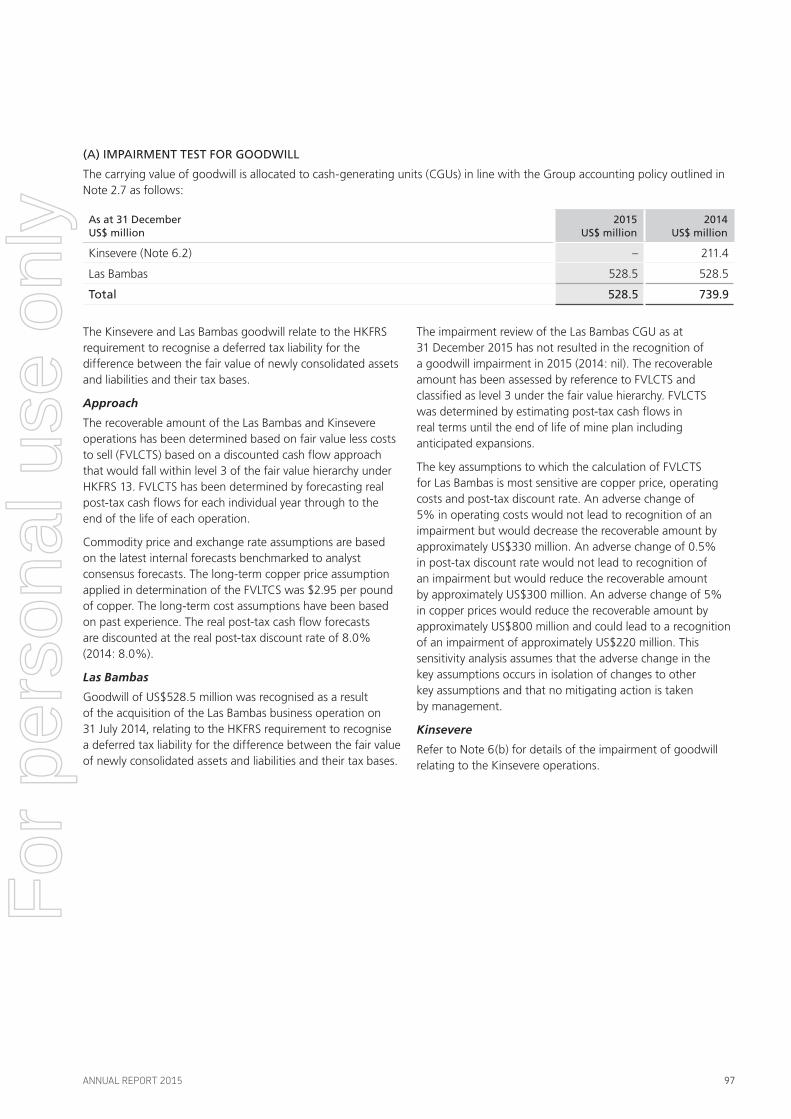
97 AnnuAl RepoRt 2015
(A) IMPAIRMENT TEST FOR GOODWILL
The carrying value of goodwill is allocated to cash‑generating units (CGUs) in line with the Group accounting policy outlined in Note 2.7 as follows:
As at 31 December US$ million
2015 US$ million
2014 US$ million
Kinsevere (Note 6.2) – 211.4
Las Bambas 528.5 528.5
Total 528.5 739.9
The Kinsevere and Las Bambas goodwill relate to the HKFRS requirement to recognise a deferred tax liability for the difference between the fair value of newly consolidated assets and liabilities and their tax bases.
Approach
The recoverable amount of the Las Bambas and Kinsevere operations has been determined based on fair value less costs to sell (FVLCTS) based on a discounted cash flow approach that would fall within level 3 of the fair value hierarchy under HKFRS 13. FVLCTS has been determined by forecasting real post‑tax cash flows for each individual year through to the end of the life of each operation.
Commodity price and exchange rate assumptions are based on the latest internal forecasts benchmarked to analyst consensus forecasts. The long‑term copper price assumption applied in determination of the FVLTCS was $2.95 per pound of copper. The long‑term cost assumptions have been based on past experience. The real post‑tax cash flow forecasts are discounted at the real post‑tax discount rate of 8.0% (2014: 8.0%).
Las Bambas
Goodwill of US$528.5 million was recognised as a result of the acquisition of the Las Bambas business operation on 31 July 2014, relating to the HKFRS requirement to recognise a deferred tax liability for the difference between the fair value of newly consolidated assets and liabilities and their tax bases.
The impairment review of the Las Bambas CGU as at 31 December 2015 has not resulted in the recognition of a goodwill impairment in 2015 (2014: nil). The recoverable amount has been assessed by reference to FVLCTS and classified as level 3 under the fair value hierarchy. FVLCTS was determined by estimating post‑tax cash flows in real terms until the end of life of mine plan including anticipated expansions.
The key assumptions to which the calculation of FVLCTS for Las Bambas is most sensitive are copper price, operating costs and post‑tax discount rate. An adverse change of 5% in operating costs would not lead to recognition of an impairment but would decrease the recoverable amount by approximately US$330 million. An adverse change of 0.5% in post‑tax discount rate would not lead to recognition of an impairment but would reduce the recoverable amount by approximately US$300 million. An adverse change of 5% in copper prices would reduce the recoverable amount by approximately US$800 million and could lead to a recognition of an impairment of approximately US$220 million. This sensitivity analysis assumes that the adverse change in the key assumptions occurs in isolation of changes to other key assumptions and that no mitigating action is taken by management.
Kinsevere
Refer to Note 6(b) for details of the impairment of goodwill relating to the Kinsevere operations.
MMG0024 AR15_PFO3.indd 97 8/04/16 4:37 PM
For
per
sona
l use
onl
y

98 MMG LiMited
nOTES TO COnSOlIDATED FInAnCIAl STATEMEnTS (COnTInUED)
15. INVeSTMeNT IN SUBSIDIarIeS
The following is a list of the principal subsidiaries of the Group as at 31 December 2015:
Name of company
Place of incorporation/ operation Principal activities
Particulars of issued or paid‑up capital
Proportion of issued capital held
by the Company
Directly Indirectly
MMG Century Limited Australia Mineral exploration and production
30 Ordinary Shares at A$1 a share – 100%
MMG Golden Grove Pty Ltd Australia Mineral exploration and production
1 Ordinary Share at A$1 a share – 100%
MMG Australia Limited Australia Mineral exploration and production, management and employment services
490,000,000 Ordinary Shares at A$1 a share
– 100%
MMG Kinsevere SARL DRC Mineral exploration and production
10,000 Ordinary Shares at CDF210,000 a share – 100%
Lane Xang Minerals Limited Laos Mineral exploration and production
381,088 Ordinary Shares at US$1 a share – 90%
MMG Dugald River Pty Ltd Australia Holds Dugald River Assets
301,902,934 Ordinary Shares at A$1 a share – 100%
MMG Exploration Pty Ltd Australia Investment holding 1 Ordinary Share at A$1 a share – 100%
MMG Resources Inc. Canada Mineral exploration 90,750,378 Common Shares at C$3.81 a share – 100%
MMG Management Pty Ltd Australia Treasury and management services
1 Ordinary Share at A$1 a share – 100%
MMG South America Company Limited
Hong Kong Holding company 1,880,000 Ordinary Shares providing a share capital of HK$1,880,000 100% –
MMG South America Management Company Limited
Hong Kong Investment holding 1,200 Ordinary Shares providing a share capital of HK$28,046,249,501 – 62.5%
MMG Netherlands B.V. Netherlands Investment holding 5,000 Ordinary Shares at EUR1 a share – 62.5%
MMG Swiss Finance AG Switzerland Investment holding and financial services
100,000 Ordinary Shares at CHF1 a share – 62.5%
Minera Las Bambas S.A.1 (formerly Las Bambas Mining Company S.A.)
Peru Holds Las Bambas Assets
2,890,004,037 Common Shares at PEN 1 a share – 62.5%
MMG Finance Limited Hong Kong Administration and treasury services
1 Ordinary Share providing a share capital of HK$1 100% –
MMG Exploration Holdings Limited
Hong Kong Mineral exploration 1 Ordinary Share providing a share capital of HK$1 100% –
MMG0024 AR15_PFO3.indd 98 8/04/16 4:37 PM
For
per
sona
l use
onl
y

99 AnnuAl RepoRt 2015
Name of company
Place of incorporation/ operation Principal activities
Particulars of issued or paid‑up capital
Proportion of issued capital held
by the Company
Directly Indirectly
Album Investment Pte Ltd Singapore Investment holding 488,211,901 Ordinary Shares at S$21 a share – 100%
Album Resources Pte Ltd Singapore Investment holding 488,211,901 Ordinary Shares at S$1 a share – 100%
Topstart Limited British Virgin Islands
Investment holding 1,386,611,594 Ordinary Shares at US$1 a share 100% –
Anvil Mining Limited British Virgin Islands
Investment holding 100 Class A Common Shares at US$1 – 100%
Allegiance Mining Pty Ltd Australia Holds non‑current assets held for sale
782,455,310 Ordinary Shares at A$1 a share – 100%
1. As at 31 December 2015, Minera Las Bambas S.A. is the result of a merger by absorption of the below entities:
(a) Las Bambas Mining Company S.A. (absorbing company)
(b) Las Bambas Holdings S.A. (absorbed company)
(c) Minera Las Bambas S.A.C. (absorbed company)
The merger was undertaken under the rules established by number 2 of Article 344° of the General Companies Law of Peru. Following the merger between the entities, Las Bambas Mining Company S.A. was renamed ‘Minera Las Bambas S.A.’
On the merger´s effective date: (i) Las Bambas Mining Company S.A. as the absorbing company acquired, in block and universally, all of the assets and liabilities of Las Bambas Holdings S.A. and Minera Las Bambas S.A.C. as absorbed companies; and (ii) Las Bambas Holdings S.A. and Minera Las Bambas S.A.C. as absorbed companies, transferred, universally and as a whole, all of their rights and obligations and their entire assets and liabilities in favour of Las Bambas Mining Company S.A., as absorbing company, and were extinguished without liquidation.
Therefore, Minera Las Bambas S.A. has become the title‑holder of all of the moveable and immovable assets, rights, obligations and legal relationships that Las Bambas Holdings S.A. and Minera Las Bambas S.A.C. held on the merger´s effective date.
Final registration of the changes arising from the fusion in the Companies Registry of the Public Registry of Lima, Peru, was completed on 27 March 2015.
2. CDF and S$ stand for Congolese Franc and Singapore dollar respectively.
16. PrINCIPal SUBSIDIarIeS WITh MaTerIal NoN-CoNTrollING INTereSTS
The Group had total non‑controlling interests of US$1,508.6 million as at 31 December 2015 (2014: US$1,288.3 million).
Non‑controlling interests comprise the following:
2015 US$ million
2014 US$ million
Lane Xang Minerals Limited 59.5 60.4
MMG South America Management Company Limited and its subsidiaries (MMG South America Management Group) 1,307.1 1,085.9
Topstart Limited 142.0 142.0
Total 1,508.6 1,288.3
MMG0024 AR15_PFO3.indd 99 8/04/16 4:37 PM
For
per
sona
l use
onl
y

100 MMG LiMited
nOTES TO COnSOlIDATED FInAnCIAl STATEMEnTS (COnTInUED)
(a) Summarised financial information for subsidiaries with material non-controlling interests to the Group
This summarised financial information is shown on a 100% basis. It represents the amounts shown in the subsidiaries’ financial statements prepared in accordance with HKFRS under Group accounting policies, excluding fair value adjustments, and before inter‑company eliminations.
US$ million
lAnE XAng MInERAlS lIMITEDMMg SOUTh AMERICA MAnAgEMEnT gROUp
AS AT 31 DECEMBER
2015 2014 2015 20142
Summarised Balance Sheet
Assets1 954.5 993.8 10,955.3 8,868.4
Liabilities (280.0) (310.5) (7,469.8) (5,972.5)
Net assets 674.5 683.3 3,485.5 2,895.9
yEAR EnDED 31 DECEMBER
2015 2014 2015 20142
Summarised Income Statement
Revenue 496.9 620.2 – –
Profit/(loss) for the year 71.2 156.6 (78.3) (54.1)
Total comprehensive income 71.2 156.6 (78.3) (54.1)
Total comprehensive income/(loss) attributable to non‑controlling interests 7.1 15.7 (29.3) (20.3)
Dividends paid to non‑controlling interests (8.0) (10.0) – –
yEAR EnDED 31 DECEMBER
2015 2014 2015 20142
Summarised Cash Flows
Net increase/(decrease) in cash and cash equivalents 3.1 (1.9) 7.8 159.3
Cash and cash equivalents at 1 January 10.2 12.1 159.3 –
Cash and cash equivalents at 31 December 13.3 10.2 167.1 159.3
Capital contribution from non‑controlling interests – – 250.5 1,106.2
1. Lane Xang Minerals Limited has cash deposits of US$9.4 million (2014: US$8.5 million) (Note 20) that are held for the sole purpose of mine rehabilitation and cannot be used for any other purpose as mine rehabilitation funds within non‑current assets.
2. MMG South America Management Company Limited was incorporated on 11 February 2014 for the purpose of the Las Bambas acquisition (refer to Note 28).
(b) Topstart limited
The non‑controlling interests attributable to Topstart Limited represent the equity component of the convertible redeemable preference shares (CRPS) issued by Topstart Limited during the year ended 31 December 2013. The equity component was recognised at the time of issuance as the difference between the fair value of the CRPS as a whole and the fair value of the liability component. Following initial recognition, the equity component is not subsequently remeasured except on conversion or expiry.
As at 31 December 2015 and 2014, the holders of the CRPS do not hold or control any direct ownership interest or voting rights in Topstart Limited. No profit or loss or other comprehensive income of Topstart Limited for the years ended 31 December 2015 and 2014 is attributable to, or allocated to the holders of the CRPS.
MMG0024 AR15_PFO3.indd 100 8/04/16 4:37 PM
For
per
sona
l use
onl
y

101 AnnuAl RepoRt 2015
17. INVeNTorIeS
2015 US$ million
2014 US$ million
Non‑current
Work in progress 61.2 47.8
Current
Stores and consumables 152.2 153.1
Work in progress 91.7 90.4
Finished goods 37.8 41.6
281.7 285.1
Total 342.9 332.9
18. DeferreD INCoMe TaX
Deferred tax assets or liabilities represent the tax effect of unused tax losses and temporary differences which can arise when items of income or expense are included in the financial statements in different periods to those in which they are assessable or deductible for tax purposes.
The movements in deferred income tax assets/(liabilities) during the years are as follows:
US$ million
Property, plant and
equipment Provisions Tax losses Others Total
At 1 January 2014 (389.3) 154.9 138.4 (6.8) (102.8)
Acquisition of subsidiaries (Note 28) (531.7) – 0.1 – (531.6)
(Charged)/credited to the income statement (Note 8) 27.3 8.7 (6.2) 6.1 35.9
Reclassification to current tax balance (0.7) – 2.9 – 2.2
At 31 December 2014 (894.4) 163.6 135.2 (0.7) (596.3)
(Charged)/credited to the income statement (Note 8) 144.7 45.0 44.3 (2.7) 231.3
Reclassification to current tax balance (10.6) – 0.1 – (10.5)
At 31 December 2015 (760.3) 208.6 179.6 (3.4) (375.5)
Deferred income tax assets and liabilities are offset when there is a legally enforceable right to offset current income tax assets against current income tax liabilities and when the deferred income taxes relate to income tax levied by the same taxation authority on either the taxation entity or different taxation entities, and there is an intention to settle the balances on a net basis. The following amounts, determined after appropriate offsetting, are shown in the balance sheet:
2015 US$ million
2014 US$ million
Deferred income tax assets 368.5 173.6
Deferred income tax liabilities (744.0) (769.9)
(375.5) (596.3)
MMG0024 AR15_PFO3.indd 101 8/04/16 4:37 PM
For
per
sona
l use
onl
y

102 MMG LiMited
nOTES TO COnSOlIDATED FInAnCIAl STATEMEnTS (COnTInUED)
The Group only recognises deferred tax assets for deductible temporary differences and unused tax losses if it is probable that future taxable amounts will be available to utilise those temporary differences and tax losses in the foreseeable future. Management will continue to assess the recognition of deferred tax assets in future reporting periods. As at 31 December 2015 and 2014, the Group had unrecognised deferred tax assets in respect of the following items:
2015 US$ million
2014 US$ million
Tax losses 79.7 63.6
Deductible temporary differences 134.2 82.8
At 31 December 213.9 146.4
19. TraDe aND oTher reCeIVaBleS
2015 US$ million
2014 US$ million
Non‑current other receivables
Prepayments 20.2 25.2
Other receivables – government taxes 48.6 69.0
Sundry receivables (Note 31.2) 13.2 12.9
82.0 107.1
Current trade and other receivables
Trade receivables1 49.1 153.5
Less: Allowance for impairment of trade receivables (11.0) –
Trade receivables (net) (Note 31.2) 38.1 153.5
Prepayments 47.0 41.8
Other receivables – government taxes2 499.0 296.7
Sundry receivables (Note 31.2) 135.1 21.3
719.2 513.3
1. As at 31 December 2015 and 2014, trade and other receivables of the Group mainly related to the mining operations and development projects. The majority of sales for mining operations were made under contractual arrangements whereby provisional payment is received after delivery and the balance is due within 30 to 120 days from delivery. The ageing analysis of the trade receivables is as follows:
2015 2014
US$ million % US$ million %
Current trade receivables
Less than 6 months 49.1 100.0 153.5 100.0
Current trade receivables 49.1 100.0 153.5 100.0
As at 31 December 2015, no trade receivables were past due but not impaired (2014: US$nil).
As at 31 December 2015, the Group’s trade receivables included an amount of US$6.6 million (2014: US$6.5 million) (Note 30(d)), which was due from a related company of the Group. The carrying amounts of the Group’s trade receivables are all denominated in US$.
2. Current other receivables – government taxes:
2015 US$ million
2014 US$ million
Peru(i) 456.5 255.6
Democratic Republic of the Congo (DRC) 33.5 35.2
Other 9.0 5.9
499.0 296.7
(i) The amount mainly consists of VAT receivable in Las Bambas.
MMG0024 AR15_PFO3.indd 102 8/04/16 4:37 PM
For
per
sona
l use
onl
y

103 AnnuAl RepoRt 2015
20. oTher fINaNCIal aSSeTS
2015 US$ million
2014 US$ million
Non‑current financial assets
Financial assets at fair value through profit or loss – listed1 2.1 3.8
Mine rehabilitation funds 10.3 8.5
12.4 12.3
Current financial assets
Available‑for‑sale financial assets – listed1 14.5 25.9
Financial assets at fair value through profit or loss – listed1 0.4 0.9
14.9 26.8
1. Other financial assets are listed investments outside Hong Kong and their carrying values are equal to their market values.
21. CaSh aND CaSh eqUIValeNTS
2015 US$ million
2014 US$ million
Cash at bank and in hand 296.2 200.9
Short‑term bank deposits1 302.1 50.3
Total2 598.3 251.2
1. The weighted average effective interest rate on short‑term bank deposits as at 31 December 2015 was 0.82% (2014: 0.62%). These deposits have an average 20 days (2014: 7 days) to maturity from 31 December 2015 .
2. Total cash and cash equivalents include US$168.7 million (2014: US$159.8 million) of cash held limited to use on specific projects.
The carrying amounts of the cash and cash equivalents are denominated in the following currencies:
2015 US$ million
2014 US$ million
US dollars 583.1 216.6
Peruvian sol 1.7 27.2
Australian dollars 7.4 6.1
Hong Kong dollars – 0.1
Other 6.1 1.2
598.3 251.2
MMG0024 AR15_PFO3.indd 103 8/04/16 4:37 PM
For
per
sona
l use
onl
y

104 MMG LiMited
nOTES TO COnSOlIDATED FInAnCIAl STATEMEnTS (COnTInUED)
22. Share CaPITal
nUMBER OF ORDInARy ShARES ShARE CApITAl
2015 ‘000
2014 ‘000
2015 US$ million
2014 US$ million
Issued and fully paid:
At 1 January 5,289,608 5,289,608 2,358.9 33.9
Employee share options exercised 462 – 0.2 –
Transfers from share premium, capital redemption reserve and capital reserve(i) – – – 2,325.0
At 31 December 5,290,070 5,289,608 2,359.1 2,358.9
(i) In accordance with the transitional provisions set out in section 37 of Schedule 11 to the Companies Ordinance, all share premium, capital redemption and capital reserves that existed at the start date of the Companies Ordinance became a part of the Company’s share capital. The increase of US$2,325.0 million in monetary amount of the share capital is due to the following transfers on 3 March 2014:
› Share premium of US$2,318.6 million was transferred to share capital;
› Capital redemption reserve of US$0.2 million was transferred to share capital; and
› Capital reserve of US$6.2 million was transferred to share capital.
23. reSerVeS aND reTaINeD ProfITS
US$ million
Sharepremium
(i)
Capitalreserve
(ii)
Specialcapitalreserve
(iii)
Exchangetransla‑
tionreserve
(iv)
Available‑ for‑sale
financial assets
reserve(v)
Mergerreserve
(vi)Other
reservesTotal
reservesRetained
profits Total
At 1 January 2015 – – 9.4 2.7 (0.4) (1,946.9) 2.3 (1,932.9) 1,260.3 (672.6)
Loss for the year – – – – – – – – (1,026.5) (1,026.5)
Other comprehensive income
Change in fair value of available‑for‑sale financial assets – – – – (11.4) – – (11.4) – (11.4)
Total comprehensive income for the year – – – (11.4) – – (11.4) (1,026.5) (1,037.9)
Transactions with owners
Employee share options – – – – – – 18.0 18.0 – 18.0
Total transactions with owners – – – – – – 18.0 18.0 – 18.0
At 31 December 2015 – – 9.4 2.7 (11.8) (1,946.9) 20.3 (1,926.3) 233.8 (1,692.5)
MMG0024 AR15_PFO3.indd 104 8/04/16 4:37 PM
For
per
sona
l use
onl
y

105 AnnuAl RepoRt 2015
US$ million
Sharepremium
(i)
Capitalreserve
(ii)
Specialcapitalreserve
(iii)
Exchangetransla‑
tionreserve
(iv)
Available‑ for‑sale
financial assets
reserve(v)
Mergerreserve
(vi)Other
reservesTotal
reservesRetained
profits Total
At 1 January 2014 2,318.6 6.2 9.4 2.7 (15.6) (1,946.9) 2.4 376.8 1,209.4 1,586.2
Profit for the year – – – – – – – – 103.8 103.8
Other comprehensive income
Change in fair value of available‑for‑sale financial assets – – – – 26.1 – – 26.1 – 26.1
Gain on disposal of available‑for‑sale financial assets – – – – (10.9) – – (10.9) – (10.9)
Total comprehensive income for the year – – – – 15.2 – – 15.2 103.8 119.0
Transactions with owners
Dividends paid by the Company – – – – – – – – (52.9) (52.9)
Transition to no‑par value regime on 3 March 2014 (Note 22) (2,318.6) (6.2) – – – – (0.2) (2,325.0) – (2,325.0)
Employee share options – – – – – – 0.1 0.1 – 0.1
Total transactions with owners (2,318.6) (6.2) – – – – (0.1) (2,324.9) (52.9) (2,377.8)
At 31 December 2014 – – 9.4 2.7 (0.4) (1,946.9) 2.3 (1,932.9) 1,260.3 (672.6)
NATURE AND PURPOSE OF RESERVES
(i) Share premium and capital redemption reserve
On 3 March 2014 the share premium account and capital redemption reserve became part of share capital as a result of the Companies Ordinance.
(ii) Capital reserve
On 3 March 2014 the capital reserve became part of share capital as a result of the Companies Ordinance.
(iii) Special capital reserve
In relation to the capital reorganisation as confirmed by the High Court of the Hong Kong Special Administrative Region on 13 February 2007, the Company has provided an undertaking (Undertaking) for its petition to the court that as long as any debt or liability of claim against the Company as at the effective date of this capital reorganisation remains
outstanding, the Company should credit the following amounts to a special reserve (Special Reserve):
› all retained profits, if any, accruing to the Company between 1 November 2006 and 13 February 2007 (the effective date of the capital reorganisation);
› any recovery in excess of the written‑down value of or the reversal of impairment loss in respect of certain investments in subsidiaries, listed securities, properties and loans or receivables of the Company as at 31 October 2006; and
› an amount equal to the change in fair value in respect of certain share options not yet vested as at 31 October 2006.
The standing to the credit of the Special Reserve shall not be treated as realised profit. It shall be treated as an undistributable reserve of the Company for the purposes of
MMG0024 AR15_PFO3.indd 105 8/04/16 4:37 PM
For
per
sona
l use
onl
y

106 MMG LiMited
nOTES TO COnSOlIDATED FInAnCIAl STATEMEnTS (COnTInUED)
Part 6 of the Companies Ordinance. As at 31 December 2015, the standing to the credit of the Company’s special capital reserve, which had been made in accordance with the Undertaking, amounted to US$9.4 million (2014: US$9.4 million).
(iv) exchange translation reserve
The exchange reserve comprises all foreign exchange differences arising from the translation of the financial statements of foreign operations as well as the effective portion of any foreign exchange differences arising from hedges of the net investment in these foreign operations. The reserve is dealt with in accordance with the accounting policies set out in Note 2.4(c).
(v) available-for-sale financial assets reserve
The available‑for‑sale financial assets reserve represents the change in fair value of the available‑for‑sale financial assets.
(vi) Merger reserve
Merger reserve represents the excess of investment cost in entities that have been accounted for under merger accounting for common control combinations in accordance with AG5 (Accounting Guideline 5 issued by the HKIPCA) against their share capital.
DISTRIBUTABLE RESERVES
At 31 December 2015, the Company does not have any distributable reserves available for distribution to Shareholders (2014: US$197.9 million).
24. BorroWINGS
2015 US$ million
2014 US$ million
Non‑current
Loan from a related party (Note 30(d)) 2,261.3 1,843.8
Bank borrowings 7,623.4 6,163.3
Convertible redeemable preference shares 185.7 182.9
10,070.4 8,190.0
Prepayments – finance charges (84.2) (97.8)
9,986.2 8,092.2
Current
Bank borrowings 270.5 109.5
Convertible redeemable preference shares 16.9 16.9
287.4 126.4
Prepayments – finance charges (10.5) (9.7)
276.9 116.7
Analysed as:
– Secured 7,614.6 6,169.2
– Unsecured 2,743.2 2,147.2
10,357.8 8,316.4
Prepayments – finance charges (94.7) (107.5)
10,263.1 8,208.9
Borrowings (excluding: prepayments) were repayable as follows:
– Within one year 281.2 126.4
– Between one and two years 858.8 281.2
– Between two and five years 4,114.7 1,831.4
– Over five years 5,103.1 6,077.4
10,357.8 8,316.4
Prepayments – finance charges (94.7) (107.5)
10,263.1 8,208.9
MMG0024 AR15_PFO3.indd 106 8/04/16 4:37 PM
For
per
sona
l use
onl
y

107 AnnuAl RepoRt 2015
An analysis of the carrying amounts of the total borrowings (excluding prepayments) by type and currency is as follows:
2015 US$ million
2014 US$ million
US dollars
– At floating rates 10,155.2 8,116.6
– At fixed rates 202.6 199.8
10,357.8 8,316.4
The effective interest rate at the balance sheet date was as follows:
2015 2014
Borrowings 4.2% 3.9%
Certain entities of the Group are subject to certain loan covenants. For both 2015 and 2014, there was no material non‑compliance with those loan covenants.
The CRPS were issued on 5 August 2013 following the completion of certain conditions precedent and represented 19.60% of the equity share capital of Topstart. The total consideration paid for the CRPS was US$338 million. The CRPS matures in 25 years from issue date. The values of the liability component and the equity conversion component were determined at issuance of the CRPS. The interest on the CRPS is calculated at the effective interest rate of 10% per annum approximating the market rate of interest for a similar debt instrument with the same currency and maturity (2014: 10%).
As at 31 December 2015, the borrowings of the Group were secured as follows:
(a) Approximately US$563.3 million (2014: US$638.4 million) from China Development Bank Corporation and Bank of China Limited (Sydney Branch) was secured by a first‑ranking equitable mortgage over each of the entire share capital of Album Investment Private Limited (Album Investment), a wholly owned subsidiary of the Company, and 100% of the share capital of certain wholly owned subsidiaries of Album Investment including MMG Laos Holdings Limited, and a share charge over 70% of the share capital of certain wholly owned subsidiaries of Album Investment including MMG Laos Holdings Limited; and
(b) Approximately US$110.0 million (2014: US$130.0 million) from China Development Bank Corporation was also secured by a first‑ranking equitable mortgage over each of the entire share capital of Album Investment and 100% of the share capital of certain wholly owned subsidiaries of Album Investment including MMG Laos Holdings Limited and a share charge over 70% of the issued shares in certain wholly owned subsidiaries of Album Investment including MMG Laos Holdings Limited.
(c) Approximately US$250.0 million (2014: US$250.0 million) from China Development Bank Corporation and Bank of China Limited (Sydney Branch) was secured by a
first‑ranking equitable mortgage over each of the entire share capital of Album Investment; 100% of the share capital of certain wholly owned subsidiaries of Album Investment including MMG Laos Holdings Limited; a share charge over 70% of the share capital of certain wholly owned subsidiaries of Album Investment including MMG Laos Holdings Limited; a share charge over all of the shares in MMG Dugald River Pty Ltd (MMG Dugald River); a real property mortgage over all of the interests in land of MMG Dugald River; a general security agreement in respect of all of the assets of MMG Dugald River; and specific security over certain assets owned by MMG Australia Limited relating to the Dugald River project and a featherweight charge over all of MMG Australia Limited’s other assets (which security may now be released as MMG Australia Limited has completed the transfer of the Dugald River project assets to MMG Dugald River).
(d) Approximately US$6,691.3 million (2014: US$5,150.8 million) from China Development Bank Corporation, Industrial and Commercial Bank of China Limited, Bank of China Limited (Sydney Branch) and The Export‑Import Bank of China was secured by share security over the entire share capital of MMG South America Management Co Ltd and each of its subsidiaries including Minera Las Bambas S.A., a debenture over the assets of MMG South America Management Co Ltd, an assets pledge agreement and production unit mortgage in respect of all of the assets of Minera Las Bambas S.A., assignments of shareholder loans between MMG South America Management Co Ltd and its subsidiaries and security agreements over bank accounts of Minera Las Bambas S.A. These borrowings are also guaranteed on several basis by CMNH and CMCL, CNIC and CITIC Corporation Limited (formerly known as CITIC Limited) in proportion to the respective shareholdings of MMG SA, Elion Holdings Corporation Limited and Citic Metal Peru Investment Limited in MMG SAM.
MMG0024 AR15_PFO3.indd 107 8/04/16 4:37 PM
For
per
sona
l use
onl
y

108 MMG LiMited
nOTES TO COnSOlIDATED FInAnCIAl STATEMEnTS (COnTInUED)
25. ProVISIoNS
2015 US$ million
2014 US$ million
Non‑current
Employee benefits 2.8 3.0
Workers’ compensation 0.9 1.2
Mine rehabilitation, restoration and dismantling(a) 772.1 780.0
Total non‑current provisions 775.8 784.2
Current
Employee benefits 87.3 53.8
Workers’ compensation 0.4 1.2
Mine rehabilitation, restoration and dismantling(a) 33.3 39.8
Other provisions(b) 16.7 7.8
Total current provisions 137.7 102.6
Aggregate
Employee benefits 90.1 56.8
Workers’ compensation 1.3 2.4
Mine rehabilitation, restoration and dismantling(a) 805.4 819.8
Other provisions(b) 16.7 7.8
Total provisions 913.5 886.8
(a) Mine rehabilitation, restoration and dismantling
2015 US$ million
2014 US$ million
At 1 January 819.8 622.3
Additional provisions recognised(i) (Note 27(b)) 33.1 208.1
Acquisition of subsidiaries (Note 28) – 30.7
Payments made (23.4) (15.9)
Unwinding of discount on provisions (Note 7) 33.6 25.1
Exchange rate differences (Note 27(b)) (57.7) (50.5)
At 31 December 805.4 819.8
Provision is made in the financial statements for the anticipated costs of the mine rehabilitation obligations under the mining leases and exploration licences.
(i) The additional provisions recognised in 2014 relate primarily to Century.
(b) other provisions
2015 US$ million
2014 US$ million
Opening carrying amount 7.8 9.6
Net movement in provisions 8.9 (1.8)
Closing carrying amount 16.7 7.8
MMG0024 AR15_PFO3.indd 108 8/04/16 4:37 PM
For
per
sona
l use
onl
y

109 AnnuAl RepoRt 2015
26. TraDe aND oTher PaYaBleS
The analysis of the trade and other payables is as follows:
2015 US$ million
2014 US$ million
Non‑current other payables
Related party interest payable (Note 30(d)) 107.4 27.9
Other payables and accruals 27.2 37.0
134.6 64.9
Current trade and other payables
Trade payables1
Less than 6 months 149.5 245.2
Not less than 6 months 11.3 –
160.8 245.2
Other payables and accruals 232.2 263.3
393.0 508.5
1. As at 31 December 2015, the Group’s trade payables included an amount of US$0.2 million (2014: US$1.1 million) (Note 30(d)), which was due to a related company of the Group.
27. NoTeS To CoNSolIDaTeD CaSh floW STaTeMeNT
(a) reconciliation of (loss)/profit for the year to net cash generated from operations is as follows:
2015 US$ million
2014 US$ million
(Loss)/profit for the year (1,048.7) 99.2
Adjustments for:
Finance income (note 7) (3.8) (3.3)
Finance costs (note 7) 88.8 82.7
Depreciation, amortisation and impairment expenses 1,546.4 537.1
(Gain)/Loss on disposal of property, plant and equipment (0.1) 0.9
Loss on financial assets 2.0 0.2
Share‑based payment 18.0 (0.1)
Changes in working capital (excluding certain Las Bambas working capital movements and business combination accounting):
Inventories 4.0 16.2
Trade and other receivables (69.7) (91.6)
Trade payables and accruals, provisions and other payables (21.1) 77.6
Tax assets and tax liabilities (233.4) (52.2)
Net cash generated from operations 282.4 666.7
(b) In the consolidated cash flow statement, purchase of property, plant and equipment comprises:
2015 US$ million
2014 US$ million
Total additions (Note 13) 2,077.7 1,425.0
Less: non-cash additions
Transfer from provision for mine rehabilitation, restoration and dismantling (Note 25(a)) 24.6 (157.6)
Exploration assets received upon settlement of sundry receivable – (52.5)
Less: cash flows reported in ‘Interest and financing costs paid’
Capitalised interest (Note 7 and 13) (352.2) (135.8)
Less: Other (mainly certain Las Bambas working capital movements) 208.9 (41.2)
Purchase of property, plant and equipment 1,959.0 1,037.9
MMG0024 AR15_PFO3.indd 109 8/04/16 4:37 PM
For
per
sona
l use
onl
y

110 MMG LiMited
nOTES TO COnSOlIDATED FInAnCIAl STATEMEnTS (COnTInUED)
28. BUSINeSS CoMBINaTIoN
(a) Summary of acquisition of las Bambas
In the prior year, on 31 July 2014, the Group acquired the Las Bambas Project as part of a joint venture with two other parties. The acquisition was structured via an investment holding company established for the purpose of the acquisition, MMG South America Management Co Ltd (Las Bambas Joint Venture Company). Pursuant to the Shareholders’ Agreement each participant subscribed for new shares in the Las Bambas Joint Venture Company such that the Las Bambas Joint Venture Company is owned as to 62.5% by the Group and as to 37.5% by other joint venture shareholders.
The Las Bambas Joint Venture Company, via two wholly owned subsidiaries (the Purchasers), acquired the entire issued share capital of the Target Company, a wholly owned subsidiary of the Sellers and indirect owner of the Las Bambas Project, for a consideration of US$2,968.1 million.
The majority of the purchase consideration was paid at the time of the acquisition, with a final instalment payment of US$12.2 million paid during the year. Additionally, immediately prior to completion, the Purchasers advanced funds to the Project Company, a subsidiary of the Target Company, to enable the repayment of US$4,018.1 million loan balances owed by the Project Company to Glencore subsidiaries (intra‑group loans). There is no contingent consideration associated with the acquisition.
During the year ended 31 December 2014, the consideration and the repayment of intra‑group loans were funded in combination with additional capital expenditure requirements relating to the period following acquisition. The amounts were funded as follows:
(i) Equity contributions of US$1,843.8 million made to the Las Bambas Joint Venture Company by the Group in proportion to its respective shareholding. The pro‑rata share of equity contribution by the Group has been financed by a loan from Top Create, a Shareholder of the Company (Note 30);
(ii) Equity contributions of US$1,106.2 million made to the Las Bambas Joint Venture Company by other parties in proportion to their respective shareholdings and measured at fair value commensurate with the purchase price paid as a percentage of net assets acquired; and
(iii) External bank borrowings of US$4,988.0 million.
In accordance with the terms of the Shareholders’ Agreement, the Company is of the opinion that it has the ability to govern the financial and operating policies of the Las Bambas Joint Venture Company as the Las Bambas Joint Venture Company is a subsidiary of the Company. Therefore, the Group has consolidated the Las Bambas Joint Venture Company (and JV Group) in its consolidated financial statements since the acquisition date.
(b) Completion of provisional accounting
In accordance with HKFRS 3 ‘Business Combinations’, the measurement period of the Las Bambas business combination concluded on 31 July 2015. There were no changes to the provisional assessment of the estimated fair value of net identifiable assets and liabilities during the measurement period.
The following table summarises the consideration paid, and the amounts of the assets acquired and liabilities assumed that were recognised at the acquisition date, on 31 July 2014. These amounts were reflected in the 31 December 2014 consolidated financial statements of the Group.
US$ million
Total Purchase Consideration
Cash paid during the year ended 31 December 2014 2,955.9
Cash paid during the year ended 31 December 2015 12.2
2,968.1
MMG0024 AR15_PFO3.indd 110 8/04/16 4:37 PM
For
per
sona
l use
onl
y

111 AnnuAl RepoRt 2015
As at 31 July 2014
Fair Value
US$ million
Identifiable Assets Recognised and Liabilities Assumed
ASSETS
Non‑current assets
Property, plant and equipment 6,868.1
Intangible assets 1.4
Other receivables1 75.6
6,945.1
Current assets
Inventories 2.8
Trade and other receivables1 209.2
Current income tax assets 19.2
Cash and cash equivalents 5.8
237.0
Total assets 7,182.1
LIABILITIES
Non‑current liabilities
Deferred income tax liabilities 531.6
Provisions 30.7
562.3
Current liabilities
Trade and other payables 159.2
Provisions 2.9
162.1
Total liabilities 724.4
Net identifiable assets acquired 6,457.7
Less: Repayments of loans to former parent of acquired subsidiaries (4,018.1)
2,439.6
Add: Goodwill2 528.5
Net Assets 2,968.1
1. There is no material difference between the gross contractual amounts receivable and their fair value.
2. The goodwill arises from the HKFRS requirement to recognise a deferred tax liability for the difference between the fair value of newly consolidated assets and liabilities and their tax bases. In accordance with HKFRS, no deferred tax liability is recognised from initial recognition of goodwill.
29. aSSeTS aND lIaBIlITIeS helD for Sale
2015 US$ million
2014 US$ million
Assets of disposal group classified as held for sale
Property, plant and equipment 18.8 24.4
Total 18.8 24.4
Liabilities of disposal group classified as held for sale
Mine rehabilitation, restoration and dismantling provisions 4.5 4.5
Total 4.5 4.5
MMG continues to classify the Avebury nickel mine, which is on care and maintenance, as held for sale. MMG is in active discussion with several parties interested in acquiring the mine and will continue to facilitate site visits and information sharing.
MMG0024 AR15_PFO3.indd 111 8/04/16 4:37 PM
For
per
sona
l use
onl
y

112 MMG LiMited
nOTES TO COnSOlIDATED FInAnCIAl STATEMEnTS (COnTInUED)
30. SIGNIfICaNT relaTeD ParTY TraNSaCTIoNS
The Group is controlled by CMN through Top Create, a company incorporated in the British Virgin Islands, which owns 30.65% of the Company’s shares, and Album Enterprises, which owns 43.04% of the Company’s shares, both of which are wholly owned subsidiaries of CMN. The remaining 26.31% of the Company’s shares are widely held. The Directors of the Company consider the ultimate holding company is CMC, a company incorporated in the PRC, of which CMN is a subsidiary.
The Company was notified by CMC in January 2016 that, pursuant to a conditional sale and purchase agreement dated 31 December 2015 entered into among Album Enterprises and Top Create as vendors and China Minmetals H.K. (Holdings) Limited (Minmetals HK) as purchaser, each of Album Enterprises and Top Create has agreed to transfer all its shares in the Company to Minmetals HK which is a subsidiary of CMC. The consideration for the share transfer will be settled by Minmetals HK issuing new shares to Album Enterprises and Top Create in proportion to their respective existing shareholdings in the Company. The share transfer is subject to, among other conditions precedent, Minmetals HK obtaining a waiver by the Securities and Futures Commission of Hong Kong of the mandatory general offer obligation of Minmetals HK (and persons acting in concert with it) for the shares of the Company as a result of the share transfer pursuant to Note 6 to Rule 26.1 of the Hong Kong Code on Takeovers and Mergers. Such condition cannot be waived by the parties to the sale and purchase agreement. After the share transfer, Minmetals HK will hold in total approximately 73.69% of the shares of the Company.
Parties are considered to be related to the Group if the Group has the ability, directly or indirectly, to control or jointly control the party or exercise significant influence over
the party in making financial and operating decisions, or vice versa, or where the Group and the party are subject to control or common control. Related parties may be individuals (being members of key management personnel, significant shareholders and/or their close family members) or other entities and include entities which are under the significant influence of related parties of the Group where those parties are individuals, and post‑employment benefit plans which are for the benefit of employees of the Group or of any entity that is a related party of the Group.
CMC itself is a state‑owned enterprise and is controlled by the PRC Government, which also owns a significant portion of productive assets in the PRC. In accordance with HKAS 24 Related Party Disclosures issued by the Hong Kong Institute of Certified Public Accountants, other state‑owned enterprises and their subsidiaries (other than subsidiaries of CMC), directly or indirectly controlled by the PRC Government, are also defined as related parties of the Group. On that basis, related parties include CMC and its group companies, other state‑owned enterprises and their subsidiaries directly or indirectly controlled by the PRC Government, the Company’s joint arrangements and associates, and key management personnel of the Company and CMC as well as their close family members.
For the purposes of the related party transaction disclosures, the Directors of the Company believe that meaningful information in respect of related party transactions has been adequately disclosed. In addition to the related party information and transactions disclosed elsewhere in the consolidated financial statements, the following is a summary of significant related party transactions entered into in the ordinary course of business between the Group and its related parties during the year.
(a) Transactions with CMC and its group companies (other than those within the Group)
2015 US$ million
2014 US$ million
Revenue
Sales of non‑ferrous metals 159.3 161.9
Expenses
Purchases of consumables (2.0) (3.3)
Finance costs – net
Finance costs – (3.1)
Borrowing costs capitalised on qualifying assets (79.5) (27.9)
MMG0024 AR15_PFO3.indd 112 8/04/16 4:37 PM
For
per
sona
l use
onl
y

113 AnnuAl RepoRt 2015
(b) Transactions and balances with other state-owned enterprises
During the year ended 31 December 2015, the Group’s transactions with other state‑owned enterprises (excluding CMC and its subsidiaries) were sales of non‑ferrous metals and purchases of consumables and the related receivables and payables balances. In addition, a portion of fixed deposits, cash and cash equivalents and borrowings as at 31 December 2015 and the relevant interest earned or paid during the year were transacted with banks and other financial institutions controlled by the PRC Government
including Bank of China Limited, China Development Bank Corporation, Industrial and Commercial Bank of China Limited and The Export‑Import Bank of China.
The transactions of revenues and expenses in nature conducted with government‑related entities were based on terms as set out in the underlying agreements, based on statutory rates or market prices or actual cost incurred, or as mutually agreed.
(c) Key management compensation
Key management includes Directors (executive and non‑executive) and members of the Executive Committee. The key management personnel remuneration for the Group was as follows:
2015 US$ million
2014 US$ million
Salaries and other short‑term employee benefits 6.8 8.6
Short‑term incentives and discretionary bonus1 2.7 7.2
Long‑term incentives1 8.6 3.3
Post‑employment benefits 0.1 0.1
18.2 19.2
1. Total short and long‑term incentives are lower than for those of the five highest paid individuals in 2015, as disclosed in Note 32(b), due to the reversal of STI and LTI accruals on cessation of employment of certain key management personnel.
(d) Year-end balances
2015 US$ million
2014 US$ million
Amount payable to related parties
Loan from Top Create1 (Note 24) 2,261.3 1,843.8
Trade payable to CMN 0.2 1.1
Interest payable to Top Create1 (Note 26) 107.4 27.9
2,368.9 1,872.8
Amount receivable from related parties
Loan to Album Enterprises2 – 80.0
Trade receivables from CMN 6.6 6.5
6.6 86.5
1. The loan amount from Top Create represents the amounts drawn by the Company on 22 July 2014 and 16 February 2015 pursuant to a facility agreement dated 22 July 2014 between MMG SA and Top Create. In accordance with the facility agreement, a loan facility of up to US$2,262.0 million was made available to MMG SA, for a period of four years commencing on the date of the loan. Interest is accrued on the outstanding balance drawn under the facility agreement at Libor plus 3.1% per annum and the loan is repayable at the end of the term.
2. The loan to Album Enterprises (US$80.0 million) represents the amount drawn by Album Enterprises on 19 December 2014 which was repaid in full in April 2015. Monies were advanced to Album Enterprises at Libor plus 2.0% per annum. The loan to Album Enterprises described above was made pursuant to a facility agreement, dated 17 December 2014, between MMG Finance Limited (a subsidiary of the Group) and Album Enterprises. Under the facility agreement, a loan facility of US$80.0 million was made available to Album Enterprises, for a period of one year commencing on the date of the facility agreement.
MMG0024 AR15_PFO3.indd 113 8/04/16 4:37 PM
For
per
sona
l use
onl
y
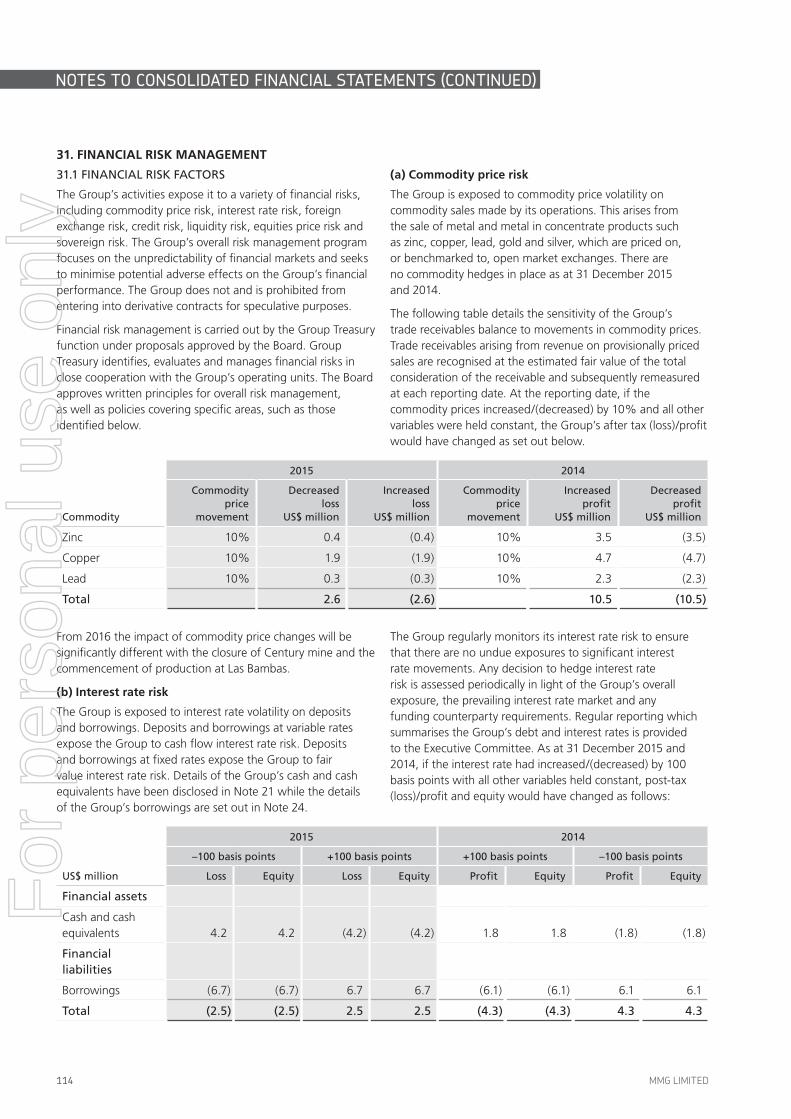
114 MMG LiMited
nOTES TO COnSOlIDATED FInAnCIAl STATEMEnTS (COnTInUED)
31. fINaNCIal rISK MaNaGeMeNT
31.1 FINANCIAL RISK FACTORS
The Group’s activities expose it to a variety of financial risks, including commodity price risk, interest rate risk, foreign exchange risk, credit risk, liquidity risk, equities price risk and sovereign risk. The Group’s overall risk management program focuses on the unpredictability of financial markets and seeks to minimise potential adverse effects on the Group’s financial performance. The Group does not and is prohibited from entering into derivative contracts for speculative purposes.
Financial risk management is carried out by the Group Treasury function under proposals approved by the Board. Group Treasury identifies, evaluates and manages financial risks in close cooperation with the Group’s operating units. The Board approves written principles for overall risk management, as well as policies covering specific areas, such as those identified below.
(a) Commodity price risk
The Group is exposed to commodity price volatility on commodity sales made by its operations. This arises from the sale of metal and metal in concentrate products such as zinc, copper, lead, gold and silver, which are priced on, or benchmarked to, open market exchanges. There are no commodity hedges in place as at 31 December 2015 and 2014.
The following table details the sensitivity of the Group’s trade receivables balance to movements in commodity prices. Trade receivables arising from revenue on provisionally priced sales are recognised at the estimated fair value of the total consideration of the receivable and subsequently remeasured at each reporting date. At the reporting date, if the commodity prices increased/(decreased) by 10% and all other variables were held constant, the Group’s after tax (loss)/profit would have changed as set out below.
Commodity
2015 2014
Commodity price
movement
Decreased loss
US$ million
Increased loss
US$ million
Commodity price
movement
Increased profit
US$ million
Decreased profit
US$ million
Zinc 10% 0.4 (0.4) 10% 3.5 (3.5)
Copper 10% 1.9 (1.9) 10% 4.7 (4.7)
Lead 10% 0.3 (0.3) 10% 2.3 (2.3)
Total 2.6 (2.6) 10.5 (10.5)
From 2016 the impact of commodity price changes will be significantly different with the closure of Century mine and the commencement of production at Las Bambas.
(b) Interest rate risk
The Group is exposed to interest rate volatility on deposits and borrowings. Deposits and borrowings at variable rates expose the Group to cash flow interest rate risk. Deposits and borrowings at fixed rates expose the Group to fair value interest rate risk. Details of the Group’s cash and cash equivalents have been disclosed in Note 21 while the details of the Group’s borrowings are set out in Note 24.
The Group regularly monitors its interest rate risk to ensure that there are no undue exposures to significant interest rate movements. Any decision to hedge interest rate risk is assessed periodically in light of the Group’s overall exposure, the prevailing interest rate market and any funding counterparty requirements. Regular reporting which summarises the Group’s debt and interest rates is provided to the Executive Committee. As at 31 December 2015 and 2014, if the interest rate had increased/(decreased) by 100 basis points with all other variables held constant, post‑tax (loss)/profit and equity would have changed as follows:
US$ million
2015 2014
–100 basis points +100 basis points +100 basis points –100 basis points
Loss Equity Loss Equity Profit Equity Profit Equity
Financial assets
Cash and cash equivalents 4.2 4.2 (4.2) (4.2) 1.8 1.8 (1.8) (1.8)
Financial liabilities
Borrowings (6.7) (6.7) 6.7 6.7 (6.1) (6.1) 6.1 6.1
Total (2.5) (2.5) 2.5 2.5 (4.3) (4.3) 4.3 4.3
MMG0024 AR15_PFO3.indd 114 8/04/16 4:37 PM
For
per
sona
l use
onl
y

115 AnnuAl RepoRt 2015
Interest on borrowings in relation to development projects is capitalised into Property, Plant and Equipment, and does not impact profit/loss or equity of the Group so is not included in the sensitivity analysis.
If the sensitivity analysis had included capitalised interest on borrowings in relation to development projects, the rate variation would have increased or decreased Property, Plant and Equipment by US$65.0 million with the corresponding offset in cash and cash equivalents.
(c) foreign exchange risk
The Group operates internationally and is exposed to foreign currency exchange risk. The Group’s reporting currency and functional currency of the majority of subsidiaries within the Group is US dollars. The majority of revenue received by the Group is in US dollars. The Group’s foreign currency exchange risk arises predominantly from the currency of the countries in which the Group’s operations are located. Any decision to hedge foreign currency risk is assessed periodically in light of the Group’s exposure, the prevailing foreign currency market and any counterparty requirements.
The Group is exposed to foreign exchange risk primarily with respect to the Peruvian sol (PEN), Australian dollar (A$), and Hong Kong dollar (HK$). Given the exchange rate peg between the HK dollars and the US dollars, it is not foreseen that the Group will be exposed to significant exchange rate risk for the transactions conducted in HK dollars or US dollars. However, exchange rate fluctuations of Peruvian sols or Australian dollars against US dollars could affect the Group’s performance and asset value. The Peruvian sol and Australian dollar are the most important currencies influencing costs.
The Group tries to minimise its foreign exchange risk exposures through natural hedges wherever possible. For instance, external debt and surplus cash is denominated in US dollars. A portion of cash may be held in Peruvian Sols or Australian dollars to meet operating costs.
The following table shows the foreign currency risk arising from the financial assets and liabilities, which are shown by currency of denomination.
US$ million Note US$ PEN A$ HK$ OTHERS Total
As at 31 December 2015
Financial assets
Cash and cash equivalents 21 583.1 1.7 7.4 – 6.1 598.3
Trade receivables 19 38.1 38.1
Sundry receivables 19 134.0 2.9 11.4 – – 148.3
Financial liabilities
Trade and other payables 26 (398.2) (43.9) (85.5) – – (527.6)
Borrowings (excluding prepayments) 24 (10,357.8) – – – – (10,357.8)
(10,000.8) (39.3) (66.7) – 6.1 (10,100.7)
As at 31 December 2014
Financial assets
Cash and cash equivalents 21 216.6 27.2 6.1 0.1 1.2 251.2
Trade receivables 19 153.5 – – – – 153.5
Sundry receivables 19 18.3 6.3 9.6 – – 34.2
Financial liabilities
Trade and other payables 26 (416.5) (52.8) (90.1) – (14.0) (573.4)
Borrowings (excluding prepayments) 24 (8,316.4) – – – – (8,316.4)
(8,344.5) (19.3) (74.4) 0.1 (12.8) (8,450.9)
MMG0024 AR15_PFO3.indd 115 8/04/16 4:37 PM
For
per
sona
l use
onl
y

116 MMG LiMited
nOTES TO COnSOlIDATED FInAnCIAl STATEMEnTS (COnTInUED)
Based on the Group’s net financial assets and liabilities as at 31 December 2015 and 2014, a movement of the US dollar against the principal non‑functional currencies as illustrated in the table below, with all other variables held constant, would change (loss)/profit after taxation and equity as follows:
US$ million
2015 2014
Weakening of US dollar
Strengthening of US dollar
Strengthening of US dollar
Weakening of US dollar
Loss Equity Loss Equity Profit Equity Profit Equity
10% movement in A$ (2014: 10%) 4.7 4.7 (4.7) (4.7) 5.2 5.2 (5.2) (5.2)
10% movement in PEN (2014: 10%) 2.7 2.7 (2.7) (2.7) 1.3 1.3 (1.3) (1.3)
Total 7.4 7.4 (7.4) (7.4) 6.5 6.5 (6.5) (6.5)
(d) Credit risk
Credit risk refers to the risk that a counterparty will default on its contractual obligations resulting in financial loss to the Group. The Group is exposed to counterparty credit risk through sales of metal products on normal terms of trade, through deposits of cash and settlement risk on foreign exchange transactions. At the reporting date, the carrying amount of the Group’s financial assets, including cash and cash equivalents, trade and other receivables, loan to a related party and other bank deposits, represents the maximum credit exposure.
The credit risk on investments in cash, short‑term deposits and similar assets are with approved counterparty banks and the intermediate holding company of the Company. Counterparties are assessed prior to, during and after the conclusion of transactions to ensure exposure to credit risk is limited to acceptable levels. The limits are set to minimise the concentration of risks and therefore mitigate the potential for financial loss through counterparty failure.
The Group’s most significant customer is Nyrstar Sales and Marketing AG. The revenue earned from Nyrstar Sales and Marketing AG was approximately 27.6% of revenue for the year (2014: Nyrstar Sales and Marketing AG with 33.4%). The largest debtor at 31 December 2015 was Trafigura Ptd Ltd with a balance of US$9.4 million (2014: Nyrstar Sales and Marketing AB with a balance of US$74.9 million) and the five largest debtors accounted for 48.5% (2014: 88.2%) of the Group’s trade receivables. Credit risk arising from sales to large‑concentrate customers is managed by contracts that stipulate a provisional payment of at least 90% of the estimated value of each sale. This is payable either promptly after vessel loading or upon vessel arriving at the discharge port. Title to the concentrate does not pass to the buyer until this provisional payment is made. For most sales a second provisional payment is received within 60 days of the vessel arriving at the port of discharge. Final payment is made after completion of the quotation period and assaying. The credit risk by geographic location of customer was:
US$ million
AS AT 31 DECEMBER
2015 2014
Australia 5.9 2.5
Europe 26.0 118.2
Asia 6.2 32.8
38.1 153.5
MMG0024 AR15_PFO3.indd 116 8/04/16 4:37 PM
For
per
sona
l use
onl
y

117 AnnuAl RepoRt 2015
(e) liquidity risk
Liquidity risk is the risk that the Group will encounter difficulty in meeting obligations associated with financial liabilities.
Management utilises short and long‑term cash flow forecasts and other consolidated information to ensure that appropriate liquidity buffers are maintained to support the Group’s activities.
The table below analyses the Group’s financial liabilities into relevant maturity groupings based on the remaining period at the balance sheet date to the contractual maturity date. The amounts disclosed in the table are the contractual undiscounted cash flows.
US$ millionWithin 1 year
Between 1 and 2
years
Between 2 and 5
yearsOver
5 years Total
At 31 December 2015
Financial liabilities
Trade and other payables (including accrued interest) 420.2 107.4 – – 527.6
Borrowings (including unaccrued interest) 383.1 1,350.9 5,097.3 6,781.5 13,612.8
Forward foreign exchange contracts net settled 0.3 – – – 0.3
803.6 1,458.3 5,097.3 6,781.5 14,140.7
At 31 December 2014
Financial liabilities
Trade and other payables 508.5 37.0 27.9 – 573.4
Borrowings (including unaccrued interest) 205.0 360.1 2,720.8 9,006.1 12,292.0
713.5 397.1 2,748.7 9,006.1 12,865.4
The amounts presented in the tables above comprise the contractual undiscounted cash flows, and therefore will not agree with the amounts presented in the balance sheet.
(f) equity securities price risk
Equity securities price risk arising from investments held by the Group is classified in the balance sheet as available‑for‑sale or fair value through profit and loss financial assets. All the Group’s equity investments are publicly traded. The price risk of the Group’s equity securities was not significant as at 31 December 2015 and 2014.
(g) Sovereign risk
The Group has operations in countries that carry higher levels of sovereign risk. Political and administrative change and reforms in law, regulations or taxation may impact the Group’s future performance.
MMG0024 AR15_PFO3.indd 117 8/04/16 4:37 PM
For
per
sona
l use
onl
y

118 MMG LiMited
nOTES TO COnSOlIDATED FInAnCIAl STATEMEnTS (COnTInUED)
31.2 FAIR VALUE OF FINANCIAL INSTRUMENTS
The fair values of cash and cash equivalents and short‑term monetary financial assets and financial liabilities approximate their carrying values. The fair values of other monetary financial assets and liabilities are either based upon market prices, where a market exists, or have been determined by discounting the expected future cash flows by the current interest rate for financial assets and financial liabilities with similar risk profiles.
The fair value of listed equity investments has been valued by reference to market prices prevailing at the reporting date.
The carrying value of trade and other receivables less impairment provisions and trade payables is a reasonable approximation of their fair values due to the short‑term nature of trade receivables and payables. The fair value of financial liabilities for disclosure purposes is estimated by discounting the future contractual cash flows at the current market interest rate that is available to the consolidated entity for similar financial instruments.
The carrying amounts and fair values of financial assets and liabilities by category and class at 31 December 2015 and 2014 are:
US$ million NoteLoans and
receivablesAvailable‑
for‑sale
Designated at fair value
through profit
and loss
Other liabilities at
amortised Cost
Total carrying
value
Total fair
value
As at 31 December 2015
Financial assets
Cash and cash equivalents 21 598.3 – – – 598.3 598.3
Trade receivables 19 38.1 – – – 38.1 38.1
Sundry receivables 19 148.3 – – – 148.3 148.3
Other financial assets 20 10.3 14.5 2.5 – 27.3 27.3
795.0 14.5 2.5 – 812.0 812.0
Financial liabilities
Trade and other payables 26 – – – 527.6 527.6 527.6
Borrowings (excluding prepayments) 24 – – – 10,357.8 10,357.8 10,362.5
– – – 10,885.4 10,885.4 10,890.1
As at 31 December 2014
Financial assets
Cash and cash equivalents 21 251.2 – – – 251.2 251.2
Trade receivables 19 153.5 – – – 153.5 153.5
Sundry receivables 19 34.2 – – – 34.2 34.2
Loan to a related party 30(d) 80.0 – – – 80.0 80.0
Other financial assets 20 8.5 25.9 4.7 – 39.1 39.1
527.4 25.9 4.7 – 558.0 558.0
Financial liabilities
Trade and other payables 26 – – – 573.4 573.4 573.4
Borrowings (excluding prepayments) 24 – – – 8,316.4 8,316.4 8,321.3
– – – 8,889.8 8,889.8 8,894.7
MMG0024 AR15_PFO3.indd 118 8/04/16 4:37 PM
For
per
sona
l use
onl
y

119 AnnuAl RepoRt 2015
31.3 FAIR VALUE ESTIMATION
The table below analyses financial instruments carried at fair value, by the valuation method. The different levels have been defined as follows:
› quoted prices (unadjusted) in active markets for identical assets or liabilities (level 1);
› inputs other than quoted prices included within level 1 that are observable for the asset or liability, either directly (that
is, as prices) or indirectly (that is, derived from prices) (level 2); and
› inputs for the asset or liability that are not based on observable market data (that is, unobservable inputs) (level 3).
The following table presents the Group’s financial assets and liabilities that are measured at fair value at 31 December 2015 and 2014.
US$ million Note Level 1 Level 2 Level 3 Total
Assets
As at 31 December 2015
Financial assets at fair value through profit and loss – listed1 20 2.5 – – 2.5
Derivatives used for hedging2 12 – (0.3) – (0.3)
Available‑for‑sale financial assets – listed1 20 14.5 – – 14.5
17.0 (0.3) – 16.7
As at 31 December 2014
Financial assets at fair value through profit and loss – listed1 20 4.7 – – 4.7
Available‑for‑sale financial assets – listed1 20 25.9 – – 25.9
30.6 – – 30.6
There were no transfers between levels 1, 2 and 3 during the year.
1. The fair values of financial instruments traded in active markets are based on quoted market prices at the balance sheet date. A market is regarded as active if quoted prices are readily and regularly available from an exchange, dealer, broker, industry group, pricing service, or regulatory agency, and those prices represent actual and regularly occurring market transactions on an arm’s‑length basis. Instruments included in level 1 comprise investments in listed stock exchanges.
2. Derivative financial instruments have been valued using quoted market rates. This valuation technique maximises the use of observable market data where it is available and relies as little as possible on entity specific estimates.
31.4 CAPITAL RISK MANAGEMENT
The Group’s objectives on managing capital are to safeguard the Group’s ability to continue as a going concern, support the Group’s sustainable growth, enhance Shareholder value and provide capital for potential acquisitions and investment.
The Group manages the capital structure and makes adjustments to it in light of changes in economic conditions and business strategies. In order to maintain or adjust the capital structure, the Group may adjust the amount of dividend payments to Shareholders, issue new shares or raise/repay debts.
The Group monitors capital and manages its cash flow in accordance with financial covenants contained in group debt facilities. During the year, the Group raised US$1,540.5 million (2014: US$5,150.8 million) external bank borrowings and US$417.5 million (2014: US$1,843.8 million) Shareholder borrowings (note 30(d)) to fund the Las Bambas Project. The Group also drew US$189.0 million from ICBC.
MMG Group debt facilities (other than those of the MMG South America Group) are not secured against the assets of the MMG South America Group. As a result, the terms of relevant MMG Group debt facility agreements excluded certain MMG South America Group related items for the purposes of measuring covenants. Consistent with this, a key item excluded from the MMG Group (excluding MMG South America Group) gearing ratio calculation is US$2,261.3 million (2014: US$1,843.8 million) Shareholder borrowings held by MMG South America Company Limited to fund its equity contribution in the Las Bambas joint venture company MMG South America Management Company Limited.
MMG0024 AR15_PFO3.indd 119 8/04/16 4:37 PM
For
per
sona
l use
onl
y

120 MMG LiMited
nOTES TO COnSOlIDATED FInAnCIAl STATEMEnTS (COnTInUED)
MMG Group (excluding MMG South America Group)2015
US$ million2014
US$ million
Total borrowings (excluding prepayments) 1,405.2 1,321.8
Less: cash and cash equivalents 431.2 91.9
Net debt 974.0 1,229.9
Total equity (including Shareholder borrowings) 950.9 1,922.5
Net debt + Total equity 1,924.9 3,152.4
Gearing ratio 0.51 0.39
The Group’s objectives on managing the capital employed by MMG South America Management Group (the Las Bambas joint venture company and its subsidiaries) are to safeguard the MMG South America Management Group’s ability to continue as a going concern, support the development of projects, enhance Shareholder value and provide capital for further investment.
The process used to manage and monitor the capital for the MMG South America Management Group is consistent with that applied to the rest of the MMG Group.
MMG South America Management Group2015
US$ million2014
US$ million
Total borrowings (excluding prepayments) 6,691.3 5,150.8
Less: cash and cash equivalents 167.1 159.3
Net debt 6,524.2 4,991.5
Total equity 3,485.6 2,895.9
Net debt + Total equity 10,009.8 7,887.4
Gearing ratio 0.65 0.63
available debt facilities
As at 31 December 2015, the MMG Group (excluding the MMG South America Management Group) had available undrawn facilities of US$850.0 million (2014: US$1,040.0 million), including US$750.0 million available under the Dugald River facility, which can only be used for the purpose of funding the Dugald River project. In the event financing arrangements for the Dugald River project cannot be finalised, that facility will no longer be available and amounts already drawn under it will need to be repaid.
As at 31 December 2015, the MMG South America Management Group had available undrawn facilities of US$265.7 million (2014: US$1,806.2 million).
As at 31 December 2015, US$0.7 million of the facility with Top Create, a Shareholder of the Company, to fund MMG Group equity contributions to the MMG South America Management Group, remained undrawn (2014: US$418.3 million).
alternative funding options
The Group considers it has various alternate funding options available to it should the need arise, including the following:
› drawing down on the existing US$100 million revolving facility from Industrial and Commercial Bank of China Limited (ICBC);
› utilising the existing transactional and operational banking arrangements that the Group has in place with Bank of America Merrill Lynch for US$20 million;
› borrowing from the Group insurance captive of approximately US$20 million;
› a potential equity raising;
› disposal of investments or sale of non‑core assets;
› traditional working capital and capital expenditure levers; and
› the Company also has the support of its major shareholder, CMC.
MMG0024 AR15_PFO3.indd 120 8/04/16 4:37 PM
For
per
sona
l use
onl
y

121 AnnuAl RepoRt 2015
32. DIreCTorS’ aND SeNIor MaNaGeMeNT’S eMolUMeNTS
(a) Directors’ emoluments
The remuneration of every Director for the year ended 31 December 2015 is set out below:
Name of Director
FOR ThE yEAR EnDED 31 DECEMBER 2015
FeesUS$’000
SalariesUS$’000
Other benefits1
US$’000
Short‑term incentive
plans2
US$’000
Long‑term incentive
plans3
US$’000Total
US$’000
Mr Jiao Jian 352 – 1 – – 353
Mr Andrew Gordon Michelmore4, 10 – 1,845 18 1,325 6,525 9,713
Mr David Mark Lamont5, 10 – 870 16 (192) (457) 237
Mr Xu Jiqing10 – 594 79 358 863 1,894
Mr Wang Lixin6 95 – – – – 95
Mr Gao Xiaoyu 148 – 2 – – 150
Mr Leung Cheuk Yan 148 – – – – 148
Dr Peter William Cassidy 163 – 1 – – 164
Mr Anthony Charles Larkin7 68 – 2 – – 70
Ms Jennifer Anne Seabrook8 74 – – – – 74
Professor Pei Ker Wei9 64 – – – – 64
1,112 3,309 119 1,491 6,931 12,962
1. Other benefits include statutory superannuation and pension contributions and non‑monetary benefits. Not all benefits apply to each executive; benefits are applied variably based on contractual obligations.
2. Short‑term incentive (STI) plans include at‑risk, performance‑linked remuneration STI plans and discretionary bonuses paid in relation to the completion of Las Bambas.
The STI plan is an annual cash award determined by performance against Group financial and safety targets and individual performance. For operational roles, additional components include performance targets related to production rates, unit costs, and operational safety.
Participation in the at‑risk incentive plans is offered to participants as a percentage of their fixed remuneration according to seniority and their ability to influence the performance of the Group. All employees on long‑term employment contracts are eligible to participate in an STI plan. The incentive plans’ provision for STIs was re‑assessed at the balance sheet date.
3. Long‑term incentive (LTI) plans include at‑risk, performance‑linked remuneration LTI plans and an Executive plan (EP).
The 2013 Long Term Incentive Equity (LTIE) plan is comprised of a Share Option Scheme and a cash‑settled award vesting at the conclusion of three performance years. The 2014 LTI plan is a cash‑settled award vesting at the conclusion of three performance years. The 2015 LTIE plan is a Performance Awards Scheme vesting at the conclusion of three performance years. The vesting of LTI plans is conditional upon the achievement of certain performance conditions as set out in the respective letters of grant, including amongst others, achievement of financial, resources and market‑related performance targets at the conclusion of the respective vesting period.
The 2014 EP is a cash‑settled award vesting at the conclusion of three years provided that the EP recipient remains in employment with the Group until the end of the period. Participation in the EP is at the Board’s discretion and limited to senior executives.
Participation in the at‑risk incentive plans is offered to participants as a percentage of their fixed remuneration according to seniority and their ability to influence the performance of the Group. The LTI and LTIE plans are limited to senior managers invited to participate by the Board. The incentive plans’ provision for LTI plans was re‑assessed at the balance sheet date. The values attributed to the LTI plans are estimated values based on an assessment of the likely outcomes for each LTI plan and may be adjusted based on the actual outcome.
4. Mr Andrew Gordon Michelmore is also the Chief Executive Officer.
5. Resigned as an Executive Director and Chief Financial Officer of the Company on 9 December 2015. This resulted in the reversal of short‑term and long‑term incentives accrued in prior years as these entitlements lapsed upon resignation.
6. Resigned as a Non‑executive Director of the Company on 29 June 2015.
7. Resigned as an Independent Non‑executive Director of the Company on 20 May 2015.
8. Appointed as an Independent Non‑executive Director of the Company on 17 July 2015.
9. Appointed as an Independent Non‑executive Director of the Company on 28 July 2015.
10. The above table sets out the Directors’ remuneration for the year ended 31 December 2015. The accounting values of the Executive Directors’ remuneration are reported in accordance with Accounting Standards and may not always reflect what the Executive Directors have actually received, particularly due to the valuation of LTI and LTIE. The actual remuneration paid or to be paid to the Executive Directors for the financial year ended 31 December 2015, which consists of salaries and the 2015 STI plan, is set out below:
Name of Director2015
US$ million2014
US$ million
Mr Andrew Gordon Michelmore 3,188 4,697
Mr David Mark Lamont 886 1,738
Mr Xu Jiqing 1,036 1,340
MMG0024 AR15_PFO3.indd 121 8/04/16 4:37 PM
For
per
sona
l use
onl
y

122 MMG LiMited
nOTES TO COnSOlIDATED FInAnCIAl STATEMEnTS (COnTInUED)
The remuneration of every Director for the year ended 31 December 2014 is set out below:
Name of Director
FOR ThE yEAR EnDED 31 DECEMBER 2014
FeesUS$’000
SalariesUS$’000
Other benefits1
US$’000
Short‑term incentive
plans2
US$’000
Long‑term incentive
plans3
US$’000Total
US$’000
Mr Wang Lixin5 339 – 3 – – 342
Mr Andrew Gordon Michelmore4 – 2,146 22 2,686 1,514 6,368
Mr David Mark Lamont – 1,020 20 853 439 2,332
Mr Xu Jiqing – 695 67 533 259 1,554
Mr Jiao Jian6 225 – – – – 225
Mr Gao Xiaoyu 120 – – – – 120
Mr Leung Cheuk Yan 169 – – – – 169
Dr Peter William Cassidy 192 – 3 – – 195
Mr Anthony Charles Larkin 192 – 3 – – 195
1,237 3,861 118 4,072 2,212 11,500
1. Other benefits include statutory superannuation and pension contributions, non‑monetary benefits and housing allowance. Not all benefits apply to each executive; benefits are applied variably based on contractual obligations.
2. Short‑term incentive (STI) plans include at‑risk, performance‑linked remuneration STI plans and discretionary bonuses paid in relation to the completion of Las Bambas.
The STI plan is an annual cash award determined by performance against Group financial and safety targets and individual performance. For operational roles, additional components include performance targets related to production rates, unit costs, and operational safety.
Participation in the at‑risk incentive plans is offered to participants as a percentage of their fixed remuneration according to seniority and their ability to influence the performance of the Group. All employees on long‑term employment contracts are eligible to participate in an STI plan. The incentive plans’ provision for STIs was reassessed at the balance sheet date.
3. Long‑term incentive (LTI) plans include at‑risk, performance‑linked remuneration LTI plans and an Executive plan (EP).
The 2012 and 2014 LTI plans are cash‑settled awards vesting at the conclusion of three performance years. The 2013 Long Term Incentive Equity (LTIE) plan is comprised of a Share Option Scheme and a cash‑settled award vesting at the conclusion of three performance years. The vesting of LTI plans is conditional upon the achievement of certain performance conditions as set out in the respective letters of grant, including amongst others, achievement of financial, resources and market‑related performance targets at the conclusion of the respective vesting period.
The 2014 EP is a cash‑settled award vesting at the conclusion of three years provided that the EP recipient remains in employment with the Group until the end of the period. Participation in the EP is at the Board’s discretion and limited to senior executives.
Participation in the at‑risk incentive plans is offered to participants as a percentage of their fixed remuneration according to seniority and their ability to influence the performance of the Group. The LTI and LTIE plans are limited to senior managers invited to participate by the Board. The incentive plans’ provision for LTI plans was reassessed at the balance sheet date. The values attributed to the LTI plans are estimated values based on an assessment of the likely outcomes for each LTI plan and may be adjusted based on the actual outcome. The current reassessment resulted in no additional value being attributed to the 2012 and 2013 LTI plans.
4. Mr Andrew Gordon Michelmore is also the Chief Executive Officer.
5. Resigned as the Chairman on 20 August 2014 but remains as a Non‑executive Director of the Company.
6. Appointed as the Chairman of the Company on 20 August 2014.
MMG0024 AR15_PFO3.indd 122 8/04/16 4:37 PM
For
per
sona
l use
onl
y

123 AnnuAl RepoRt 2015
(b) five highest-paid individuals
The five individuals whose emoluments were the highest in the Group for the year include two Directors (2014: 3) whose emoluments are reflected in the analysis presented above and three senior executives whose remuneration by band are set out in the ‘Senior management remuneration by band’ section in this Note.
Details of the emoluments payable to all five individuals during the year are as follows:
2015 US$‘000
2014 US$‘000
Salaries and other short‑term employee benefits 4,394 5,696
Short‑term incentives and discretionary bonus 2,979 5,731
Long‑term incentives 9,389 2,961
Post‑employment benefits 70 82
16,832 14,470
During the year, no Director waived any emoluments and no emoluments were paid or payable by the Group to the Directors or any of the five highest‑paid individuals as an inducement to join or upon joining the Group or as compensation for loss of office.
(c) Senior management remuneration by band
The emoluments fell within the following bands:
nUMBER OF InDIVIDUAlS
2015 2014
HK$1,000,001–HK$1,500,000 (US$128,900–US$193,350)1 1 –
HK$3,000,001–HK$3,500,000 (US$386,700–US$451,150) 1 –
HK$4,500,001–HK$5,000,000 (US$580,050–US$644,500) – 1
HK$5,500,001–HK$6,000,000 (US$708,950–US$773,400) – 1
HK$6,500,001–HK$7,000,000 (US$837,850–US$902,300) 1 1
HK$8,500,001–HK$9,000,000 (US$1,095,650–US$1,160,100) 1 –
HK$9,500,001–HK$10,000,000 (US$1,224,550–US$1,289,000) – 1
HK$11,500,001–HK$12,000,000 (US$1,482,350–US$1,546,800) 1 –
HK$12,000,001–HK$12,500,000 (US$1,546,800–US$1,611,250) – 1
HK$14,500,001–HK$15,000,000 (US$1,869,050–US$1,933,500) 1 –
HK$16,000,001–HK$16,500,000 (US$2,062,400–US$2,126,850) – 1
HK$16,500,001–HK$17,000,000 (US$2,126,851–US$2,191,300) – 1
HK$18,000,001–HK$18,500,000 (US$2,320,200–US$2,384,650) – 1
HK$20,000,001–HK$20,500,000 (US$2,578,000–US$2,642,450) 1 –
HK$49,000,001–HK$49,500,000 (US$6,316,100–US$6,380,550) – 1
HK$75,000,001–HK$75,500,000 (US$9,667,500–US$9,731,950) 1 –
8 9
1. The banding for this executive is based on the period of employment of the executive.
MMG0024 AR15_PFO3.indd 123 8/04/16 4:38 PM
For
per
sona
l use
onl
y

124 MMG LiMited
nOTES TO COnSOlIDATED FInAnCIAl STATEMEnTS (COnTInUED)
33. Share oPTIoN SCheMe
2004 Share option Scheme
The share option scheme adopted at the Company’s Annual General Meeting (AGM) held on 28 May 2004 (2004 Share Option Scheme) expired on 27 May 2014. The exercise period for all options granted under the 2004 Share Option Scheme
expired on 3 June 2015 and accordingly all options granted under the 2004 Share Option Scheme have lapsed.
During the year ended 31 December 2015, the movements in the share options which had been granted under the 2004 Share Option Scheme were as follows:
Category and name of participant
Date of grant1
Exercise price per share (HK$)
Exercise period
nUMBER OF OpTIOnS
Balance as at 1 January
2015
Granted during
the year
Exercised during
the year
Cancelled during
the year
Lapsed during
the year2
Balance as at 31 December
2015
Directors
Jiao Jian 3 June 2010
2.75 3 June 2012 to 2 June 2015 1,200,000 – – – (1,200,000) –
Xu Jiqing 3 June 2010
2.75 3 June 2012 to 2 June 2015 1,000,000 – – – (1,000,000) –
Employees of the Group
3 June 2010
2.75 3 June 2012 to 2 June 2015 1,400,000 – (462,000) – (938,000) –
3,600,000 – (462,000) – (3,138,000) –
1. The closing price of the shares of the Company immediately before the date on which the options were granted was HK$2.69 per share.
2. This refers to options lapsed due to expiry of the exercise period.
The estimated fair value of the options granted on 3 June 2010 was approximately US$0.1183 each, estimated as at the date of grant by using the binomial option‑pricing model and taking into account the terms and conditions (except vesting conditions other than market conditions) upon which the options were granted.
During the year, the Group recognised a reversal of share option expense of approximately US$300,000 (2014: share option expense of approximately US$113,000) due to the lapse of the remaining options granted under the 2004 Share Option Scheme, following the expiry of the exercise period.
MMG0024 AR15_PFO3.indd 124 8/04/16 4:38 PM
For
per
sona
l use
onl
y

125 AnnuAl RepoRt 2015
2013 Share option Scheme
Pursuant to the share option scheme adopted by the Company on 26 March 2013 (2013 Share Option Scheme), there were 138,711,140 options outstanding as at 31 December 2015, which represented approximately 2.62% of the total number of issued shares of the Company as at that date.
During the year ended 31 December 2015, the movements in the share options which had been granted under the 2013 Share Option Scheme were as follows:
Category and name of participant
Date of grant1
Exercise price per share (HK$)
Exercise period2
nUMBER OF OpTIOnS
Balance as at 1 January
2015
Granted during
the year
Exercised during
the year
Cancelled during
the year
Lapsed during
the year3
Balance as at 31 December
2015
Directors
Andrew Michelmore
9 April 2013
2.62 9 April 2016 to 8 April 2020 28,150,200 – – – – 28,150,200
David Lamont
9 April 2013
2.62 9 April 2016 to 8 April 2020 6,240,582 – – – (6,240,582) –
Employees of the Group
9 April 2013
2.62 9 April 2016 to 8 April 2020 119,451,940 – – – (8,891,000) 110,560,940
153,842,722 – – – (15,131,582) 138,711,140
1. The closing price of the shares of the Company immediately before the date on which the options were granted was HK$2.45 per share.
2. The vesting period of the options is three years from the date of grant. The vesting of options is conditional upon the achievement of certain performance conditions as set out in the respective letters of grant, including among others, achievement of financial, reserves and market‑related performance targets during the vesting period.
3. Options lapsed due to cessation of employment.
The estimated fair value of the options granted on 9 April 2013 was approximately US$0.14 each, estimated as at the date of grant by using the Black‑Scholes option‑pricing model. The value of the options is subject to a number of assumptions and limitations of the pricing model.
The value of the share options was based on assumptions including a risk‑free interest rate, option price volatility, expected life of the option, market price of the Company’s shares and expected dividend. The risk‑free interest rate was 0.68%; the expected volatility used in calculating the value of options was 46% based on weekly closing prices of the Company’s securities on the Stock Exchange between 1 April 2011 and 5 April 2013 and the expected dividend was assumed to be nil.
During the year, the Group recognised a share option expense of approximately US$13.0 million in relation to the 2013 Share Option Scheme (2014: US$nil).
The validity period of the options is seven years from the date of grant to 8 April 2020. The vesting period of the options is three years from the date of grant. The options expire if not exercised before the end of the exercise period on 8 April 2020. If a participant leaves employment before the expiry of the vesting period, the option will lapse unless the participant leaves due to certain specific reasons including ill‑health, injury or disability, retirement with the agreement of the employer, redundancy, death, the participating employing company ceasing to be part of the Group and any other reason, if the Board so decides.
MMG0024 AR15_PFO3.indd 125 8/04/16 4:38 PM
For
per
sona
l use
onl
y

126 MMG LiMited
nOTES TO COnSOlIDATED FInAnCIAl STATEMEnTS (COnTInUED)
2015 Performance awards Scheme
On 19 May 2015 the Company granted performance awards to the eligible participants pursuant to the Long‑Term Incentive Equity Plan (LTIEP) adopted by the Company (2015 Performance Awards Scheme). There were 76,087,500 performance awards outstanding as at 31 December 2015,
representing approximately 1.44% of the total number of issued shares of the Company as at that date.
During the year ended 31 December 2015, the movements in the performance awards granted under the 2015 Performance Awards Scheme were as follows:
Category and name of participant Date of grant
Balance as at 1 January
2015
Granted during
the year
Exercised during
the year
Cancelled during
the year
Lapsed during
the year1
Balance as at 31 December
2015
Directors
Andrew Michelmore
19 May 2015 – 15,100,000 – – – 15,100,000
David Lamont 19 May 2015 – 2,600,000 – – (2,600,000) –
Xu Jiqing 19 May 2015 – 1,800,000 – – – 1,800,000
Employees of the Group
19 May 2015 – 60,267,500 – – (1,080,000) 59,187,500
Total – 79,767,500 – – (3,680,000) 76,087,500
1. Performance awards lapsed due to cessation of employment.
The performance awards are granted for nil cash consideration. The vesting of the performance awards will be subject to the achievement by each participant of certain performance conditions, among other things, independently assessed measures of achievement of resources growth and financial and market‑related targets. The performance period is a three‑year period from 1 January 2015 to
31 December 2017. Time of vesting will be on or around April 2018. Portions of the vested performance awards will be subject to holding locks for various periods of up to three years after vesting.
During the year, the Group recognised a share award expense of approximately US$5.4 million in relation to the 2015 Performance Awards Scheme.
34. CoMMITMeNTS
(a) operating leases
The Group leases various warehouses, offices and factory premises under non‑cancellable operating leases. The future aggregate minimum lease payments under non‑cancellable operating leases are as follows:
2015 US$ million
2014 US$ million
Not later than one year 8.9 10.6
Later than one year but not later than five years 14.6 22.2
Later than five years 0.2 –
23.7 32.8
MMG0024 AR15_PFO3.indd 126 8/04/16 4:38 PM
For
per
sona
l use
onl
y

127 AnnuAl RepoRt 2015
(b) Capital commitments
Commitments for capital expenditure contracted for at the reporting date but not recognised as liabilities, are set out in the table below:
2015 US$ million
2014 US$ million
Property, plant and equipment
Not later than one year 707.4 1,159.9
Later than one year but not later than five years – 60.1
707.4 1,220.0
Intangible assets
Not later than one year 3.6 9.8
3.6 9.8
2015 US$ million
2014 US$ million
Aggregate
Property, plant and equipment and intangible assets
Contracted but not provided for 711.0 1,229.8
711.0 1,229.8
35. CoNTINGeNT aSSeTS aND lIaBIlITIeS
LEGAL PROCEEDINGS
The Company and its subsidiaries are defendants from time to time in legal proceedings arising from the conduct of their businesses. The Group does not consider that the outcome of any of these proceedings ongoing at balance date, either individually or in aggregate, is likely to have a material effect on its financial position. Where appropriate, provisions have been made.
BANK GUARANTEES
Certain bank guarantees have been provided in connection with the operations of certain subsidiaries of the Company primarily associated with the terms of mining leases, mining concessions, exploration licences or key contracting arrangements. At the end of the year, no claims have been made under these guarantees. The amount of these guarantees may vary from time to time depending upon the requirements of the relevant regulatory authority. These guarantees amount to US$491.2 million (2014: US$442.9 million).
CONTINGENT ASSETS – TAx INDEMNITIES
The Group has been granted warranties and indemnities in relation to certain tax matters. No litigation has been undertaken in relation to these indemnities and warranties by the Group.
CONTINGENT LIABILITIES – TAx RELATED CONTINGENCIES
Tax authorities conduct regular routine tax reviews and audits on the Group. The final outcome cannot be determined with sufficient reliability. The balance sheet currently reflects all probable taxation liabilities and reasonable steps are being undertaken in relation to all outstanding matters.
36. eVeNTS afTer BalaNCe SheeT DaTe
Other than the matters outlined elsewhere in these financial statements, there have been no matters that have occurred subsequent to the reporting date which have significantly affected, or may significantly affect the Group’s operations, results or state of affairs in future years.
MMG0024 AR15_PFO3.indd 127 8/04/16 4:38 PM
For
per
sona
l use
onl
y

128 MMG LiMited
nOTES TO COnSOlIDATED FInAnCIAl STATEMEnTS (COnTInUED)
37. CoMPaNY BalaNCe SheeT aND reSerVeS
(a) Company Balance Sheet
AS AT 31 DECEMBER
Note2015
US$ million2014
US$ million
ASSETS
Non‑current assets
Property, plant and equipment 0.5 0.7
Interests in subsidiaries 2,735.3 3,632.3
2,735.8 3,633.0
Current assets
Other receivables 0.4 0.2
Cash and cash equivalents 0.1 0.3
0.5 0.5
Total assets 2,736.3 3,633.5
EqUITY
Capital and reserves
Share capital 2,359.1 2,358.9
Reserves and retained (losses)/profits (b) (679.8) 209.5
Total equity 1,679.3 2,568.4
LIABILITIES
Non‑current liabilities
Loans from subsidiaries 1,056.7 941.7
1,056.7 941.7
Current liabilities
Loans from subsidiaries – 123.4
Other payables 0.3 –
0.3 123.4
Total liabilities 1,057.0 1,065.1
Total equity and liabilities 2,736.3 3,633.5
Andrew Michelmore Jiqing xu CEO and Executive Director Executive Director
MMG0024 AR15_PFO3.indd 128 8/04/16 4:38 PM
For
per
sona
l use
onl
y

129 AnnuAl RepoRt 2015
(b) Company reserves and retained profits
US$ millionShare
premium Capital reserve
Special capital reserve
Capital redemption
reserve
Share option reserve
Retained profits Total
At 1 January 2014 2,318.6 6.2 9.4 0.2 2.1 246.1 2,582.6
Profit for the year – – – – – 4.7 4.7
Dividends paid – – – – – (52.9) (52.9)
Transition to no‑par value regime on 3 March 2014 (Note 22) (2,318.6) (6.2) – (0.2) – – (2,325.0)
Employee share options – – – – 0.1 – 0.1
At 31 December 2014 – – 9.4 – 2.2 197.9 209.5
Loss for the year – – – – – (907.3) (907.3)
Employee share options – – – – 18.0 – 18.0
At 31 December 2015 – – 9.4 – 20.2 (709.4) (679.8)
MMG0024 AR15_PFO3.indd 129 8/04/16 4:38 PM
For
per
sona
l use
onl
y

130 MMG LiMited
US$ million 2015 2014 2013 20121 2011
Results – the Group
Continuing operations
Revenue 1,950.9 2,479.8 2,469.8 2,499.4 2,228.3
EBITDA 420.9 780.8 750.9 737.9 1,063.8
EBIT (1,125.5) 243.7 278.3 429.2 755.3
Finance income 3.8 3.3 2.8 4.5 2.4
Finance costs (88.8) (82.7) (80.0) (92.2) (48.6)
Profit before income tax (1,210.5) 164.3 201.1 341.5 709.1
Income tax expense 161.8 (65.1) (78.6) (107.4) (225.5)
(Loss)/profit for the year from continuing operations (1,048.7) 99.2 122.5 234.1 483.6
Discontinued operations
Profit for the year from discontinued operations – – – – 90.9
(Loss)/profit for the year (1,048.7) 99.2 122.5 234.1 574.5
Attributable to:
Equity holders of the Company (1,026.5) 103.8 103.3 209.1 540.9
Non‑controlling interests (22.2) (4.6) 19.2 25.0 33.6
(1,048.7) 99.2 122.5 234.1 574.5
A summary of the Group results that relate to current operations involving the exploration for, and development of mining projects, is presented below.
US$ million 2015 2014 2013 20121 2011
Results – current operations
EBIT (1,125.5) 243.7 278.3 429.2 755.3
Significant non‑recurring items 897.0 – – – (215.9)
Underlying EBIT2 (228.5) 243.7 278.3 429.2 539.4
1. The results for 2012 have been restated due to a change in accounting policy as disclosed in Note 2 to the consolidated financial statements presented in the 2013 Annual Report of the Company.
2. Underlying EBIT represents EBIT adjusted for significant non‑recurring items (before tax).
five-YeAR finAnCiAl SummARY
MMG0024 AR15_PFO3.indd 130 8/04/16 4:38 PM
For
per
sona
l use
onl
y

131 AnnuAl RepoRt 2015
US$ million 2015 2014 2013 20121 2011
Assets and liabilities – the Group
Property, plant and equipment 11,873.0 11,100.8 3,323.1 3,204.8 1,754.9
Intangible assets 628.6 839.0 284.0 230.9 –
Inventories 342.9 332.9 351.9 354.4 311.5
Trade and other receivables 801.2 620.4 303.9 254.1 118.3
Loan to a related party – 80.0 – 100.0 95.0
Cash and cash equivalents 598.3 251.2 137.4 95.7 1,096.5
Other financial assets 27.3 39.1 122.3 146.1 4.4
Other assets – – – 7.3 1.9
Current income tax assets 1.4 28.6 – 29.0 7.4
Deferred income tax assets 368.5 173.6 136.5 114.2 63.6
Assets of disposal group classified as held for sale 18.8 24.4 24.4 25.2 –
Total assets 14,660.0 13,490.0 4,683.5 4,561.7 3,453.5
Capital and reserves attributable to equity holders of the Company 666.6 1,686.3 1,620.1 1,532.8 1,435.4
Non‑controlling interests 1,508.6 1,288.3 196.7 55.5 59.0
Total equity 2,175.2 2,974.6 1,816.8 1,588.3 1,494.4
Borrowings 10,263.1 8,208.9 1,621.4 1,635.9 1,081.1
Trade and other payables 527.6 573.4 235.6 299.4 205.7
Other liabilities 0.3 – – – –
Current income tax liabilities 31.8 71.9 76.6 120.8 117.9
Provisions 913.5 886.8 687.9 675.7 547.6
Deferred income tax liabilities 744.0 769.9 239.3 235.0 5.5
Liabilities of disposal group classified as held for sale 4.5 4.5 5.9 6.6 1.3
Total liabilities 12,484.8 10,515.4 2,866.7 2,973.4 1,959.1
Total equity and liabilities 14,660.0 13,490.0 4,683.5 4,561.7 3,453.5
1. The results for 2012 have been restated due to a change in accounting policy as disclosed in Note 2 to the consolidated financial statements presented in 2013 Annual Report of the Company.
MMG0024 AR15_PFO3.indd 131 8/04/16 4:38 PM
For
per
sona
l use
onl
y

132 MMG LiMited
A$ Australian dollar, the lawful currency of Australia
AGM annual general meeting
Album Enterprises Album Enterprises Limited, a company incorporated on 19 January 2005 in Hong Kong with limited liability, a wholly owned subsidiary of CMN
Album Investment Album Investment Private Limited, a company incorporated on 8 April 2009 in Singapore with limited liability, a wholly owned subsidiary of the Company
Album Resources Album Resources Private Limited, a company incorporated on 8 April 2009 in Singapore with limited liability, a wholly owned subsidiary of the Company
Anvil Anvil Mining Limited, a company existing under the laws of the British Virgin Islands, a wholly owned subsidiary of the Company
Associate has the meaning ascribed to it under the Listing Rules
Australia The Commonwealth of Australia
Board the Board of directors of the Company
Board Charter the Board charter of the Company
BOC Bank of China Limited, a company listed on the Hong Kong Stock Exchange and the Shanghai Stock Exchange
BOC Singapore Bank of China Limited, Singapore Branch
BOC Sydney Bank of China Limited, Sydney Branch
C$ Canadian dollar, the lawful currency of Canada
CDB China Development Bank Corporation
CDF Congolese Franc, the lawful currency of Democratic Republic of the Congo
CEO Chief Executive Officer
CFO Chief Financial Officer
CG Code Corporate Governance Code and Corporate Governance Report contained in Appendix 14 of the Listing Rules
CGU cash‑generating unit
Changzhou Jinyuan Changzhou Jinyuan Copper Co. Ltd
CHF Swiss Franc, the lawful currency of Switzerland
China has the same meaning as PRC
CMC China Minmetals Corporation, formerly known as China National Metals and Minerals Import and Export Corporation, a state‑owned enterprise incorporated on 7 April 1950 under the laws of the PRC
CMC Group CMC and its subsidiaries
CMCL China Minmetals Corporation Limited, a joint stock limited company incorporated on 16 December 2010 under the laws of the PRC
CMN China Minmetals Non‑ferrous Metals Company Limited, a joint stock limited company incorporated on 27 December 2001 under the laws of the PRC
CMNH China Minmetals Non‑ferrous Metals Holding Company Limited, a joint stock limited company incorporated on 22 December 2009 under the laws of the PRC
CNIC CNIC Corporation Limited, formerly known as GUOXIN International Investment Corporation Limited and a company incorporated in Hong Kong
Companies Ordinance
the Companies Ordinance (Chapter 622 of the Laws of Hong Kong)
Company MMG Limited, a company incorporated on 29 July 1988 in Hong Kong with limited liability, the securities of which are listed and traded on the main board of the Stock Exchange and the Australian Securities Exchange
GloSSARY
MMG0024 AR15_PFO3.indd 132 8/04/16 4:38 PM
For
per
sona
l use
onl
y

133 AnnuAl RepoRt 2015
Copper Partners Investment
Copper Partners Investment Co., Ltd, a subsidiary of CMC
CRPS convertible redeemable preference shares
Director(s) the director(s) of the Company
Discontinued operations or disposal group
the trading, fabrication and other operations that were effectively disposed in December 2011. The trading, fabrication and other assets include the Company’s entire 100% equity interest in Minmetals Aluminium, Riseup Dragon Limited’s entire 72.80% equity interest in North China Aluminium, Orienmet Industry Company Limited’s entire 51% equity interest in Yingkou Orienmet and Lontic (H.K.) Limited’s entire 36.29% equity interest in Changzhou Jinyuan. Orienmet Industry Company Limited, Riseup Dragon Limited and Lontic (H.K.) Limited are wholly owned subsidiaries of the Company
DRC Democratic Republic of the Congo
EBIT earnings before interest (net finance costs) and income tax
EBITDA earnings before interest (net finance costs), income tax, depreciation, amortisation and impairment expenses
EBITDA margin EBITDA divided by revenue
EGM extraordinary general meeting
EP Executive Plan
EUR Euro
Executive Committee
the executive committee of the Group, which consists of all Executive Directors of the Company, Chief Operating Officer, Chief Financial Officer, Executive General Manager – Stakeholder Relations and Executive General Manager – Business Support
EXIM The Export‑Import Bank of China
FVLCTS fair value less costs to sell
Gearing ratio net debt (total borrowings excluding finance charge prepayments, less cash and bank deposits) divided by the aggregate of net debt plus total equity
GRI Global Reporting Initiative
Group the Company and its subsidiaries
g/t grams per tonne
HK$ Hong Kong dollar, the lawful currency of Hong Kong
HKAS Hong Kong Accounting Standards (see definition of HKFRS)
HKFRS Hong Kong Financial Reporting Standards, which include all applicable individual Hong Kong Financial Reporting Standards, Hong Kong Accounting Standards (HKAS) and interpretations issued by the Hong Kong Institute of Certified Public Accountants (HKICPA)
HKICPA the Hong Kong Institute of Certified Public Accountants
HNG Hunan Nonferrous Metals Holding Group Co., Ltd
Hong Kong the Hong Kong Special Administrative Region of the People’s Republic of China
ICBC Industrial and Commercial Bank of China Limited, Sydney Branch
Independent Shareholders
Shareholders who do not have any material interest in the Products Sale Framework Agreement or the Las Bambas CMN Copper Sale Framework Agreement (as the case may be) other than by virtue of their respective shareholdings in the Company
Indicated Mineral Resource
the part of a Mineral Resource for which quantity, grade (or quality), densities, shape and physical characteristics are estimated with sufficient confidence to allow the application of Modifying Factors in sufficient detail to support mine planning and evaluation of the economic viability of the deposit. An Indicated Mineral Resource has a higher level of confidence than an Inferred Mineral Resource but a lower level of confidence than that applying to a Measured Mineral Resource and may only be converted to a Probable Ore Reserve
MMG0024 AR15_PFO3.indd 133 8/04/16 4:38 PM
For
per
sona
l use
onl
y

134 MMG LiMited
glOSSARy (COnTInUED)
Inferred Mineral Resource
as defined under the JORC Code, that part of a Mineral Resource for which tonnage, grade and mineral content can be estimated with a low level of confidence
Interpretation the Interpretation applies to waste removal costs that are incurred in surface mining activity during the production phase of a mine (production stripping costs) effective 1 January 2013 in accordance with Hong Kong (IFRIC) – Interpretation 20 Stripping Costs in the Production Phase of a Surface Mine
JORC Code Joint Ore Reserves Committee ‘Australasian Code for Reporting of Exploration Results, Mineral Resources and Ore Reserves’
ktpd kilotons per day
Laos the Lao People’s Democratic Republic (Lao PDR)
Las Bambas CMN Copper Sale Framework Agreement
the agreement dated 27 June 2014 between MMG SA and CMN in relation to the sale of copper concentrate to be purchased by MMG SA from the Las Bambas Project
Las Bambas Joint Venture Company
MMG South America Management Company Limited (also referred to as MMG SAM)
Las Bambas Project the development, construction and operation of the copper mines, processing facilities and associated infrastructure at the Las Bambas copper project located in the Apurimac region in Peru, together with all activities and infrastructure associated with the transportation and export of products from such mines
Listing Rules the Rules Governing the Listing of Securities on the Stock Exchange
LME London Metal Exchange
LOM life‑of‑mine
LTI long‑term incentive
LTIE long‑term incentive equity
LTIF lost time injury frequency per million hours worked
LXML Lane Xang Minerals Limited, a company incorporated on 30 September 1993 in Laos as the holding company for the Sepon operation
m metre(s)
mm millimetre(s)
Measured Mineral Resource
the part of a Mineral Resource for which quantity, grade (or quality), densities, shape and physical characteristics are estimated with confidence sufficient to allow the application of modifying factors to support detailed mine planning and final evaluation of the economic viability of the deposit. A Measured Mineral Resource has a higher level of confidence than that applying to either an Indicated Mineral Resource or an Inferred Mineral Resource. Depending upon the confidence in the modifying factors such as metallurgical recovery, the Measured Mineral Resource may be converted to either a Proved Ore Reserve or a Probable Ore Reserve
MEPA Mineral Exploration and Production Agreement, an agreement between MMG Laos Holdings and the Government of Laos dated 15 June 1993 (as amended)
Mineral Resource as defined under the JORC Code, a concentration or occurrence of material of intrinsic economic interest in or on the Earth’s crust in such form, quality and quantity that there are reasonable prospects for eventual economic extraction
Minerals and Metals Group
the collective brand name of the portfolio of international mining assets held by Album Resources
Minmetals Aluminium
Minmetals Aluminium Company Limited
MMG Century MMG Century Limited, a company incorporated on 25 November 1986 in Australia with limited liability and a wholly owned subsidiary of the Company
MMG Dugald River MMG Dugald River Pty Ltd, a company incorporated on 15 July 1998 in Australia with limited liability and a wholly owned subsidiary of the Company
MMG0024 AR15_PFO3.indd 134 8/04/16 4:38 PM
For
per
sona
l use
onl
y

135 AnnuAl RepoRt 2015
MMG Finance Limited
formerly known as MMG Limited, a company incorporated on 15 June 2011 in Hong Kong with limited liability and a wholly owned subsidiary of the Company
MMG Golden Grove
MMG Golden Grove Pty Ltd, a company incorporated on 21 June 2005 in Australia with limited liability and a wholly owned subsidiary of the Company
MMG Laos Holdings MMG Laos Holdings Limited, a company incorporated on 25 May 1993 in the Cayman Islands with limited liability and a wholly owned subsidiary of the Company
MMG or MMG Limited
has the same meaning as the Company
MMG Management MMG Management Pty Ltd, a company incorporated on 15 July 2005 in Australia with limited liability and a wholly owned subsidiary of the Company
MMG SA MMG South America Company Limited, a company incorporated on 4 May 1990 in Hong Kong with limited liability and a wholly owned subsidiary of the Company
MMG SAM MMG South America Management Company Limited (also referred to as Las Bambas Joint Venture Company), a company incorporated on 11 February 2014 in Hong Kong with limited liability and a subsidiary of the Company
MMG South America Group
MMG SA and its subsidiaries
MMG South America Management Group
MMG SAM and its subsidiaries
Model Code Model Code for Securities Transactions by Directors of Listed Issuers as set out in Appendix 10 of the Listing Rules
MPF Scheme Mandatory Provident Fund
mtpa metric tonnes per annum
North China Aluminium
North China Aluminium Company Limited
Ore Reserve as defined under the JORC Code, the economically mineable part of a Measured and/or Indicated Mineral Resource
OTE ordinary time earnings
PEN Peruvian Nuevo Sol, the lawful currency of Peru
PRC the People’s Republic of China excluding, for the purpose of this document only, Hong Kong, the Macao Special Administrative Region of the People’s Republic of China and Taiwan, unless the context requires otherwise
Products Sale Framework Agreement
the agreement dated 5 April 2012 between the Company and CMN in relation to the sale of copper cathode, copper concentrate, zinc concentrate and lead concentrate produced, processed, manufactured, traded or distributed by any member of the Group to the CMN Group
Project Company Las Bambas Mining Company S.A. (formerly known as Xstrata Las Bambas SA), a company incorporated in Lima, Peru with registration number 12587752
Purchasers Minera Las Bambas S.A.C., a company incorporated on or about 17 February 2014 in Lima, Peru, with limited liability and MMG Swiss Finance AG, a company incorporated on 20 February 2014 in Switzerland, each of which is a subsidiary of the Company
SASAC State‑owned Assets Supervision and Administration Commission of the State Council of the PRC
Securities Trading Model Code
a model code adopted by the Company for securities trading by Directors of the Company on terms no less exacting than the required standard of the Model Code as set out in Appendix 10 of the Listing Rules
Sellers XSAL and GQL
SFO the Securities and Futures Ordinance (Chapter 571 of the Laws of Hong Kong)
Shareholder(s) the shareholder(s) of the Company
MMG0024 AR15_PFO3.indd 135 8/04/16 4:38 PM
For
per
sona
l use
onl
y

136 MMG LiMited
glOSSARy (COnTInUED)
Shareholders’ Agreement
the subscription and shareholders’ agreement dated 13 April 2014 between the Company, MMG SA, Elion Holdings Corporation Limited, CNIC, CITIC Metal Co., Ltd and MMG SAM
SHEC Safety, Health, Environment and Community
STI short‑term incentive
Stock Exchange The Stock Exchange of Hong Kong Limited
Target Company Las Bambas Holdings S.A. (formerly known as Xstrata Peru S.A.), a company incorporated in Lima, Peru, and registered under registry file with registration number 11677748 of the registry of legal entities of Lima, Peru
Topstart Topstart Limited, a company incorporated on 6 February 1991 in the British Virgin Islands with limited liability and a wholly owned subsidiary of the Company
Top Create Top Create Resources Limited, a company incorporated on 22 January 2004 in the British Virgin Islands with limited liability, a wholly owned subsidiary of CMN
TRIF total recordable injury frequency per million hours worked
US$ United States dollar, the lawful currency of the United States of America
US$751.0 million Facility
the US$751.0 million facility granted by CDB and BOC Sydney to Album Resources and MMG Management on 13 June 2012
VAT value added tax
Yingkou Orienmet Yingkou Orienmet Plica Tube Company Limited
MMG0024 AR15_PFO3.indd 136 8/04/16 4:38 PM
For
per
sona
l use
onl
y