تونس تحتل الــ 5 مراتب الأخيرة في تصنيف دولي يخص...
TRANSCRIPT
PISA 2012 RESULTS IN FOCUS © OECD 2013
WhAt StudentS KnoW And CAn do: Student PerformAnCe In mAthemAtICS, reAdIng And SCIenCe
5
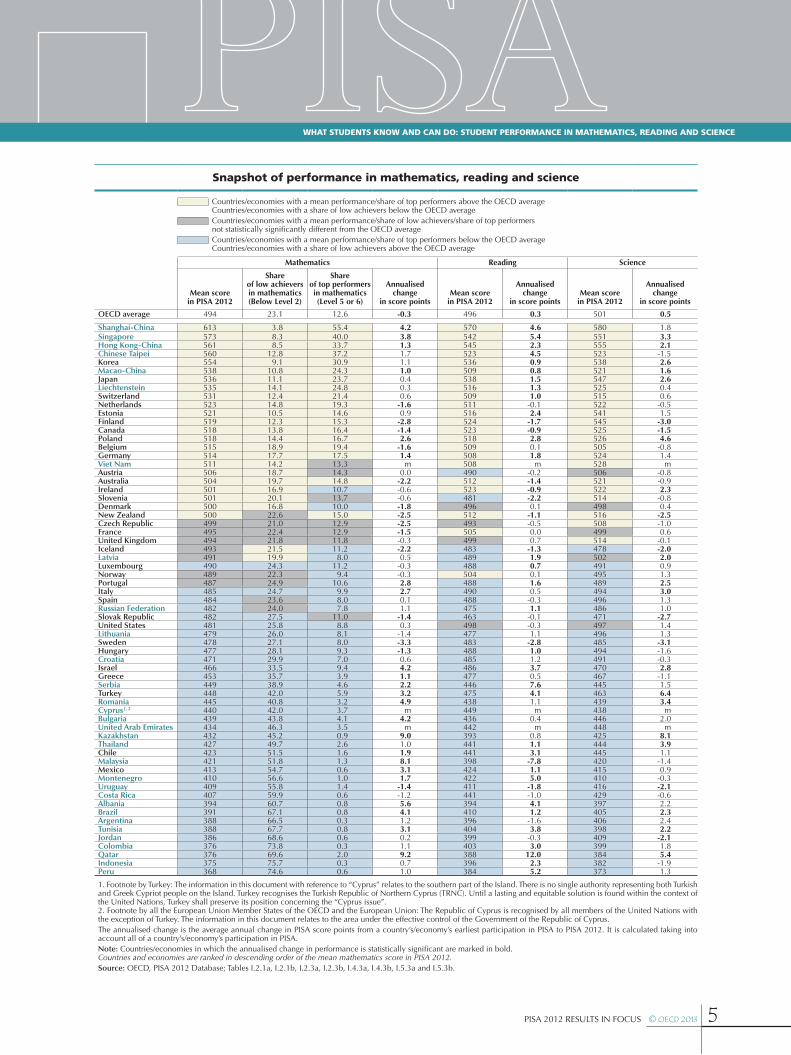
Snapshot of performance in mathematics, reading and science
Countries/economies with a mean performance/share of top performers above the OECD averageCountries/economies with a share of low achievers below the OECD averageCountries/economies with a mean performance/share of low achievers/share of top performers not statistically significantly different from the OECD averageCountries/economies with a mean performance/share of top performers below the OECD averageCountries/economies with a share of low achievers above the OECD average
Mathematics Reading Science
Mean score
in PISA 2012
Share of low achievers in mathematics (Below Level 2)
Share of top performers in mathematics (Level 5 or 6)
Annualised change
in score pointsMean score
in PISA 2012
Annualised change
in score pointsMean score
in PISA 2012
Annualised change
in score points
OECD average 494 23.1 12.6 -0.3 496 0.3 501 0.5
Shanghai-China 613 3.8 55.4 4.2 570 4.6 580 1.8Singapore 573 8.3 40.0 3.8 542 5.4 551 3.3Hong Kong-China 561 8.5 33.7 1.3 545 2.3 555 2.1Chinese Taipei 560 12.8 37.2 1.7 523 4.5 523 -1.5Korea 554 9.1 30.9 1.1 536 0.9 538 2.6Macao-China 538 10.8 24.3 1.0 509 0.8 521 1.6Japan 536 11.1 23.7 0.4 538 1.5 547 2.6Liechtenstein 535 14.1 24.8 0.3 516 1.3 525 0.4Switzerland 531 12.4 21.4 0.6 509 1.0 515 0.6Netherlands 523 14.8 19.3 -1.6 511 -0.1 522 -0.5Estonia 521 10.5 14.6 0.9 516 2.4 541 1.5Finland 519 12.3 15.3 -2.8 524 -1.7 545 -3.0Canada 518 13.8 16.4 -1.4 523 -0.9 525 -1.5Poland 518 14.4 16.7 2.6 518 2.8 526 4.6Belgium 515 18.9 19.4 -1.6 509 0.1 505 -0.8Germany 514 17.7 17.5 1.4 508 1.8 524 1.4Viet Nam 511 14.2 13.3 m 508 m 528 mAustria 506 18.7 14.3 0.0 490 -0.2 506 -0.8Australia 504 19.7 14.8 -2.2 512 -1.4 521 -0.9Ireland 501 16.9 10.7 -0.6 523 -0.9 522 2.3Slovenia 501 20.1 13.7 -0.6 481 -2.2 514 -0.8Denmark 500 16.8 10.0 -1.8 496 0.1 498 0.4New Zealand 500 22.6 15.0 -2.5 512 -1.1 516 -2.5Czech Republic 499 21.0 12.9 -2.5 493 -0.5 508 -1.0France 495 22.4 12.9 -1.5 505 0.0 499 0.6United Kingdom 494 21.8 11.8 -0.3 499 0.7 514 -0.1Iceland 493 21.5 11.2 -2.2 483 -1.3 478 -2.0Latvia 491 19.9 8.0 0.5 489 1.9 502 2.0Luxembourg 490 24.3 11.2 -0.3 488 0.7 491 0.9Norway 489 22.3 9.4 -0.3 504 0.1 495 1.3Portugal 487 24.9 10.6 2.8 488 1.6 489 2.5Italy 485 24.7 9.9 2.7 490 0.5 494 3.0Spain 484 23.6 8.0 0.1 488 -0.3 496 1.3Russian Federation 482 24.0 7.8 1.1 475 1.1 486 1.0Slovak Republic 482 27.5 11.0 -1.4 463 -0.1 471 -2.7United States 481 25.8 8.8 0.3 498 -0.3 497 1.4Lithuania 479 26.0 8.1 -1.4 477 1.1 496 1.3Sweden 478 27.1 8.0 -3.3 483 -2.8 485 -3.1Hungary 477 28.1 9.3 -1.3 488 1.0 494 -1.6Croatia 471 29.9 7.0 0.6 485 1.2 491 -0.3Israel 466 33.5 9.4 4.2 486 3.7 470 2.8Greece 453 35.7 3.9 1.1 477 0.5 467 -1.1Serbia 449 38.9 4.6 2.2 446 7.6 445 1.5Turkey 448 42.0 5.9 3.2 475 4.1 463 6.4Romania 445 40.8 3.2 4.9 438 1.1 439 3.4Cyprus 1, 2 440 42.0 3.7 m 449 m 438 mBulgaria 439 43.8 4.1 4.2 436 0.4 446 2.0United Arab Emirates 434 46.3 3.5 m 442 m 448 mKazakhstan 432 45.2 0.9 9.0 393 0.8 425 8.1Thailand 427 49.7 2.6 1.0 441 1.1 444 3.9Chile 423 51.5 1.6 1.9 441 3.1 445 1.1Malaysia 421 51.8 1.3 8.1 398 -7.8 420 -1.4Mexico 413 54.7 0.6 3.1 424 1.1 415 0.9Montenegro 410 56.6 1.0 1.7 422 5.0 410 -0.3Uruguay 409 55.8 1.4 -1.4 411 -1.8 416 -2.1Costa Rica 407 59.9 0.6 -1.2 441 -1.0 429 -0.6Albania 394 60.7 0.8 5.6 394 4.1 397 2.2Brazil 391 67.1 0.8 4.1 410 1.2 405 2.3Argentina 388 66.5 0.3 1.2 396 -1.6 406 2.4Tunisia 388 67.7 0.8 3.1 404 3.8 398 2.2Jordan 386 68.6 0.6 0.2 399 -0.3 409 -2.1Colombia 376 73.8 0.3 1.1 403 3.0 399 1.8Qatar 376 69.6 2.0 9.2 388 12.0 384 5.4Indonesia 375 75.7 0.3 0.7 396 2.3 382 -1.9Peru 368 74.6 0.6 1.0 384 5.2 373 1.3
1. Footnote by Turkey: The information in this document with reference to “Cyprus” relates to the southern part of the Island. There is no single authority representing both Turkish and Greek Cypriot people on the Island. Turkey recognises the Turkish Republic of Northern Cyprus (TRNC). Until a lasting and equitable solution is found within the context of the United Nations, Turkey shall preserve its position concerning the “Cyprus issue”.2. Footnote by all the European Union Member States of the OECD and the European Union: The Republic of Cyprus is recognised by all members of the United Nations with the exception of Turkey. The information in this document relates to the area under the effective control of the Government of the Republic of Cyprus.The annualised change is the average annual change in PISA score points from a country’s/economy’s earliest participation in PISA to PISA 2012. It is calculated taking into account all of a country’s/economy’s participation in PISA.Note: Countries/economies in which the annualised change in performance is statistically significant are marked in bold.Countries and economies are ranked in descending order of the mean mathematics score in PISA 2012. Source: OECD, PISA 2012 Database; Tables I.2.1a, I.2.1b, I.2.3a, I.2.3b, I.4.3a, I.4.3b, I.5.3a and I.5.3b.