자동차 경량화(automotive lightweight) 최적화 솔루션ž동… · ·...
TRANSCRIPT
© 2015 Autodesk
자동차 경량화(Automotive lightweight) 최적화 솔루션
Autodesk® Moldflow & Helius Composite & PFA(AME)
황순환 부장 ([email protected]) ED&C Autodesk Moldflow Engineer

© 2015 Autodesk

© 2015 Autodesk
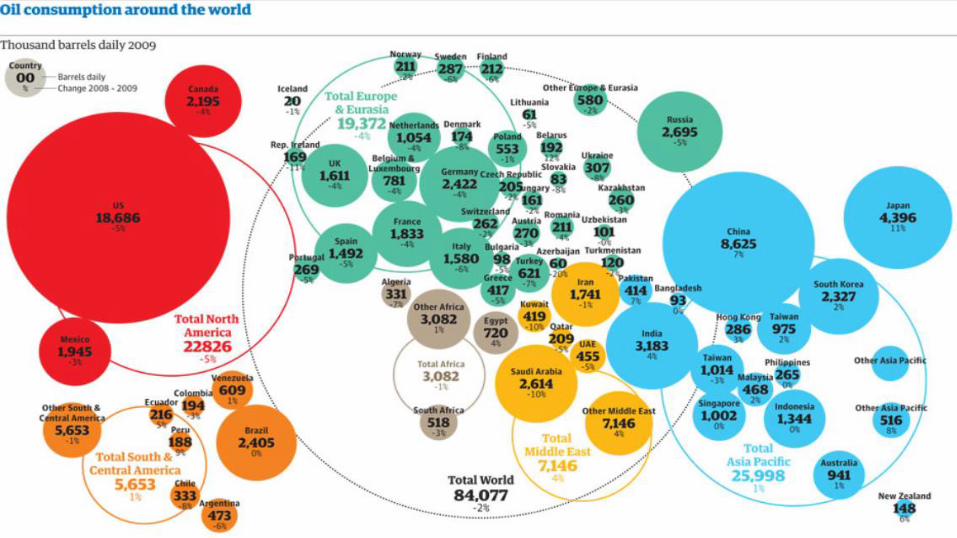
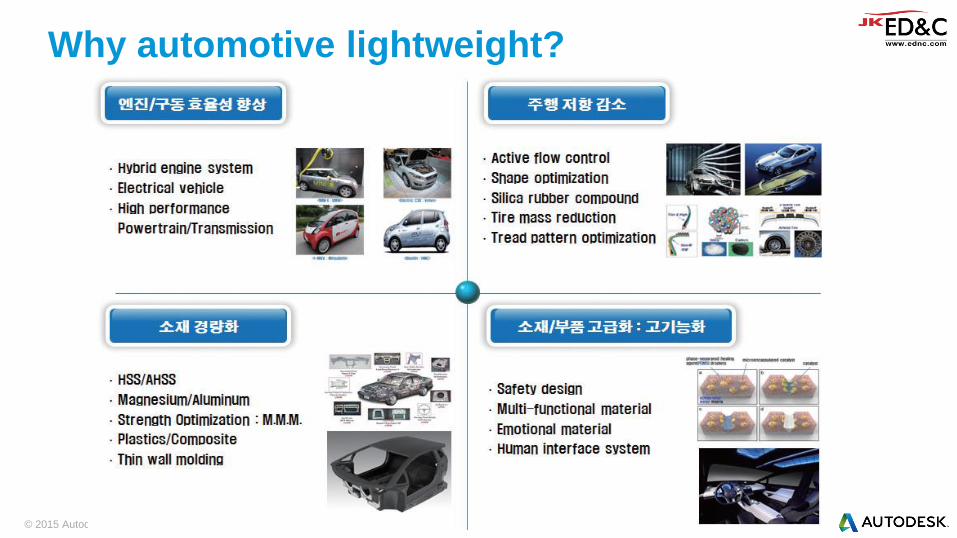
Why automotive lightweight?
주요국 연비 규제 강화 계획
© 2015 Autodesk
© 2015 Autodesk
Why automotive lightweight?
© 2015 Autodesk
Why automotive lightweight?
© 2015 Autodesk
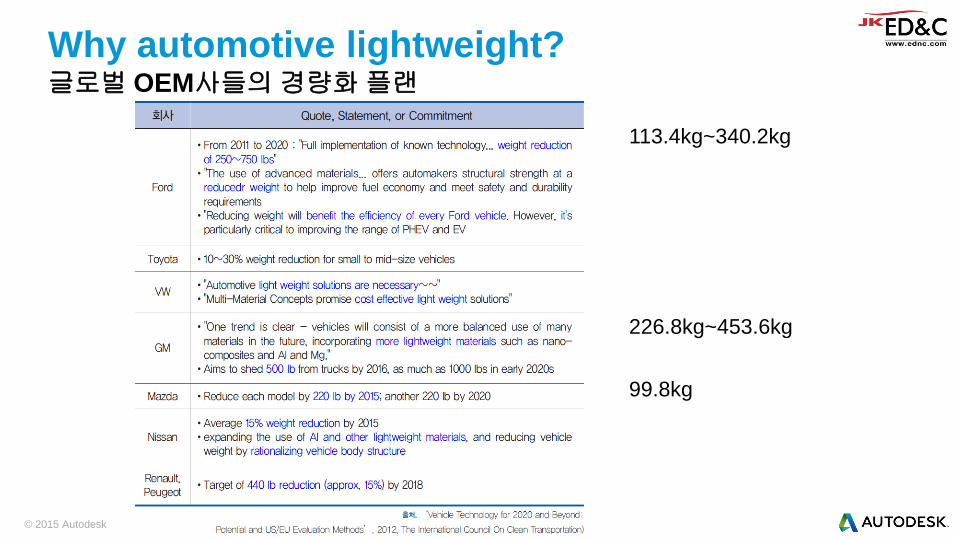
Why automotive lightweight? 글로벌 OEM사들의 경량화 플랜
113.4kg~340.2kg
226.8kg~453.6kg
99.8kg
© 2015 Autodesk
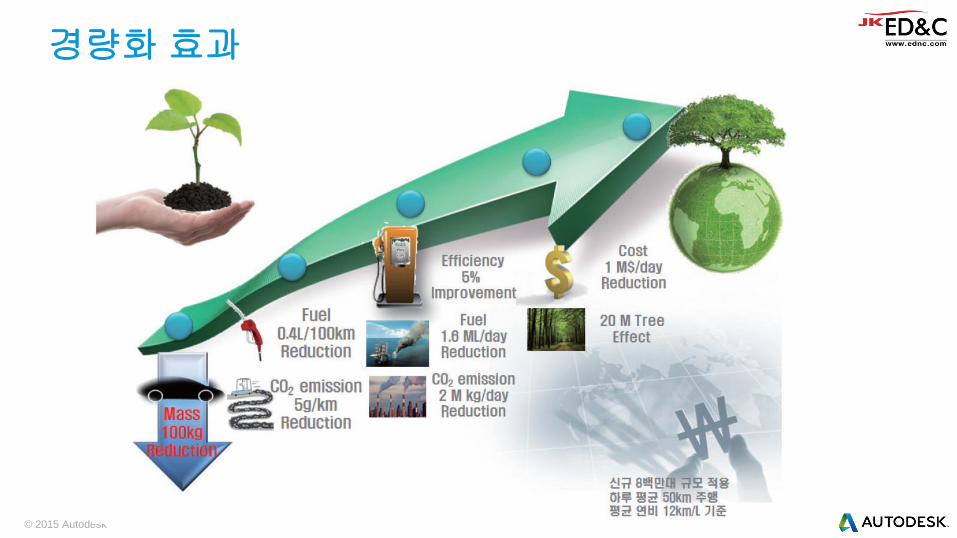
경량화 효과
© 2015 Autodesk
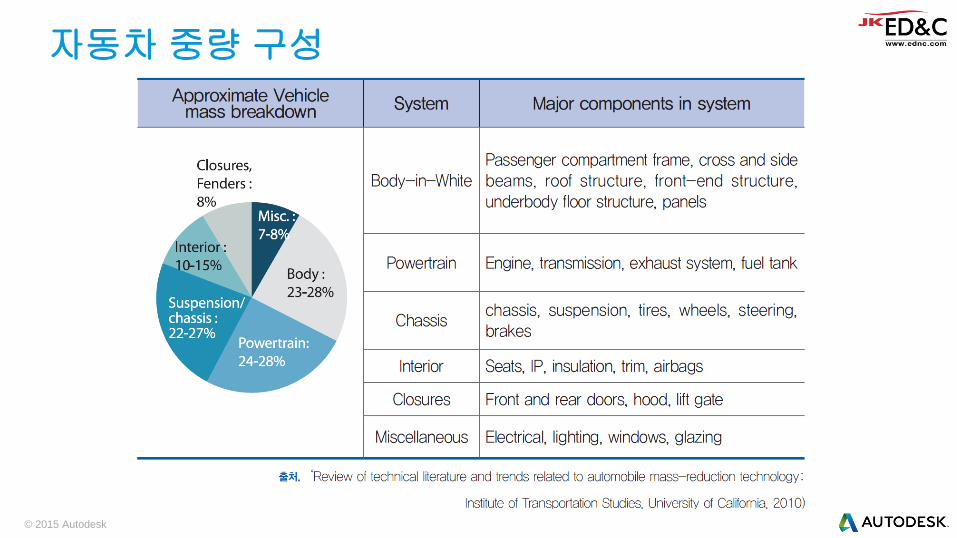
자동차 중량 구성
© 2015 Autodesk
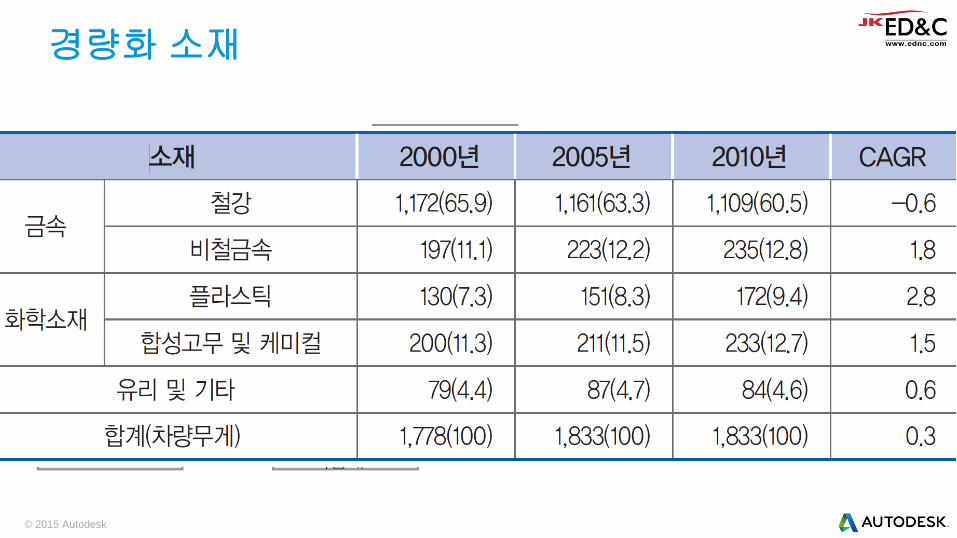
경량화 소재

© 2015 Autodesk
탄소섬유 강화 플라스틱(CFRP)

© 2015 Autodesk
AL VS Steel VS Ti VS Mg VS CFRP
© 2015 Autodesk
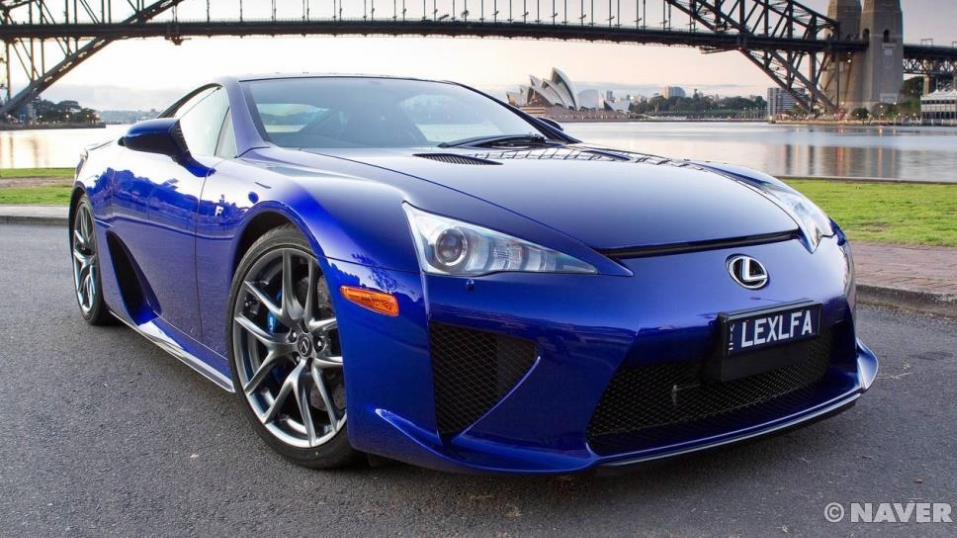
Lexus LFA의 골격과 적용 소재

© 2015 Autodesk
Lexus LFA의 골격과 적용 소재
© 2015 Autodesk
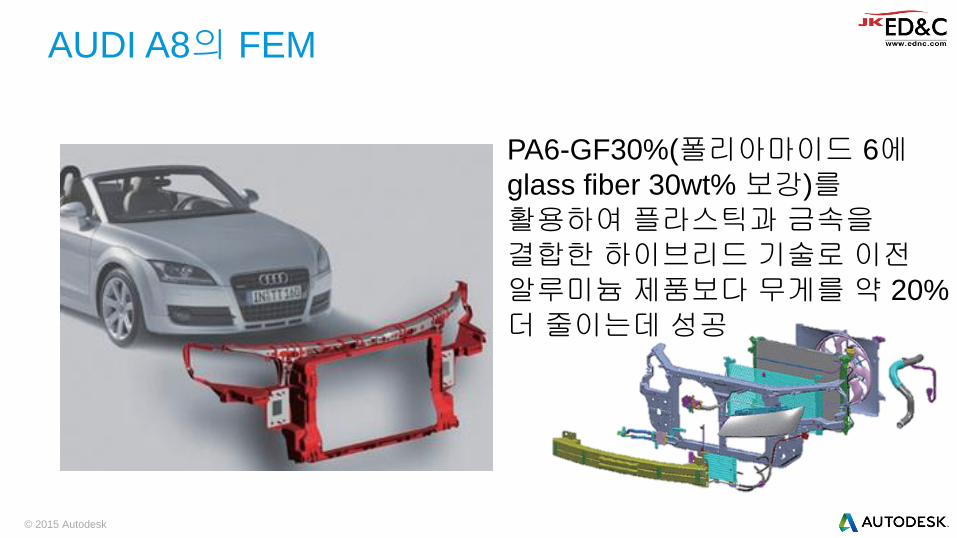
AUDI A8의 FEM
PA6-GF30%(폴리아마이드 6에
glass fiber 30wt% 보강)를
활용하여 플라스틱과 금속을
결합한 하이브리드 기술로 이전
알루미늄 제품보다 무게를 약 20%
더 줄이는데 성공
© 2015 Autodesk
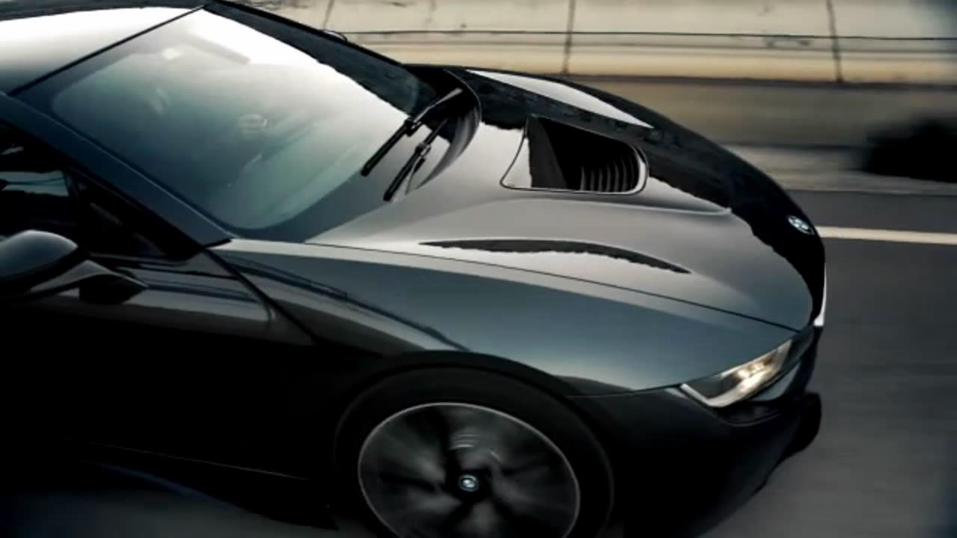
BMW i8 ?
© 2015 Autodesk
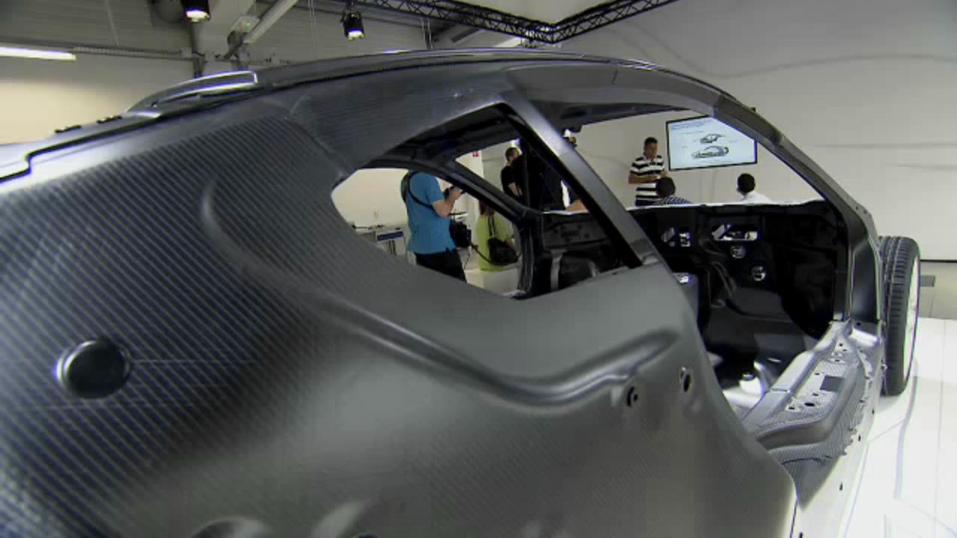
BMW i8 RTM Process

© 2015 Autodesk
BMW i8 RTM Process
© 2015 Autodesk
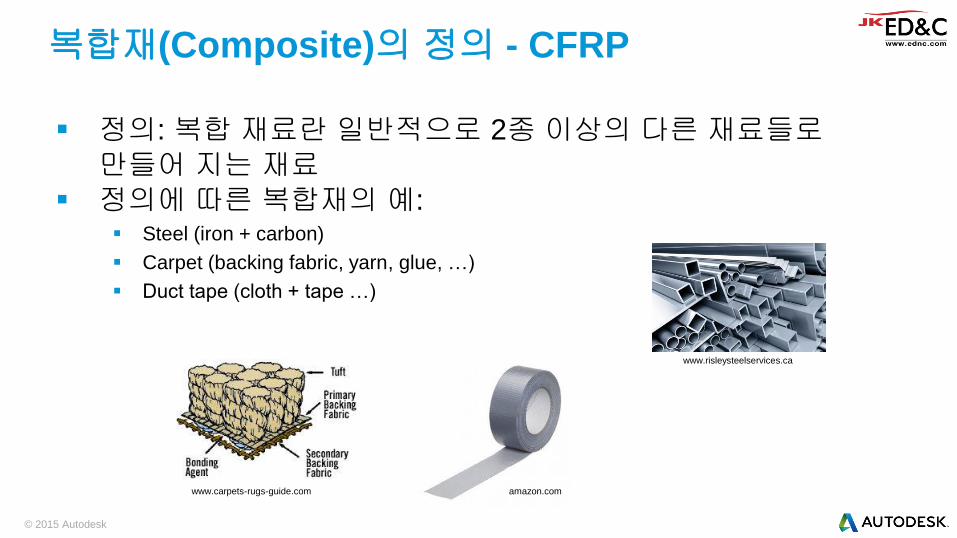
정의: 복합 재료란 일반적으로 2종 이상의 다른 재료들로
만들어 지는 재료
정의에 따른 복합재의 예: Steel (iron + carbon)
Carpet (backing fabric, yarn, glue, …)
Duct tape (cloth + tape …)
복합재(Composite)의 정의 - CFRP
www.carpets-rugs-guide.com
www.risleysteelservices.ca
amazon.com

© 2015 Autodesk
엔지니어링 복합재의 정의: 분명히 구별되는 서로 다른 재료 특성을 가진 2개 이상의 구성물로
이루어진 공학적 재료
복합재(Composite)의 정의 - CFRP
구성: Fiber
Carbon, glass, Kevlar, ceramic
강도와 강성을 제공
Matrix Thermoset, thermoplastic, metal,
ceramic
Fibers를 지지하는 기능(fibers의 좌굴을 방지)
Microstructure Unidirectional, woven, chopped
© 2015 Autodesk
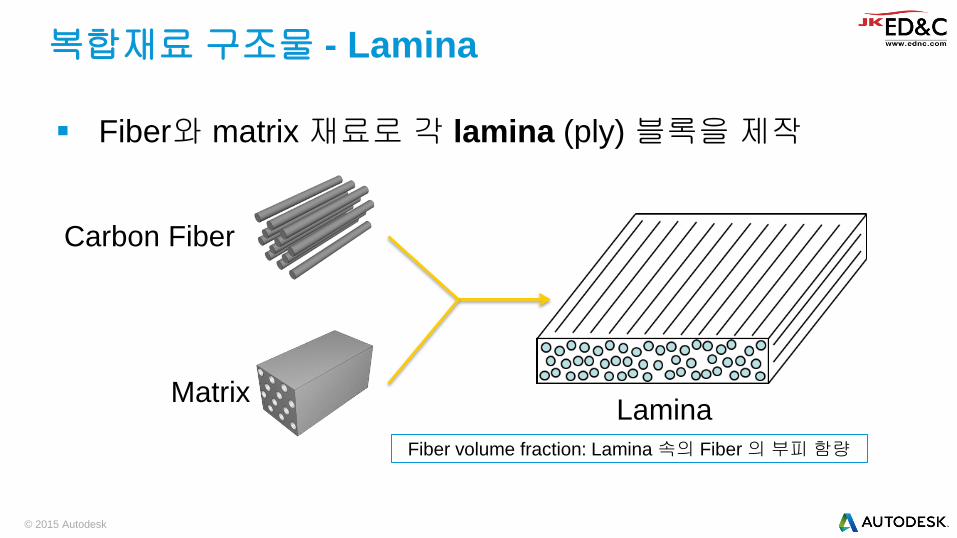
Fiber와 matrix 재료로 각 lamina (ply) 블록을 제작
복합재료 구조물 - Lamina
Carbon Fiber
Matrix Lamina
Fiber volume fraction: Lamina 속의 Fiber 의 부피 함량
© 2015 Autodesk
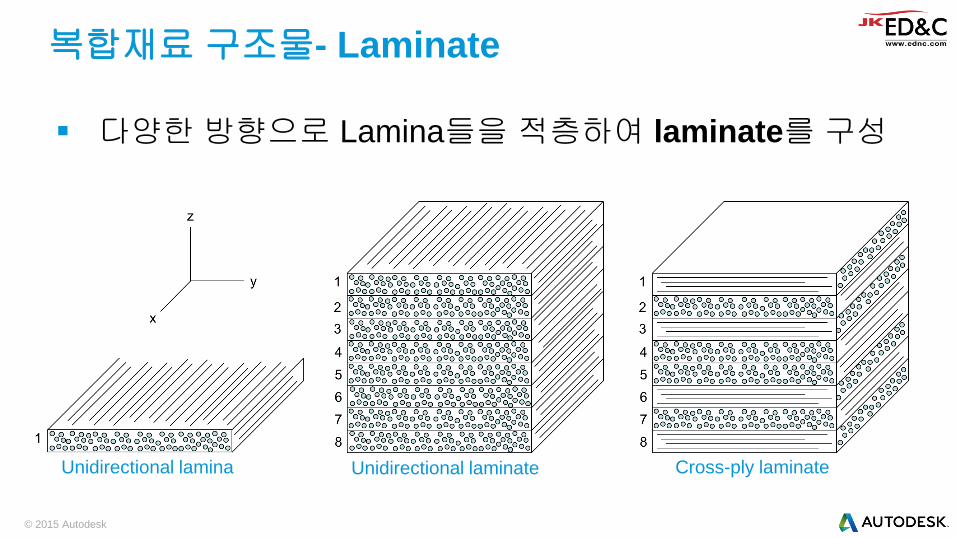
다양한 방향으로 Lamina들을 적층하여 laminate를 구성
복합재료 구조물- Laminate
Unidirectional lamina Unidirectional laminate Cross-ply laminate
© 2015 Autodesk
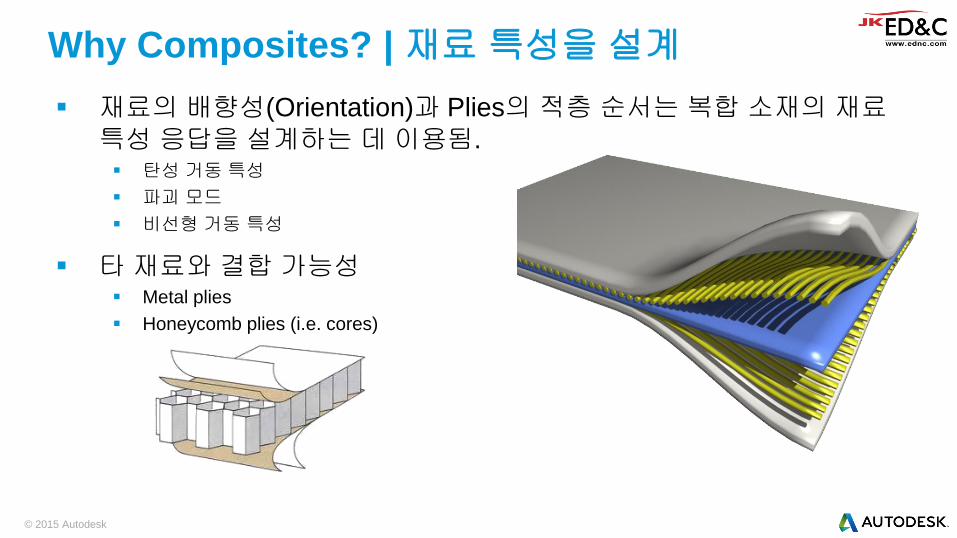
재료의 배향성(Orientation)과 Plies의 적층 순서는 복합 소재의 재료
특성 응답을 설계하는 데 이용됨. 탄성 거동 특성
파괴 모드
비선형 거동 특성
타 재료와 결합 가능성 Metal plies
Honeycomb plies (i.e. cores)
Why Composites? | 재료 특성을 설계

© 2015 Autodesk
다양한 제조 방법 비용, 적용 제품, 재료 유형에 따라 선택
일반적 방법 Hand lay-up
Filament winding
Tape placement
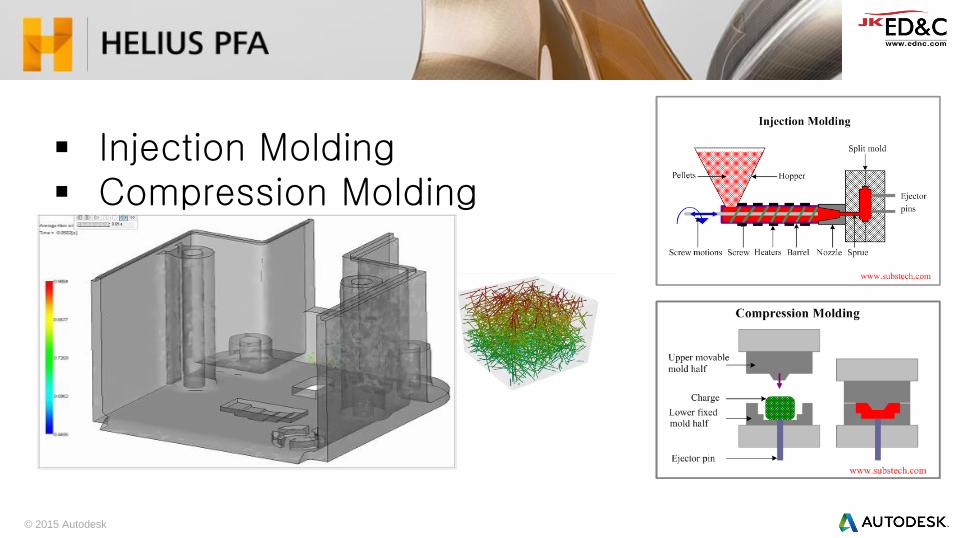
Injection Molding
Compression Molding
Spray-up
Forming
Manufacturing Methods
gdecotech.com
compositesworld.com
© 2015 Autodesk
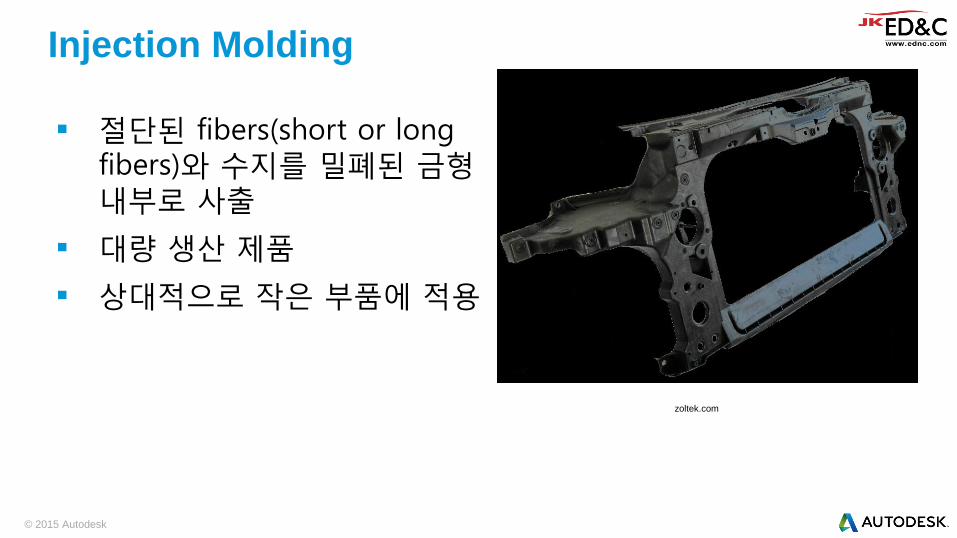
절단된 fibers(short or long fibers)와 수지를 밀폐된 금형 내부로 사출
대량 생산 제품
상대적으로 작은 부품에 적용
Injection Molding
zoltek.com
© 2015 Autodesk
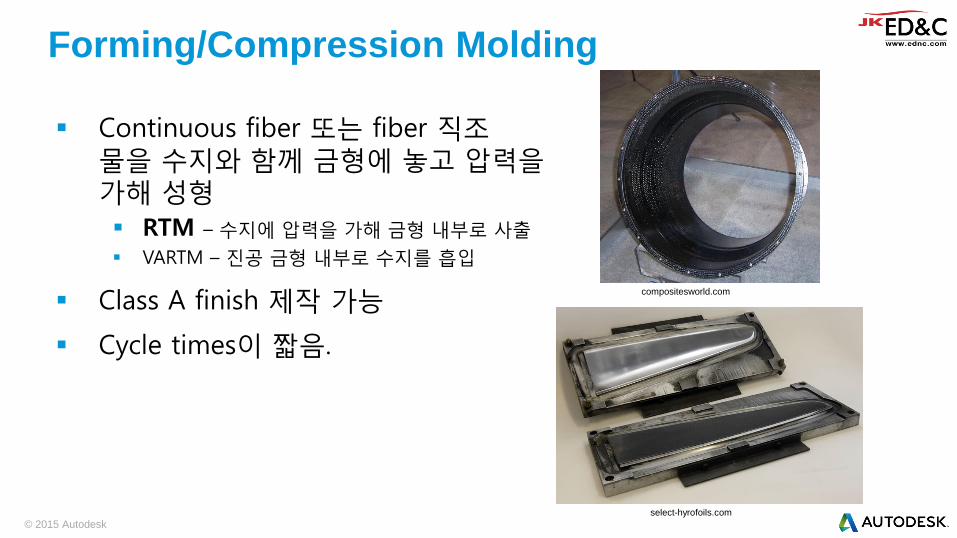
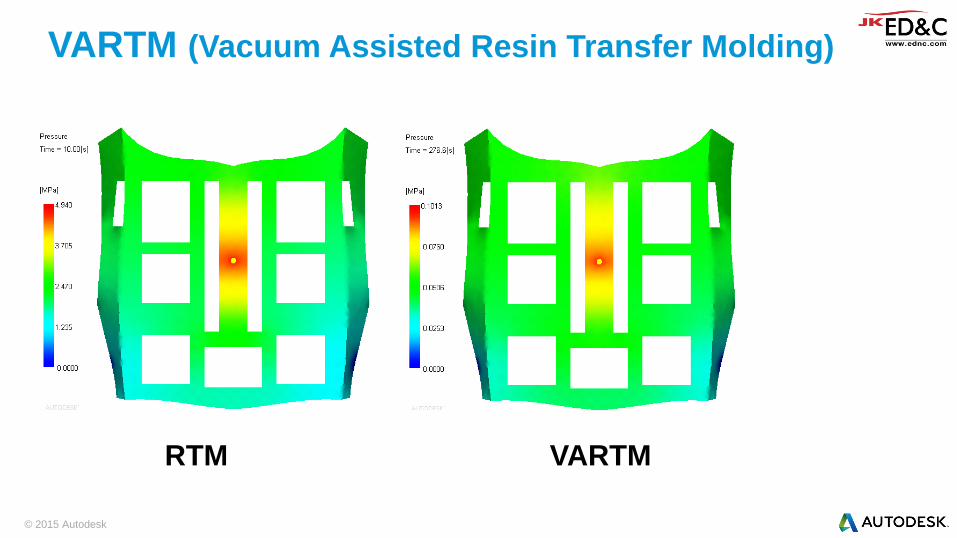
Continuous fiber 또는 fiber 직조 물을 수지와 함께 금형에 놓고 압력을 가해 성형
RTM – 수지에 압력을 가해 금형 내부로 사출
VARTM – 진공 금형 내부로 수지를 흡입
Class A finish 제작 가능
Cycle times이 짧음.
Forming/Compression Molding
compositesworld.com
select-hyrofoils.com
© 2015 Autodesk
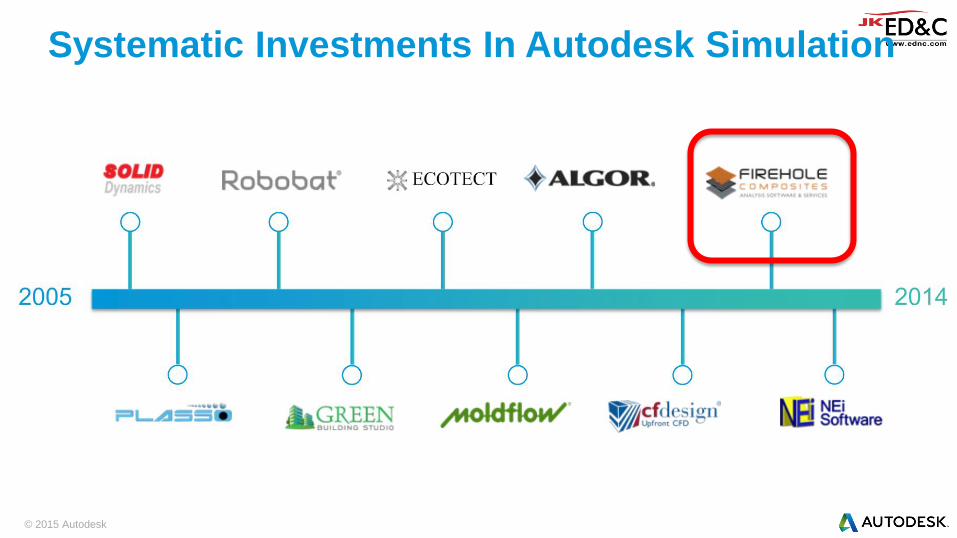
Systematic Investments In Autodesk Simulation

재료 DB / 재료 특성
분석
단순 형상의 구조
/파괴 분석
FEM PKG의 재료
특성 파일 생성
…And much more
© 2015 Autodesk
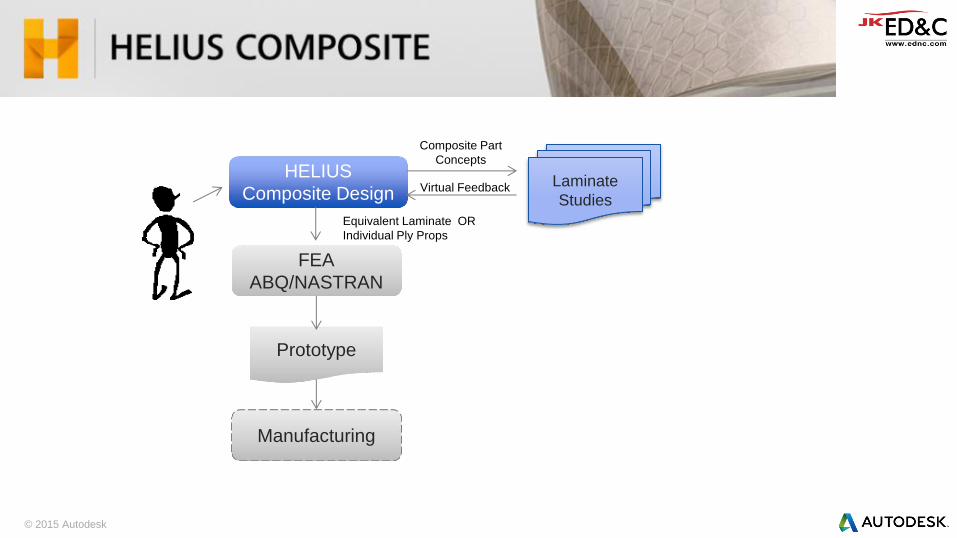
Composite Part
Concepts HELIUS
Composite Design Laminate
Studies
FEA
ABQ/NASTRAN
Prototype
Manufacturing
Equivalent Laminate OR
Individual Ply Props
Virtual Feedback
© 2013 Autodesk
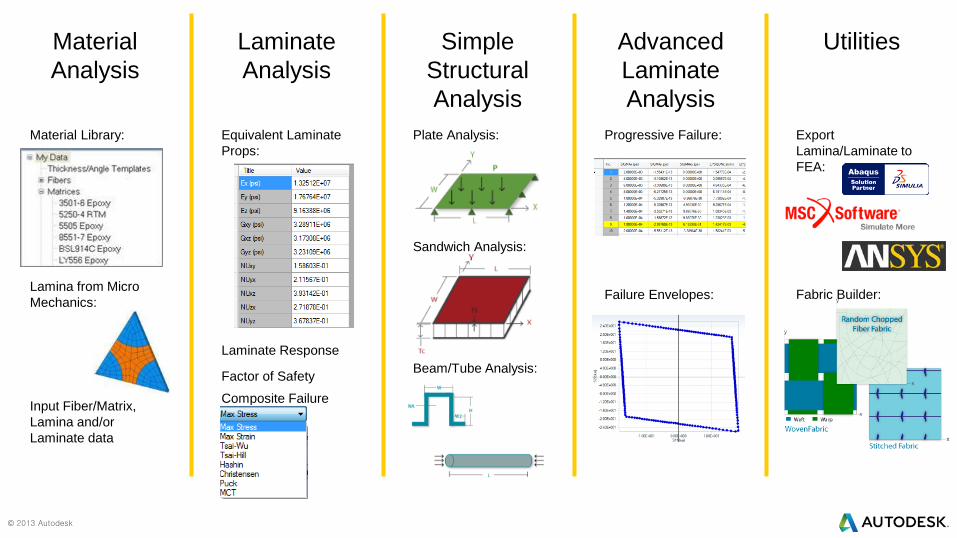
Material
Analysis
Laminate
Analysis
Simple
Structural
Analysis
Advanced
Laminate
Analysis
Utilities
Material Library:
Lamina from Micro
Mechanics:
Input Fiber/Matrix,
Lamina and/or
Laminate data
Equivalent Laminate
Props:
Plate Analysis: Export
Lamina/Laminate to
FEA:
Fabric Builder:
Sandwich Analysis:
Beam/Tube Analysis:
Progressive Failure:
Failure Envelopes:
Laminate Response
Factor of Safety
Composite Failure
Criteria:
© 2015 Autodesk
Injection Molding Compression Molding

© 2013 Autodesk
기존 CAE Packages
(Abaqus/ANSYS/Nastran)를
복합재에 특화된 Solution으로 향상
좀더 사실적인 데미지를 고려한
비선형 복합재 해석
빨리 익히고 쉽게 사용할 수 있는
구성
Composites Simulation Platform
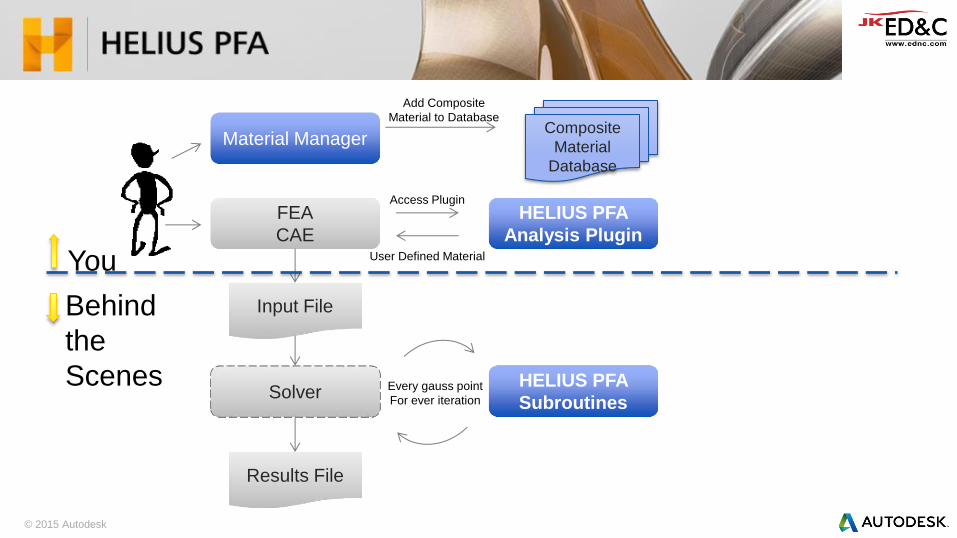
© 2015 Autodesk
Add Composite
Material to Database
Material Manager Composite
Material
Database
FEA
CAE
Input File
Solver
HELIUS PFA
Analysis Plugin
Results File
HELIUS PFA
Subroutines
Access Plugin
User Defined Material
Every gauss point
For ever iteration
You
Behind
the
Scenes
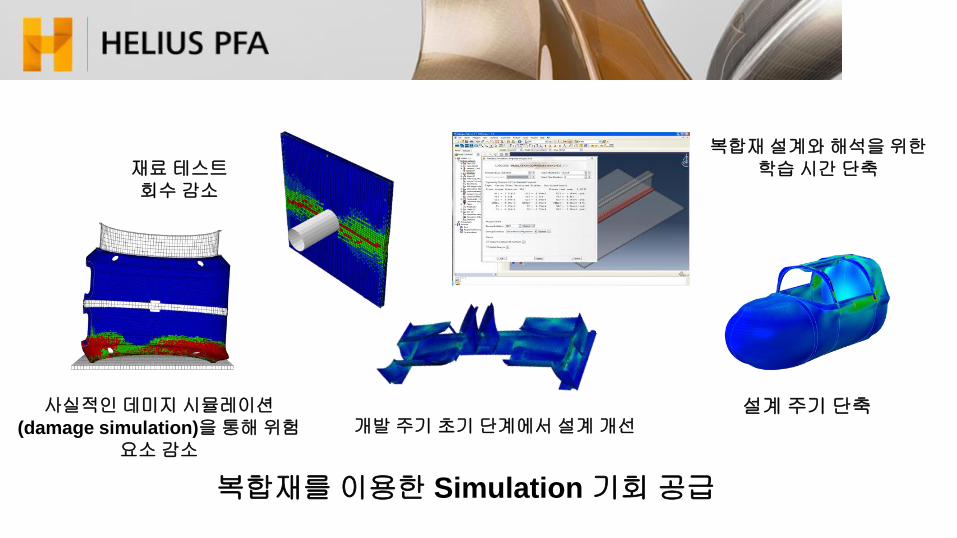
개발 주기 초기 단계에서 설계 개선
재료 테스트
회수 감소
복합재 설계와 해석을 위한
학습 시간 단축
사실적인 데미지 시뮬레이션
(damage simulation)을 통해 위험
요소 감소
설계 주기 단축
복합재를 이용한 Simulation 기회 공급
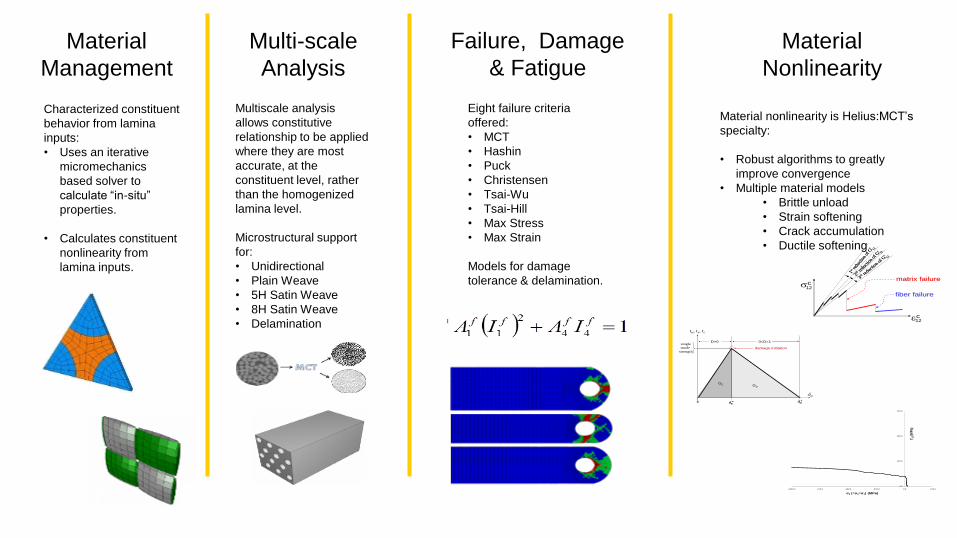
Material
Management
Eight failure criteria
offered:
• MCT
• Hashin
• Puck
• Christensen
• Tsai-Wu
• Tsai-Hill
• Max Stress
• Max Strain
Models for damage
tolerance & delamination.
Characterized constituent
behavior from lamina
inputs:
• Uses an iterative
micromechanics
based solver to
calculate “in-situ”
properties.
• Calculates constituent
nonlinearity from
lamina inputs.
Failure, Damage
& Fatigue
Multi-scale
Analysis
Multiscale analysis
allows constitutive
relationship to be applied
where they are most
accurate, at the
constituent level, rather
than the homogenized
lamina level.
Microstructural support
for:
• Unidirectional
• Plain Weave
• 5H Satin Weave
• 8H Satin Weave
• Delamination
Material
Nonlinearity
Material nonlinearity is Helius:MCT’s
specialty:
• Robust algorithms to greatly
improve convergence
• Multiple material models
• Brittle unload
• Strain softening
• Crack accumulation
• Ductile softening
c
cmatrix failurematrix failure
fiber failurefiber failure
12
12
1stre
duct
ion
of G
12
c
1stre
duct
ion
of G
12
c
2rd
redu
ctio
n of
G12
c
2rd
redu
ctio
n of
G12
c
3rd
reducti
on of G
12c
3rd
reducti
on of G
12c
GE GD
tn, ts, tt
m
single
mode
strength
m
om
o mfmf
0
damage initiation
0D1D=0
0.0
250.0
500.0
750.0
-1000.0 -750.0 -500.0 -250.0 0.0 250.0
τ 12
(MP
a)
σ2 (=σ3=σ1) (MPa)
© 2015 Autodesk
Autodesk® Helius PFA (Composite Analysis)
Advanced Material Exchange
© 2015 Autodesk
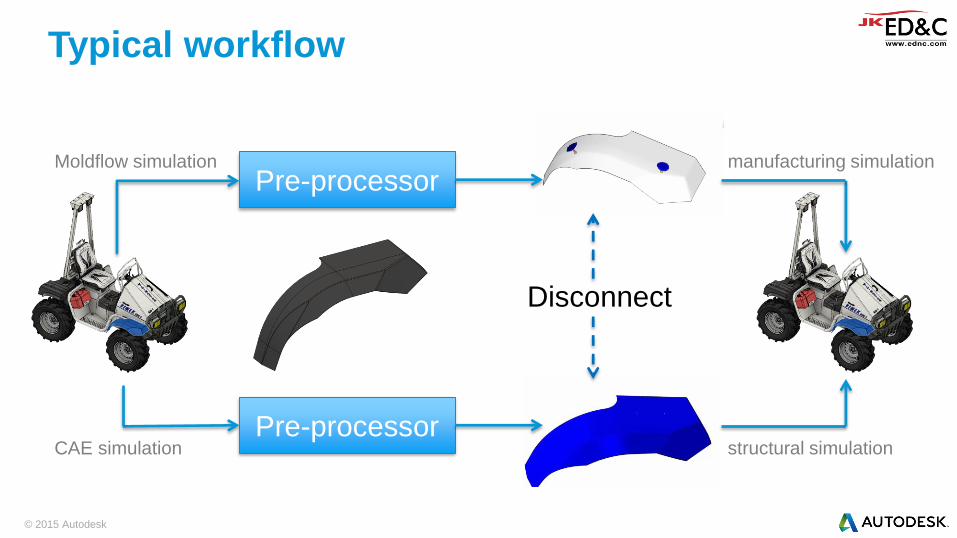
Typical workflow
Pre-processor
Pre-processor
Moldflow simulation
CAE simulation
Disconnect
manufacturing simulation
structural simulation
© 2015 Autodesk
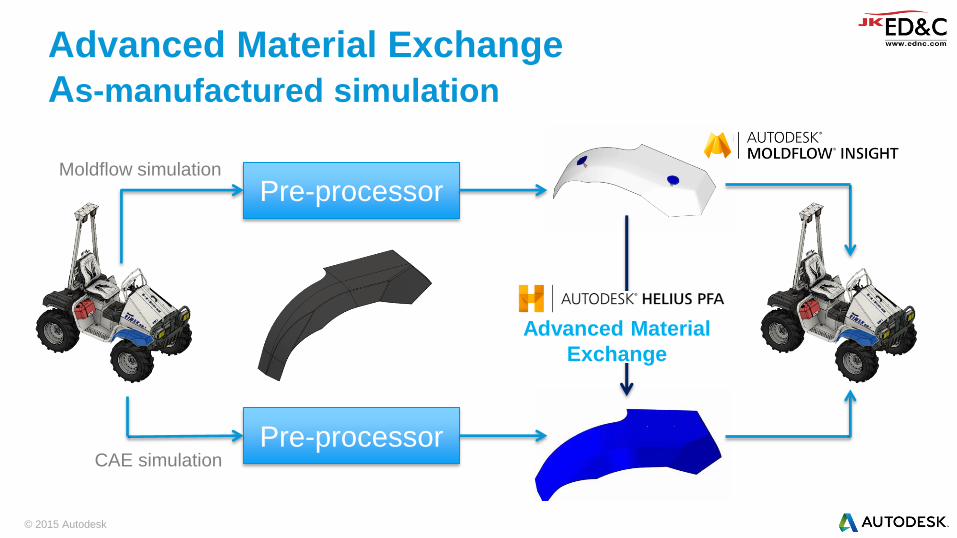
Advanced Material Exchange
As-manufactured simulation
Pre-processor
Pre-processor
Moldflow simulation
CAE simulation
Advanced Material
Exchange
© 2015 Autodesk
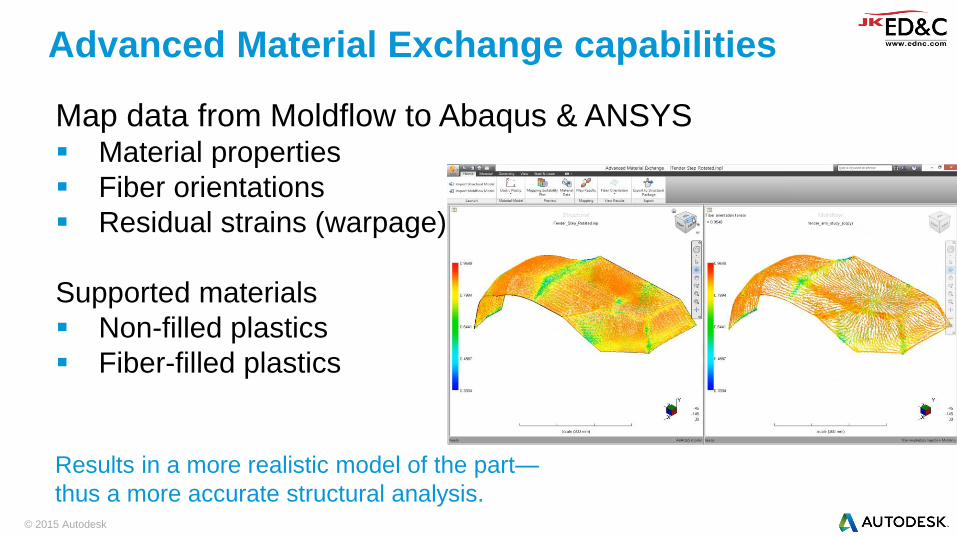
Advanced Material Exchange capabilities
Map data from Moldflow to Abaqus & ANSYS Material properties
Fiber orientations
Residual strains (warpage)
Supported materials
Non-filled plastics
Fiber-filled plastics
Results in a more realistic model of the part—
thus a more accurate structural analysis.
© 2015 Autodesk
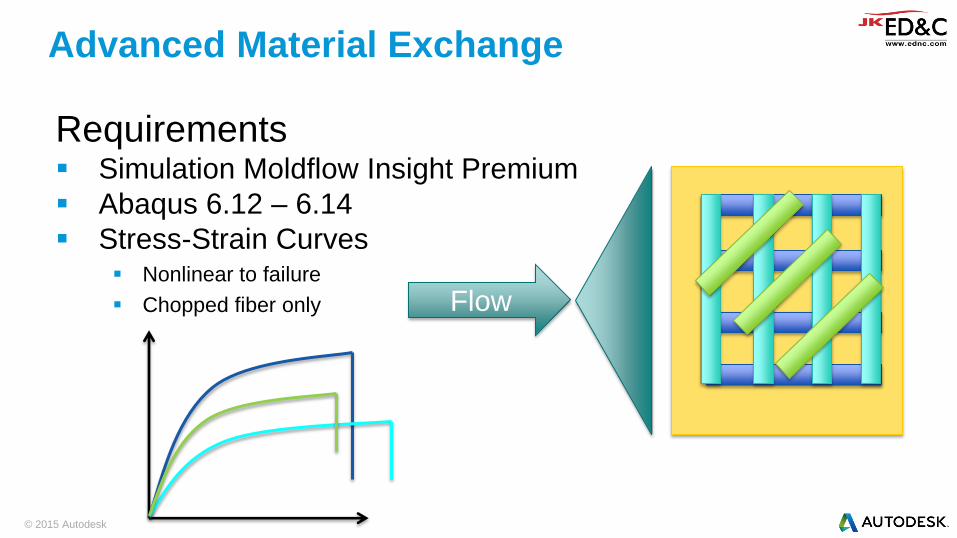
Advanced Material Exchange
Requirements Simulation Moldflow Insight Premium
Abaqus 6.12 – 6.14
Stress-Strain Curves Nonlinear to failure
Chopped fiber only Flow
© 2015 Autodesk
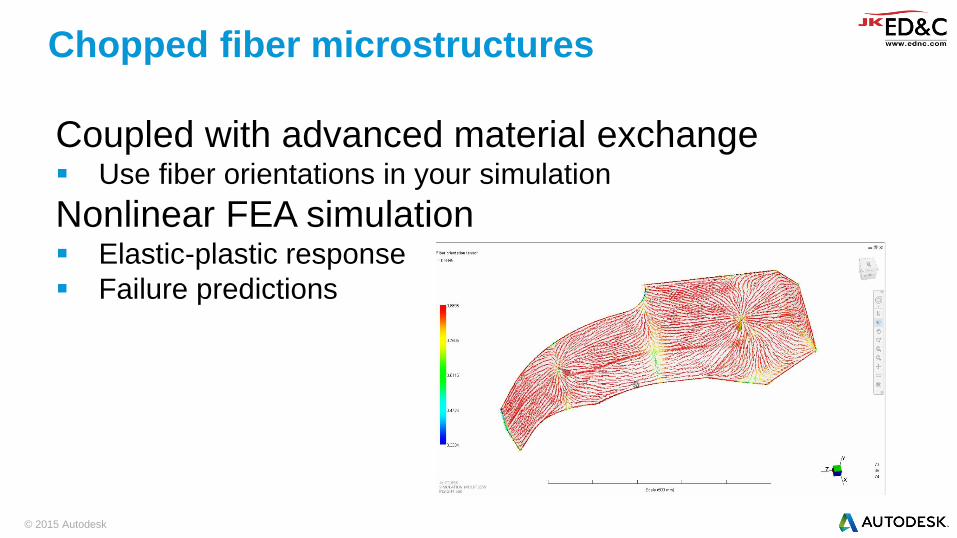
Chopped fiber microstructures
Coupled with advanced material exchange Use fiber orientations in your simulation
Nonlinear FEA simulation Elastic-plastic response
Failure predictions
© 2015 Autodesk
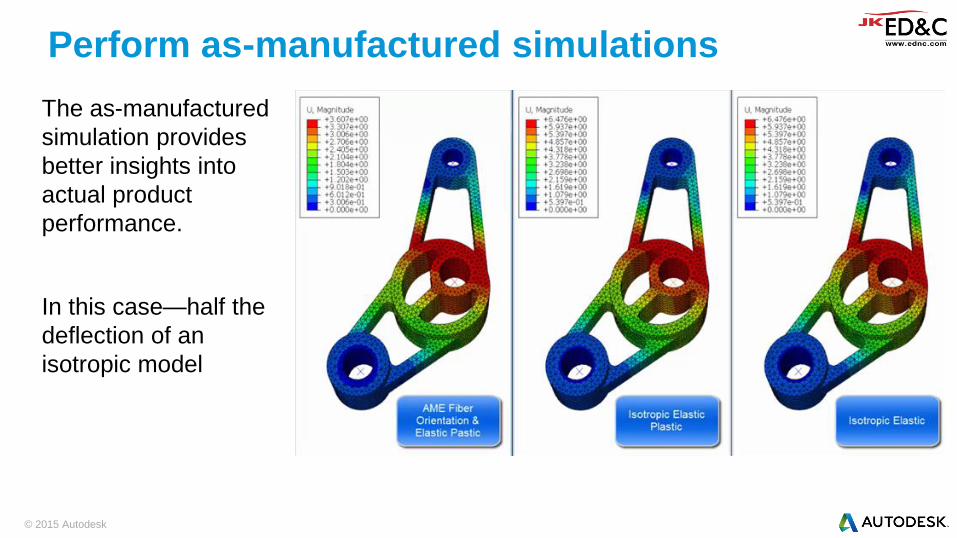
Perform as-manufactured simulations
The as-manufactured
simulation provides
better insights into
actual product
performance.
In this case—half the
deflection of an
isotropic model
Example – Effect of change in gate location
Two models that are exactly the same • Geometry
• Materials
• Loads
• Difference is the gate location. • One on top of the part, one at the front.
• Examine the difference in strain due to the difference in fiber orientations.
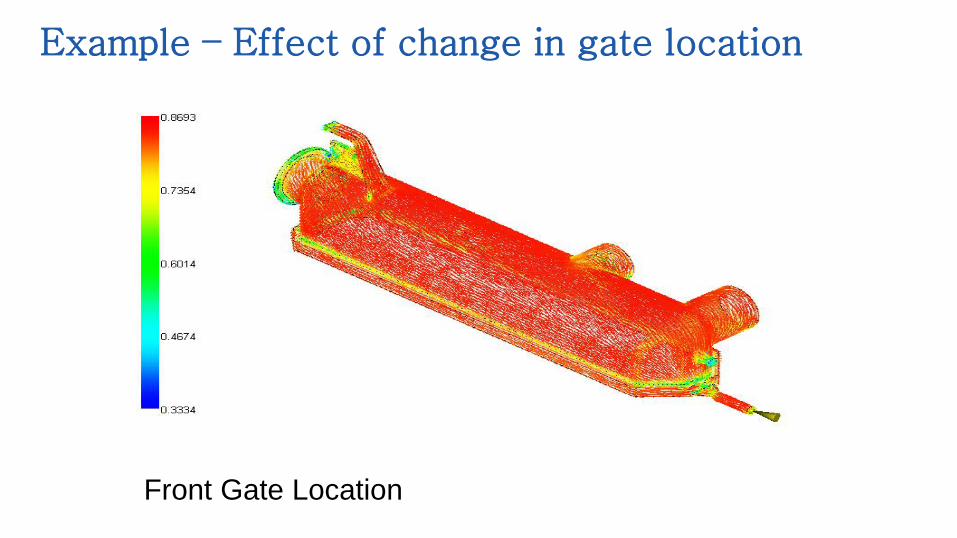
Example – Effect of change in gate location
Front Gate Location
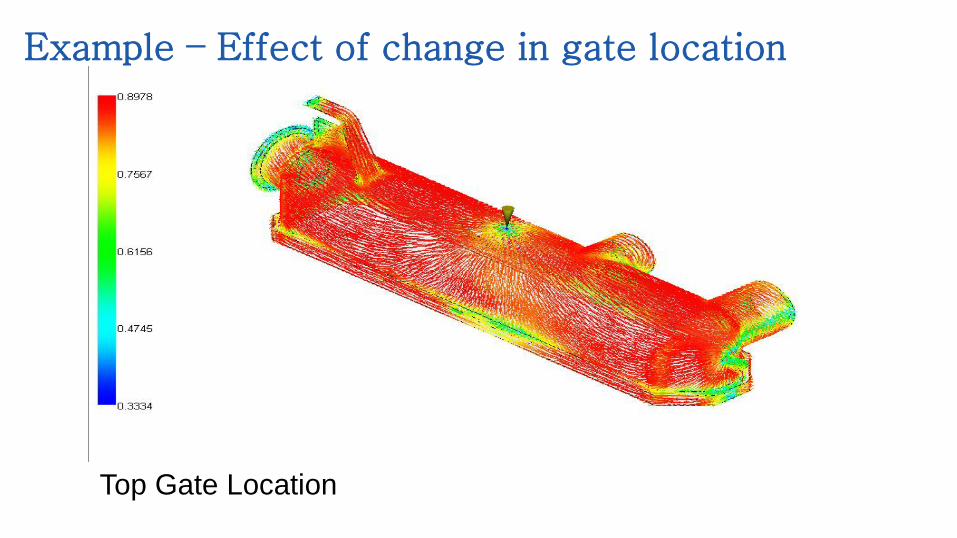
Example – Effect of change in gate location
Top Gate Location

Effect of changing gate location
Front Gate Location Top Gate Location
Comparison to Linear Analysis
Linear Equivalent Analysis Ignores the effects of fiber orientation – using an
“equivalent” isotropic material representation.
Ignores nonlinear material behavior.
AME Model Accounts for the effects of fiber orientation
Accounts for nonlinear material behavior.
Models shown at the same pressure load
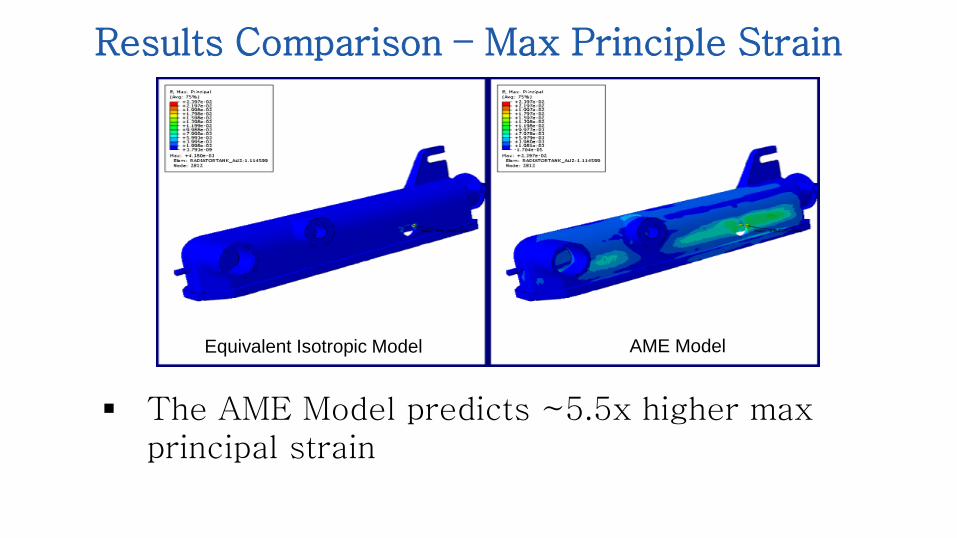
Results Comparison – Max Principle Strain
The AME Model predicts ~5.5x higher max principal strain
Equivalent Isotropic Model AME Model
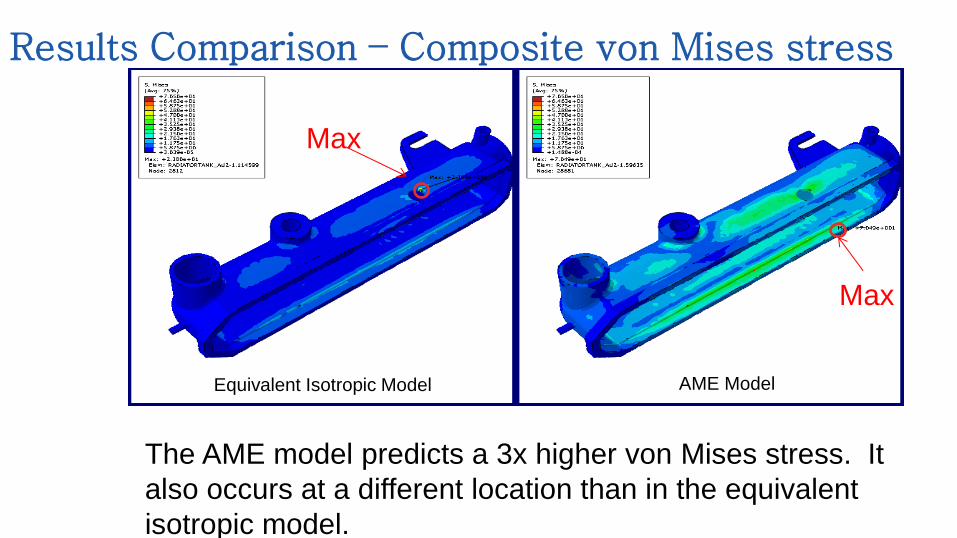
Results Comparison – Composite von Mises stress
Equivalent Isotropic Model AME Model
Max
Max
The AME model predicts a 3x higher von Mises stress. It
also occurs at a different location than in the equivalent
isotropic model.
© 2015 Autodesk
Autodesk® Moldflow RTM Process
(CFRP Molding Process)
© 2015 Autodesk
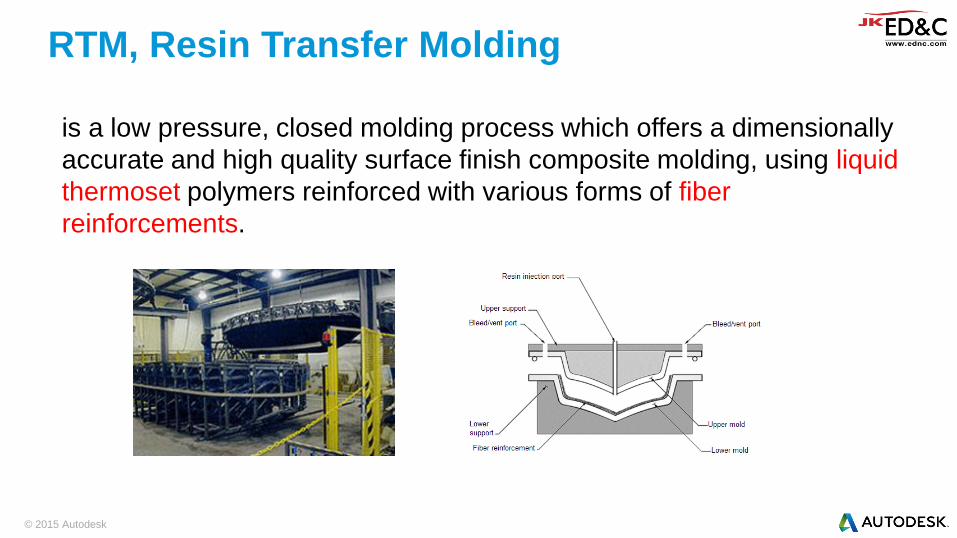
is a low pressure, closed molding process which offers a dimensionally
accurate and high quality surface finish composite molding, using liquid
thermoset polymers reinforced with various forms of fiber
reinforcements.
RTM, Resin Transfer Molding
© 2015 Autodesk
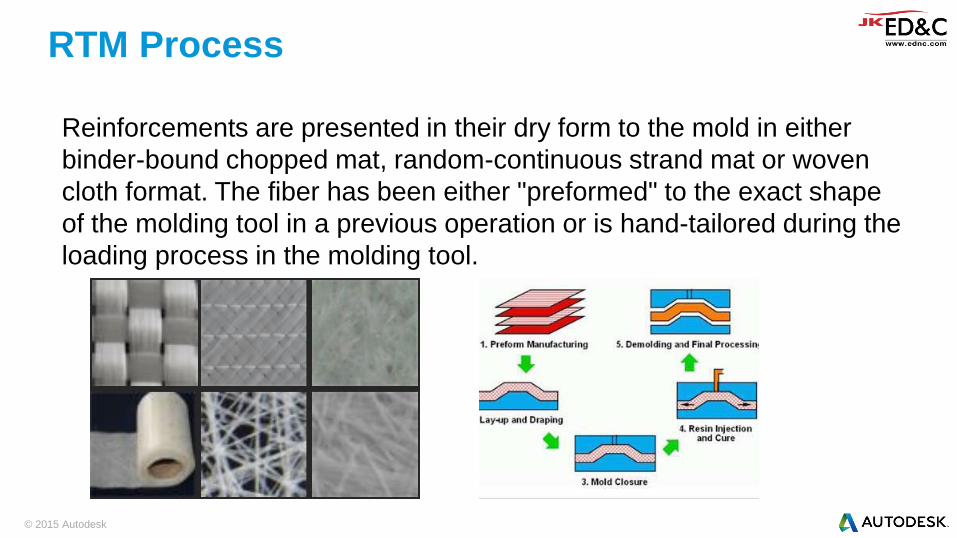
Reinforcements are presented in their dry form to the mold in either
binder-bound chopped mat, random-continuous strand mat or woven
cloth format. The fiber has been either "preformed" to the exact shape
of the molding tool in a previous operation or is hand-tailored during the
loading process in the molding tool.
RTM Process
© 2015 Autodesk
RTM Process
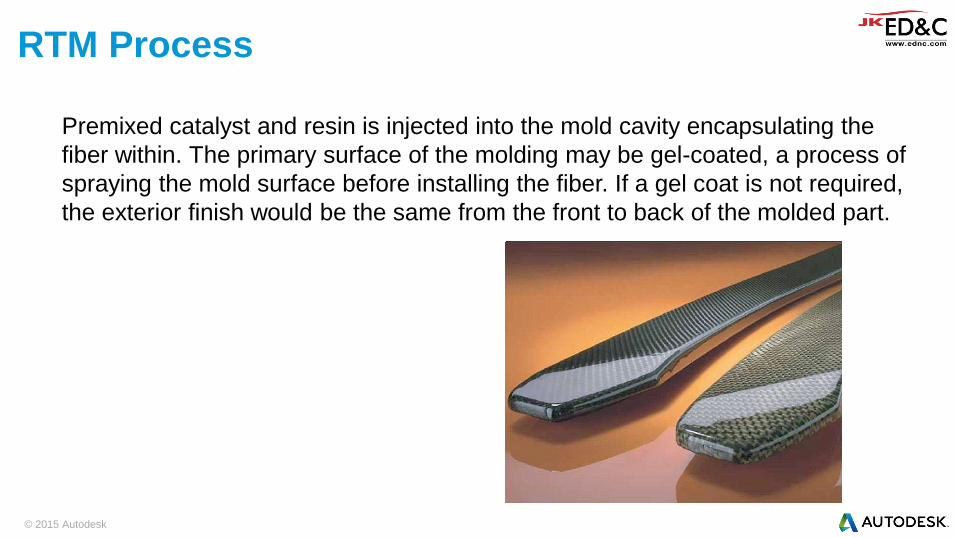
Premixed catalyst and resin is injected into the mold cavity encapsulating the
fiber within. The primary surface of the molding may be gel-coated, a process of
spraying the mold surface before installing the fiber. If a gel coat is not required,
the exterior finish would be the same from the front to back of the molded part.

© 2015 Autodesk
RTM Applications
Parts for high strength, high modulus.
Parts for dimensional stability and good surface.
© 2015 Autodesk
Preform Properties
The type of flow is characterized by preform(carbon nanotube mat)
properties. Flow resistance also depends on resin property and flow
rate(molding conditions)
1. Porosity (다공율 or 기공율) is defined as the ratio of the void volume to
the cavity volume, before the cavity is filled with resin For different type of
mat layers
2. Permeability (투과성 or 삼투성) is part of the proportionality constant in
Darcy's law which relates discharge (flow rate) and resin properties (e.g.
Viscosity), to a pressure gradient applied to the porous media.

© 2015 Autodesk
Preform Properties
Porosity(다공률), permeability(투과율) and reference thickness(기준두께)
© 2015 Autodesk
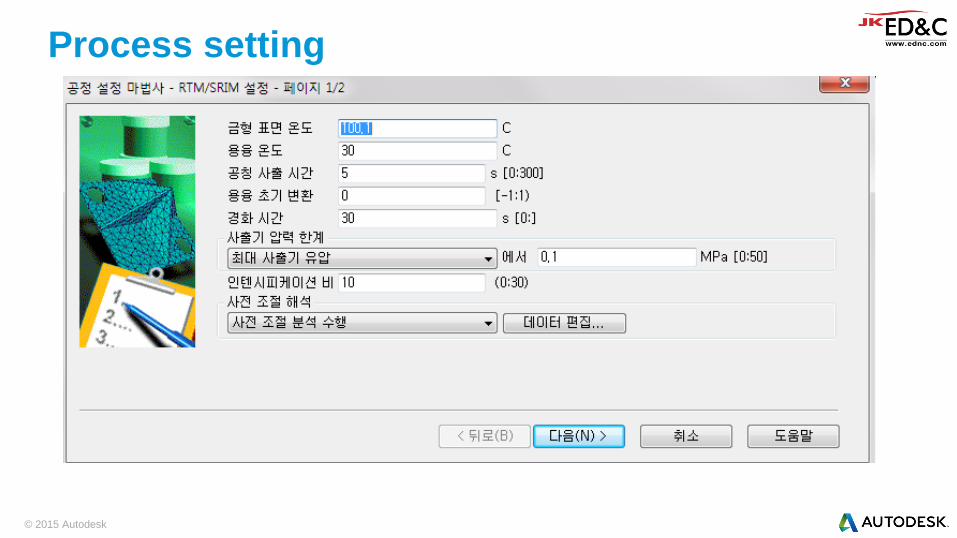
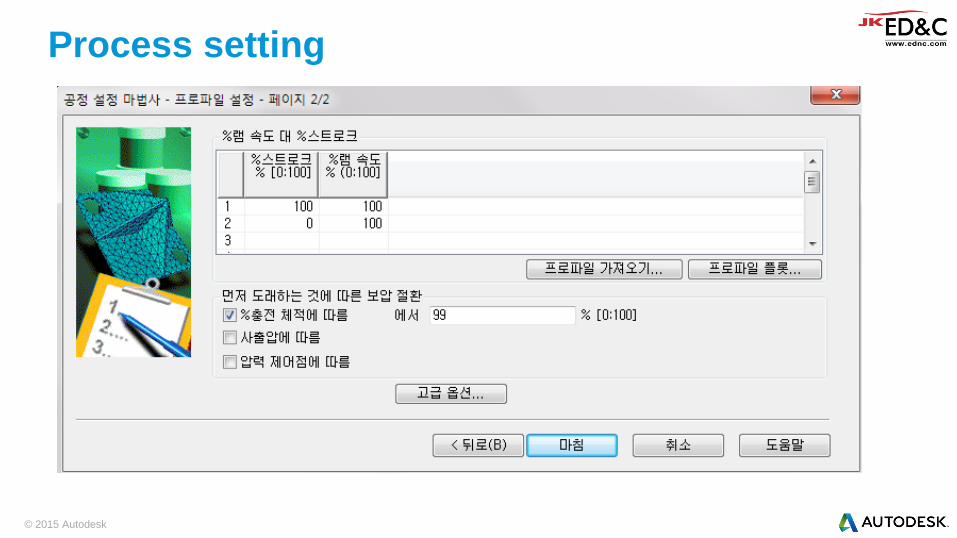
Process setting
© 2015 Autodesk
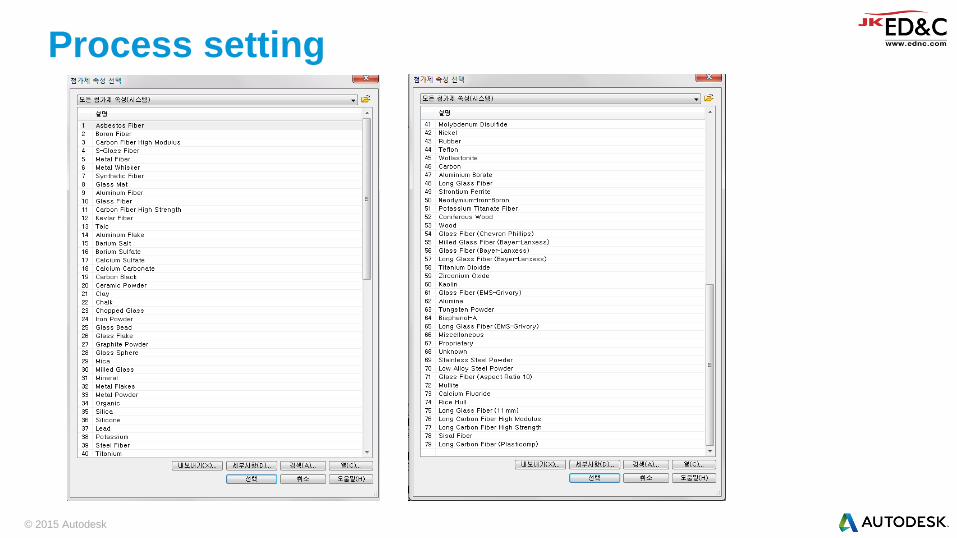
Process setting

© 2015 Autodesk
Process setting
© 2015 Autodesk
Process setting
© 2015 Autodesk
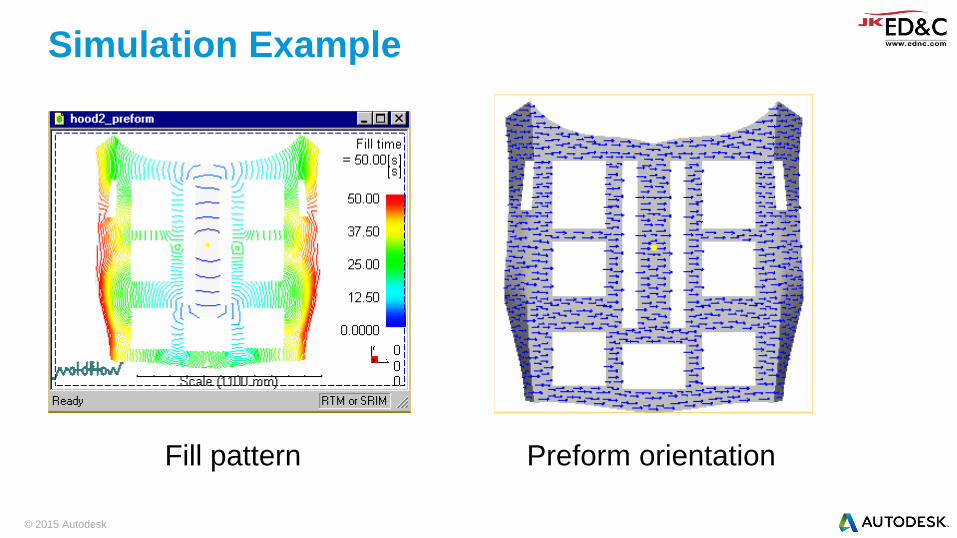
Simulation Example
Fill pattern
Preform orientation
© 2015 Autodesk
VARTM (Vacuum Assisted Resin Transfer Molding)
RTM
VARTM

© 2015 Autodesk
Autodesk® Moldflow Mucell Process
(Microcellular Molding Process)
Join us on Twitter: #AU2014
Simulation of the MuCell® Microcellular Foaming
Process in AMI 2016
Levi Kishbaugh Sejin Han Tim Lankisch
VP Engineering – Trexel, Inc. Autodesk Director of Engineering – CAE Services
Corporation
© 2015 Autodesk
이 시간에는 미세 발포 성형 공정의 기본과
일반 사출과의 주요 차이점을 설명하고,
Moldflow Insight 의 Mucell 해석을 통해 얻을
수 있는 이점에 대하여 설명하겠습니다.
Class summary
© 2015 Autodesk
이시간 후에는 아래 사항을 이해할 수 있습니다 :
MuCell® 미세 발포 사출 성형 공정의 기본적인 역학
미세 발포 성형과 일반 사출 성형 사이의 주요 차이점
기포 핵 생성 및 셀 성장과 관련된 시뮬레이션 문제
미세 발포 사출 성형 시뮬레이션을 위한 개선된 Moldflow
Key learning objectives
© 2015 Autodesk
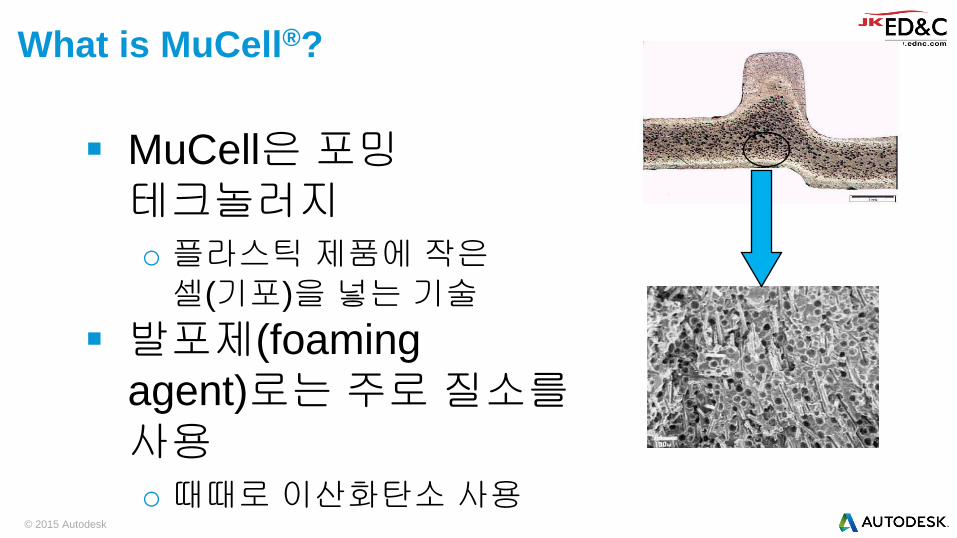
MuCell은 포밍
테크놀러지
o 플라스틱 제품에 작은
셀(기포)을 넣는 기술
발포제(foaming
agent)로는 주로 질소를
사용 o 때때로 이산화탄소 사용
What is MuCell® ?

© 2015 Autodesk
Single Phase Solution
만들기
o 초 임계 상태의 물리
발포제의 소개
o 적합한 조건이 용융 상태의
폴리머로 초 임계 유체
(SCF)를 용해 (시간 / 온도 /
압력 / SCF 수준)
Gas 용해 (Single Phase Solution 만들기)

© 2015 Autodesk
일정 온도와 압력에서 액체와 기체의 양쪽
성질을 모두 갖는 유체
o 액체에 용해(점도 낮아짐)
o Gas의 속성 확산(밀도 높아짐)
Super Critical Fluid (초임계 유체 ; SCF)
© 2015 Autodesk
© 2015 Autodesk
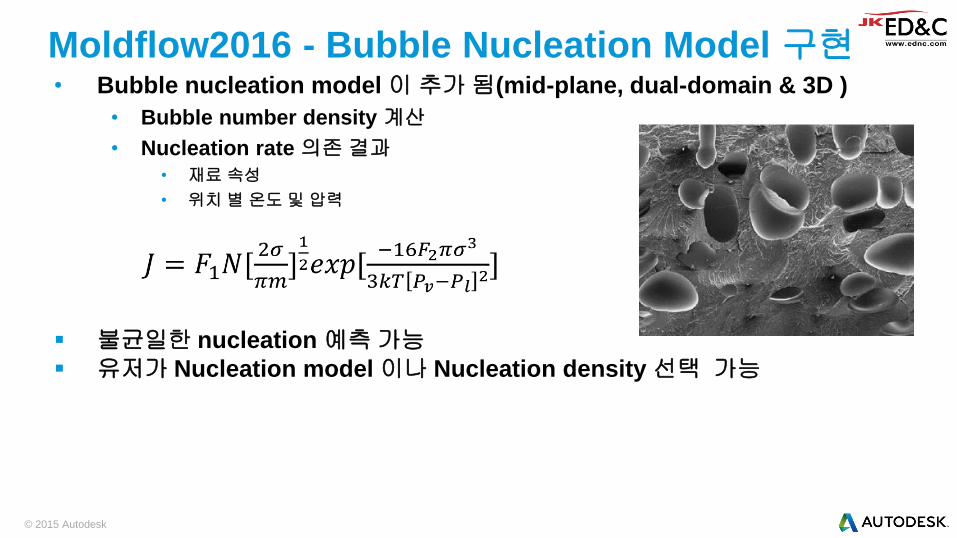
• Bubble nucleation model 이 추가 됨(mid-plane, dual-domain & 3D )
• Bubble number density 계산
• Nucleation rate 의존 결과
• 재료 속성
• 위치 별 온도 및 압력
불균일한 nucleation 예측 가능
유저가 Nucleation model 이나 Nucleation density 선택 가능
Moldflow2016 - Bubble Nucleation Model 구현
© 2015 Autodesk
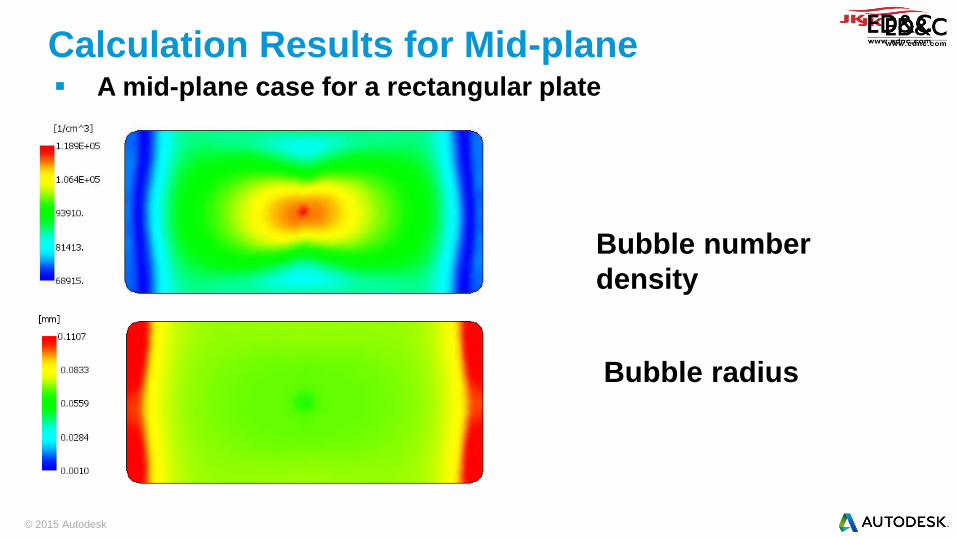
A mid-plane case for a rectangular plate
Calculation Results for Mid-plane
Bubble number
density
Bubble radius

© 2015 Autodesk
• “Initial bubble radius”: 제거함
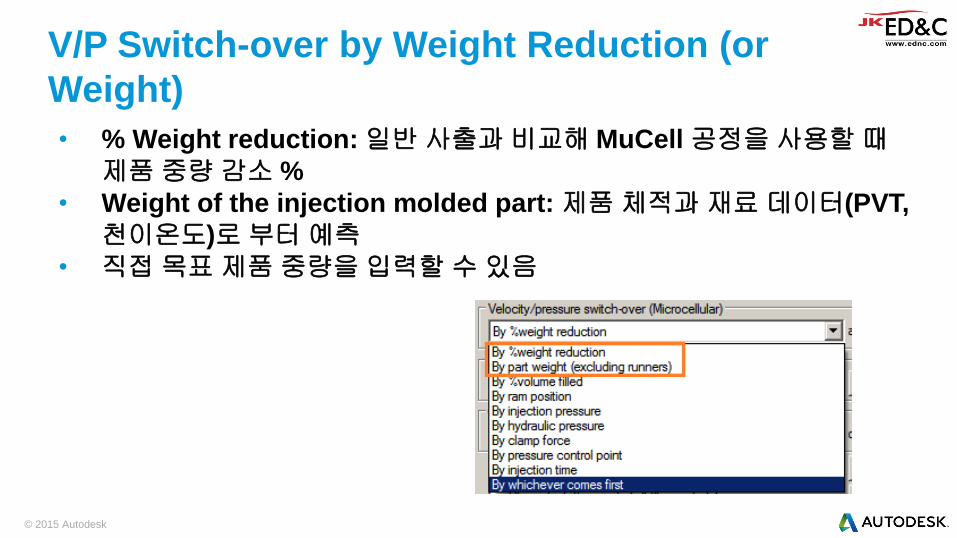
• MuCell 공정을 위한 V/P switch-over options 추가 • By %weight reduction
• By part weight
Input Data Change for Microcellular Injection
Molding
© 2015 Autodesk
• % Weight reduction: 일반 사출과 비교해 MuCell 공정을 사용할 때
제품 중량 감소 %
• Weight of the injection molded part: 제품 체적과 재료 데이터(PVT,
천이온도)로 부터 예측
• 직접 목표 제품 중량을 입력할 수 있음
V/P Switch-over by Weight Reduction (or
Weight)

© 2015 Autodesk
• MuCell 공정에서는 보압을 주지 않는 것이 일반적이고, 경우에 딸
낮은 보압을 적용
• Default로 보압 시간은 0
• 보압 시간을 적용하면 중량 감소가 줄게 됨
Packing Pressure
© 2015 Autodesk
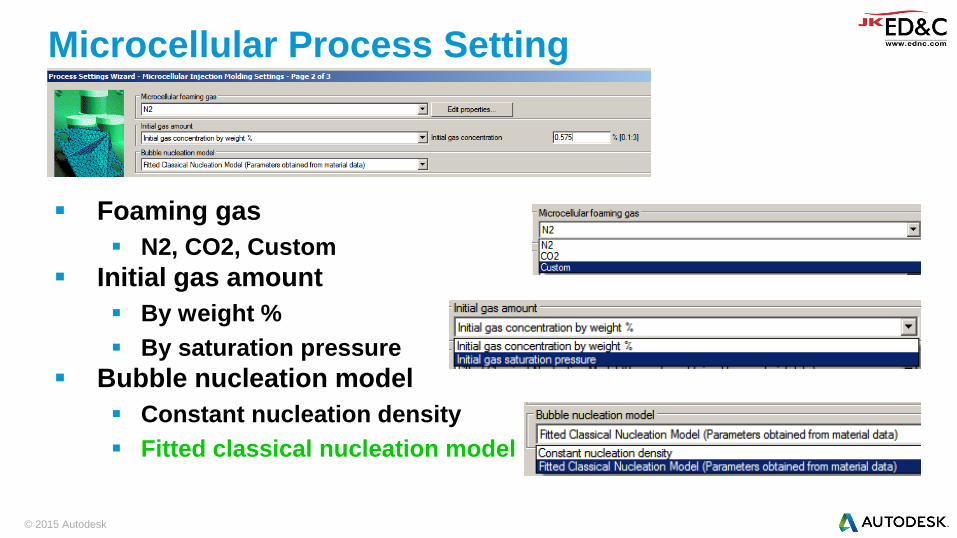
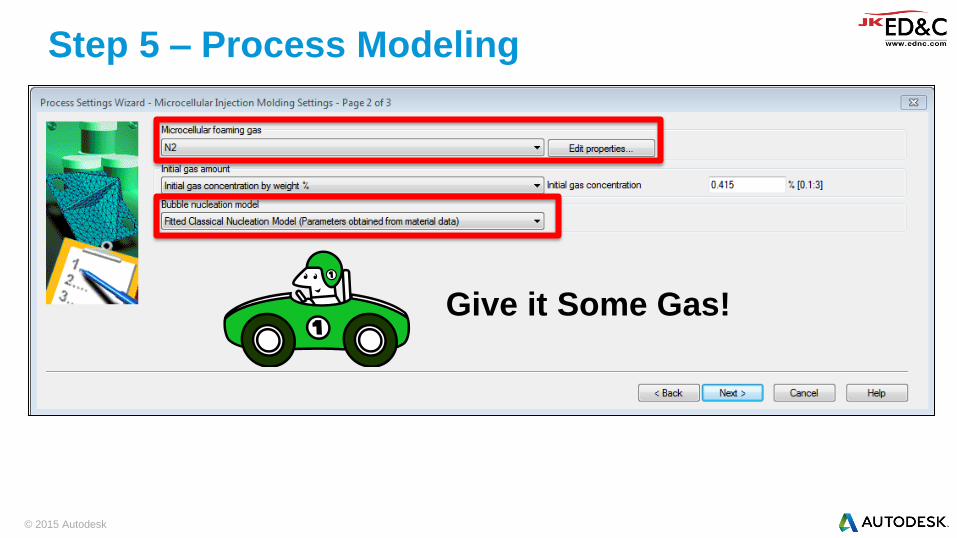
Foaming gas
N2, CO2, Custom
Initial gas amount
By weight %
By saturation pressure
Bubble nucleation model
Constant nucleation density
Fitted classical nucleation model
Microcellular Process Setting
© 2015 Autodesk
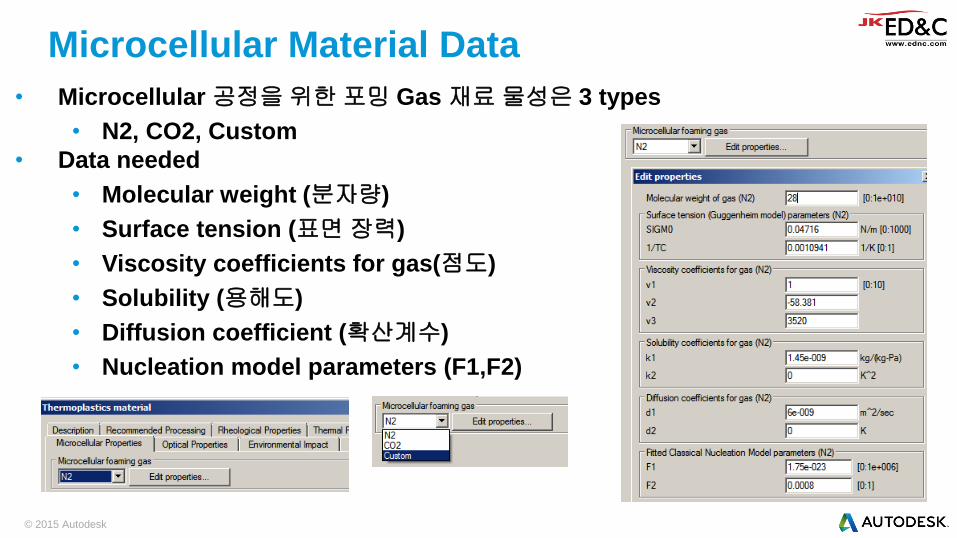
• Microcellular 공정을 위한 포밍 Gas 재료 물성은 3 types
• N2, CO2, Custom
• Data needed
• Molecular weight (분자량)
• Surface tension (표면 장력)
• Viscosity coefficients for gas(점도)
• Solubility (용해도)
• Diffusion coefficient (확산계수)
• Nucleation model parameters (F1,F2)
Microcellular Material Data
© 2015 Autodesk
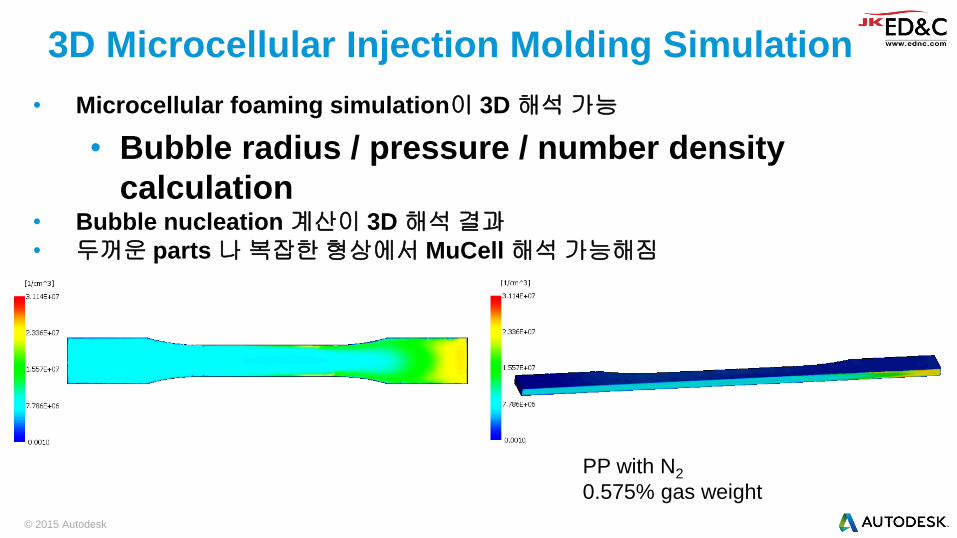
• Microcellular foaming simulation이 3D 해석 가능
• Bubble radius / pressure / number density
calculation • Bubble nucleation 계산이 3D 해석 결과
• 두꺼운 parts 나 복잡한 형상에서 MuCell 해석 가능해짐
3D Microcellular Injection Molding Simulation
PP with N2
0.575% gas weight
© 2015 Autodesk
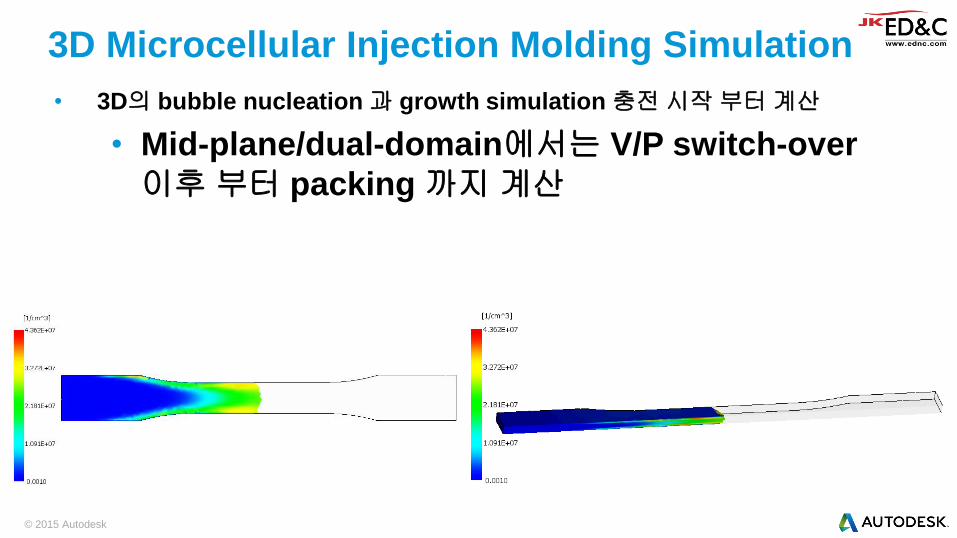
• 3D의 bubble nucleation 과 growth simulation 충전 시작 부터 계산
• Mid-plane/dual-domain에서는 V/P switch-over
이후 부터 packing 까지 계산
3D Microcellular Injection Molding Simulation
© 2015 Autodesk
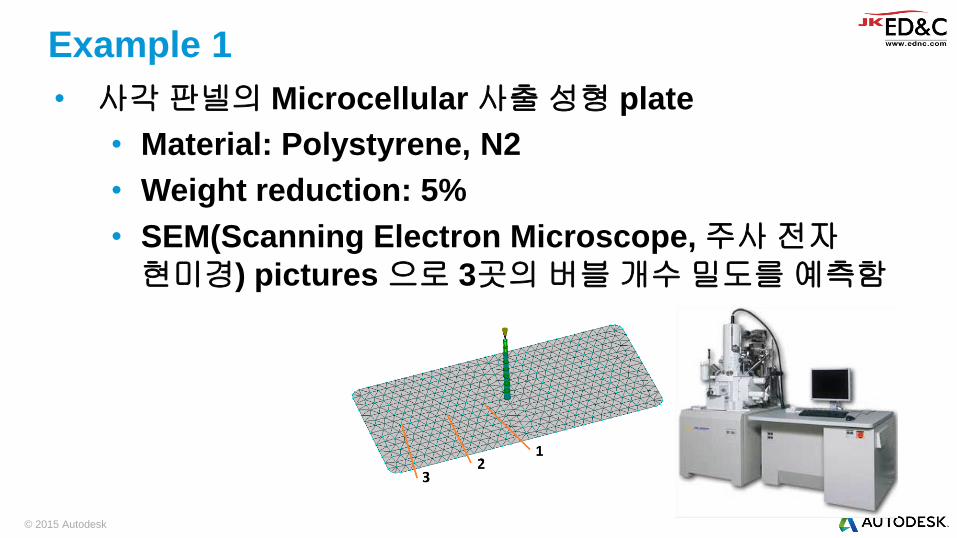
• 사각 판넬의 Microcellular 사출 성형 plate
• Material: Polystyrene, N2
• Weight reduction: 5%
• SEM(Scanning Electron Microscope, 주사 전자
현미경) pictures 으로 3곳의 버블 개수 밀도를 예측함
Example 1
© 2015 Autodesk
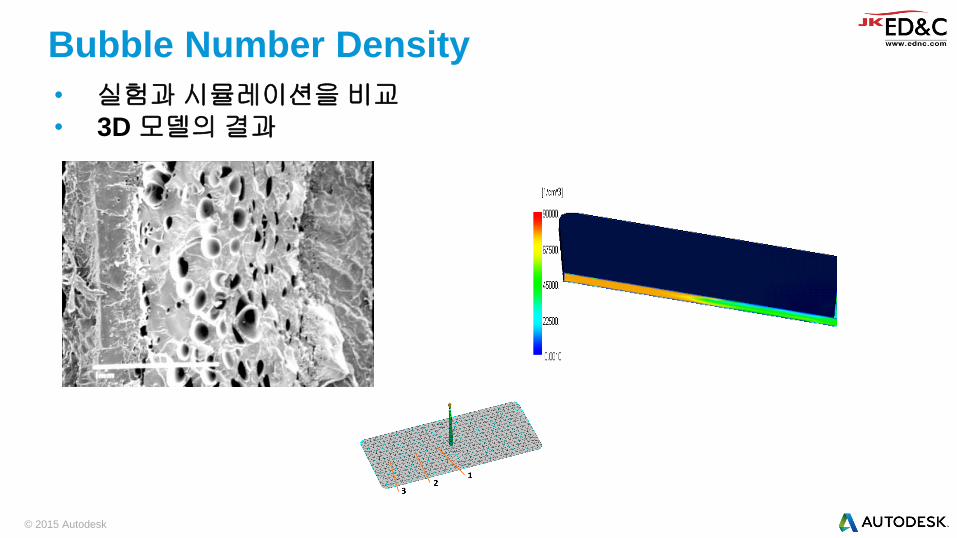
• 실험과 시뮬레이션을 비교
• 3D 모델의 결과
Bubble Number Density
© 2015 Autodesk
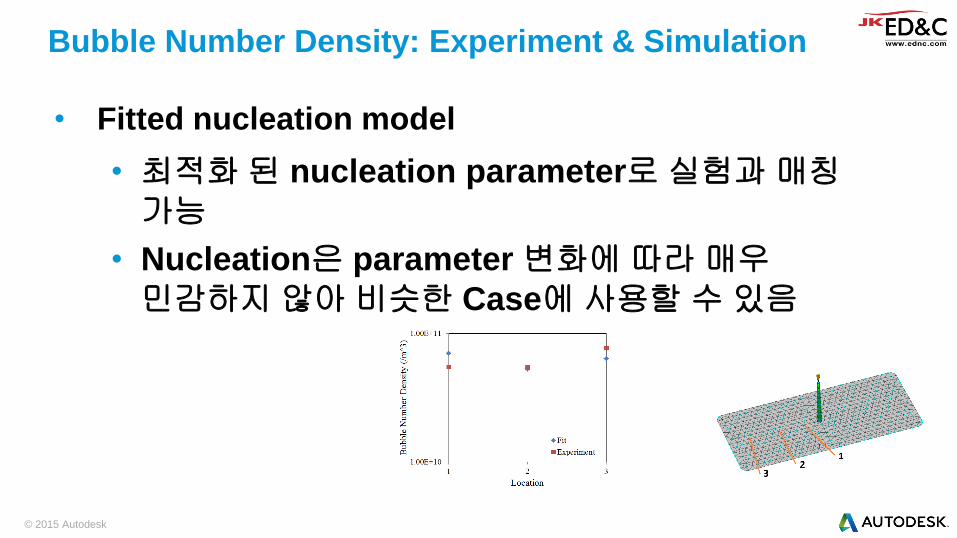
• Fitted nucleation model • 최적화 된 nucleation parameter로 실험과 매칭
가능
• Nucleation은 parameter 변화에 따라 매우
민감하지 않아 비슷한 Case에 사용할 수 있음
Bubble Number Density: Experiment & Simulation
© 2015 Autodesk
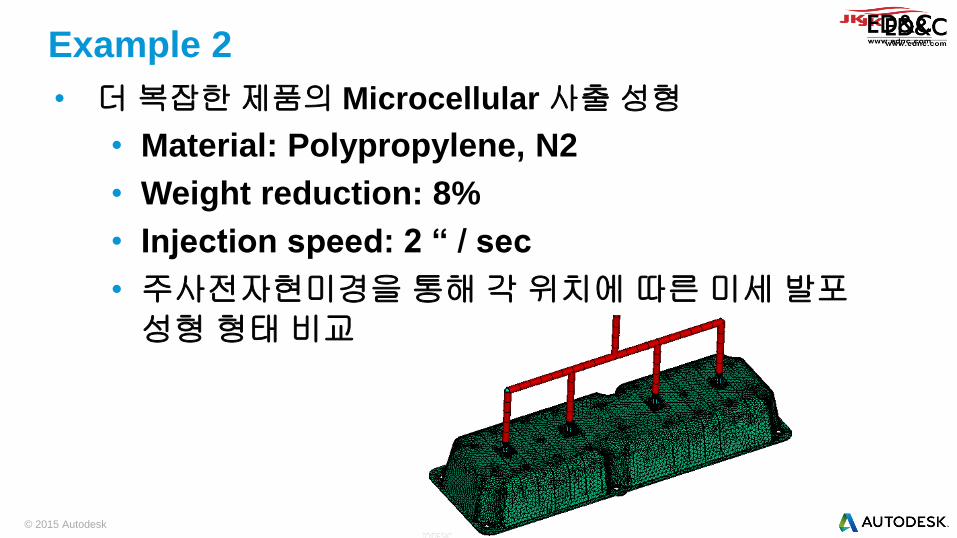
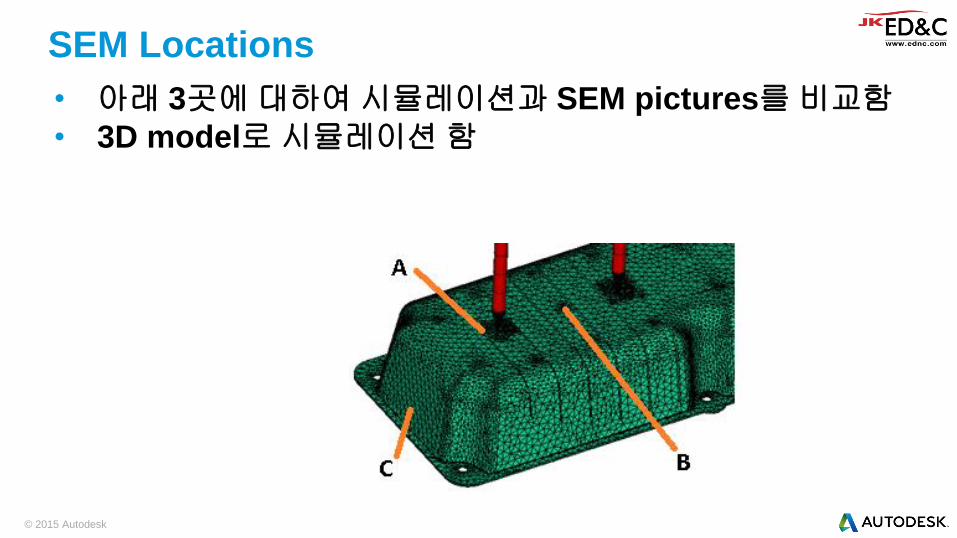
• 더 복잡한 제품의 Microcellular 사출 성형
• Material: Polypropylene, N2
• Weight reduction: 8%
• Injection speed: 2 “ / sec
• 주사전자현미경을 통해 각 위치에 따른 미세 발포
성형 형태 비교
Example 2
© 2015 Autodesk
• 아래 3곳에 대하여 시뮬레이션과 SEM pictures를 비교함
• 3D model로 시뮬레이션 함
SEM Locations

© 2015 Autodesk
• A, B, C 위치에서의 SEM pictures
• A: gate 근처: 버블 개수가 작음
• B: Gate와 Gate 사이: 중심층에 작은 버블 개수가
많고, 표면 근처에 큰 버블 생성
• C: 유동 말단부: 가늘고 긴 버블 생성
Bubble Morphology
© 2015 Autodesk
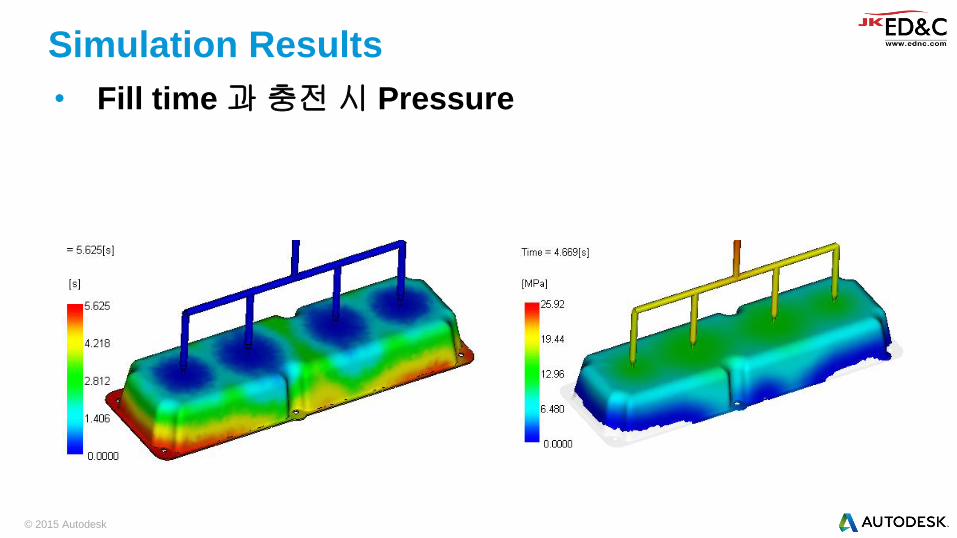
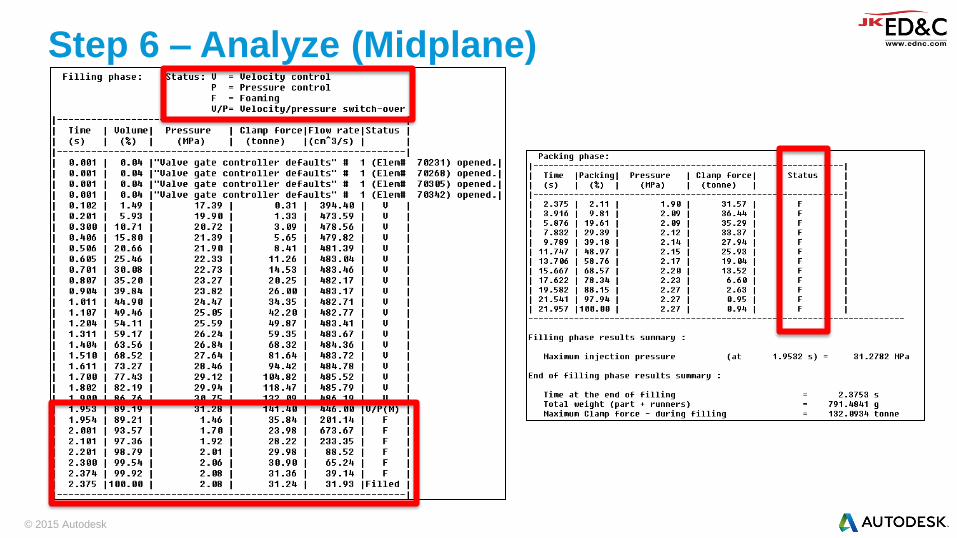
• Fill time 과 충전 시 Pressure
Simulation Results
© 2015 Autodesk
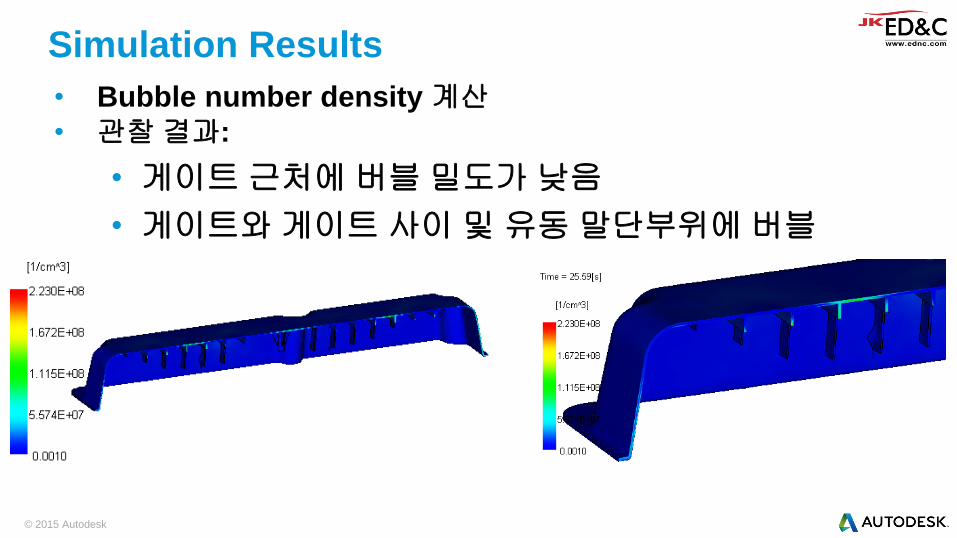
• Bubble number density 계산
• 관찰 결과:
• 게이트 근처에 버블 밀도가 낮음
• 게이트와 게이트 사이 및 유동 말단부위에 버블
밀도가 높음
Simulation Results

© 2015 Autodesk
• Bubble 반경 계산
• 관찰 결과
• 게이트 근처와 유동 말단 부위에 큰 버블 생성
• 게이트와 게이트 사이 작은 버블 생성
Simulation Results
© 2015 Autodesk
MuCell in Moldflow 2016
© 2015 Autodesk
게이트 밸런스 위치
중량 감소율에 따른 해석 결과
사출 속도 증가에 따른 Cell 생성 촉진 결과
만약 Full shot이 불가능할 때 중량 감소율을 약간 줄임
Moldflow Strategy
© 2015 Autodesk
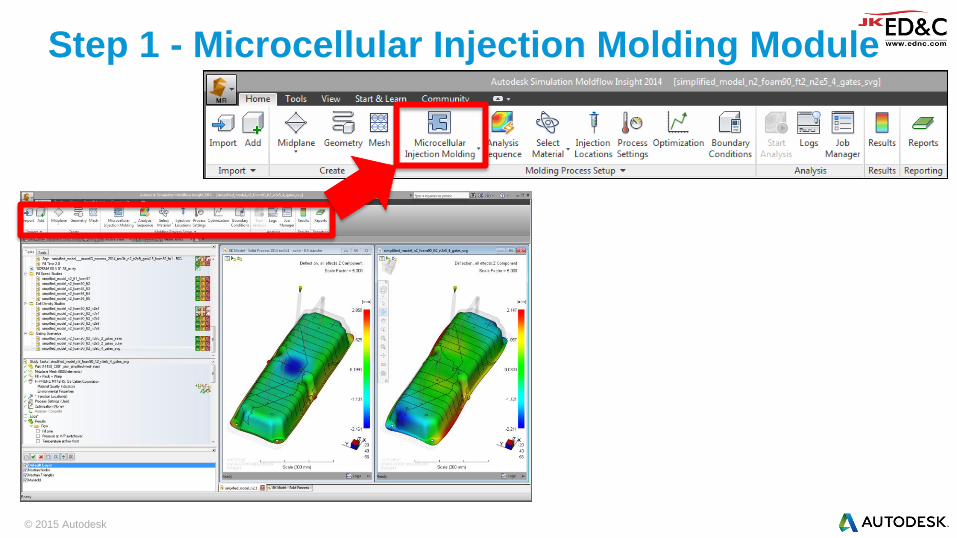
Step 1 - Microcellular Injection Molding Module

© 2015 Autodesk
Step 2 – Part Modeling
Midplane
Dual Domain
3D Added!
기타 특별히 고려해야
할 사항 없음
© 2015 Autodesk
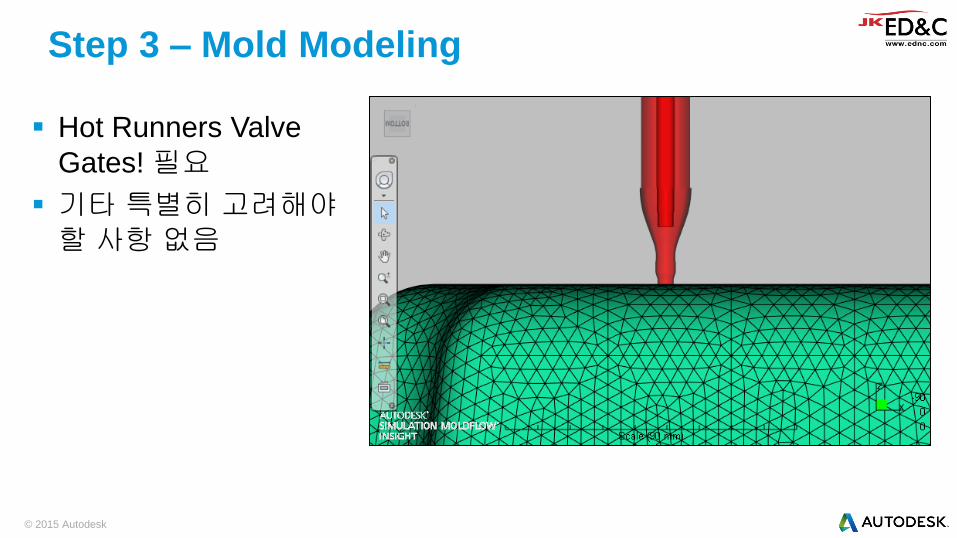
Step 3 – Mold Modeling
Hot Runners Valve
Gates! 필요
기타 특별히 고려해야
할 사항 없음
© 2015 Autodesk
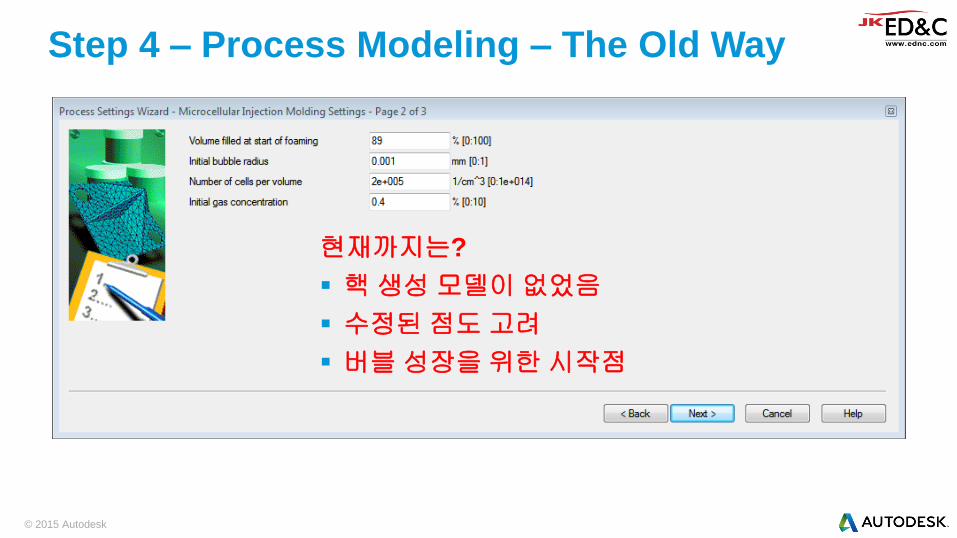
Step 4 – Process Modeling – The Old Way
현재까지는?
핵 생성 모델이 없었음
수정된 점도 고려
버블 성장을 위한 시작점
© 2015 Autodesk
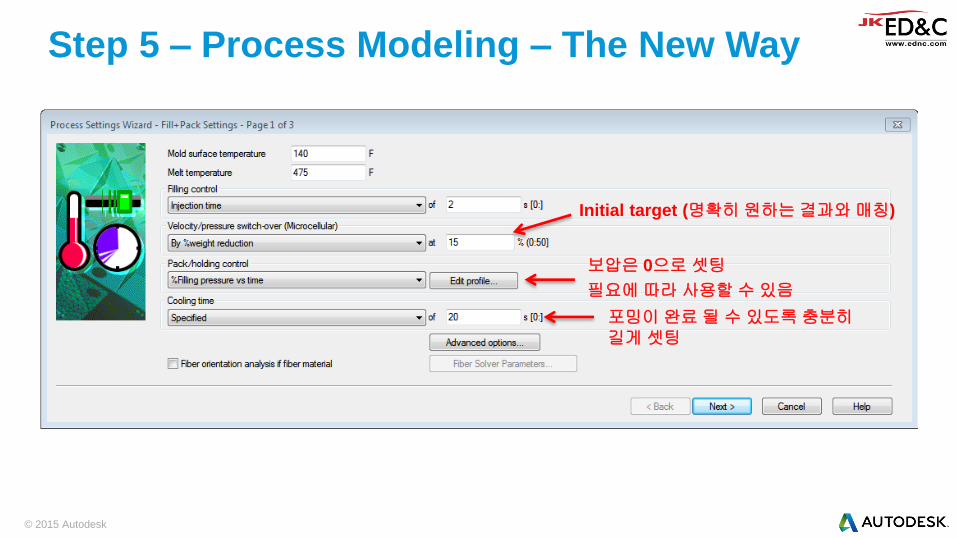
Step 5 – Process Modeling – The New Way
Initial target (명확히 원하는 결과와 매칭)
포밍이 완료 될 수 있도록 충분히
길게 셋팅
보압은 0으로 셋팅
필요에 따라 사용할 수 있음
© 2015 Autodesk
Step 5 – Process Modeling
Give it Some Gas!
© 2015 Autodesk
Step 6 – Analyze (Midplane)

© 2015 Autodesk
Step 6 – Analyze (3D)
© 2015 Autodesk
Case Example - Correlation
© 2015 Autodesk
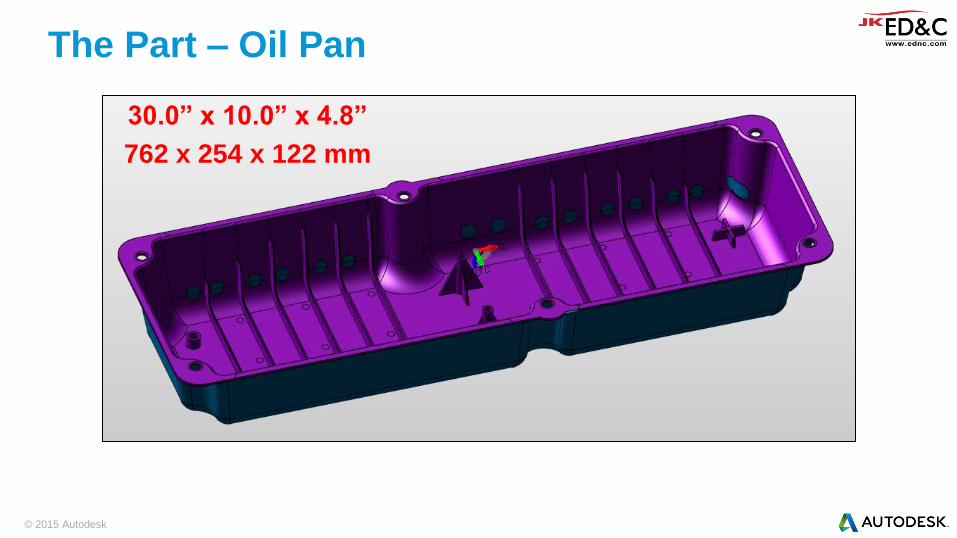
The Part – Oil Pan
30.0” x 10.0” x 4.8”
762 x 254 x 122 mm
© 2015 Autodesk
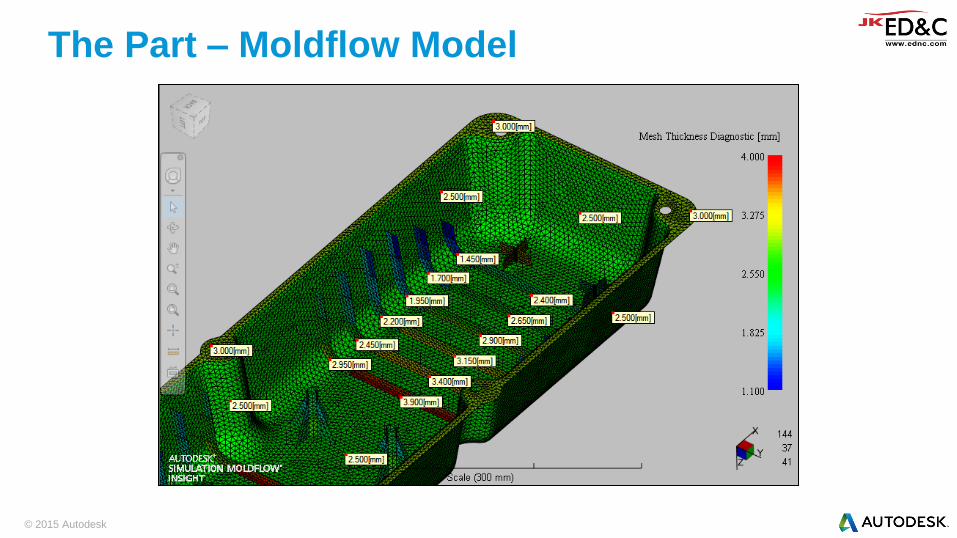
The Part – Moldflow Model
© 2015 Autodesk
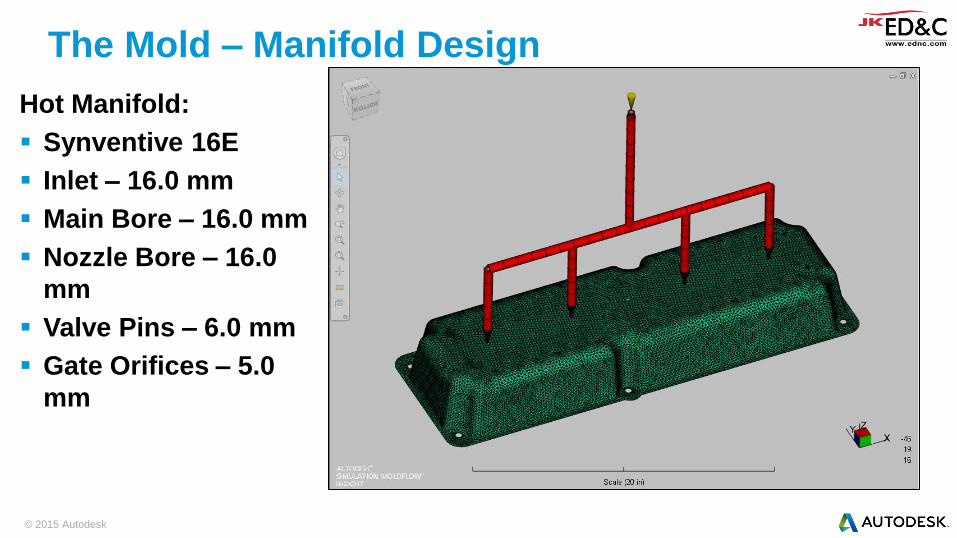
The Mold – Manifold Design
Hot Manifold:
Synventive 16E
Inlet – 16.0 mm
Main Bore – 16.0 mm
Nozzle Bore – 16.0
mm
Valve Pins – 6.0 mm
Gate Orifices – 5.0
mm

© 2015 Autodesk
Molded Parts – Achieved 11% weight reduction
Solid Shot MuCell Shot
© 2015 Autodesk
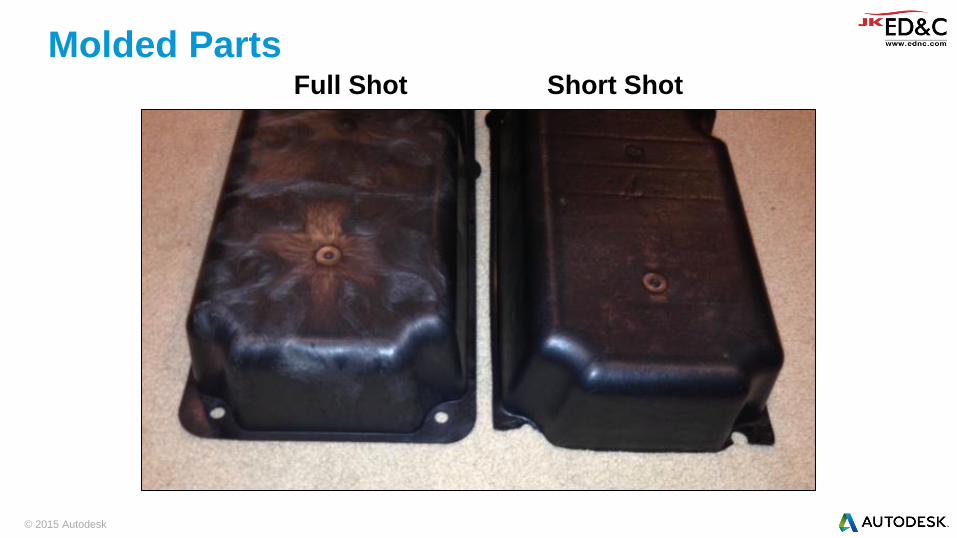
Molded Parts Full Shot Short Shot
© 2015 Autodesk
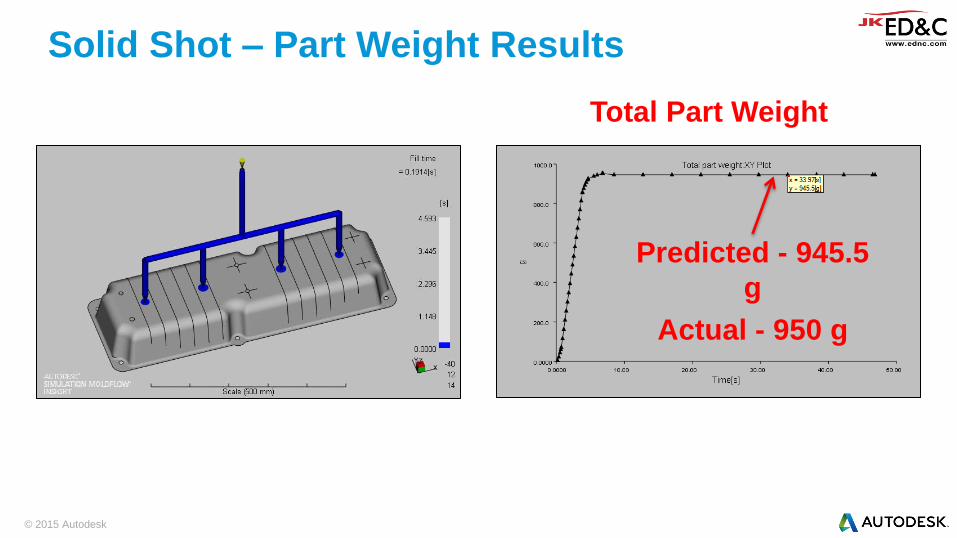
Solid Shot – Part Weight Results
Predicted - 945.5
g
Actual - 950 g
Total Part Weight

© 2015 Autodesk
MuCell Shot – Weight Results
Fill Time (sec.) V/P Switchover (By %
Weight Reduction)
Predicted Part
Weight (g)
Predicted Weight
Reduction
2.0 11% 868.9 12.2%
2.0 15% 837.4 15.4%
2.0 20% 791.5 20.1%
2.0 25% 746.4 24.6%
2.0 30% Short shot
Calculated Reference Solid Part
Weight = 990g
© 2015 Autodesk
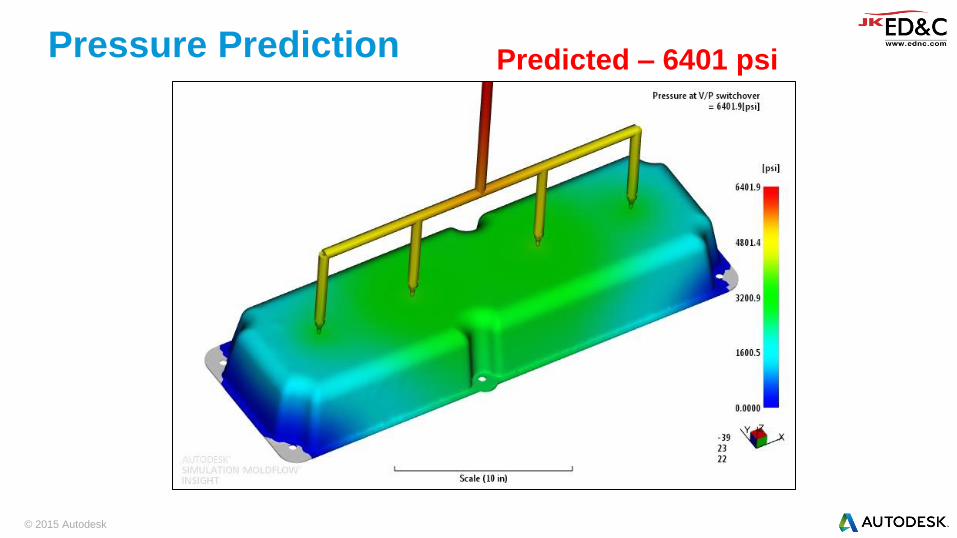
Pressure Prediction Predicted – 6401 psi
(midplane)

© 2015 Autodesk
Bubble Radius Results
Trends
Higher pressure = small
radius
Higher temp = large
radius
© 2015 Autodesk
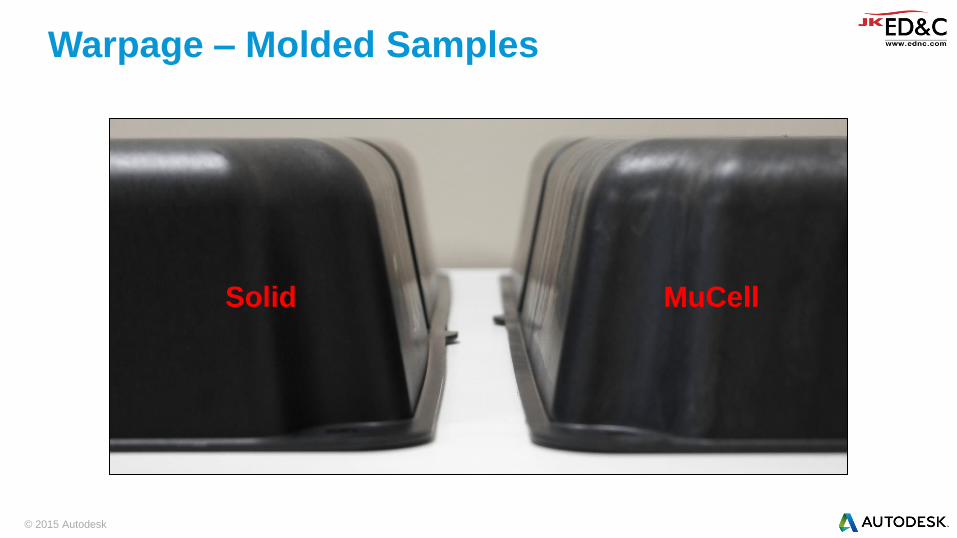
Warpage – Molded Samples
Solid MuCell

© 2015 Autodesk
Predicted Warpage – (ASMI 2015)
Solid MuCell

© 2015 Autodesk
Predicted Warpage – 2016 (no CRIMS)
MuCell
© 2015 Autodesk
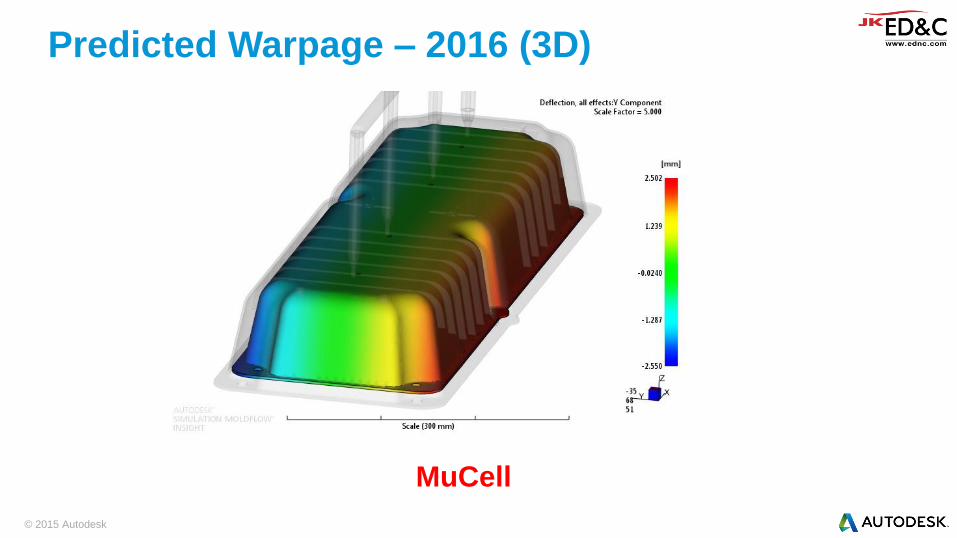
Predicted Warpage – 2016 (3D)
MuCell
Conclusion
• 현재 bubble nucleation model 로 MuCell 사출 성형에 대하여 품질 예측이 가능하다.
• Nucleation parameters 는 경우에 따라 조정이 필요할 수 있다.
• 3D Microcellular 시물레이션은 경우에 따라 Mid Plane
시뮬레이션 보다 더 사실적인 시뮬레이션 결과를 제공한다.
