"Визуализация данных с помощью d3.js", Михаил...
TRANSCRIPT
Михаил Дунаевпрограммист спецпроектов http://lenta.ru
http://mdunaev.github.io/
Визуализация данных с помощью D3.js
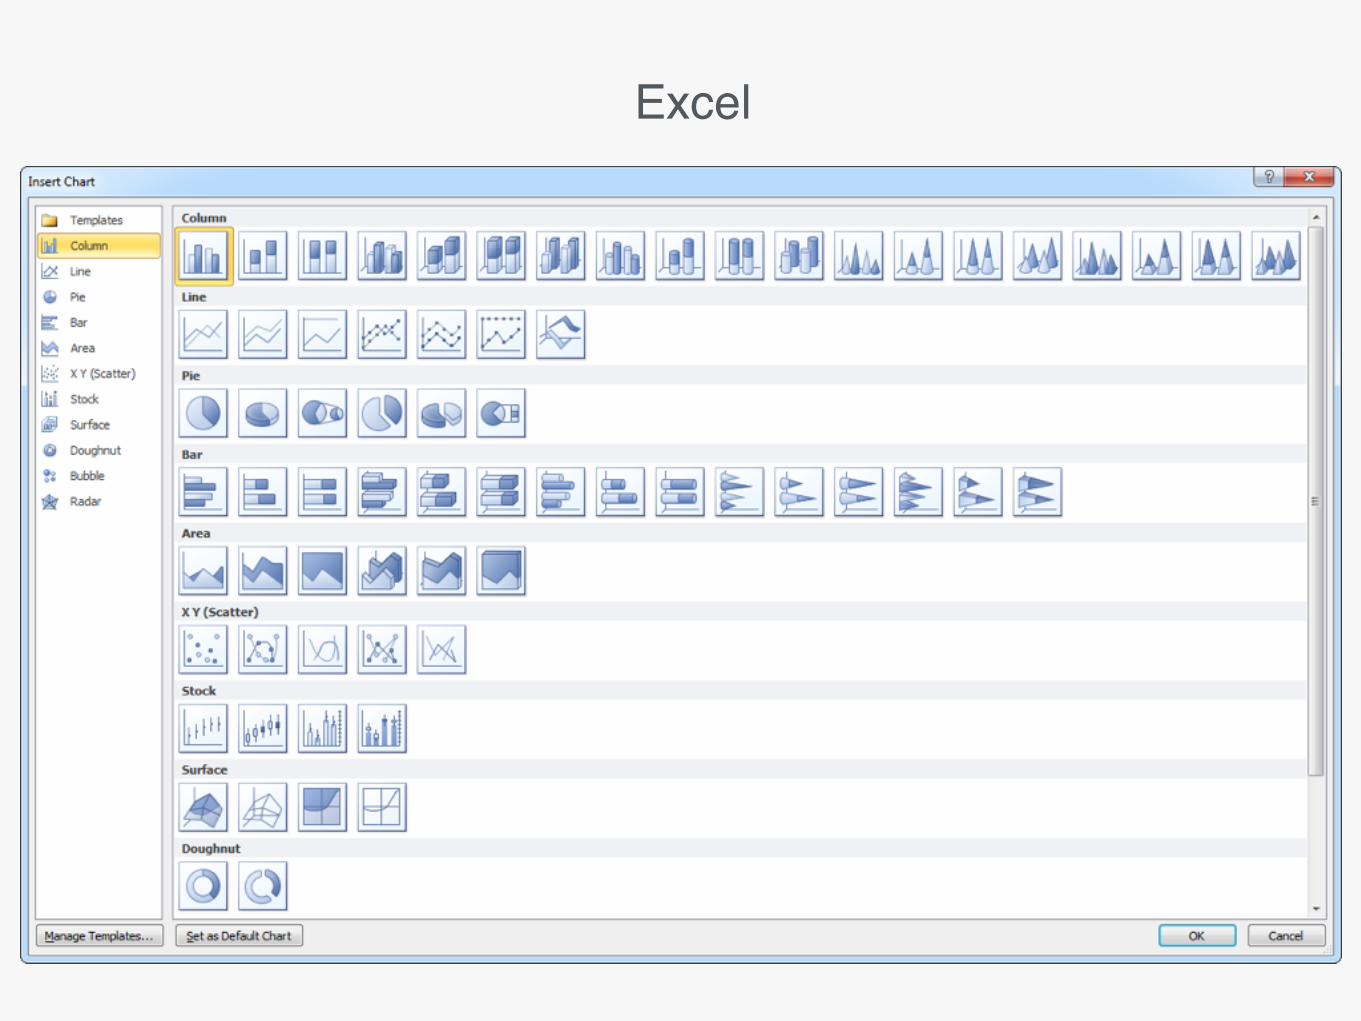
Excel
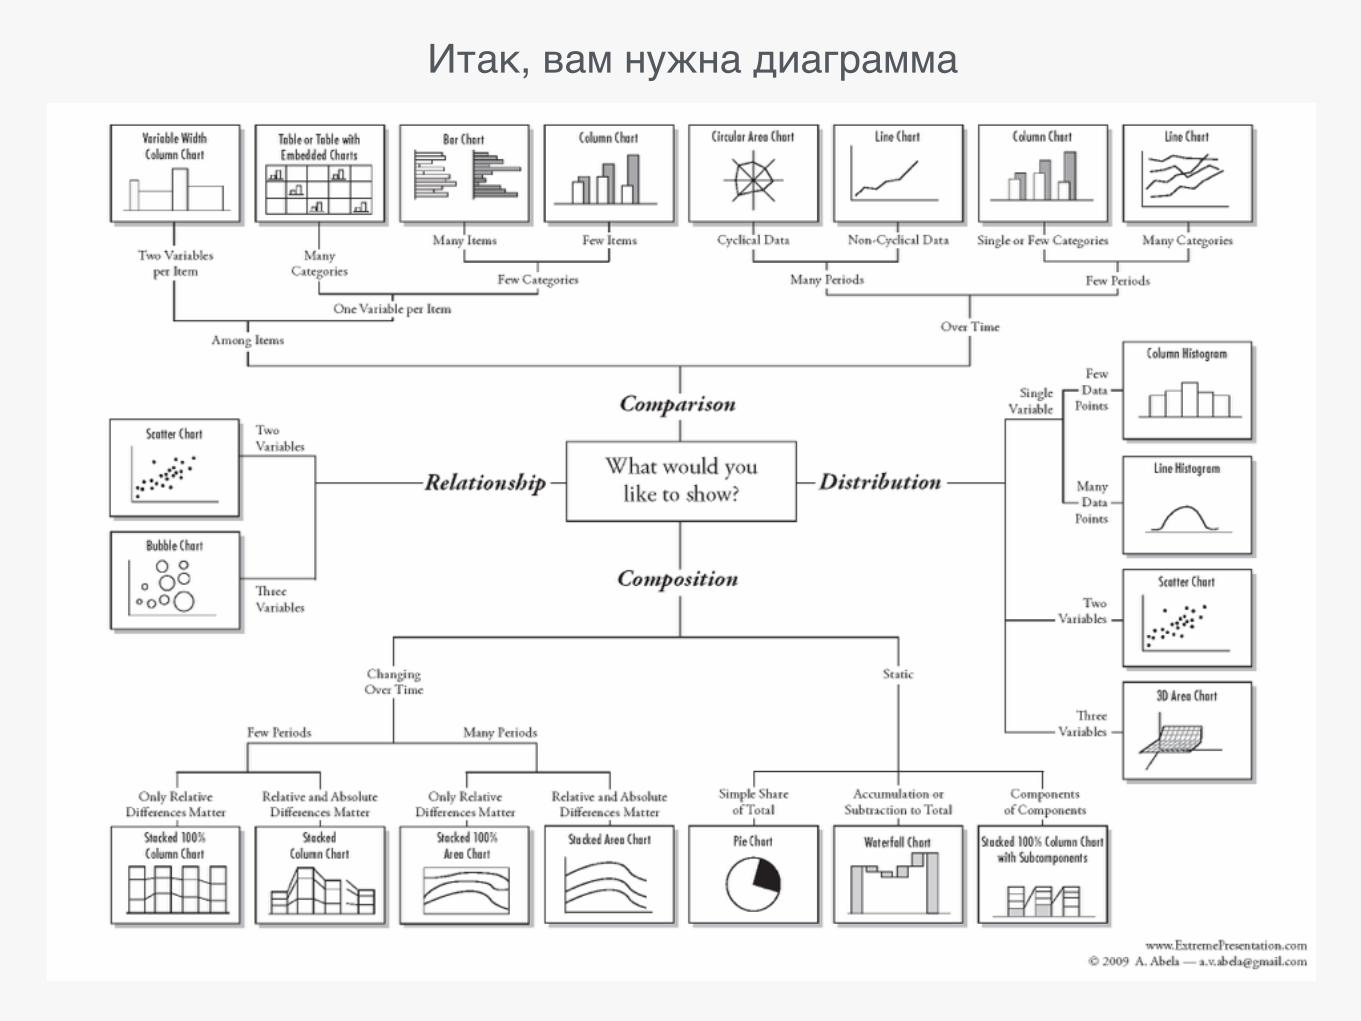
Итак, вам нужна диаграмма

Стандартные диаграммы
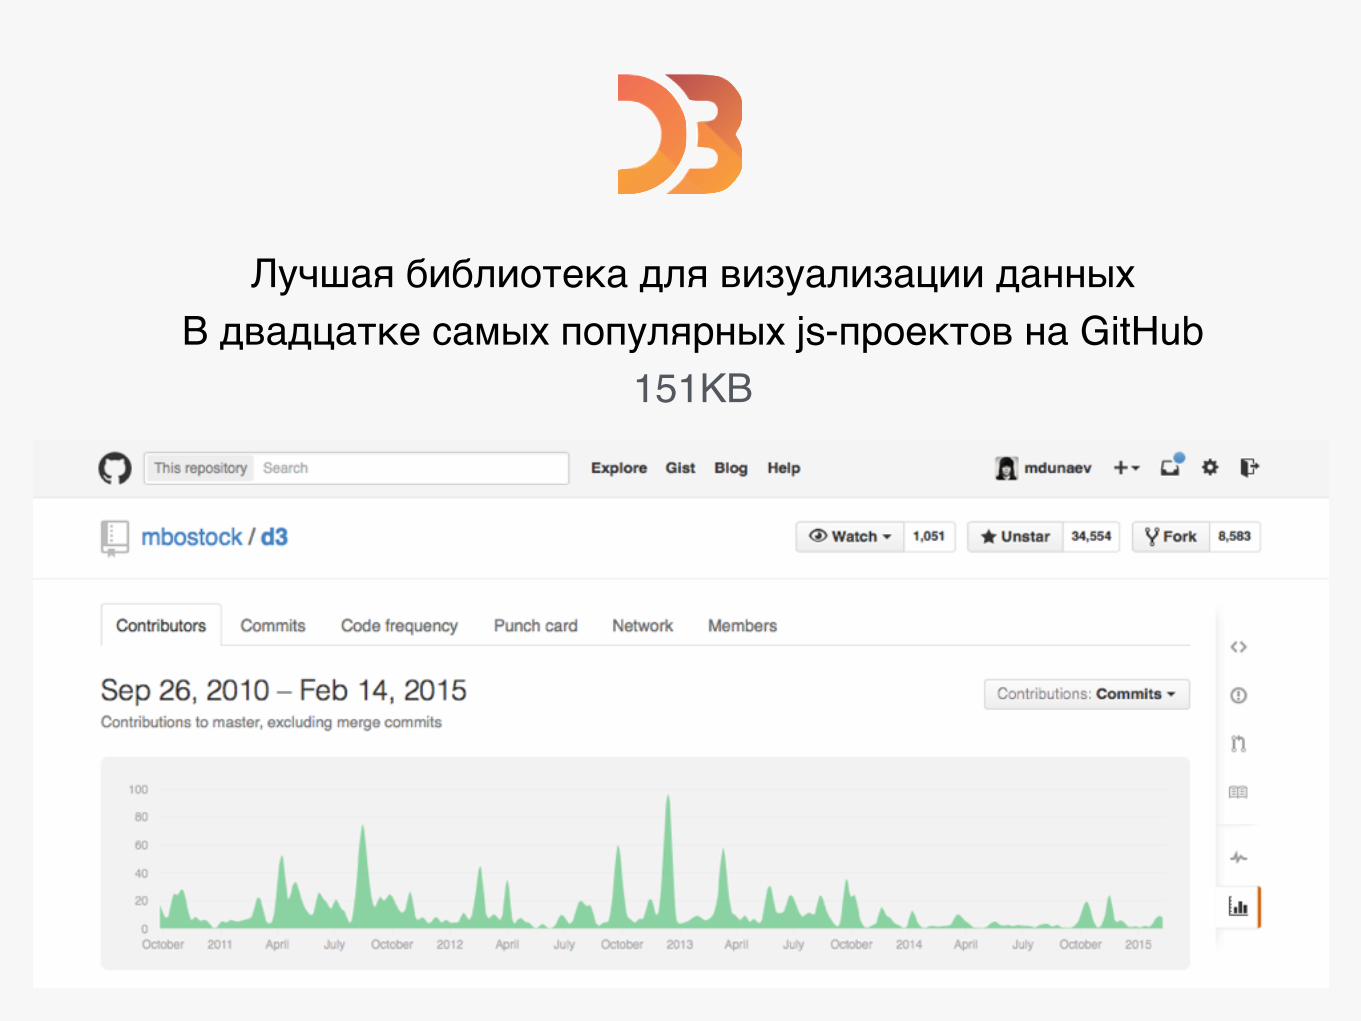
Лучшая библиотека для визуализации данныхВ двадцатке самых популярных js-проектов на GitHub
151KB
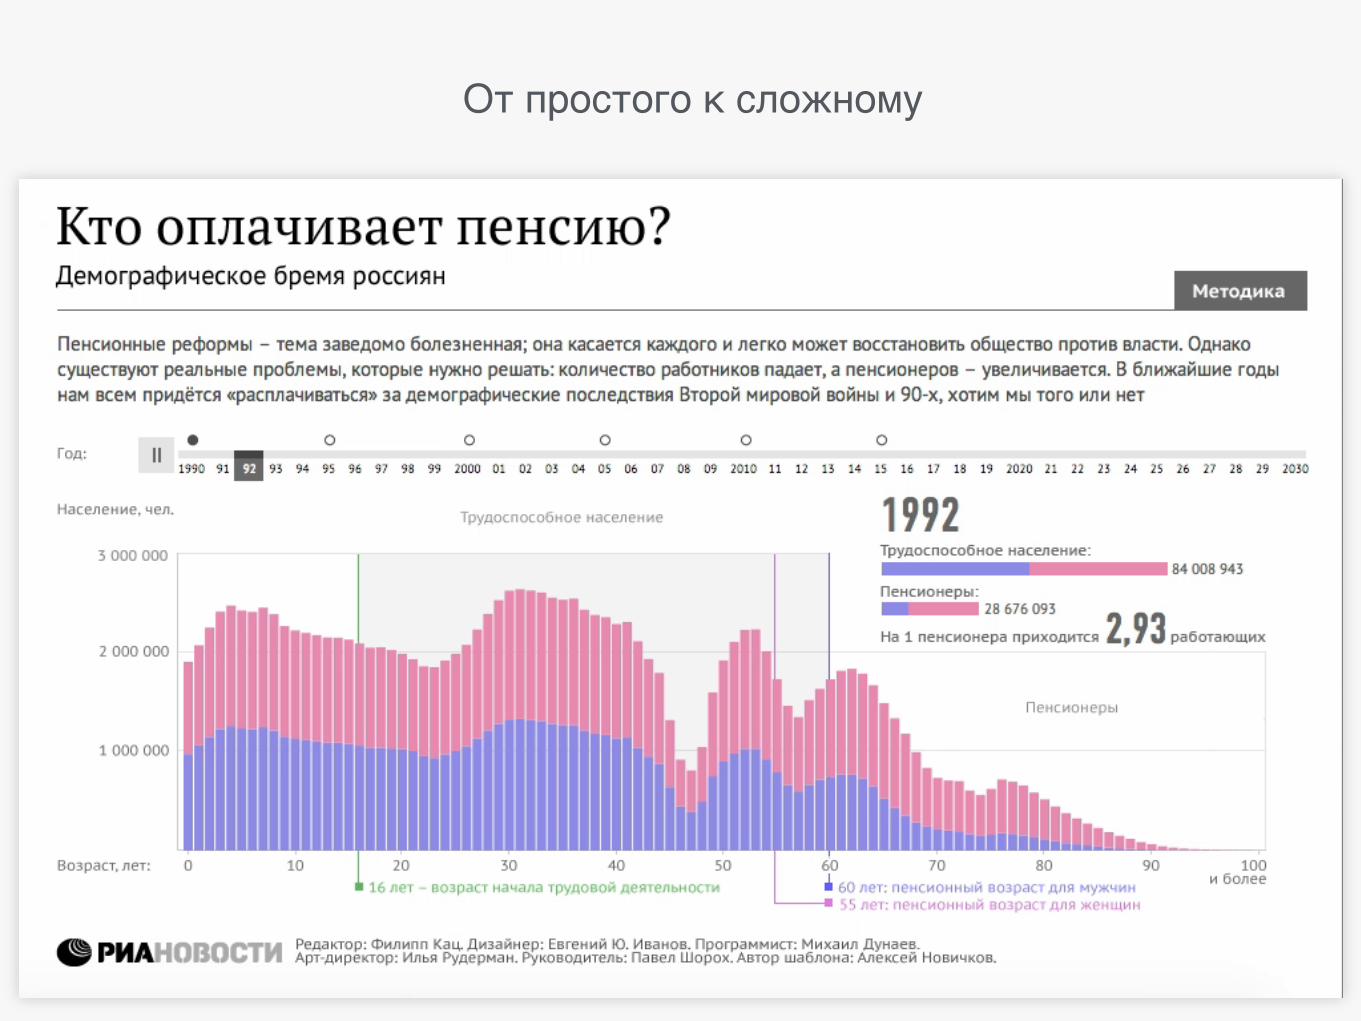
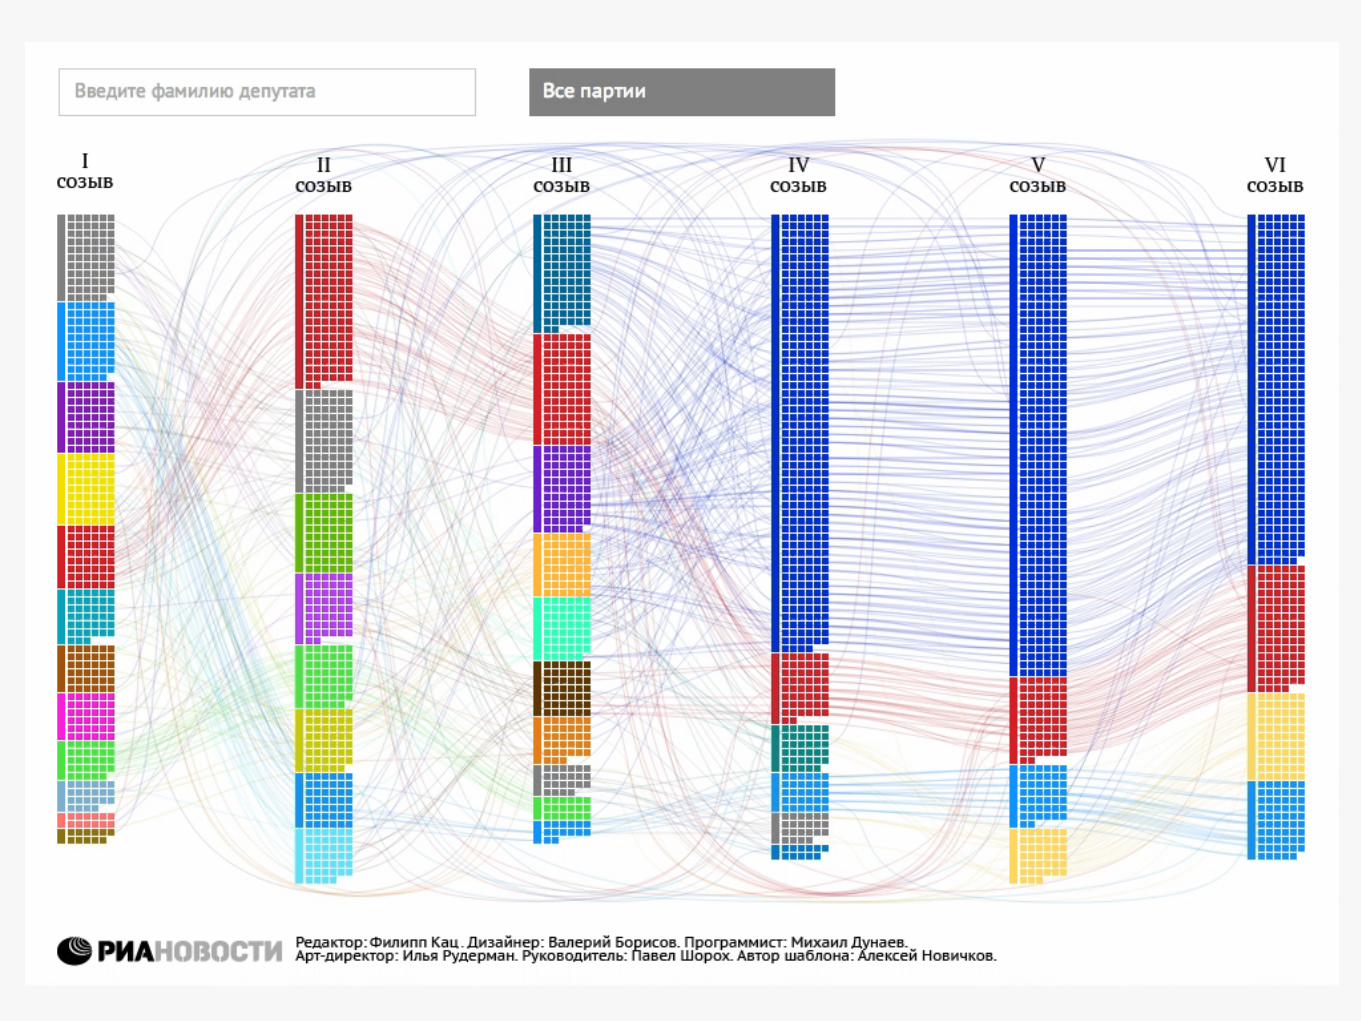
От простого к сложному
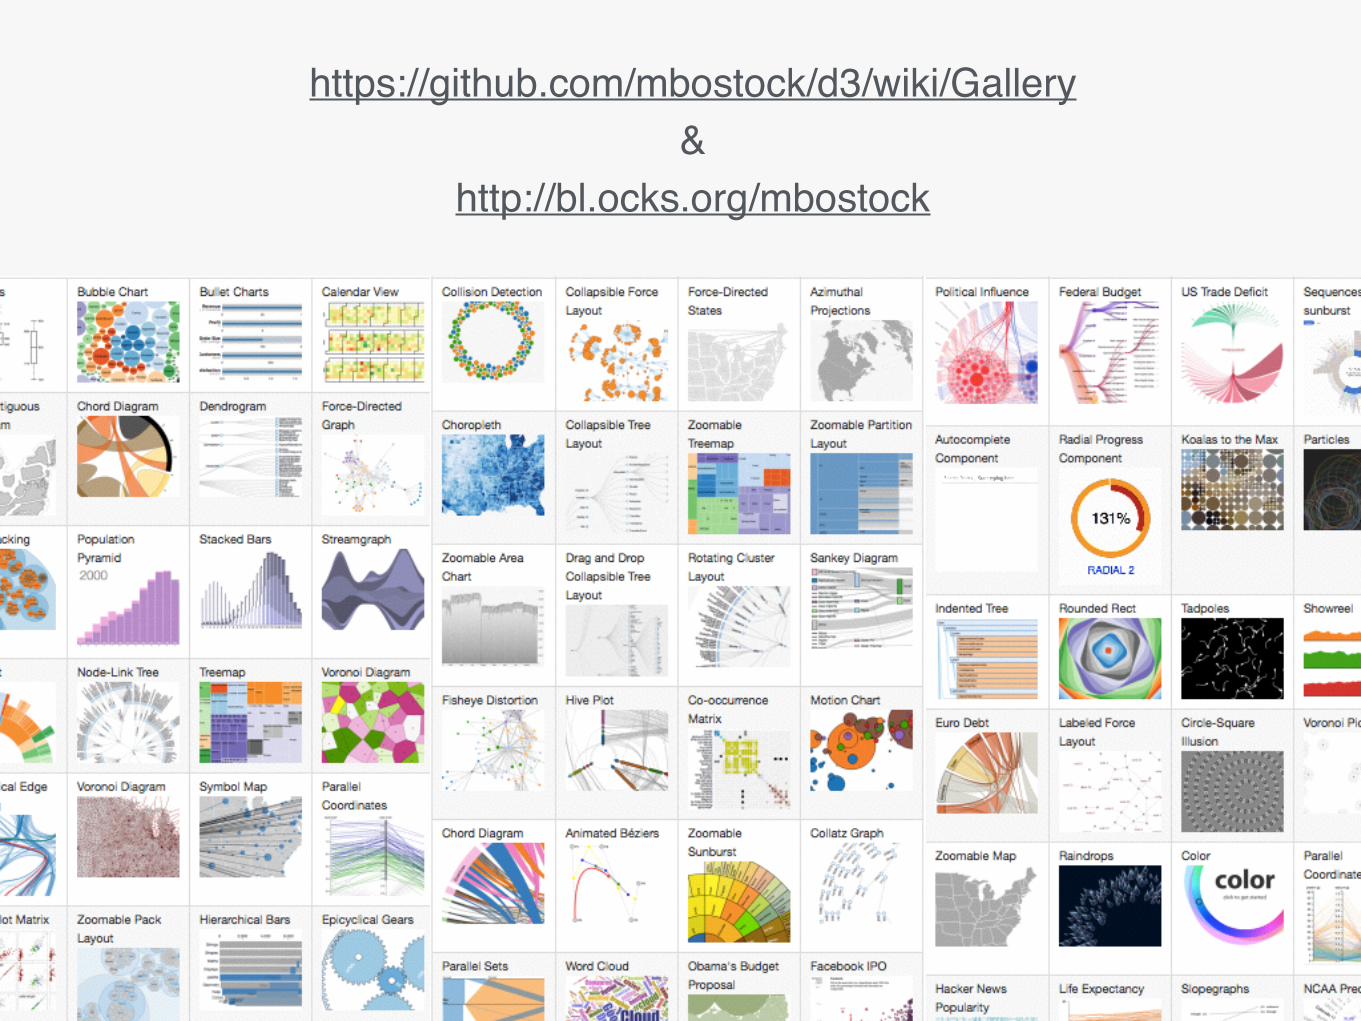
https://github.com/mbostock/d3/wiki/Gallery&
http://bl.ocks.org/mbostock
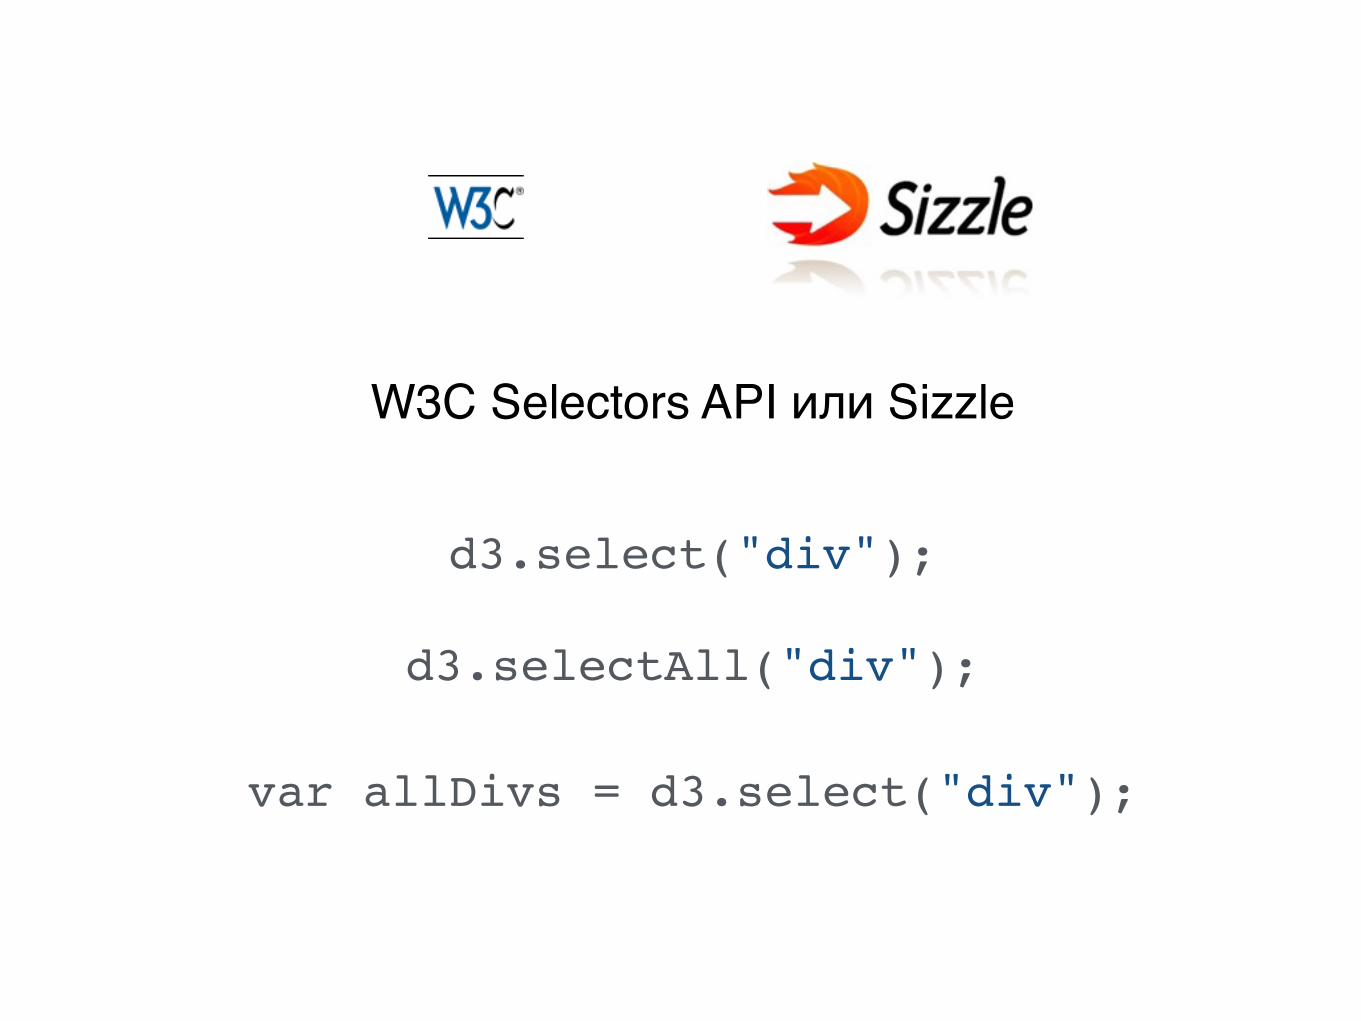
d3.select("div");
d3.selectAll("div");
W3C Selectors API или Sizzle
var allDivs = d3.select("div");
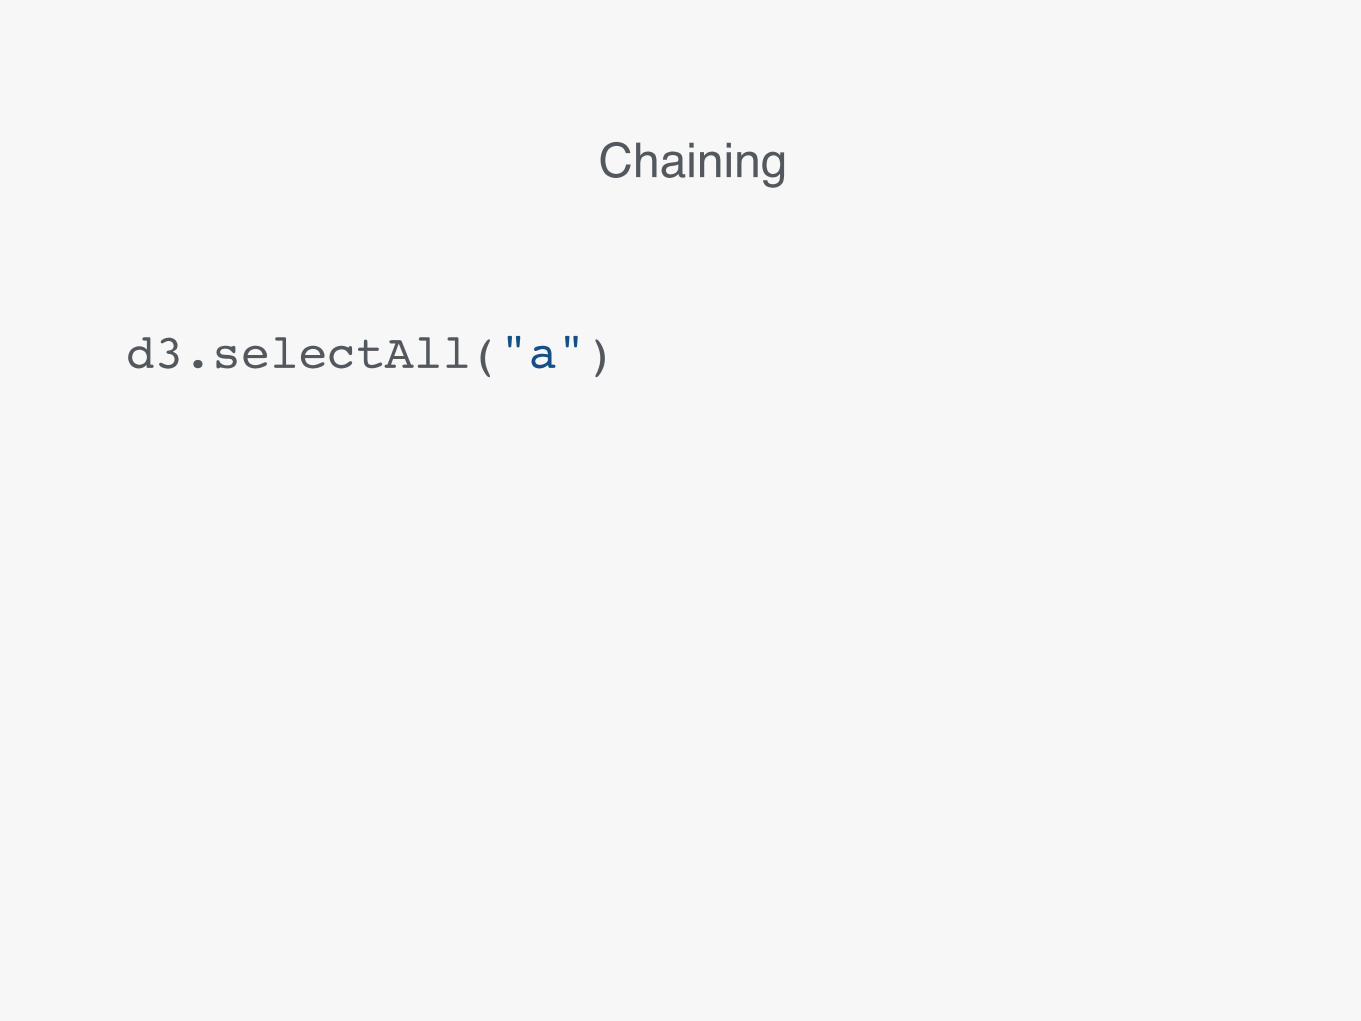
Chaining
d3.selectAll("a")
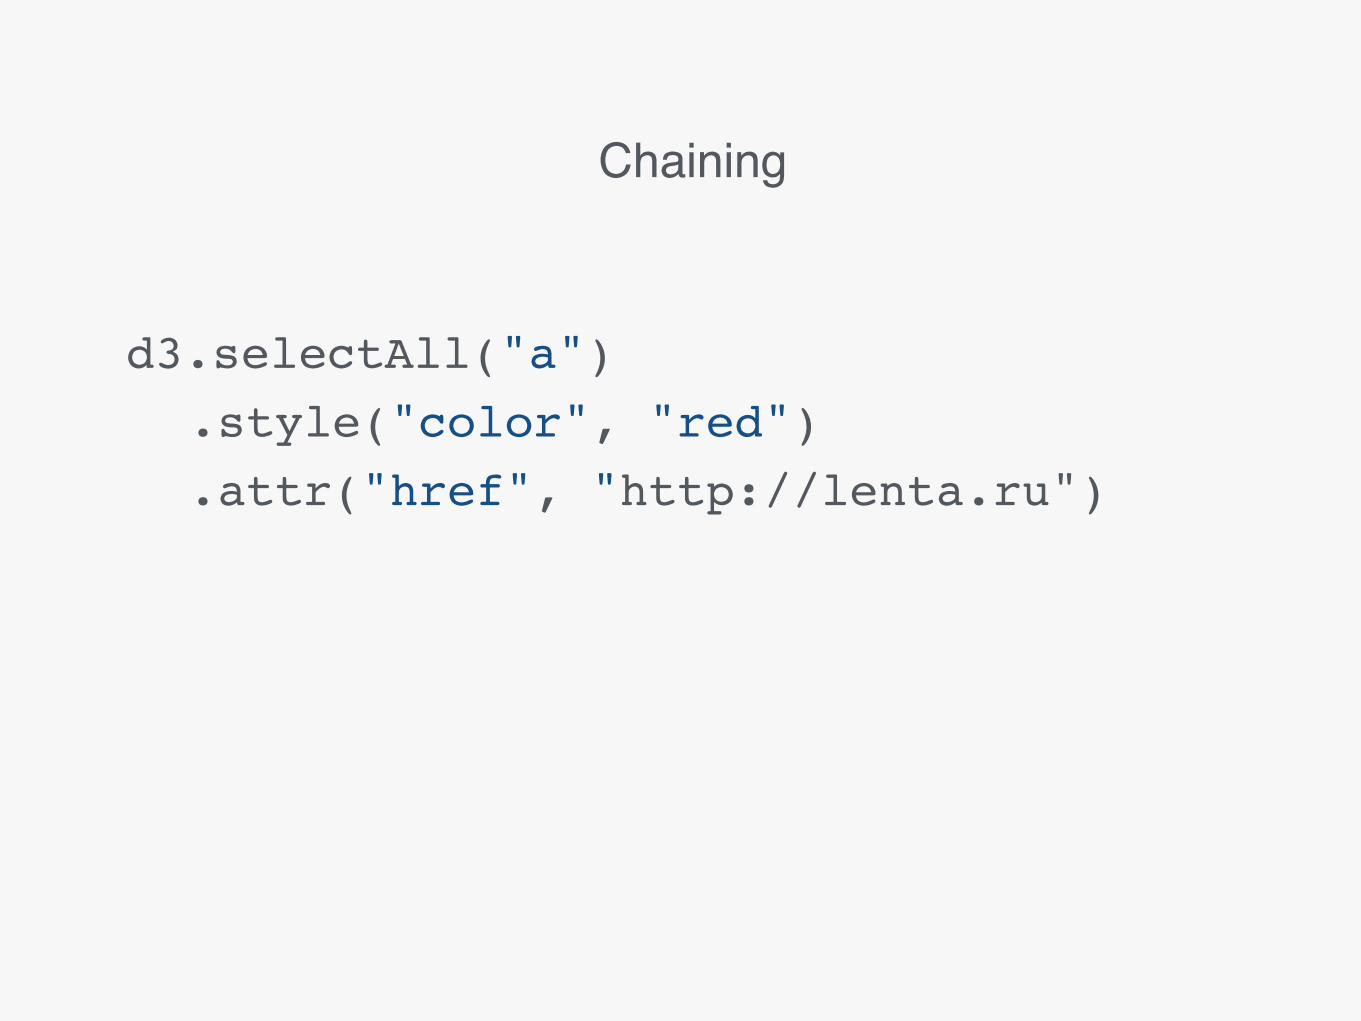
Chaining
d3.selectAll("a").style("color", "red").attr("href", "http://lenta.ru")
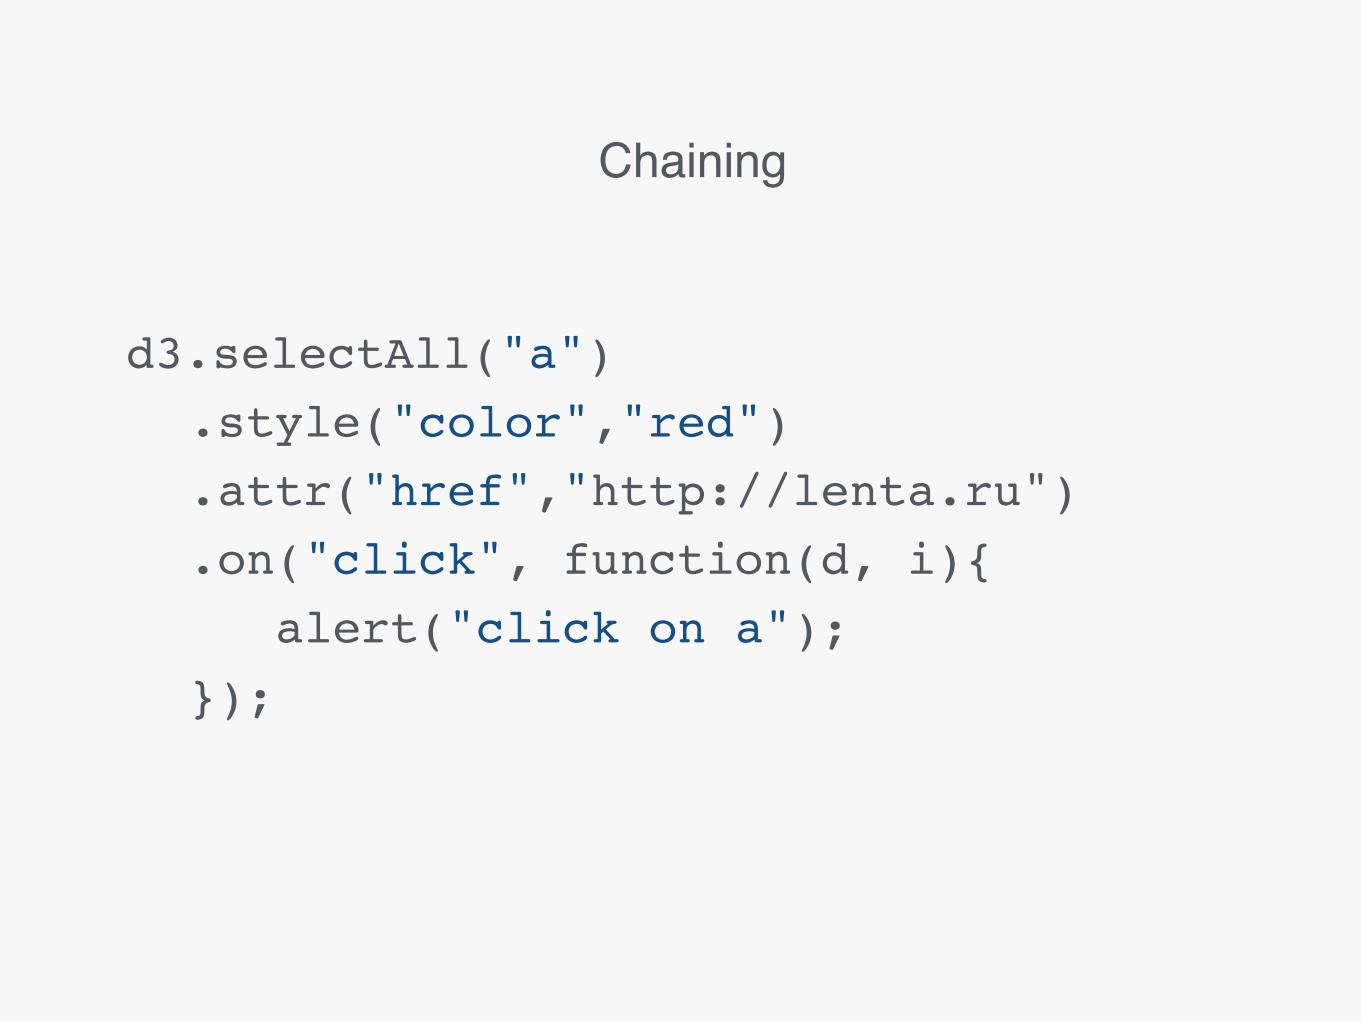
Chaining
d3.selectAll("a").style("color","red").attr("href","http://lenta.ru").on("click", function(d, i){
alert("click on a");});
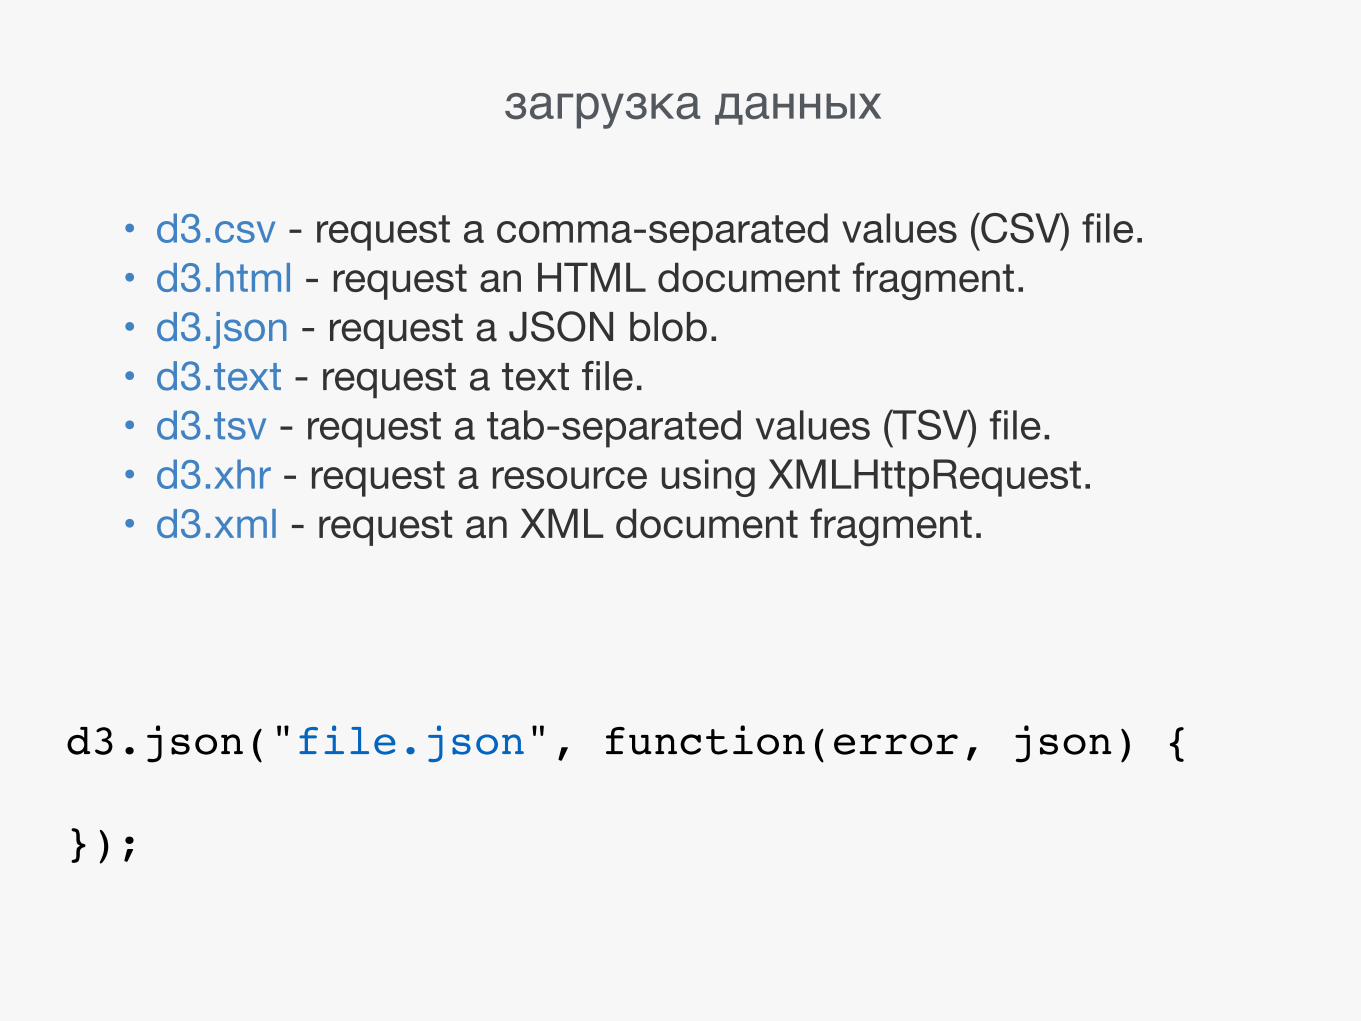
• d3.csv - request a comma-separated values (CSV) file. • d3.html - request an HTML document fragment. • d3.json - request a JSON blob. • d3.text - request a text file. • d3.tsv - request a tab-separated values (TSV) file. • d3.xhr - request a resource using XMLHttpRequest. • d3.xml - request an XML document fragment.
загрузка данных
d3.json("file.json", function(error, json) {
});
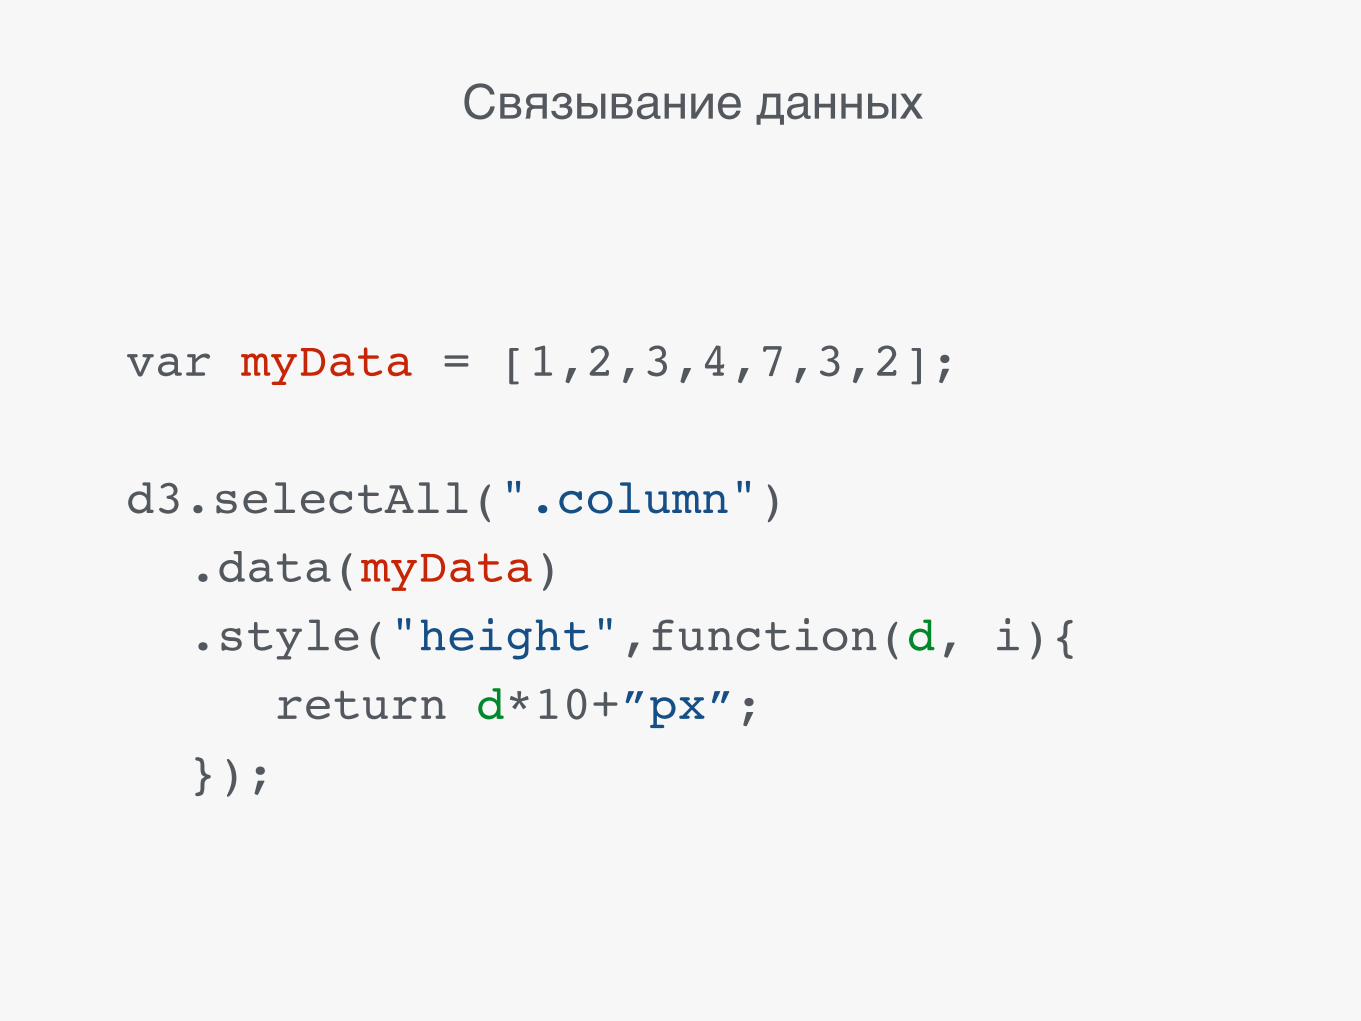
Связывание данных
var myData = [1,2,3,4,7,3,2];
d3.selectAll(".column").data(myData).style("height",function(d, i){
return d*10+”px”;});
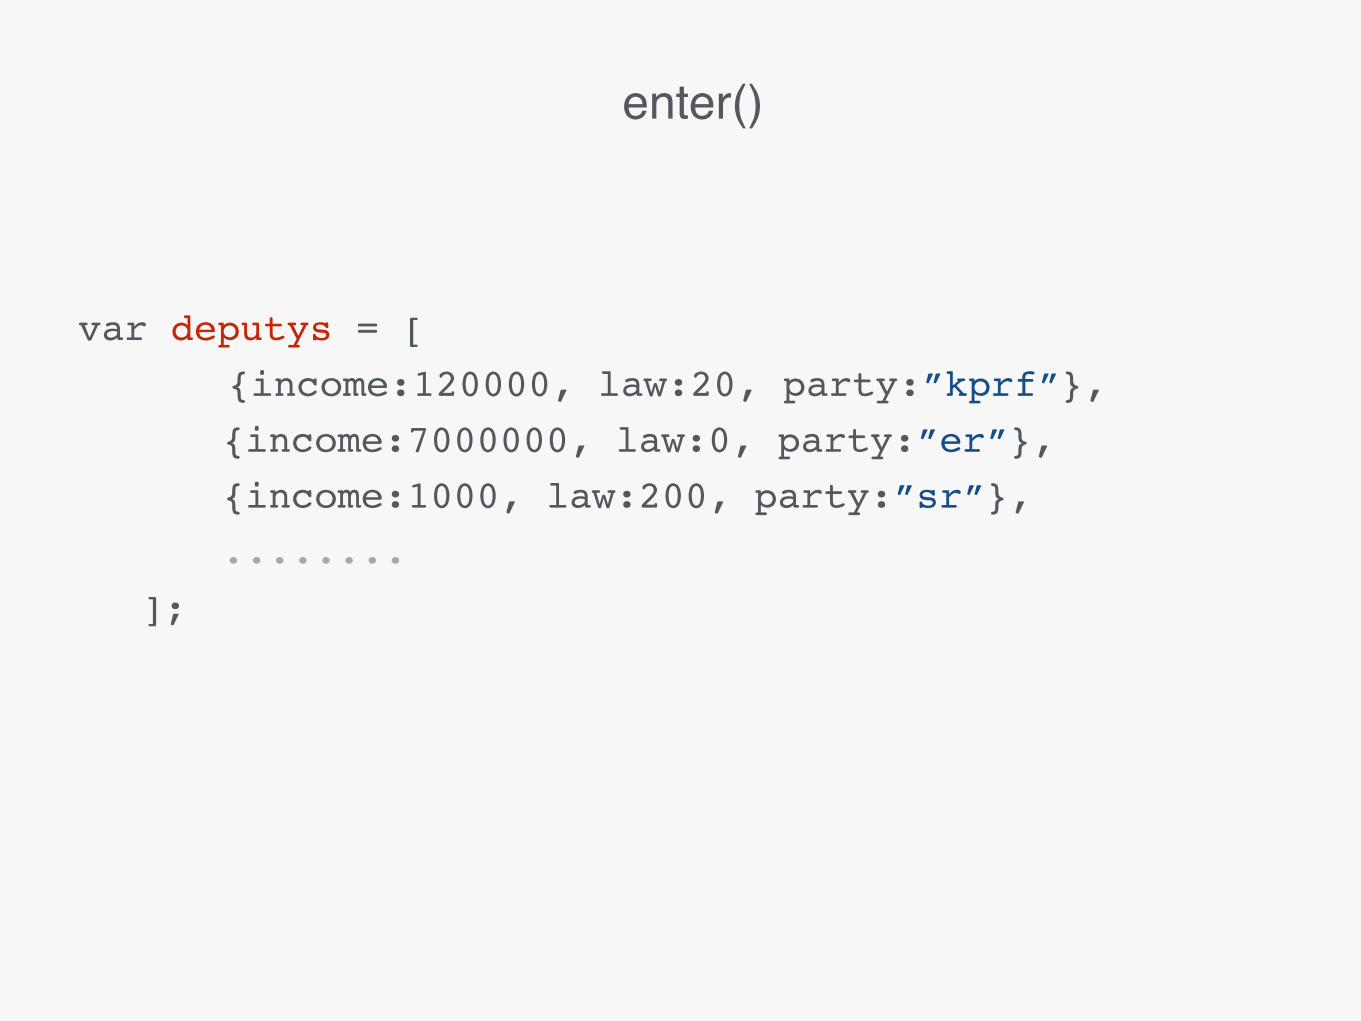
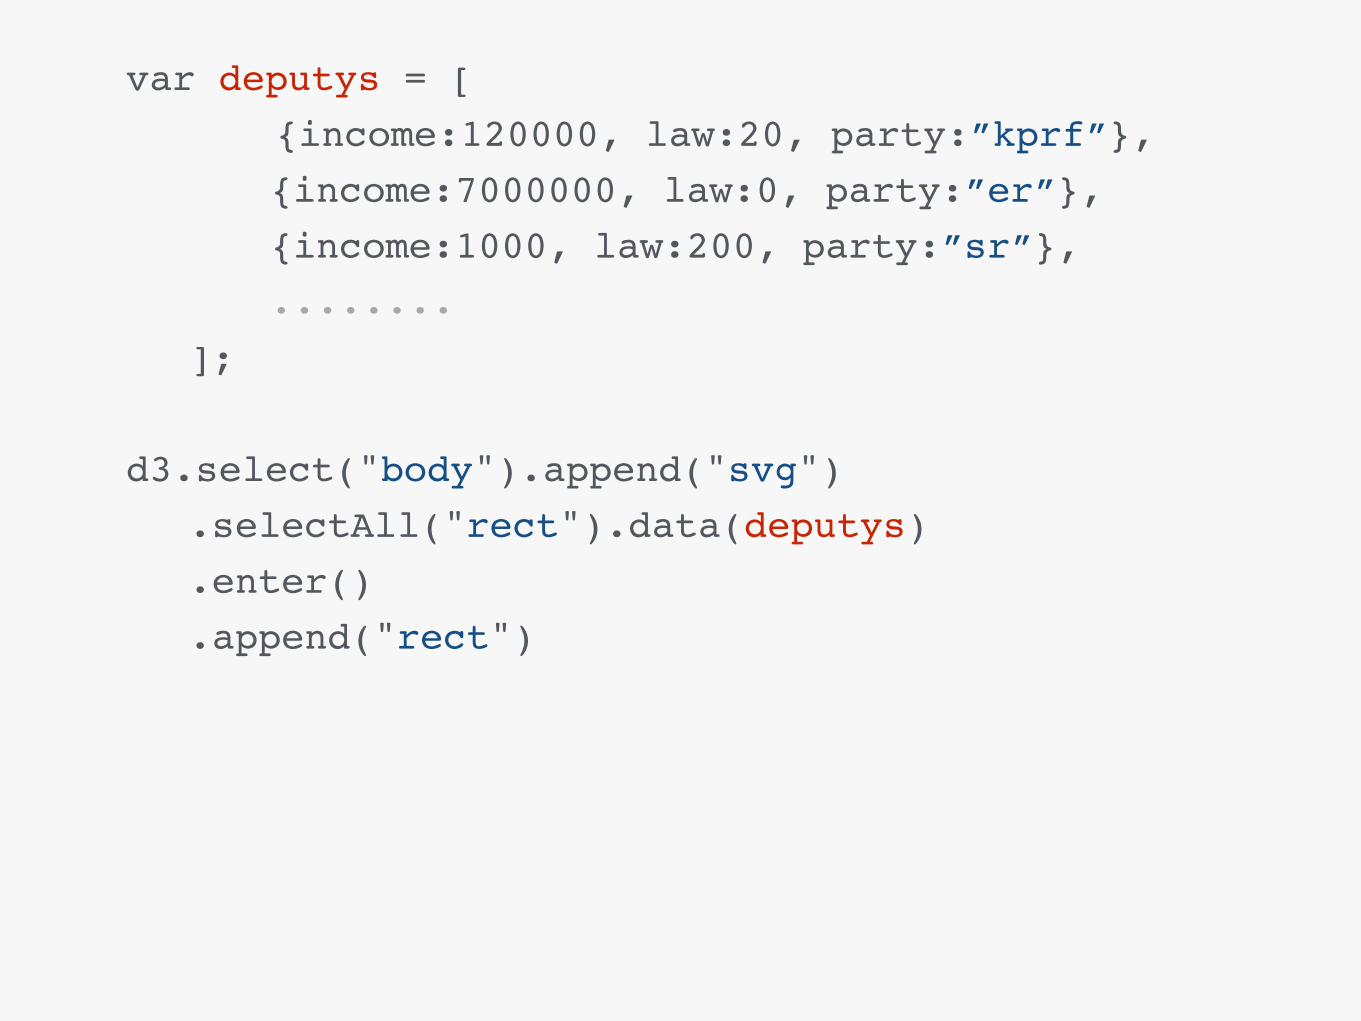
enter()
var deputys = [{income:120000, law:20, party:”kprf”}, {income:7000000, law:0, party:”er”},{income:1000, law:200, party:”sr”},........
];
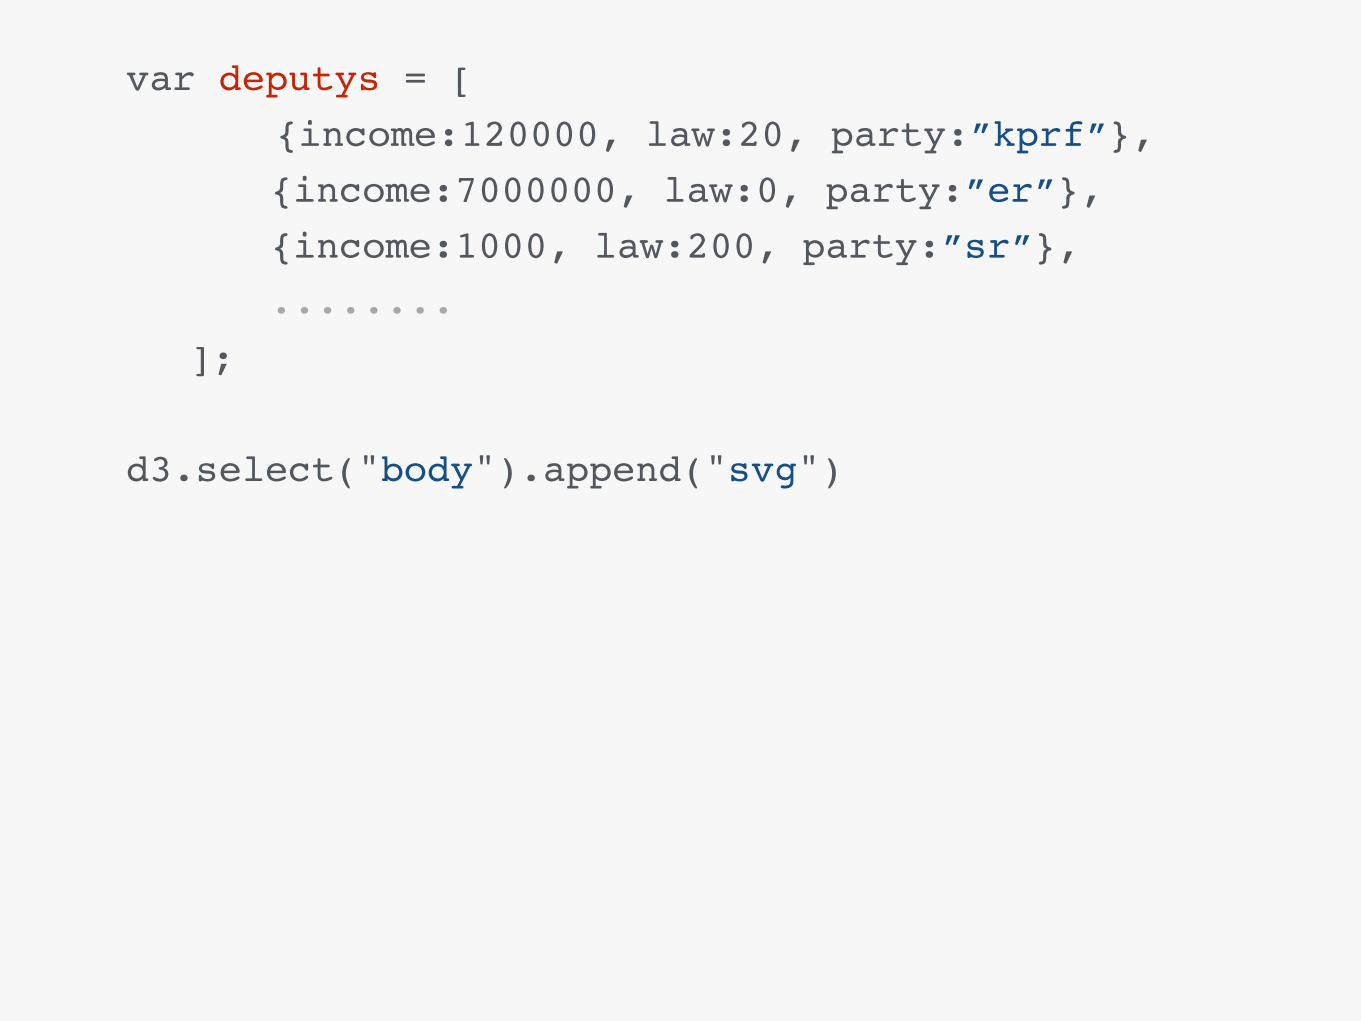
var deputys = [{income:120000, law:20, party:”kprf”}, {income:7000000, law:0, party:”er”},{income:1000, law:200, party:”sr”},........
];
d3.select("body").append("svg")
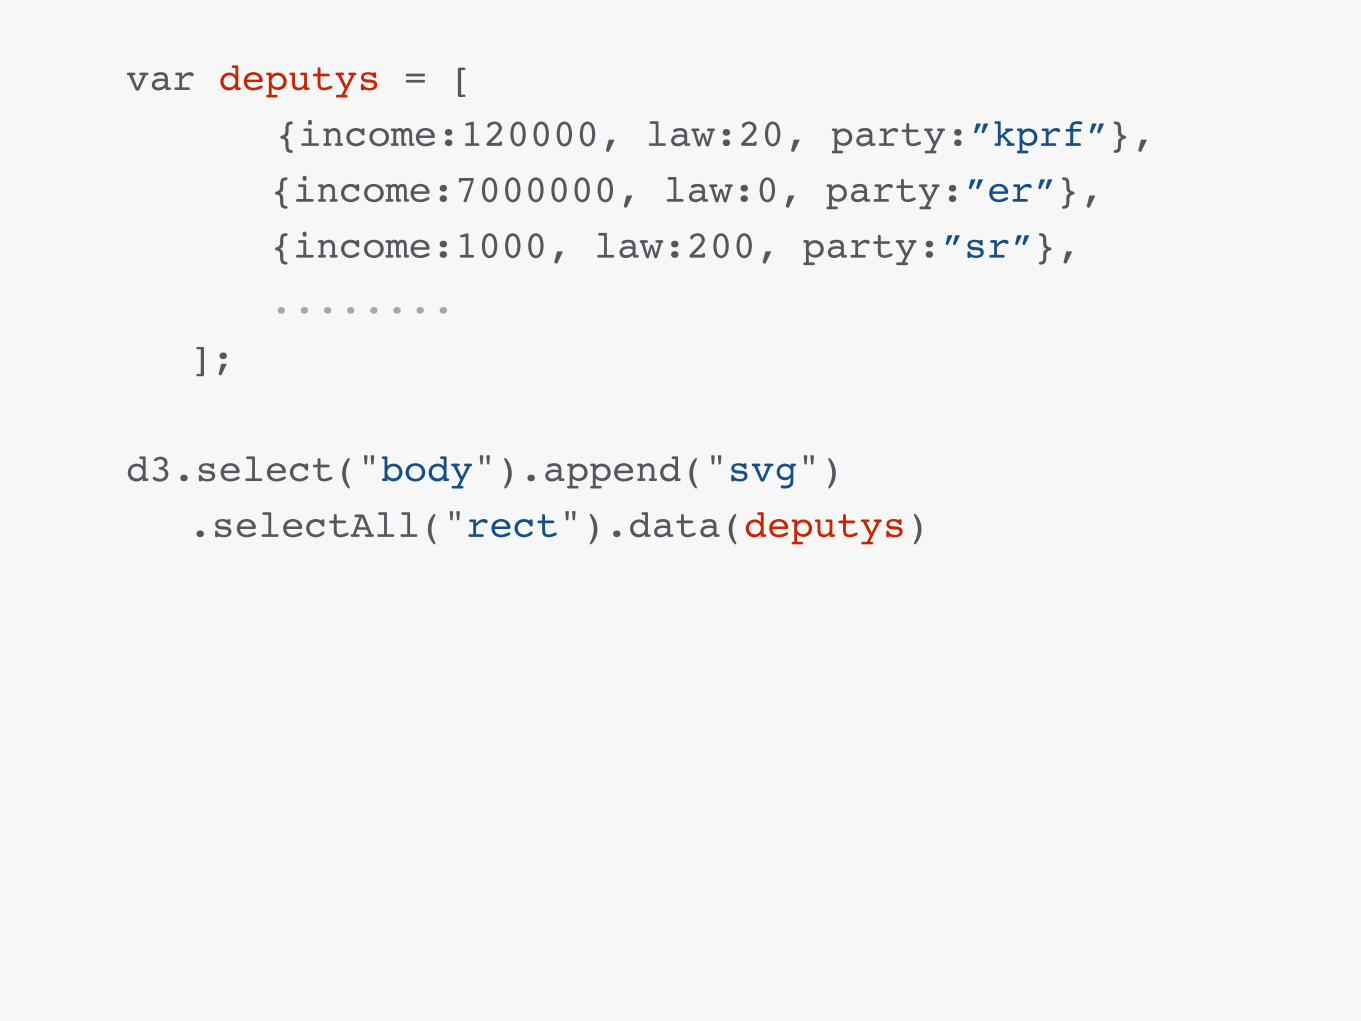
var deputys = [{income:120000, law:20, party:”kprf”}, {income:7000000, law:0, party:”er”},{income:1000, law:200, party:”sr”},........
];
d3.select("body").append("svg") .selectAll("rect").data(deputys)
var deputys = [{income:120000, law:20, party:”kprf”}, {income:7000000, law:0, party:”er”},{income:1000, law:200, party:”sr”},........
];
d3.select("body").append("svg") .selectAll("rect").data(deputys)
.enter()
.append("rect")
var deputys = [{income:120000, law:20, party:”kprf”}, {income:7000000, law:0, party:”er”},{income:1000, law:200, party:”sr”},........
];
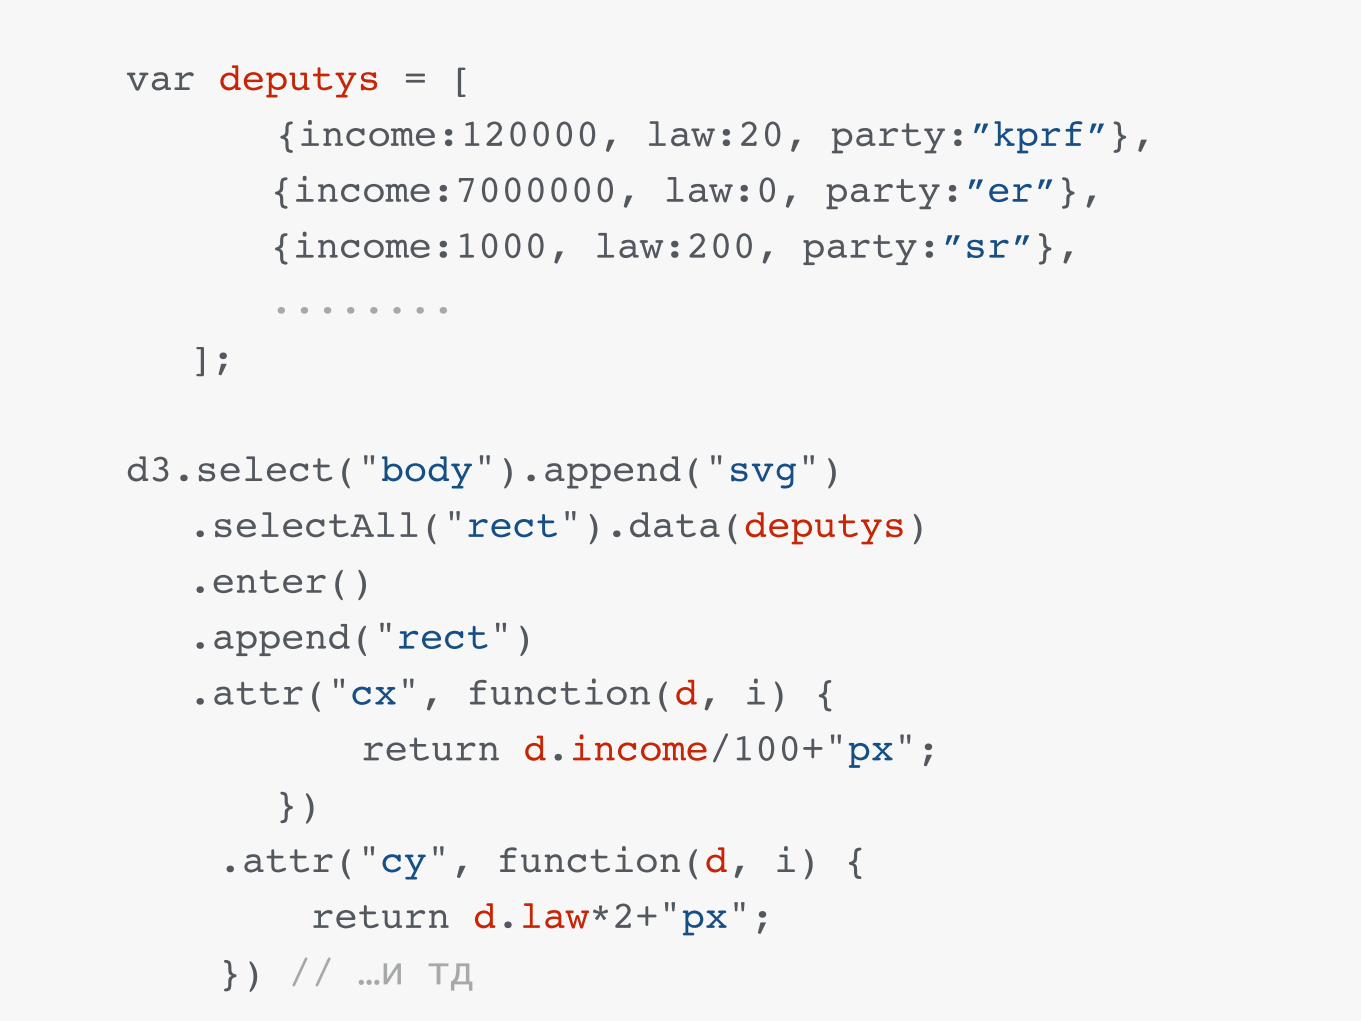
d3.select("body").append("svg") .selectAll("rect").data(deputys) .enter() .append("rect") .attr("cx", function(d, i) { return d.income/100+"px"; }) .attr("cy", function(d, i) { return d.law*2+"px"; }) // …и тд
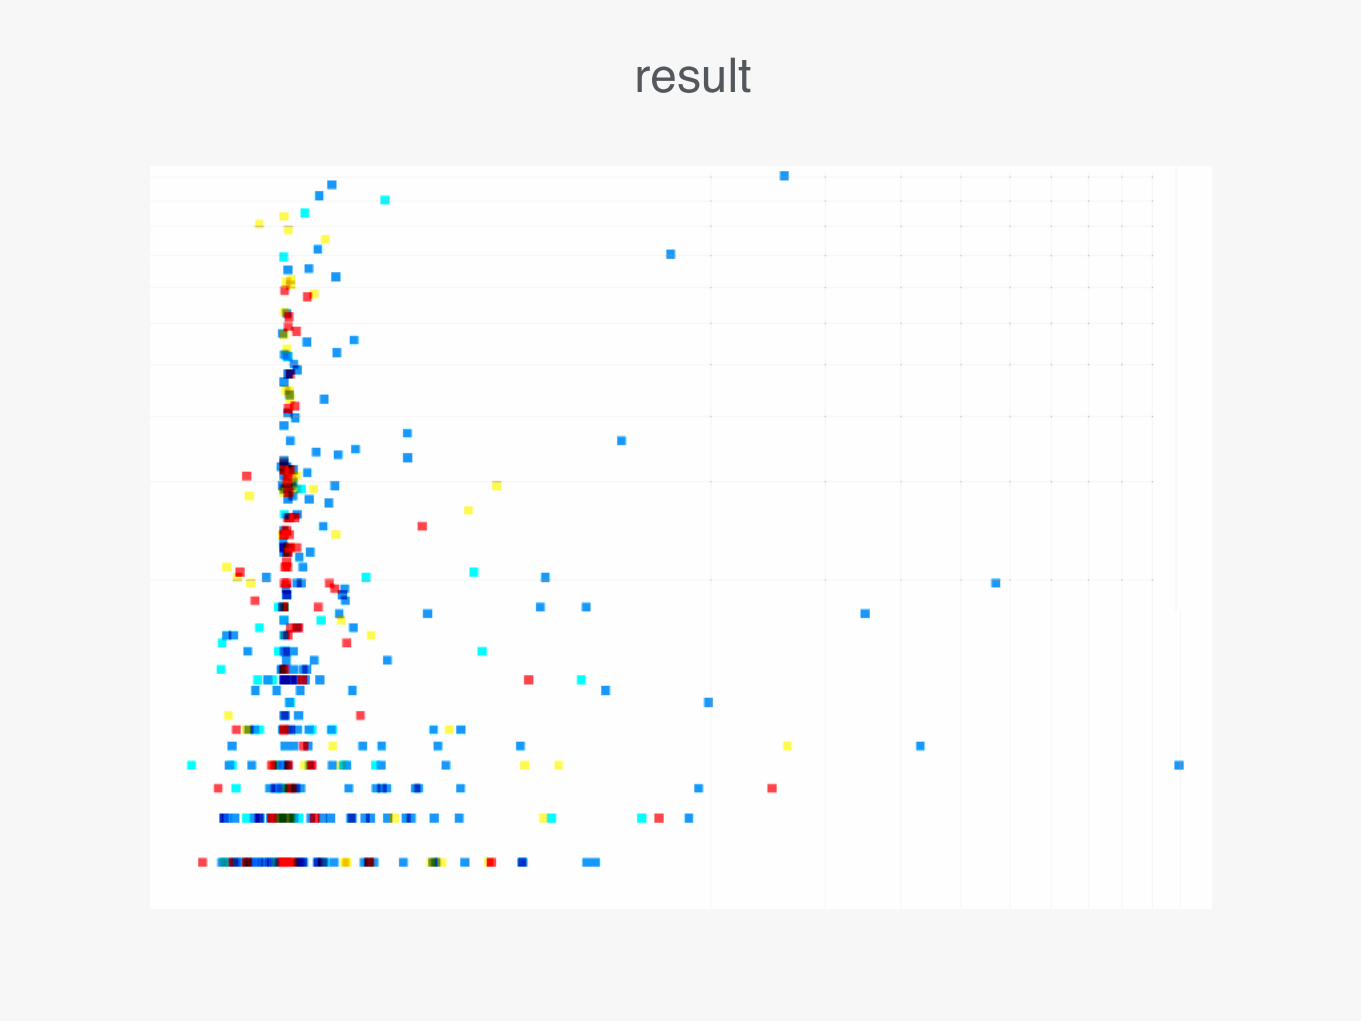
result

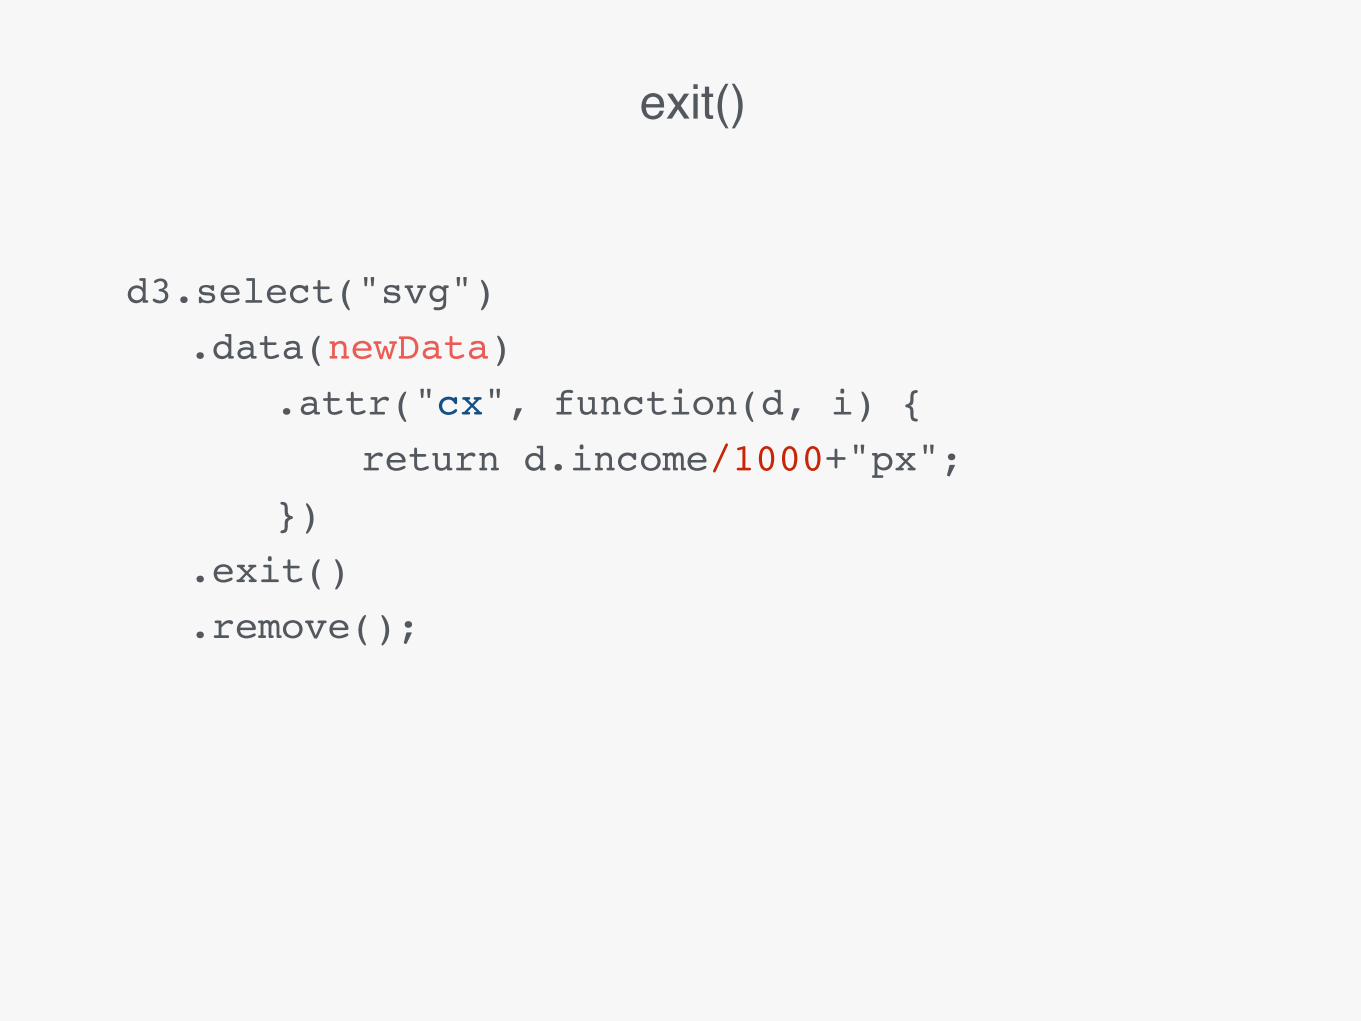
d3.select("svg") .data(newData)
.attr("cx", function(d, i) { return d.income/1000+"px"; })
.exit()
.remove();
exit()
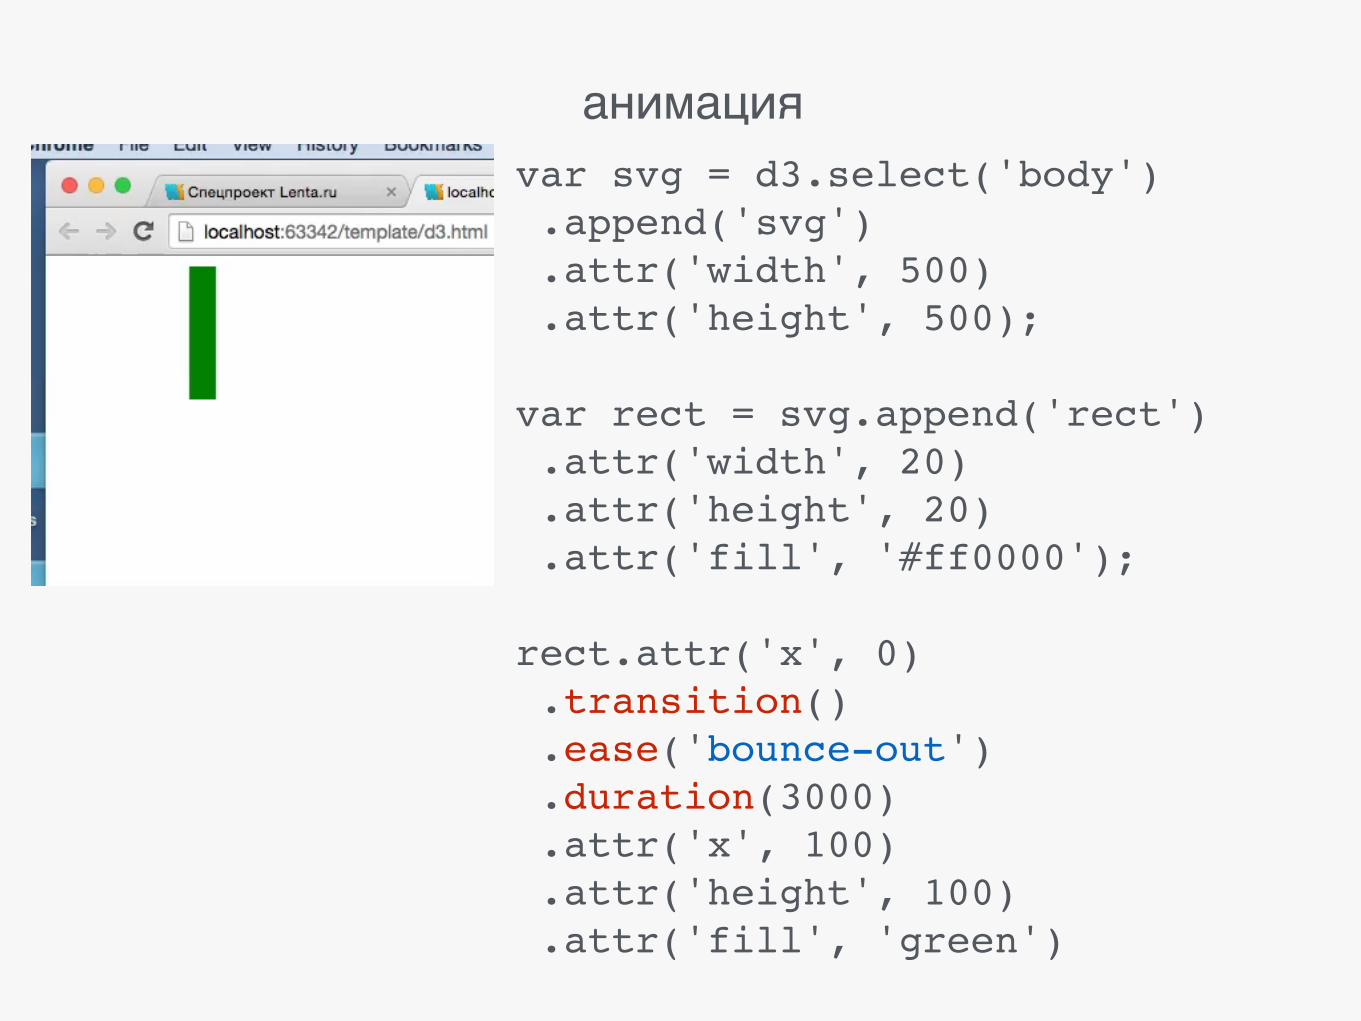
анимацияvar svg = d3.select('body').append('svg').attr('width', 500).attr('height', 500);var rect = svg.append('rect').attr('width', 20).attr('height', 20).attr('fill', '#ff0000');rect.attr('x', 0).transition() .ease('bounce-out').duration(3000) .attr('x', 100).attr('height', 100) .attr('fill', 'green')
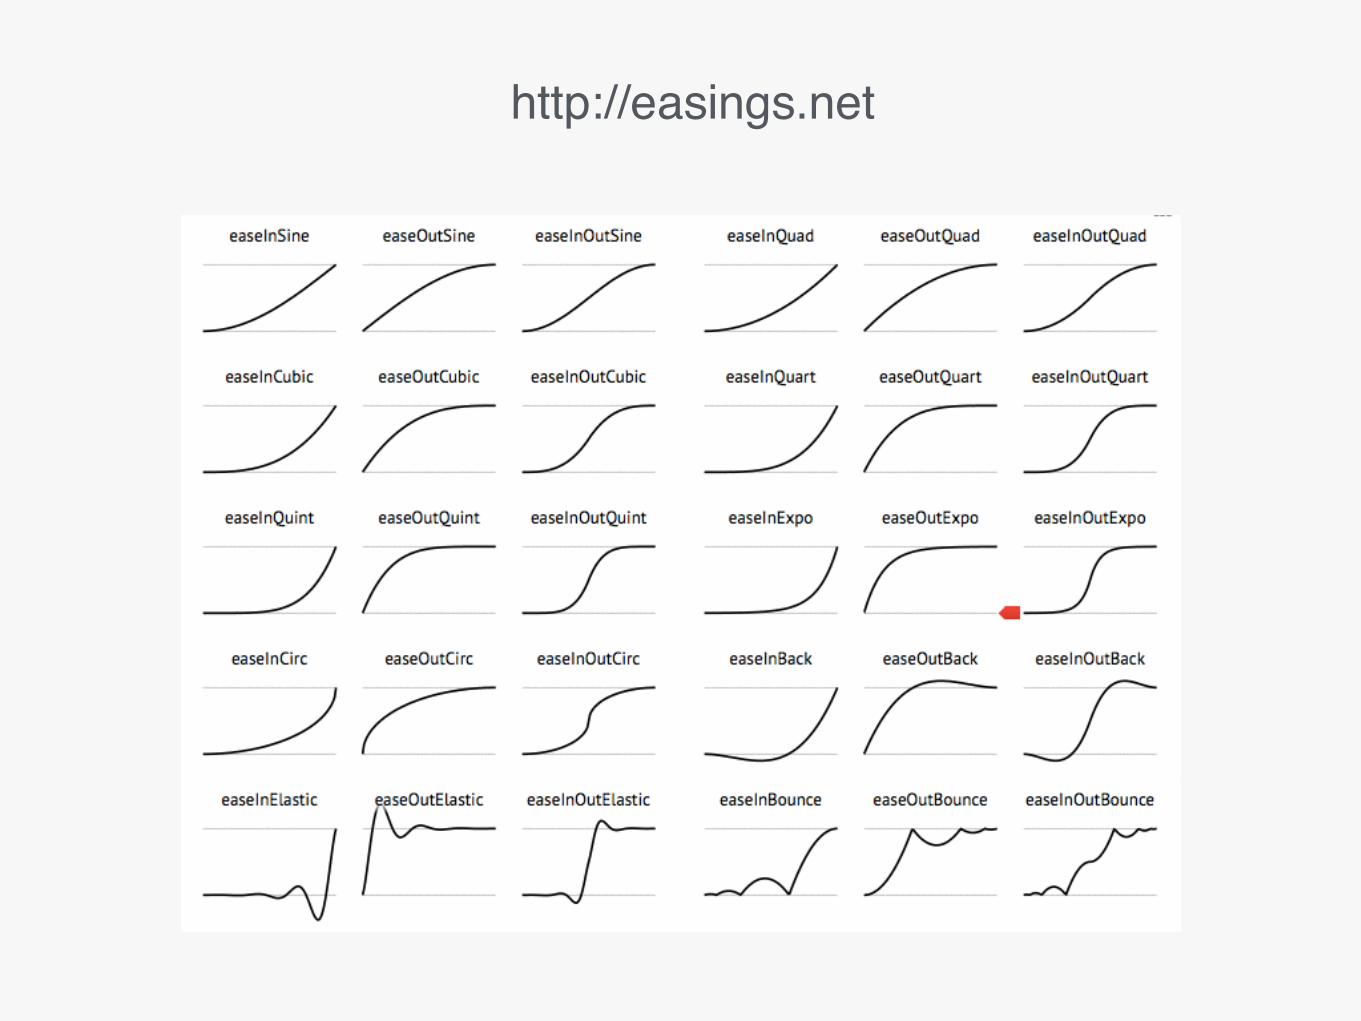
http://easings.net
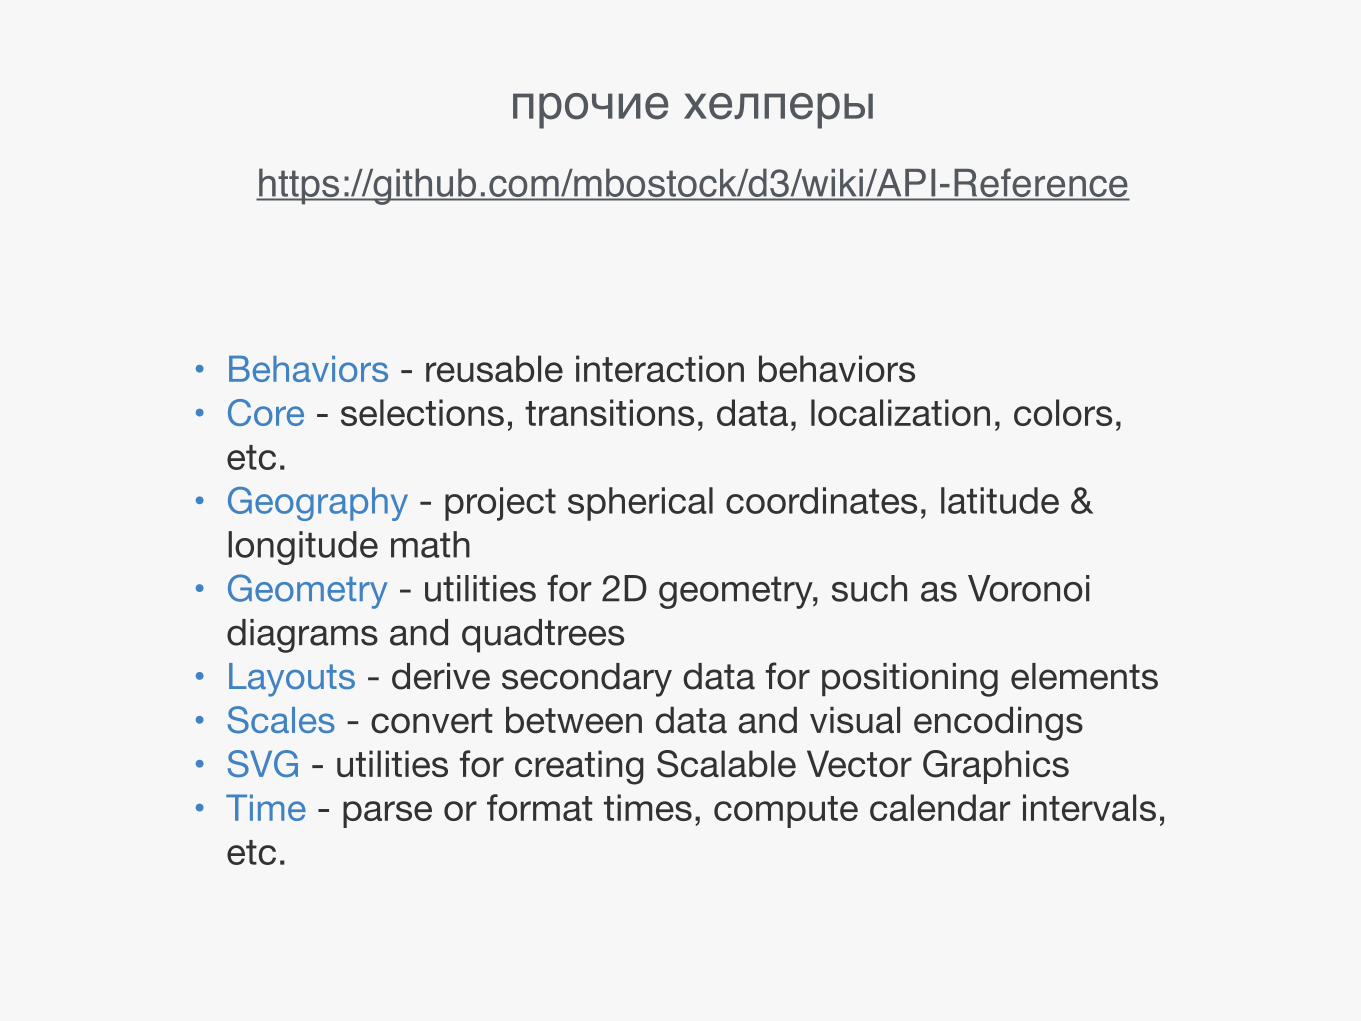
прочие хелперы
• Behaviors - reusable interaction behaviors • Core - selections, transitions, data, localization, colors,
etc. • Geography - project spherical coordinates, latitude &
longitude math • Geometry - utilities for 2D geometry, such as Voronoi
diagrams and quadtrees • Layouts - derive secondary data for positioning elements • Scales - convert between data and visual encodings • SVG - utilities for creating Scalable Vector Graphics • Time - parse or format times, compute calendar intervals,
etc.
https://github.com/mbostock/d3/wiki/API-Reference
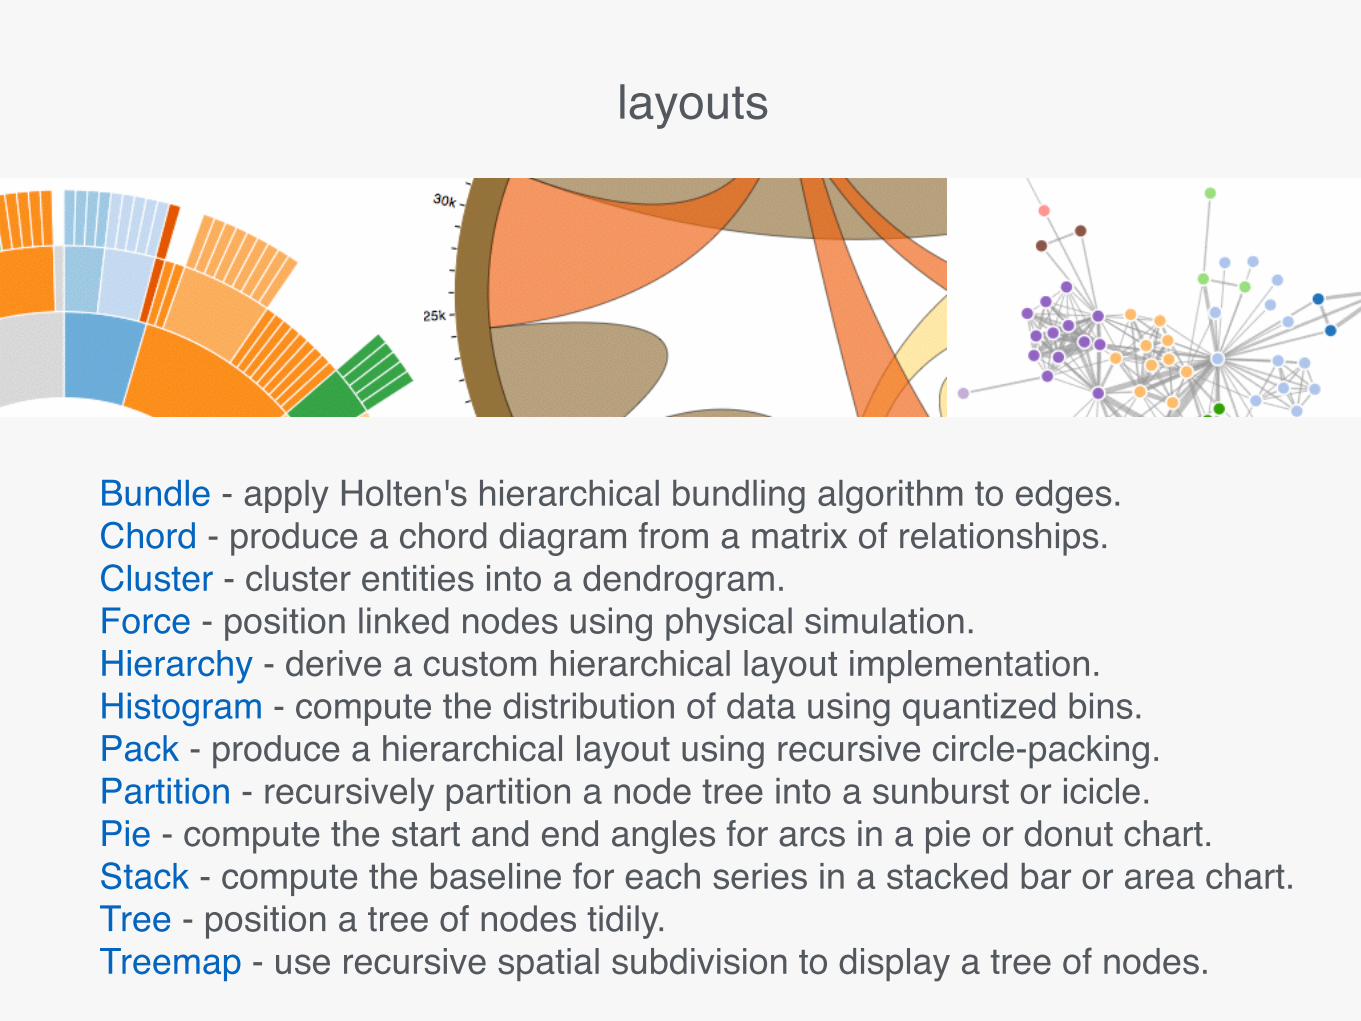
layouts
Bundle - apply Holten's hierarchical bundling algorithm to edges.Chord - produce a chord diagram from a matrix of relationships.Cluster - cluster entities into a dendrogram.Force - position linked nodes using physical simulation.Hierarchy - derive a custom hierarchical layout implementation.Histogram - compute the distribution of data using quantized bins.Pack - produce a hierarchical layout using recursive circle-packing.Partition - recursively partition a node tree into a sunburst or icicle.Pie - compute the start and end angles for arcs in a pie or donut chart.Stack - compute the baseline for each series in a stacked bar or area chart.Tree - position a tree of nodes tidily.Treemap - use recursive spatial subdivision to display a tree of nodes.
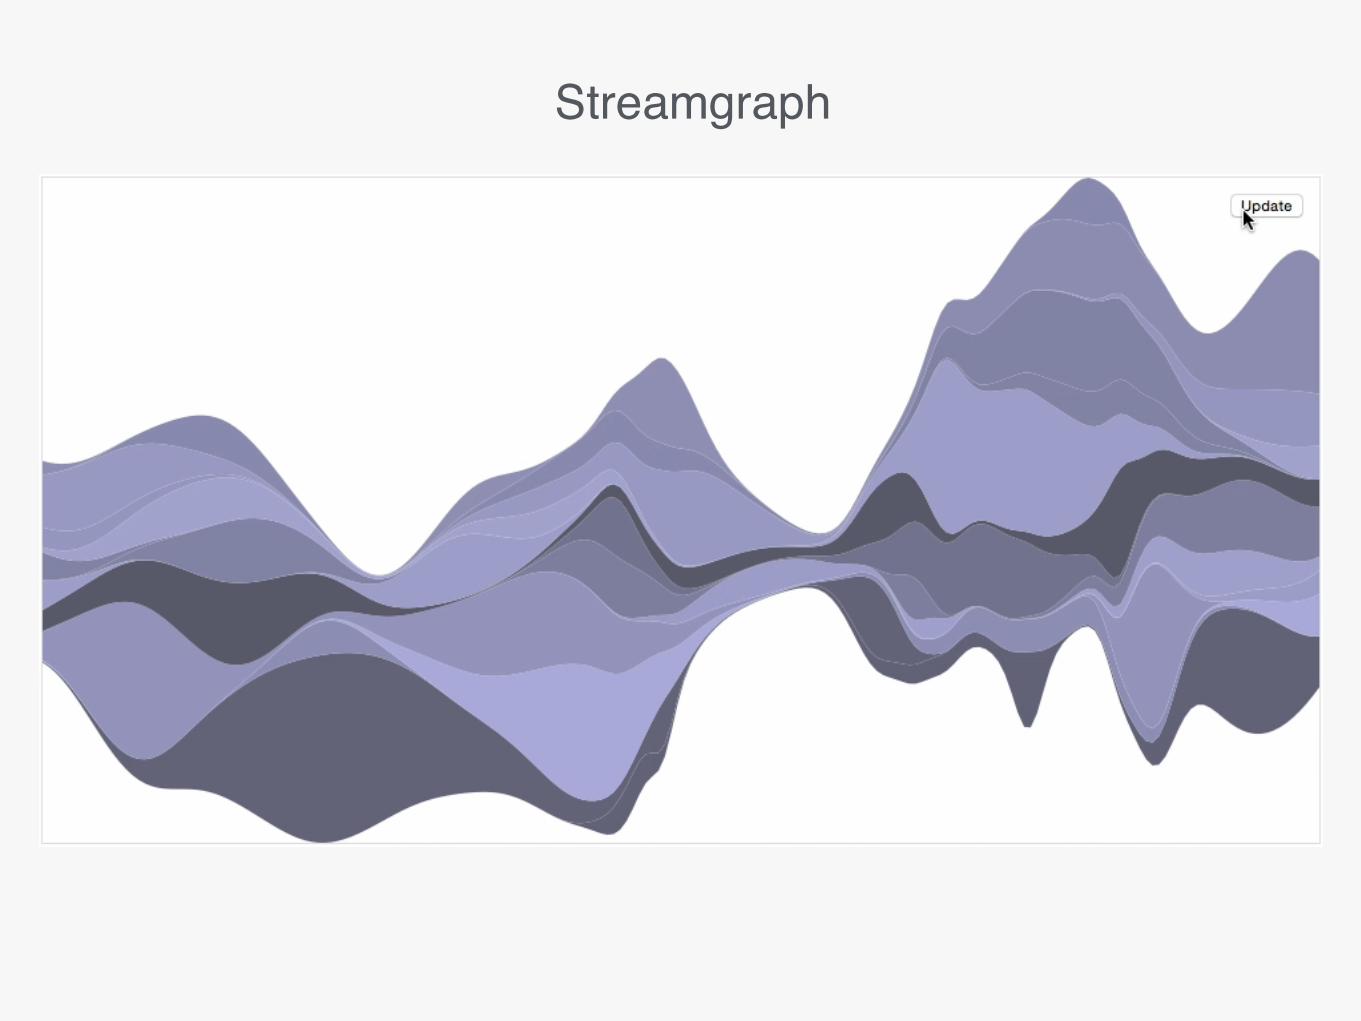
Streamgraph
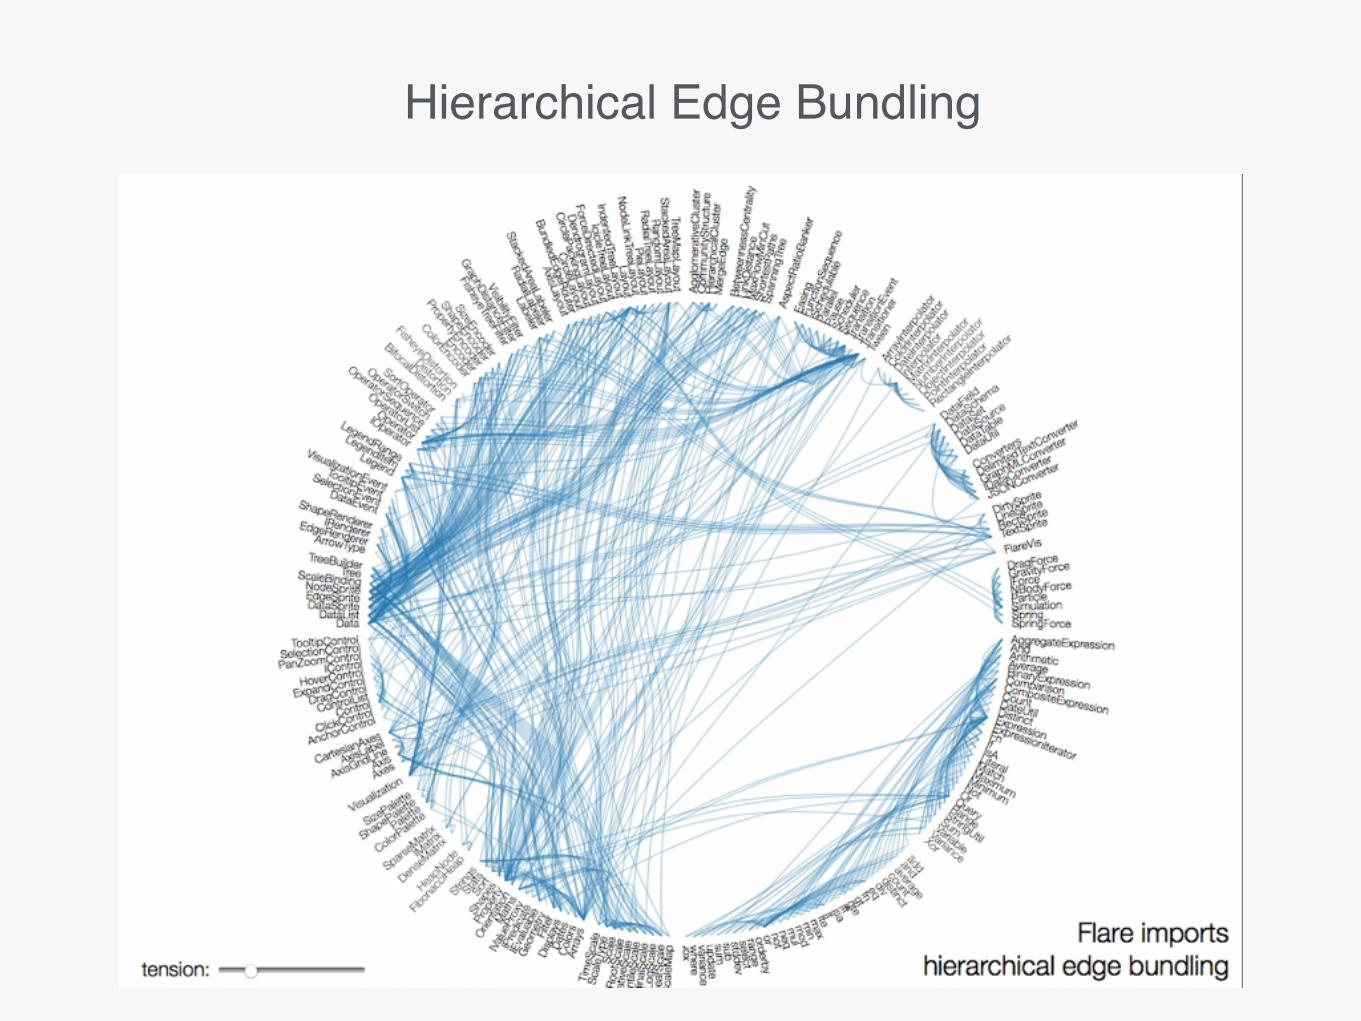
Hierarchical Edge Bundling
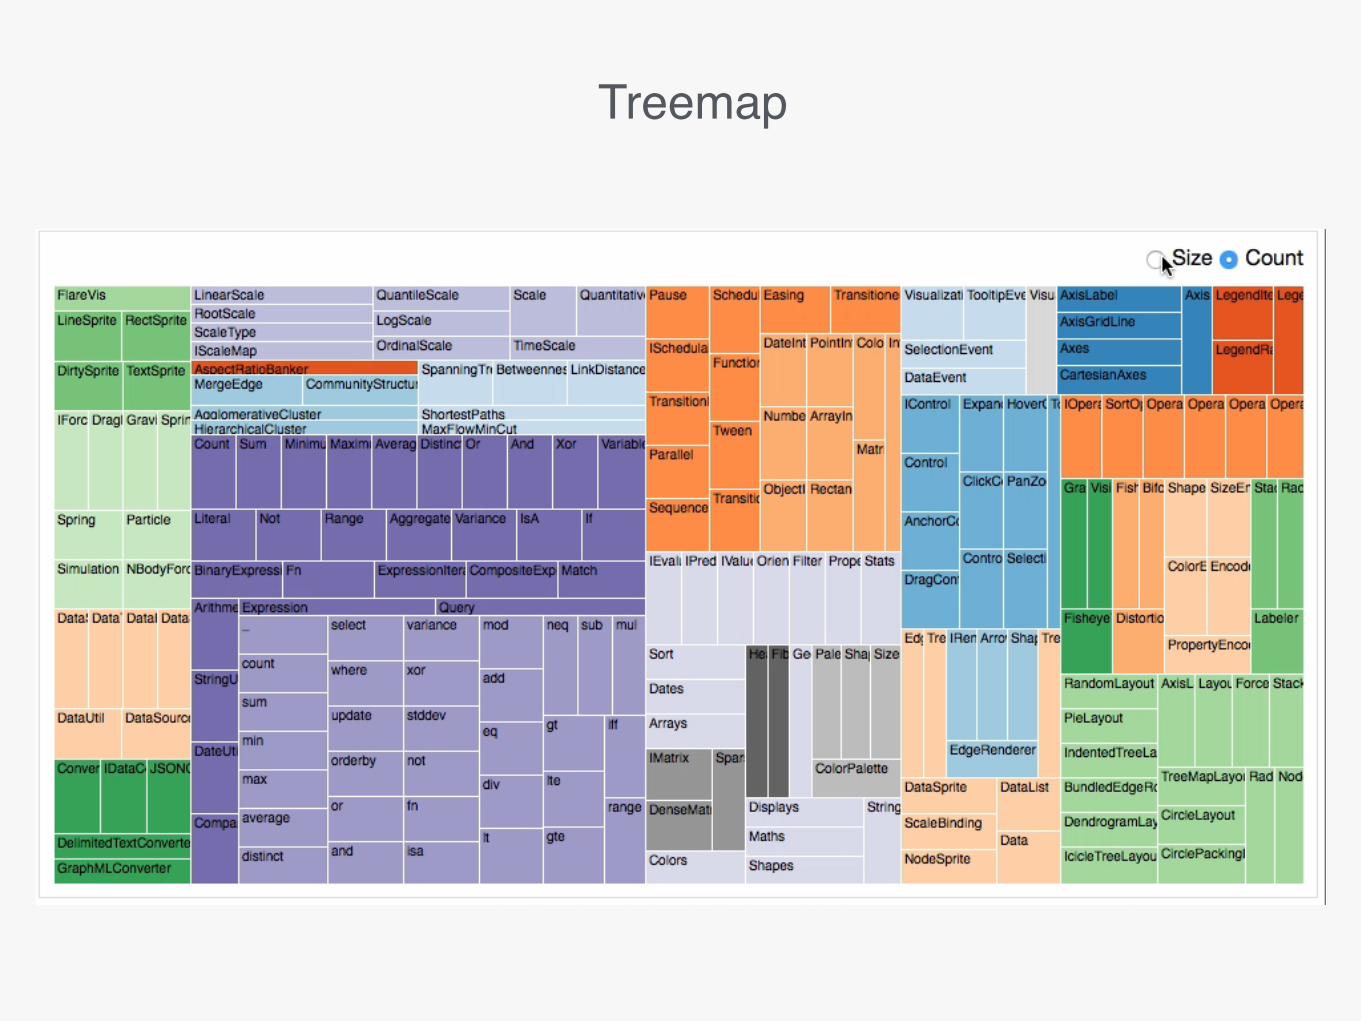
Treemap

Итого:
простобыстрокрасиво