03 인사이트를 줄 수 있는 google maps + cartodb...
TRANSCRIPT
인사이트를 줄 수 있는 Google Maps + CartoDB 활용사례 파헤치기 김선경 부장, (주)SPH


Contents
• CartoDB의 배경
• CartoDB의 특징?
• 분야별 활용 사례와 전달 가능한 가치는 무엇일까?
• CartoDB, Google Maps & Google Platform

CartoDB배경

CartoDB Profile Extract insights of your location data and create amazing data-driven customized visualizations
Enterprise Software, Data Visualization, Open Source, Location Based Services, Maps

You’ve heard that deforestation is destroying 200 kilometers of the world’s forests each day

CartoDB특징

CartoDB 주요 특징
Big geospatial data storage&processing, analyze
Support enterprise environment
Easy way to create map, share it
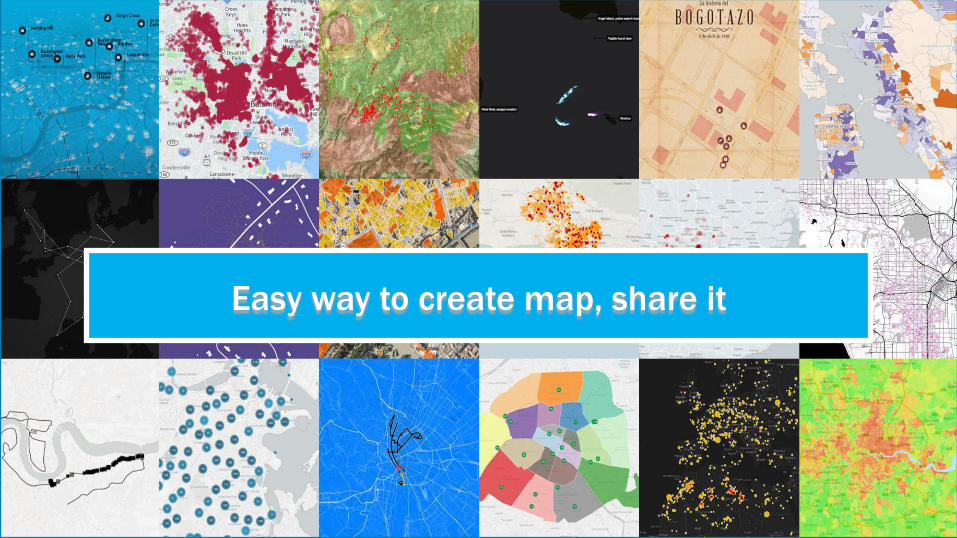
Easy way to create map, share it
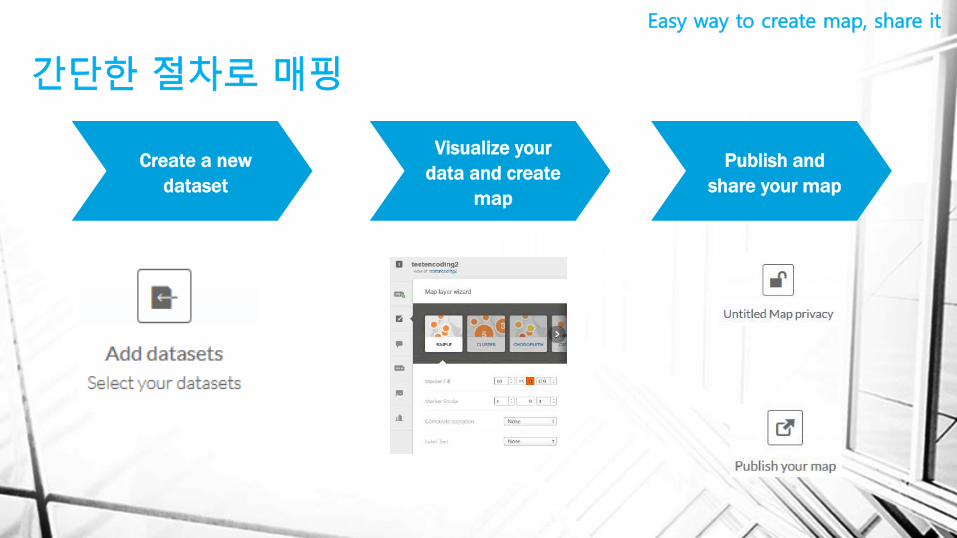
간단한 절차로 매핑
Easy way to create map, share it
Create a new dataset
Visualize your data and create
map
Publish and share your map

다양한 유형의 데이터 지원
Easy way to create map, share it
2015.11.4 Next...

시계열 데이터 분석
Easy way to create map, share it
Torque: CartoDB’s library for animating time-series data on maps. You can already build a range of Torque maps with point data in our Editor GUI: plotting dynamic events, social reactions, traffic patterns, categorical comparisons, and hotspots of activity.

DataCubes
Easy way to create map, share it
[TileCubes]

DataCubes
Easy way to create map, share it

시계열 데이터 분석
Easy way to create map, share it
Torque.js uses CartoDB to generate the TorqueTiles format by default.
TorqueTiles
Tiles
Metadata Tileset Information
A core set of information to be rendered
https://github.com/CartoDB/tilecubes
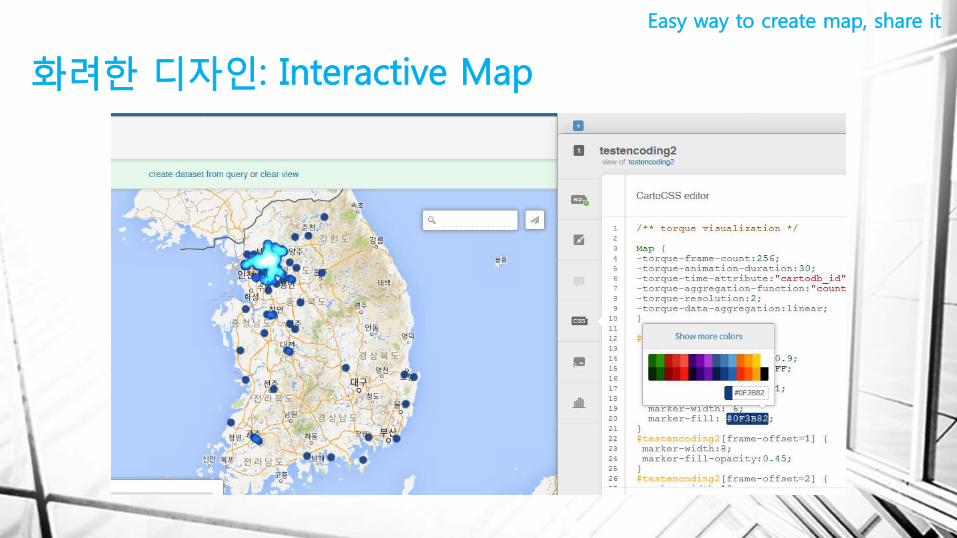
화려한 디자인: Interactive Map
Easy way to create map, share it

Base Map
Easy way to create map, share it
Custom Basemap Web Basemap

Share: Datasets에 대한 권한 설정
Easy way to create map, share it
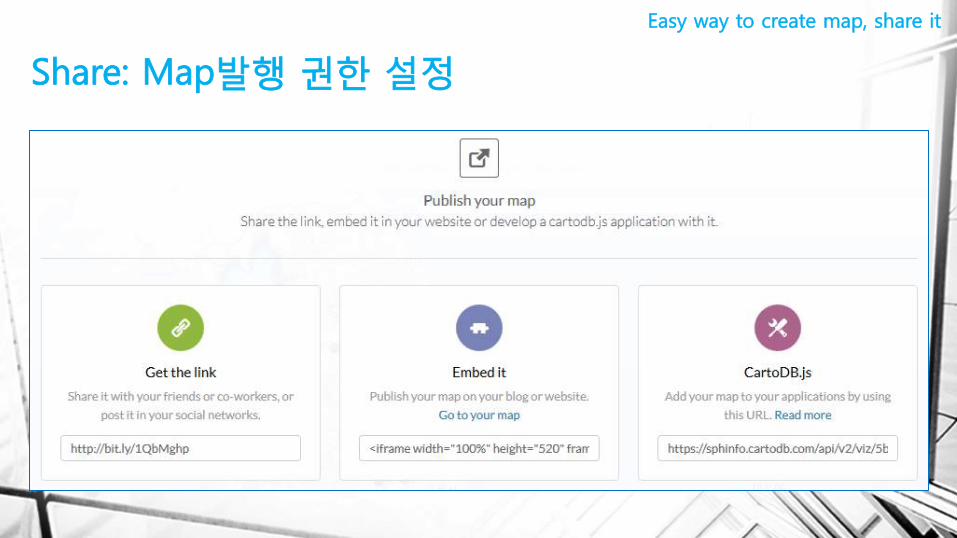
Share: Map발행 권한 설정
Easy way to create map, share it

Big Geospatial Data Storage&Processing, Analyze

PostGIS를 내장
Big Geospatial Data Storage&Processing, Analyze
• CartoDB is built on top of PostgreSQL using PostGIS extension
You have all the power of relational databases combined with hundreds of geospatial functions.

PostGIS를 내장: 예) ST_Buffer
Big Geospatial Data Storage&Processing, Analyze
Highway 61
“Highway 61”주변 25마일 지역은?

PostGIS를 내장: 예) ST_DWithin
Big Geospatial Data Storage&Processing, Analyze
“Highway 61”주변 25마일 지역에서 태어난 음악가는?

많이 사용되는 공간연산 기능
Big Geospatial Data Storage&Processing, Analyze
§ ST_Buffer § ST_Distance § ST_Transform § ST_Area § ST_Union § ST_Centroid
§ ST_SetSRID § ST_Collect § ST_Y § ST_X § ST_Intersection § ST_Contains
ST_Distance

Support Enterprise Environment

Enterprise Features
Support Enterprise Environment

Enterprise: On Premise
Support Enterprise Environment
Real Time Data Integration
CartoDB Editor
CartoDB Platform
Your Infra.

분야별 활용 사례는 무엇일까? 어떤 가치를 느낄 것인가?

Media and Creative Agency Goal: Generate brand awareness, engagement, and drive traffic to customer platform
Method: Easily integrated timely data into CartoDB to create a visualization that covered a trending media topic
Accomplishments: Increased awareness with nearly 6 M views
Created a cost effective high-traffic media campaign

Trend Analysis-Tour
Goal: : An interactive tool to analyze tourist spending in Spain during the summer of 2014.
Method: With data, on 5.4 million credit card transactions, we worked out how to visualize tourist spending effectively while optimizing the speed and performance of the application
Accomplishments: Insights https://www.youtube.com/watch?v=q4-Z24lZwwk&feature=youtu.be

Real Estate: Visualizing Connections with GROW.LONDON and CartoDB
Goal: : Diversifying Business Analytics Making Decisions for Better Cities Making Accurate Predictions
Method: An easy to use cloud-based GIS solution that generates beautiful and clear representations of London’s neighborhoods and districts. Accomplishments: Data-driven visualizations that measure population growth, economic output, housing prices, emerging market clusters, among many other insights, which monitors a timeline of developments across London.

CartoDB, Google Maps & Google Platform

Integration 효과
Millions of Points
Work Together
PostGIS Power
§ Google Cloud Platform § Google Maps API § Google Web Services
• Geocoding API • Google Street View API • .Google Direction API • ...
• Google Maps Library • Heatmap Library • ...
§ Dynamic rendering of maps, real-time data § 1000+ GIS Function
§ WebGL, CanvansLayer § Clustering § Torque
CartoDB, Google Maps & Google Platform

CartoDB API+Google Maps
CartoDB, Google Maps & Google Platform

감사합니다.
Location data is paramount to intelligent planning and development. Geographical information provides a common frame of reference and big picture analysis for entrepreneurs, citizens and policymakers alike. The new place-based thinking demonstrates that location can no longer be considered just a pin on a map. Location is now the dynamic nexus of the physical and digital in real time. The availability of geo-tagged digital data creates rich new layers of information that can be utilized at scale to create evolving solutions for more livable cities, intelligent policy and design, better research, improved emergency response, predictive analysis, and economic opportunity.
