1 extracting tree-way gene interactions from microarray data 郭士逢 輔仁大學生命科學系 9...
TRANSCRIPT
1
Extracting tree-way gene interactions from microarray data
郭士逢輔仁大學生命科學系
9 / 25 / 2008
Senior seminar: Microarray series
J Zhang, J Yuan, and L Zhang
Bioinformatics 2007, Vol 23, No 21, Page 2903-2909
2
Outlines
• Introduction• Method of extracting gene
interactions• Verify the triplets by using testing
data• Potential causes for the interaction• Discussion
3
Motivation
• High-throughput genomic data– Large amount of information hidden
there– Microarray gene expression profiling
data
• Too simplistic to access gene interactions by clustering using pairwise correlation as distance metric

4
Co-expression
• Co-expressed gene pairs are rare.– Restricted to special condition or
process– Ex. Special organ, specific
developmental stage, after a drug treatment, or particular disease state.
– Some of them only exist in cancer cell• A dynamic network
– Each link represents a significant pairwise correlation between two genes.
5
Alternative approach
• Assuming a third gene (controller) that can affect co-expression relationship.– Looking a three-way interaction
• Why not four or more?– Number of combinations too large– Most nodes in network with sparse
connection, except some hubs
6
Main issue
• How to screen and select gene triplets, in which correlation of two genes significantly associated with the expression level of a controller gene?

7
Data
• Microarray dataset containing– 678 samples from human cancer
tissue and cell lines– GEO, raw data, human, oncology,
Affymetrix, quantile normalization– Splitting data randomly into training
set and testing set of equal sizes– Triplets identified by training data
validated in testing data
8
Identify bimodal gene
• Determine whether log-expression of a gene is a single normal or a mixture of two normal distribution.
• If bimodal model fit better, find the threshold value to split the sample.– At least 60 samples in subgroup

9
Evaluate interactions
• Consider a gene triplet A, B and C• According bimodal expression of
controller C, split sample to two sub-groups: High and Low.
• Correlations between A and B in Low C group is r1, and r2 in High C.
• Transform ri to normal zi, and test if z1=z2. If z1≠Z2, we got it !
10
Results
• From 0.4 billion possible triplets of 1000 selected probe sets that have largest variance, we select the top 10,000 (|z| > 11.2) in Fig 1, and top 96 (|z| > 14.83) in Fig 2.
11


17
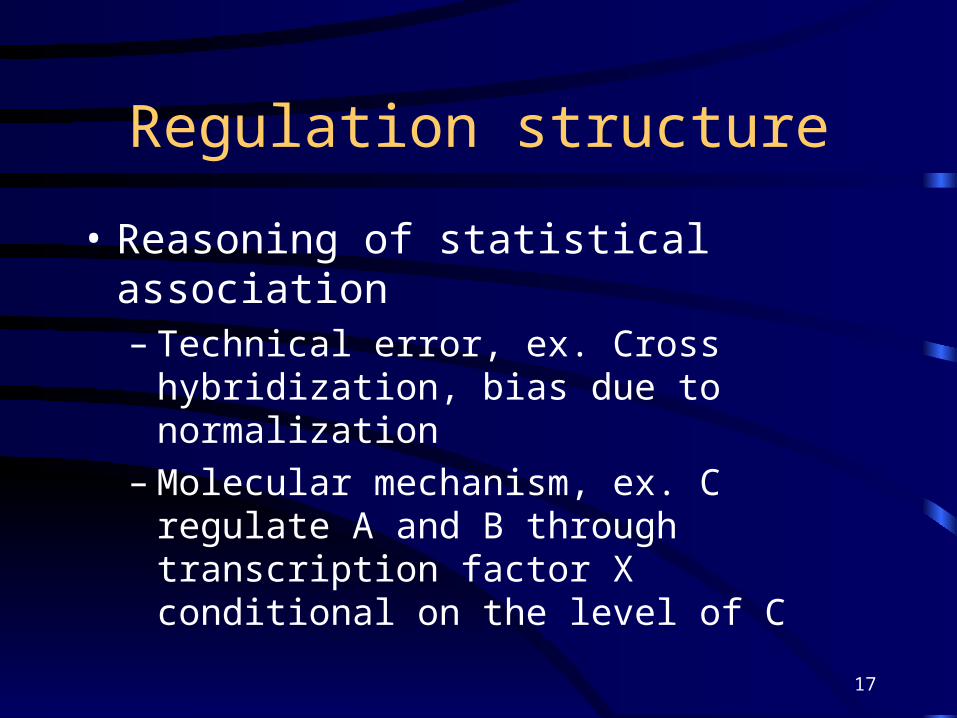
Regulation structure
• Reasoning of statistical association– Technical error, ex. Cross
hybridization, bias due to normalization
– Molecular mechanism, ex. C regulate A and B through transcription factor X conditional on the level of C

19
Discussion
• Other algorithms can identify three-way interactions. Results are consistant.
• Require further experiment to identify the underlying molecular interaction.
20
Extracting three-way gene interactions from
microarray data
生科碩一 497546116 林聖堯
指導教授 : 郭士逢老師
Jiexin Zhang, Yuan Ji and Li Zhang
Department of Bioinformatics and Computational Biology, The University of Texas, Anderson Cancer Center,USA
BIOINFORMATICS Vol. 23 no. 21 2007, p. 2903–2909

21
Introduction
• High-throughput genomic data are a rich resource for elucidating how genes are interconnected.
• It is an important and difficult task to extract gene network information from high-throughput genomic data.
• A common approach is to cluster genes using pairwise correlation.

22
Pairwise correlation
• Each link (edge) in the network represents a significant pairwise correlation between two genes evaluated from expression profiles of a subset of the microarray samples.
A B
A
D
CB
E
23
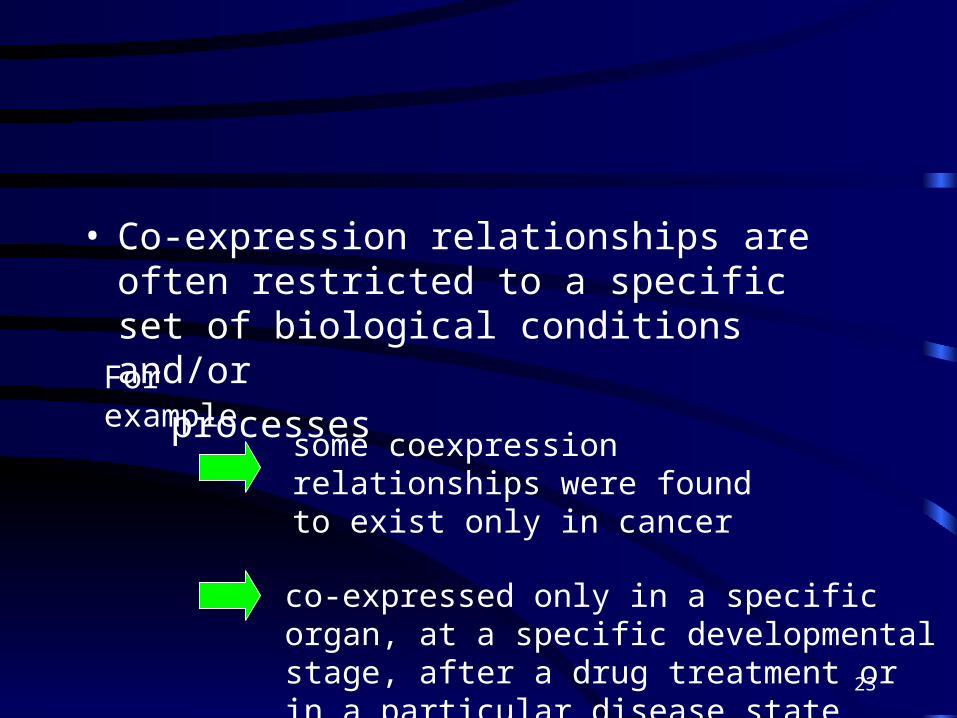
• Co-expression relationships are often restricted to a specific set of biological conditions and/or
processesFor example
some coexpression relationships were found to exist only in cancer
co-expressed only in a specific organ, at a specific developmental stage, after a drug treatment or in a particular disease state

24
Purpose
• Pairwise correlation is clearly too simplistic to describe the complex relationships among real genes since co-expression relationships are often restricted to a specific set of biological conditions/processes
• We assume that there is a third gene (named the controller gene hereinafter) associated with the biological conditions/modules that can affect the co-expression relationship.

25
• It is believed that the entire human gene network contains mostly nodes with sparse connections and only a small number of hubs that have a large number of connections
• It is reasonable to expect that the three-way interaction model should be a good approximation to many cases in the real network
A B
C
DEF
G
HI J
26
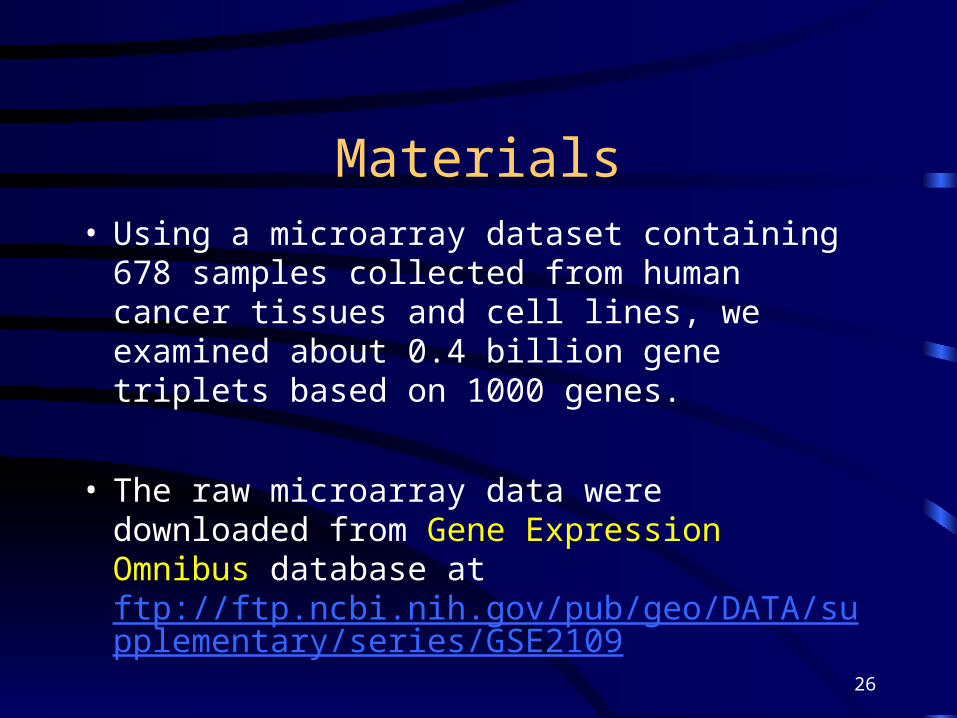
Materials • Using a microarray dataset containing 678
samples collected from human cancer tissues and cell lines, we examined about 0.4 billion gene triplets based on 1000 genes.
• The raw microarray data were downloaded from Gene Expression Omnibus database at ftp://ftp.ncbi.nih.gov/pub/geo/DATA/supplementary/series/GSE2109

27
Data pre-processing Process
Identify genes with bimodal expression profiles
Evaluating interactions in triplets
28
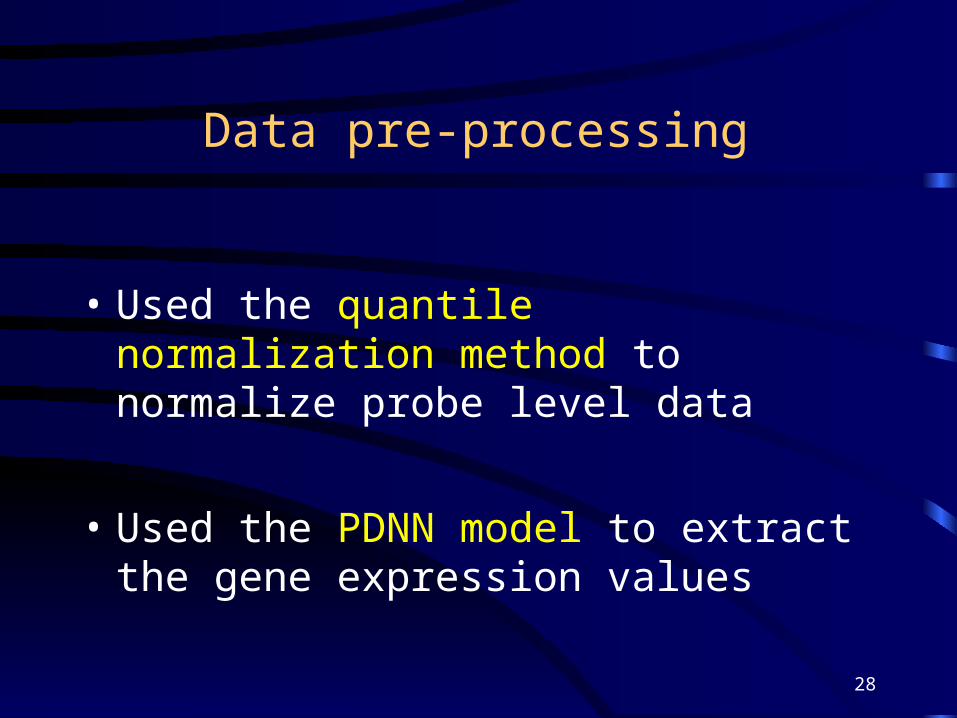
Data pre-processing
• Used the quantile normalization method to normalize probe level data
• Used the PDNN model to extract the gene expression values
29
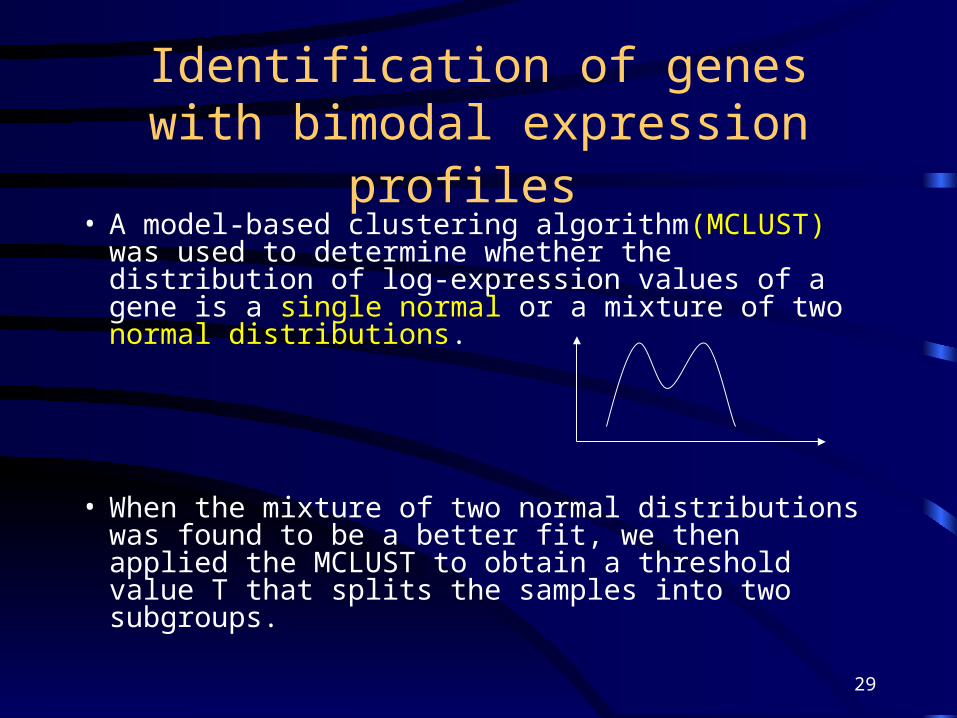
Identification of genes with bimodal expression profiles
• A model-based clustering algorithm(MCLUST) was used to determine whether the distribution of log-expression values of a gene is a single normal or a mixture of two normal distributions.
• When the mixture of two normal distributions was found to be a better fit, we then applied the MCLUST to obtain a threshold value T that splits the samples into two subgroups.

30
Evaluating interactions in a gene triplet
• We divided the 339 samples in the training set into a low expression group of n1 samples and a high expression group of n2 samples according to the expression levels of gene C
• Then, we computed r1, the Pearson correlation coefficient of the log-expression values between gene A and gene B from the n1 samples, and r2 from the n2 samples.
31
Evaluating interactions in a gene triplet
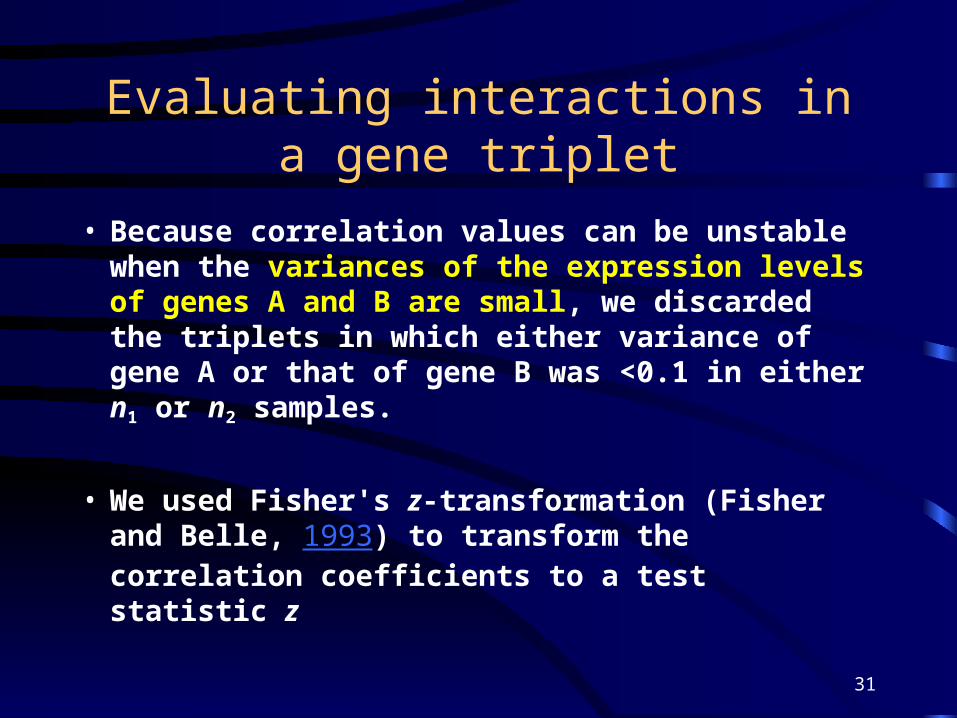
• Because correlation values can be unstable when the variances of the expression levels of genes A and B are small, we discarded the triplets in which either variance of gene A or that of gene B was <0.1 in either n1 or n2 samples.
• We used Fisher's z-transformation (Fisher and Belle, 1993) to transform the correlation coefficients to a test statistic z
32
(1) 如何去辨識出樣本中顯著的 triplets?
實驗項目

33
實驗項目
(1) 如何去辨識出樣本中顯著的 triplets?

34
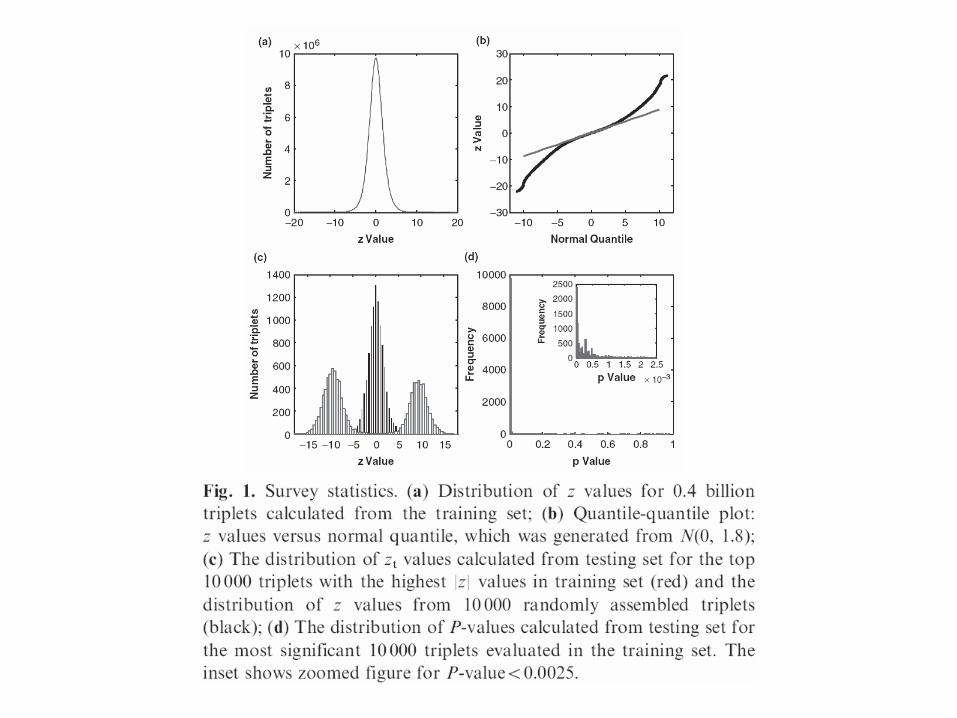
*Distribution of z values for triplets calculated from the
training set
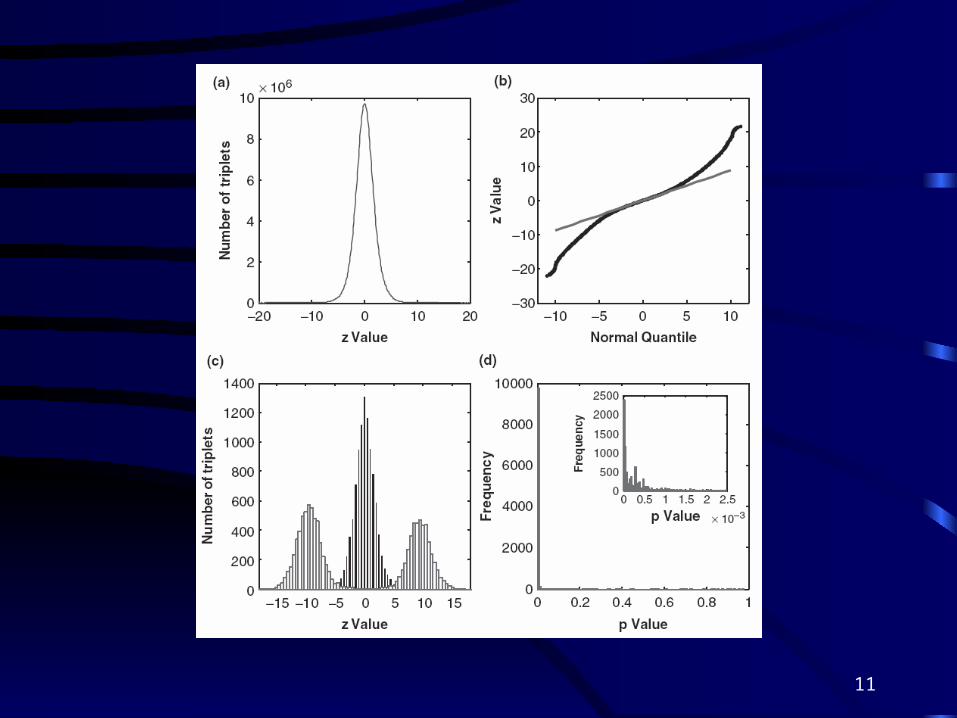
The central peak of the distribution of the 0.40 billion z values resembles a normal distribution
We found the variance of z values to be 1.88 instead of 1.0
Due to effects of pairwise correlations between test statistics
35
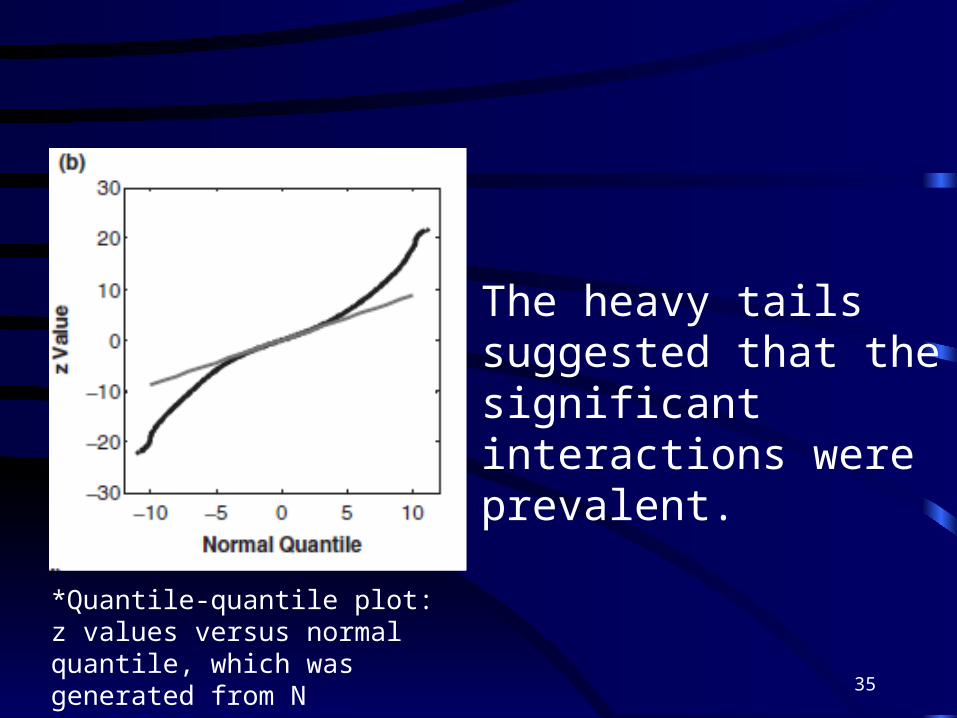
*Quantile-quantile plot: z values versus normal quantile, which was generated from N
The heavy tails suggested that the significant interactions were prevalent.

36
*The distribution of zt values calculated from testing set for the top 10 000 triplets with the highest |Z| values in training set (red) and the distribution of Z values from 10 000 randomly assembled triplets(black)
Due to the enormous size of the survey, false positives are very difficult to quantify accurately
We computed the z values using the testing set (Zt) for the 10 000 triplets that have the largest |Z| values (|Z|>11.2) evaluated from the training set.
We also randomly selected 10 000 triplets in the testing set and computed their Z values (Zrandom)

37
*The distribution of P-values calculated from testing set forthe most significant 10 000 triplets evaluated in the training set. Theinset shows zoomed figure for P-value50.0025.
Most of the resulting P-values are very small (97.8% of them are<0.01).
38
實驗項目
(2) 如何去解釋所建立triplets 的關係是否存在 ?
39
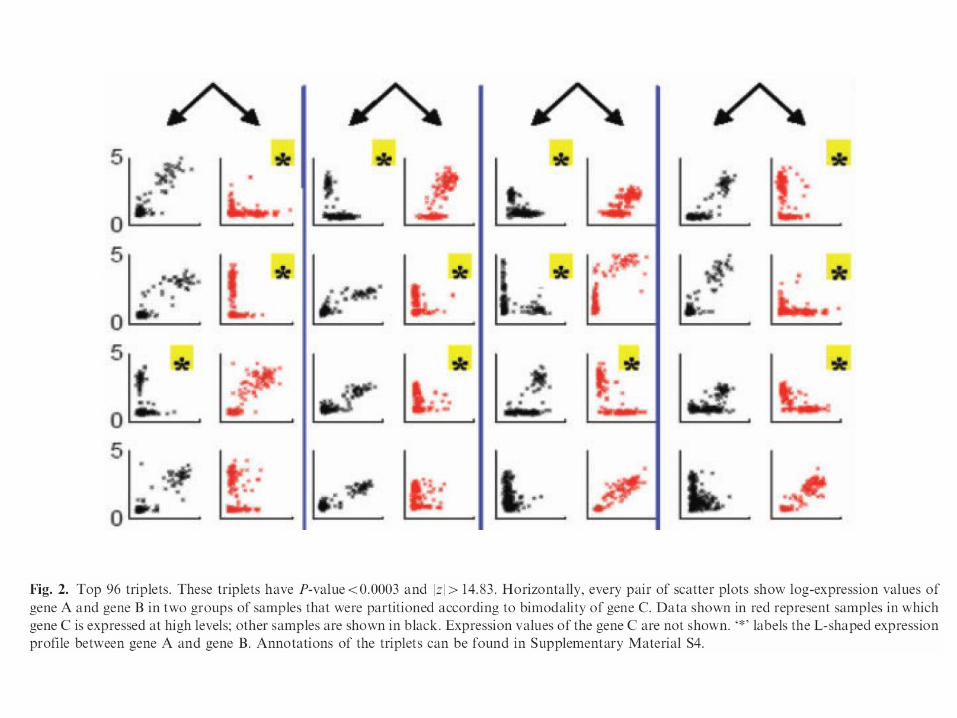
• We observed an interesting reoccurring pattern from the top triplets with the highest |z| values
• The ‘L’-shape reflects a mutually exclusive relationship within the gene pair
40
(2-1)
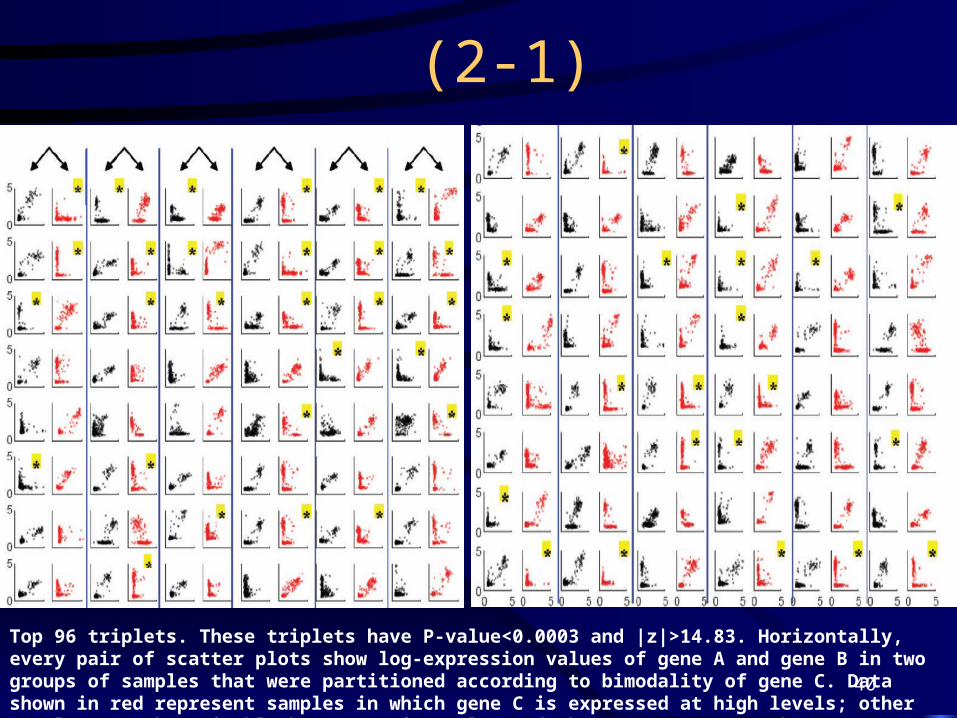
Top 96 triplets. These triplets have P-value<0.0003 and |z|>14.83. Horizontally, every pair of scatter plots show log-expression values of gene A and gene B in two groups of samples that were partitioned according to bimodality of gene C. Data shown in red represent samples in which gene C is expressed at high levels; other samples are shown in black. Expression values of the gene C are not shown.
41
(2-2)
• We presented two examples in detail
• The first example involves genes CFTR (cystic fibrosis transmembrane conductance regulator, ATP-binding cassette), MYB (v-myb myeloblastosis viral oncogene homolog) and USH1C (Usher syndrome 1C)
• Previous studies indicate that both MYB and CFTR are regulated by NF-κB
42
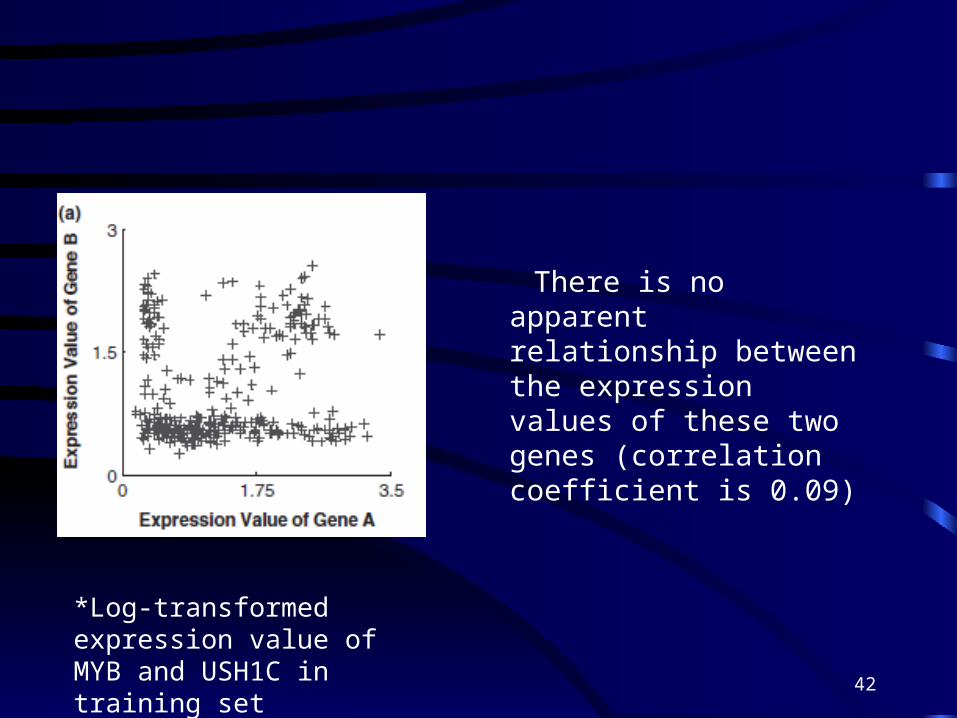
There is no apparent relationship between the expression values of these two genes (correlation coefficient is 0.09)
*Log-transformed expression value of MYB and USH1C in training set

43
*The histogram of log-transformed expression value of CFTR with the red bar indicating separation of the bimodal distribution
By separating samples into two subgroups according to the bimodality of CFTR, the relationship between MYB and USH1C emerges
44
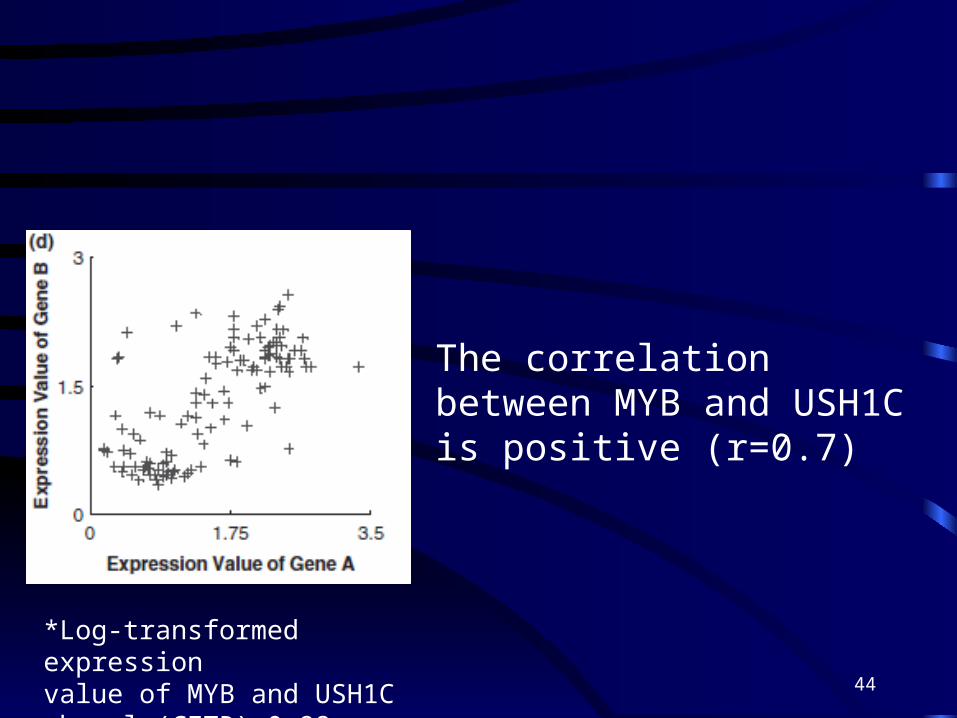
*Log-transformed expressionvalue of MYB and USH1C when ln(CFTR)>0.98
The correlation between MYB and USH1C is positive (r=0.7)
45
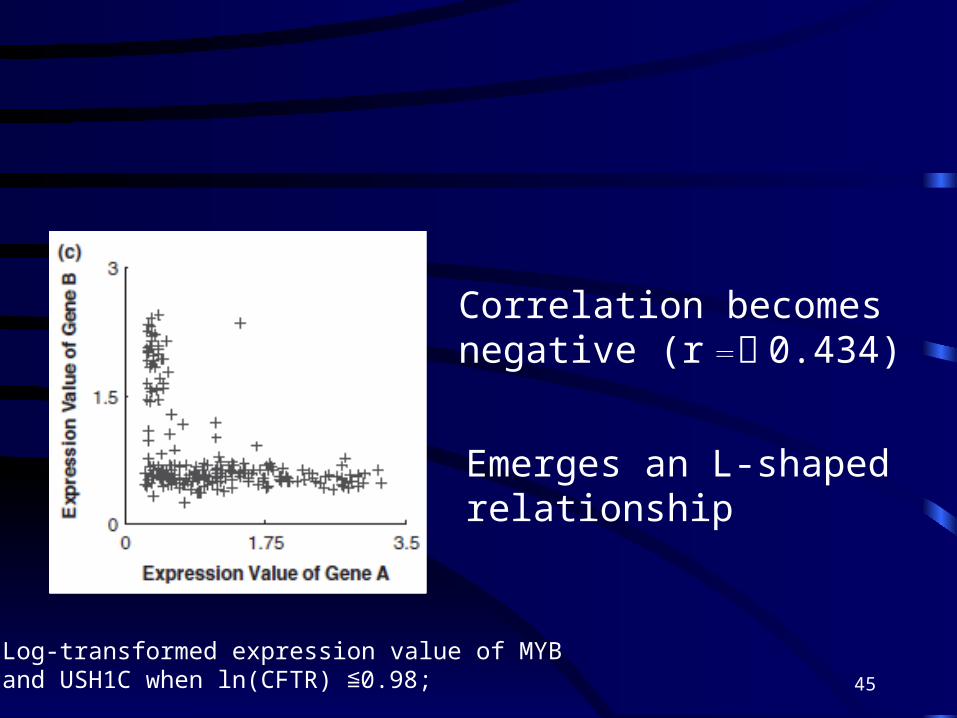
Log-transformed expression value of MYBand USH1C when ln(CFTR) 0.98;≦
Emerges an L-shaped relationship
Correlation becomes negative (r =﹣ 0.434)
46
• In the second example, the genes involved are Kruppel-like factor 5 (KLF5), cadherin 6 type 2 (CDH6) and UDP glucuronosyltransferase 1 family, polypeptide A (UGT1A).
47
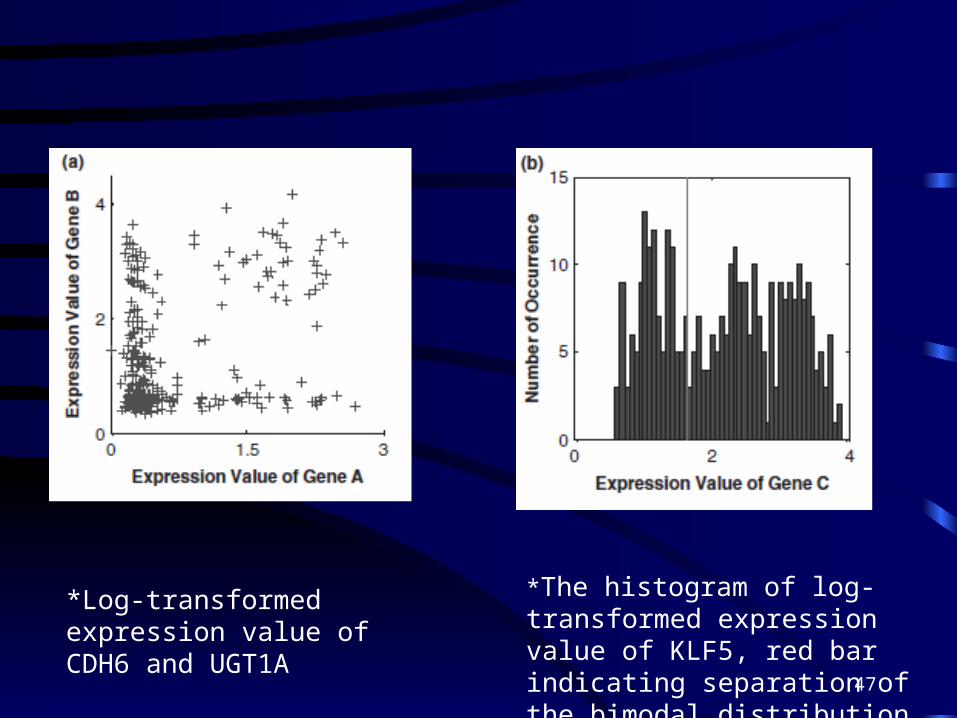
*Log-transformed expression value of CDH6 and UGT1A
*The histogram of log-transformed expression value of KLF5, red bar indicating separation of the bimodal distribution
48
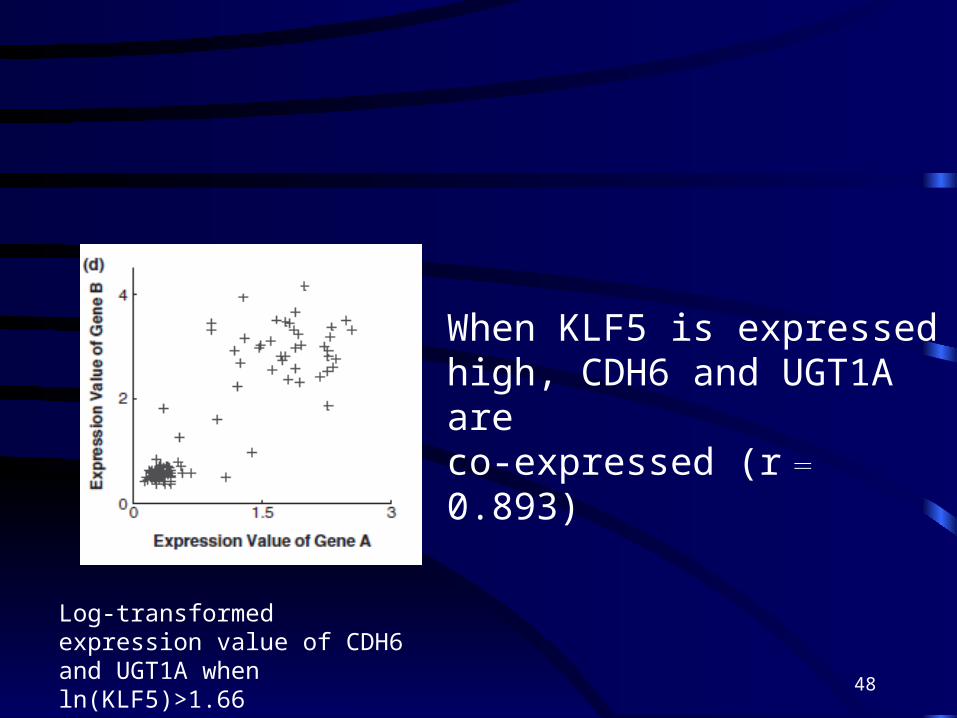
Log-transformed expression value of CDH6 and UGT1A when ln(KLF5)>1.66
When KLF5 is expressed high, CDH6 and UGT1A are co-expressed (r = 0.893)

49
*Log-transformed expression value of CDH6 and UGT1A when ln(KLF5) 1.66≦
When KLF5 is expressed low, CDH6 and UGT1A show an ‘L’-shaped relationship (r –=0.313)
50
(2-3)
• We investigated if the ‘L’-shaped relationships shown in Figures 2–4 were caused by expressions of tissue specific genes
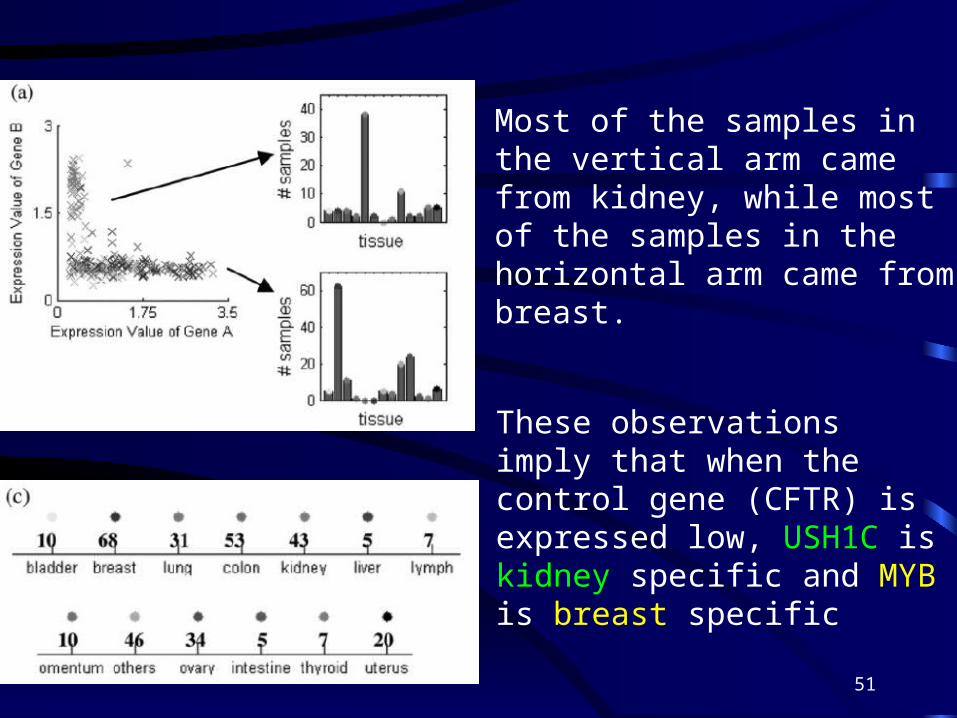
51
Most of the samples in the vertical arm came from kidney, while most of the samples in the horizontal arm came from breast.
These observations imply that when the control gene (CFTR) is expressed low, USH1C is kidney specific and MYB is breast specific

52
Colon samples dominated the vertical arm, but no tissue type appeared to dominate the horizontal arm
These examples suggest that in some of the cases the ‘L’-shaped relationships involve tissue specific genes while in others the ‘L’-shaped relationships are not related to tissue types.
53
Discussion
• A significant gene triplet (A, B and C) is supposed to exhibit the following traits:
(1)Gene C’s expression profile displays bimodality, which enables us to partition the samples (arrays) into a high expression group and a low expression group
(2) Correlation of expression between genes A and B in the high expression group is significantly different from that in the low expression group.
54
Discussion
• Our survey was designed with the following molecular mechanisms in mind:
• It will require further experimentation to identify the underlying molecular interactions that drive the observed statistical associations found in the significant triplets
A transcription factor X, which regulates both gene A and B, is conditional on the expression level of gene C. However, the X is unknown, and its relationship to C is not determined by our method. Gene C may encode X. Alternatively, gene C may regulate X’s activity through some intermediate agents.
55
Thank you for your attention!