1 simple regression ( 簡單迴歸分析 ) social research methods 2109 & 6507 spring, 2006...
Post on 19-Dec-2015
237 views
TRANSCRIPT
1
Simple Regression ( 簡單迴歸分析 )
Social Research Methods 2109 & 6507
Spring, 2006
March 8, 9, 13, 2006
2
From Correlation to Regression:
• Correlation ( 相關分析、相關係數 ): measures the strength of linear association between 2 quantitative variables ( 二變數線性關係的強度 )
• Regression ( 迴歸分析 ): 1. Description ( 描述 ): summarize the relationshi
p between the two variables with a straight line, what does the line look like? ( 如何用一直線描述二變數的關係 ?)
2. Prediction ( 預測 ): how to make predictions about one variable based on another? ( 如何從一變數預測另一變數 ?)
3
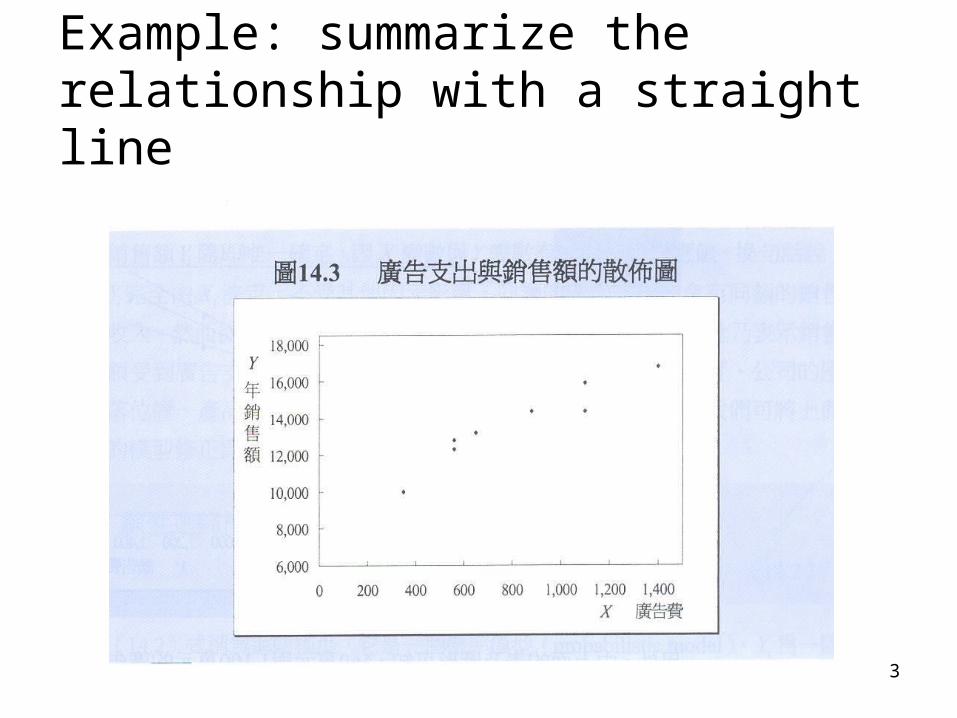
Example: summarize the relationship with a straight line
4
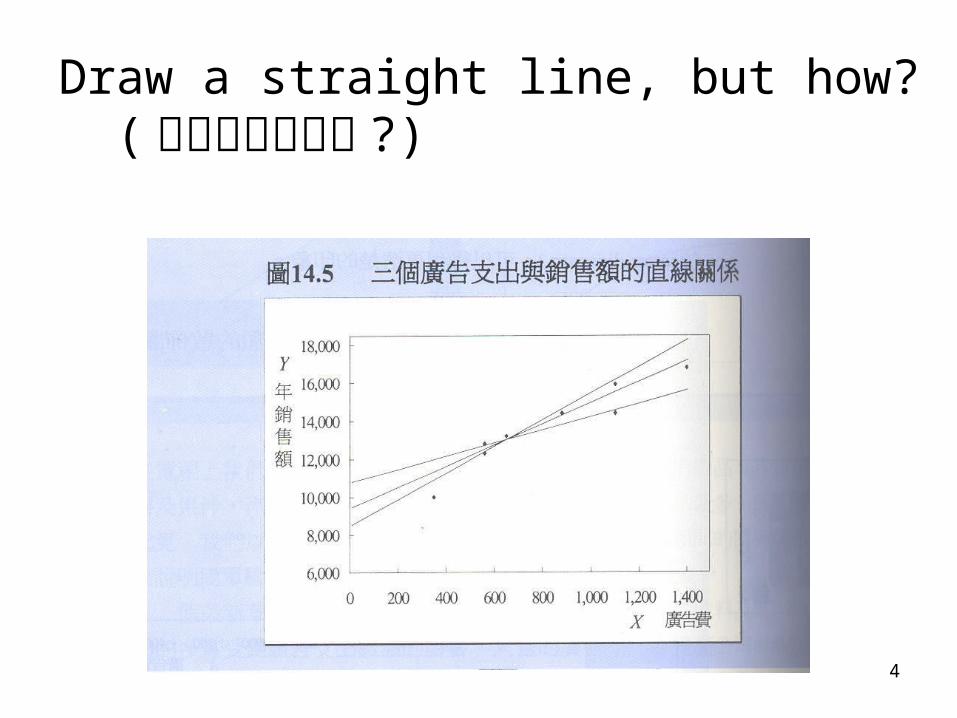
Draw a straight line, but how? ( 怎麼畫那條直線 ?)

5
Notice that some predictions are not complete accurate

6
How to draw the line?
• Purpose: draw the regression line to give the most accurate predictions of y given x
• Criteria for “accurate”:
Sum of (observed y – predicted y)2 =
sum of (prediction errors) 2
[ 觀察值與估計值之差的平方和 ]
Called the sum of squared errors or sum of the squared residuals (SSE)

7
Ordinary Least Squares (OLS) Regression ( 普通最小平方法 )
• The regression line is drawn so as to minimize the sum of the squared vertical distances from the points to the line
( 讓 SSE 最小 )• This line minimize squared predictive error• This line will pass through the middle of th
e point cloud ( 迴歸線從資料群中間穿過 )(think as a nice choice to describe the relationship)

8
To describe a regression line (equation):• Algebraically, line described by its intercept ( 截
距 ) and slope ( 斜率 )• Notation:
y = the dependent variable
x = the independent variable
y_hat ( )= predicted y based on the regression line
β = slope of the regression line
α= intercept of the regression line

9
The meaning of slope and intercept:
• slope = change in (y_hat) for a 1 unit change in x (x 一單位的改變導致 y 估計值的變化 )• intercept = value of (y_hat) when x is 0

10
General equation of a regression line: (y_hat) = α +βx
where α and β are chosen to minimize:
sum of (observed y – predicted y)2
A formula for α and β which minimize this sum is programmed into statistical programs and calculators
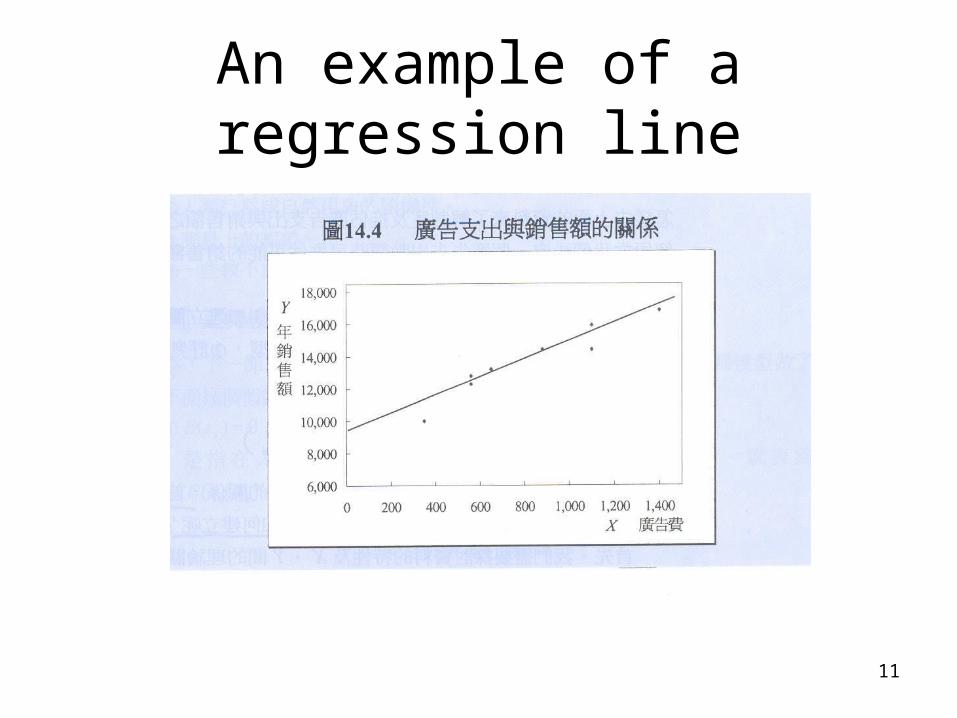
11
An example of a regression line
12
Residuals ( 殘差 )
• Residual = difference between the predicted y and the observed y for an observation
residuali = yi – (y_hat)i
13
Interpreting regression coefficients
• Slope = change in y predicted with a one unit change in x– Slope = 0: no linear relationship between x and y (r =
0)
• Intercept = predicted value of y when x is 0– Often, we are not interested in the intercept
• Note: interpretation of the slope and intercept requires thinking in the units of x and y ( 解釋截距與斜率時要注意到 x and y 的單位 )

14
Regression and Correlation
• Distinct but related measures
• Correlation: measures strength of relationship, a major aspect of which is how closely the points form a line shape
• Regression slope: how steep is the slope of the line?

15
To get slope and intercept for a regression:

16
How slope and correlation are mathematically related:
• β = r (sy)/ (sx)
• α = (y_bar) – β(x_bar)

17
Fit: how much can regression explain? ( 迴歸能解釋 y 多少的變異? )
• Look at the regression equation again:
(y_hat) = (y_hat) = α +βx
y = α +βx + ε
• Data = what we explain + what we don’t explain
• Data = predicted + residual
( 資料有我們不能解釋的與可解釋的部分,即能預估的與誤差的部分)

18
In regression, we can think “fit” in this way:
• Total variation = sum of squares of y
• explained variation = total variation explained by our predictions
• unexplained variation = sum of squares of residuals
• R2 = (explained variation)/ (total variation) (判定係數)
[y 全部的變易量中迴歸分析能解釋的部分 ]

19
R2 = r2
NOTE: a special feature of simple regression (OLS), this is not true for multiple regression or other regression met
hods. [ 注意:這是簡單迴歸分析的特性,不適用於多元迴歸分析或其他迴歸分析 ]
20
Some cautions about regression and R2
• It’s dangerous to use R2 to judge how “good” a regression is. ( 不要用 R2 來判斷迴歸的適用性 )– The “appropriateness” of regression is not a f
unction of R2
• When to use regression?– Not suitable for non-linear shapes [you can m
odify non-linear shapes]– regression is appropriate when r (correlation)
is appropriate as a measure

21
Residuals and residual plots
• residuali = yi – (y_hat)I
• We can use residual plots to help us assess the fit of a regression line
• A residual plot: a scatterplot of the regression residuals against the explanatory variable ( 殘差在 y 軸,自變數在 x 軸 )

22
Example of a residual plot

23
Look at a residual plot
• 殘差 (residuals) 的分布是否平均散佈在 0 的上面及下面?
• 對整個自變數的分佈而言,殘差的垂直分佈 (vertical spread) 是否都差不多?
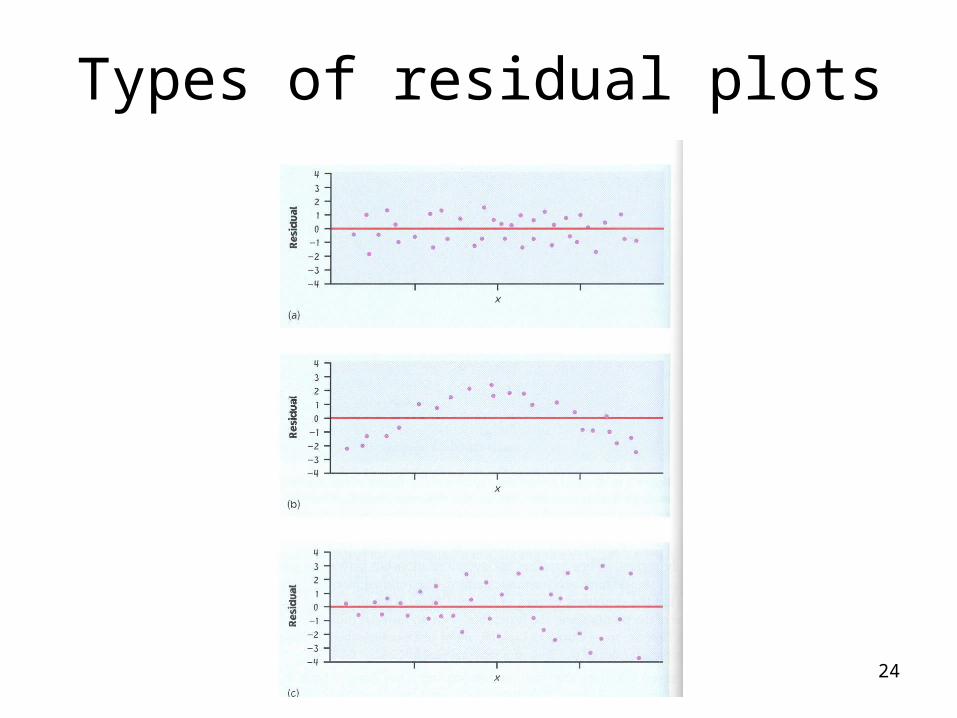
24
Types of residual plots

25
Outliers and influences
• Outlier ( 極端值 ): a point that falls outside the overall patterns of the graph
• Influential observation ( 深具影響的觀察值 ) = a point which, if removed, would markedly change the position of the regression line
• NOTE: Outliers are not necessarily influential.
26
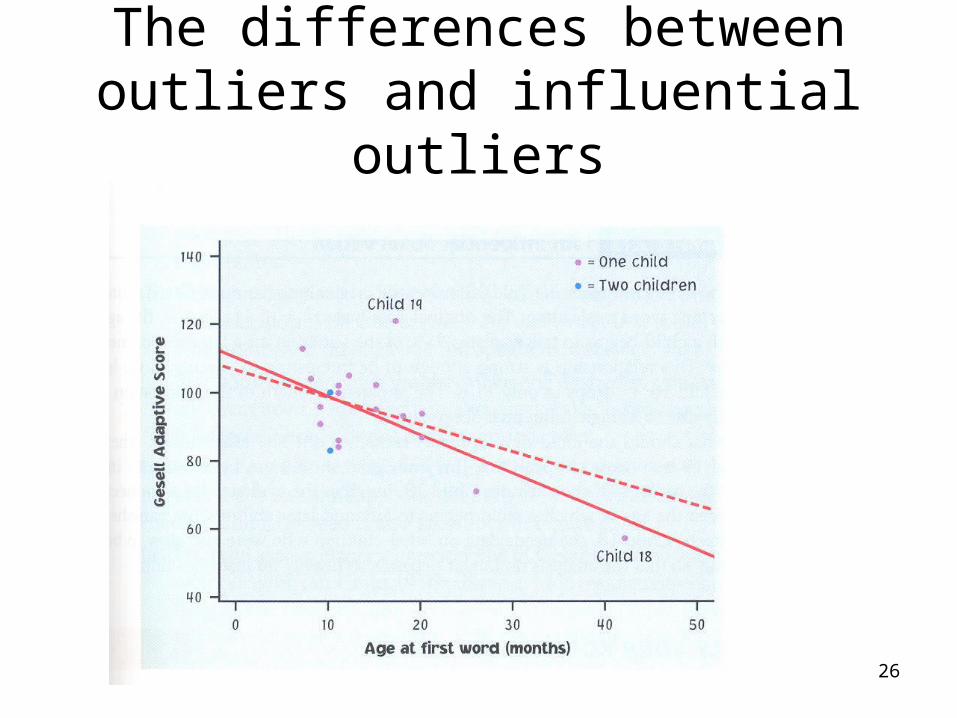
The differences between outliers and influential outliers

27
Outliers and influential observations
• Outliers which are at the extremes of x are more likely to be influential than those are at the extremes of y ( 自變數的極端值比依變數的極端值較有可能是對迴歸影響力大的觀察值 )
• It is often a good idea to eliminate any influential outliers and recompute our regression without them.( 建議 : 將對迴歸影響力大的觀察值刪除,再計算一次迴歸線 )
28
Cautions about correlation and regression:
• Extrapolation is not appropriate• Regression: pay attention to lurking or omitted
variables– Lurking (omitted) variables: having influence on the
relationship between two variables but is not included among the variables studied
– A problem in establishing causation
• Association does not imply causation.– Association alone: weak evidence about causation– Experiments with random assignment are the best
way to establish causation.