1 the spatial dimension of social capital: an exploration zong-rong lee 李宗榮 institute of...
TRANSCRIPT

1
The Spatial Dimension of Social Capital: An Exploration
Zong-Rong Lee李宗榮
Institute of SociologyAcademia SinicaTaipei, Taiwan

2
Spatially Bounded Social Interactions
Earlier writers have found that people are localized in their social contacts and that their interactions are mediated by conditions of urbanization and locals of neighborhood where they dwell in (Park, Fisher 1982, Wellman…)
Geographical and social space structure the likelihood of social interactions; proximate actors form ties more frequently and have stronger influence on each other. (Festinger 1950; W. White1956; Blau 1977)
Other similar studies on mate selection, political attitude, social trips between city areas etc.
Spatially proximate companies are more likely to share directors. Mints and Schwartz (1985); Kono et al, (1998) Burt (2006)
The likelihood that a venture capitalist invests in a new target declines with the distance between venture capitalist and its target. Sorensen and Stuart (2000)

3
Spatial Dimension of Social Capital? Social Capital: resources embedded in a social networks that can be accessed and
mobilized in instrumental actions (Lin 2001)
> Is there a spatial dimension behind the generation of social capital? And if so, what’s its pattern?
1. As social capital represents the network embedded resources and is mostly unequally distributed, is there any spatial association of this distribution? Do people endowed with different levels of social capital also show differences in geographic reach?
2. What social economic factors account for such differences? For example, do people of a higher status (e.g, job prestige, education, wealth) tend to have a social capital of a higher geographic reach, or vice versa?
3. Studies show consistent impact of social capital on instrumental actions. How may this effect be conditioned by the factor of proximity. What kind of roles does the factor of spatial distance play in the process of instrumental actions where the effect of social capital is at work?

4
Sample: Social Capital Survey, USA 2007 Cross-Sectional Data. (n=1443 )
Distance measurement in Position-Generator module
Is there anyone you know who is a NURSE? [Yes, No.]
Typically, how long does it take you to travel to meet this person?
(1) Less than 15 minutes(2) 15-30 minutes(3) 30-60 minutes(4) 1-2 hours(5) 2-3 hours(6) 3-5 hours(7) 5-12 hours(8) more than 12 hours
Distance to Accessed Position

5
Social Relations Tend to be LOCAL
76.7% of all reported ties fall within a 1 hour distance range between egos and reached alters.
(1433 respondents report 10807 ties for 22 positions)
010
2030
40%
of T
otal
N
<15min. 15-30min.30-60min. 1-2hrs 2-3hrs 3-5hrs 5-12hrs >12hrs

6
N=1433
Position (Prestige Score)
% of Respondent Accessing
Average Respondent
Prestige
Average Distance (1-8)
Professor (78) 40.27 50.80 3.29 Lawyer (73) 59.39 48.67 3.12 CEO (70) 22.12 49.32 3.21 Congressman (64) 16.61 48.58 3.21 Production manager (60) 17.24 46.00 2.53 Middle school teacher (60) 33.43 47.18 2.30 Personnel manager (60) 45.64 48.57 2.26 Writer (57) 25.33 50.61 3.36 Nurse (54) 72.09 47.64 2.88 Administrative assistant (53) 34.40 49.19 2.51 Computer programmer (51) 44.45 49.10 2.91 Bookkeeper (49) 29.59 48.42 2.60 Farmer (47) 41.10 47.07 3.46 Policeman (40) 50.59 47.05 2.39 Receptionist (38) 38.38 48.43 2.09 Operator in a factory (34) 23.10 44.62 2.53 Hair dresser (32) 60.78 47.05 2.10 Taxi driver (31) 9.49 43.35 2.26 Security guard (30) 25.75 45.00 2.27 Janitor (25) 34.12 47.97 1.95 Babysitter (23) 26.80 46.63 1.81 Hotel bell boy (22) 3.49 46.48 3.06
Some Descriptive Statistics ( 22 positions)
7
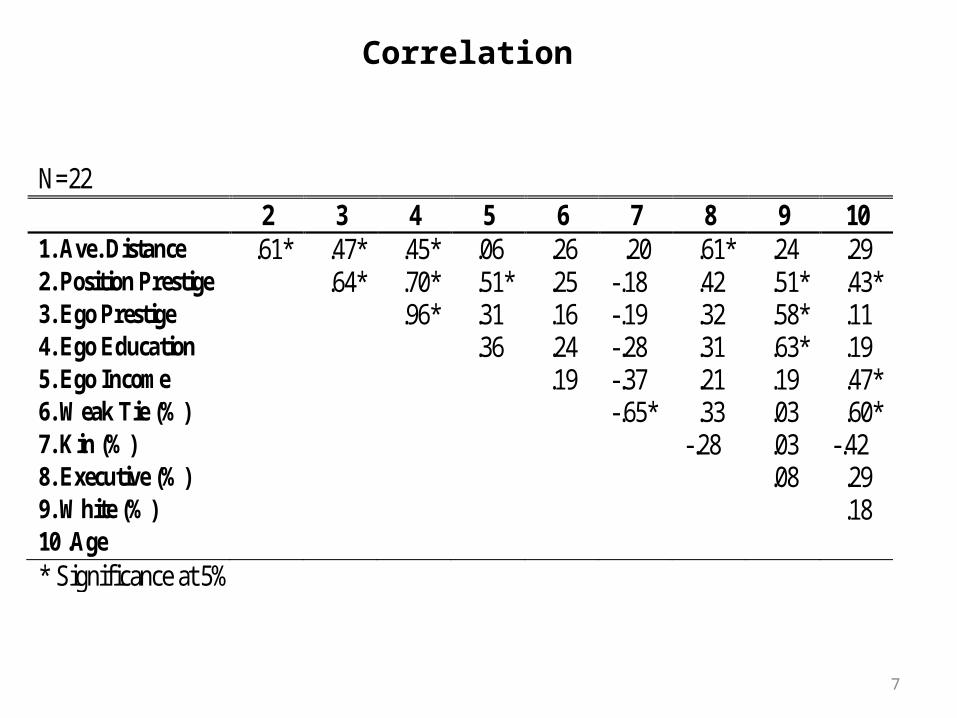
Correlation
N=22 2 3 4 5 6 7 8 9 10 1. Ave. Distance .61* .47* .45* .06 .26 .20 .61* .24 .29 2. Position Prestige .64* .70* .51* .25 -.18 .42 .51* .43* 3. Ego Prestige .96* .31 .16 -.19 .32 .58* .11 4. Ego Education .36 .24 -.28 .31 .63* .19 5. Ego Income .19 -.37 .21 .19 .47* 6. Weak Tie (%) -.65* .33 .03 .60* 7. Kin (%) -.28 .03 -.42 8. Executive (%) .08 .29 9. White (%) .18 10 .Age * Significance at 5%

8
“Social Capital in the Creation of Human Capital”
prfssr_78
lwyr_73ceo_70
cngrss_64
prmgr_60prdmgr_60 tchr_60wtr_57
nrs_54 adasst_53prgmmr_51
bkkp_49fmr_47
plcman_40rcpnist_38
oprtr_34hrdrssr_32taxid_31 secur_30
jntr_25bbstr_23bllb_22
2040
6080
Pre
stig
e of
Acc
esse
d P
ositi
on
14 14.5 15 15.5 16 16.5ave. ego-edu
Fitted values prestige

9
nrs_54wtr_57
fmr_47
lwyr_73
tchr_60
bbstr_23jntr_25
prmgr_60
adasst_53
hrdrssr_32
bkkp_49
secur_30
prdmgr_60
oprtr_34
prgmmr_51
rcpnist_38
cngrss_64
taxid_31
prfssr_78
bllb_22
plcman_40
ceo_70
2040
6080
Pre
stig
e of
Acc
esse
d P
ositi
on
44 46 48 50 52Ave. Ego-Prestige
Fitted values prestige
Prestige Homophily and Social Networking
People of a higher status tend to connect with others also of a higher status.

10
Distance is NOT a Function of Income Level
prfssr_78
lwyr_73ceo_70cngrss_64
prmgr_60
prdmgr_60
tchr_60
wtr_57
nrs_54
adasst_53
prgmmr_51
bkkp_49
fmr_47
plcman_40
rcpnist_38
oprtr_34
hrdrssr_32
taxid_31secur_30
jntr_25
bbstr_23
bllb_22
1.5
22.
53
3.5
Ave
rage
Dis
tanc
e
17.5 18 18.5 19 19.5 20Ave. Ego's Income
Fitted values distance

11
Ego’s Prestige vs. Distance to Accessed Position
nrs_54
wtr_57fmr_47
lwyr_73
tchr_60
bbstr_23
jntr_25
prmgr_60
adasst_53
hrdrssr_32
bkkp_49
secur_30
prdmgr_60oprtr_34
prgmmr_51
rcpnist_38
cngrss_64
taxid_31
prfssr_78
bllb_22
plcman_40
ceo_701.
52
2.5
33.
5av
e. d
ista
nce
44 46 48 50 52ave. ego-prestige
Fitted values distance
Respondents of a higher job prestige tend to have spatially distant networks (that are also more likely to be high in job prestige)

12
Spatial Distance vs. Positions PrestigePercentage Distribution of Respondents’ Distances to 22 Positions
0%
20%
40%
60%
80%
100%
bllb
_22
bbst
r_23
jntr_
25
secu
r_30
taxi
d_31
hrdr
ssr_
32
oprtr
_34
rcpn
ist_
38
plcm
an_4
0
fmr_
47
bkkp
_49
prgm
mr_
51
adas
st_5
3
nrs_
54
wtr_
57
tchr
_60
prm
gr_6
0
prdm
gr_6
0
cngr
ss_6
4
ceo_
70
lwyr
_73
prfs
sr_7
8
>12hr
5~12hr
3~5hr
2~3hr
1~2hr
30~60m.
15~30m.
<15min.

13
Spatial Distance vs. Position Prestige
nrs_54wtr_57
fmr_47
lwyr_73
tchr_60
bbstr_23jntr_25
prmgr_60
adasst_53
hrdrssr_32
bkkp_49
secur_30
prdmgr_60
oprtr_34
prgmmr_51
rcpnist_38
cngrss_64
taxid_31
prfssr_78
bllb_22
plcman_40
ceo_70
20
40
60
80
Pre
stig
e o
f A
cce
sse
d P
ositi
on
1.5 2 2.5 3 3.5Average Distance
Fitted values prestige
The distance b/w egos and alters is highly associated with alter job prestige. Valuable networks are geographically distant!

14
A Prestige-Spatial Network Structure
1.Respondents with higher education level, job prestige are more likely to access valuable networks. (human capital principle).
2.They are also more likely to extend the reach of their networks beyond their surrounding geographic neighborhood.
3.The prestige of accessed positions is highly associated with the geographical distances between egos and reached alters.
A Three Way Interaction! Individuals of a higher social status tend to have spatially distant
networks that are also more likely to be of a higher status.
When the principle of homophily is working so that two persons both demonstrating high job prestige will be more inclined to maintain their friendship, the underlying fact is that their geographic distance from each other more likely will be greater than that of others.

15
Executives Have Greater Geographic ReachDistance vs. Percentage of Executive Respondents
nrs_54
wtr_57fmr_47
lwyr_73
tchr_60
bbstr_23
jntr_25
prmgr_60
adasst_53
hrdrssr_32
bkkp_49
secur_30
prdmgr_60oprtr_34
prgmmr_51
rcpnist_38
cngrss_64
taxid_31
prfssr_78
bllb_22
plcman_40
ceo_70
1.5
22.
53
3.5
ave.
dis
tanc
e
.08 .1 .12 .14 .16 .18executive (%)
Fitted values distance

16
The Strength of Distant Ties
Remember that valuable networks tend to be geographically distant. Do they give STRENGTH?
Empirical test on acquisition of job information
J1. Now I would like you to think of the last months, did someone mention job possibilities, openings or opportunities to you, without your asking, in casual conversation? (1) Yes (0) No
Would social capital at different geographical distances deliver differing effects? Would distant ties fare better?
Previous Studies: Weak Ties (Granovetter) Social Capital: extensity, range, upper prestige (Lin) Structural Holes: brokerage position (Burt)

17
Variables
Extensity: the number of positions accessed (0~22)Highest Prestige: prestige score of highest position accessed Range: range of the prestige scores of positioned accessed (difference b/w highest and
lowest scores)
Sum of Distance (1~8) for 22 accessed positionsMean of Distance for 22 accessed positions
In general, we expect social capital that is geographical distant to deliver a better effect on an individual’s acquisition of job information.
Social Capital
<30min.
30min~2hrs
2hrs~5hrs
5hrs~12hrs
Extensity ExtensityD1 ExtensityD2 ExtensityD3 ExtensityD4 Highest Prestige SC_HighD1 SC_HighD2 SC_HighD3 SC_HighD4 Range SC_RangeD1 SC_RangeD2 SC_RangeD3 SC_RangeD4

18
Determination of Receipt of Routine Job Information [exp (B): odds ratio]
Variable Model 1 Model 2
Agea
Age (squared)a
Male Native born Race/ethnicity (base: non-Latino white)
African-American Latino Other
Marrieda
Year of education
Social Capital Extensity Extensity_D1
Extensity_D2 Extensity_D3 Extensity_D4
1.000 (.994) 1.000 (.672) 1.143 (.311) 1.338 (.202) 0.544*** (.005) 1.947*** (.001) 1.167 (.613) 0.931 (.608) 1.030 (.124) 1.078*** (.001)
1.003 (.954) 1.000 (.617) 1.127 (.366) 1.371 (.170) 0.566*** (.009) 1.975*** (.001) 1.149 (.650) 0.935 (.635) 1.020 (.296) 1.046** (.016) 1.134*** (.001) 1.148** (.017) 1.182*** (.001)
Observations 1,411 1,411
* Significance at 10%; ** Significance at 5%; ***significance at 1%
>The further the network extensity, the greater its effect!>Network resources bounded locally get discounted!

19
>Network range further away has greater effect!>The greatest effect is at third distance (D3) level.
Determination of Receipt of Routine Job Information [exp (B): odds ratio]
Variable Model 3 Model 4
Agea
Age (squared)a
Male Native born Race/ethnicity (base: non-Latino white)
African-American Latino Other
Marrieda
Year of education
Social Capital SC_Range SC_Range_D1 SC_Range_D2 SC_Range_D3 SC_Range_D4
1.009 (.853) 1.000 (.557) 1.160 (.259) 1.410 (.131) 0.577*** (.010) 1.937*** (.001) 1.196 (.557) 0.939 (.654) 1.031 (.108) 1.018*** (.001) --->
1.014 (.771) 1.000 (.488) 1.139 (.327) 1.400 (.141) 0.578** (.011) 1.939*** (.001) 1.133 (.684) 0.954 (.736) 1.023 (.233) 1.008** (.025) 1.013*** (.003) 1.019*** (.007) 1.016*** (.005)
Observations 1411 1411
* Significance at 10%; ** Significance at 5%; ***significance at 1%

20
>Upper network prestige that is further away has stronger effect.
Determination of receipt of routine job information [exp (B): odds ratio]
Variable Model 5 Model 6
Agea
Age (squared)a
Male Native born Race/ethnicity (base: non-Latino white)
African-American Latino Other
Marrieda
Year of education
Social Capital SC_High SC_High_D1 SC_High_D2 SC_High_D3 SC_High_D4
1.014 (.765) 1.000 (.482) 1.132 (.346) 1.406 (.134) 0.586** (.013) 1.905*** (.002) 1.161 (.624) 0.946 (.689) 1.029 (.140) 1.020*** (.001)
1.014 (.777) 1.000 (.486) 1.140 (.324) 1.429 (.122) 0.602** (.019) 1.995*** (.001) 1.096 (.765) 0.944 (.683) 1.018 (.372) 1.005 (.102) 1.007*** (.001) 1.006*** (.008) 1.008*** (.001)
Observations 1411 1411
* Significance at 10%; ** Significance at 5%; ***significance at 1%

21
Predicted Probability of Job Information Acquisition for Network Extensity at Different Levels of Distance
.2.4
.6.8
1P
r(Ln
Job
Info
rmat
ion)
0 5 10 15 20Network Extensity
Distance Within 30 Min. Distance 30min.~2hrs.
Distance 2hrs.~5hrs. Distance 5hrs.~>12hrs.

22
.15
.2.2
5.3
.35
.4P
r(Ln
Job
Info
rmat
ion)
0 20 40 60Social Capital (range)
SC_Range Within 30 Min. SC_Range 30min.~2hrs.
SC_Range 2hrs.~5hrs. SC_Range 5hrs.~>12hrs.
Predicted Probability of Job Information Acquisition for Network Range at Different Levels of Distance

23
Predicted Probability of Job Information Acquisition for Highest Network Prestige at Different Levels of Distance
.15
.2.2
5.3
Pr(
Ln J
ob In
form
atio
n)
0 20 40 60 80Highest Network Prestige
Distance Within 30 Min. Distance 30min.~2hrs.
Distance 2hrs.~5hrs. Distance 5hrs.~>12hrs.

24
Summary
1. A spatial dimension of social capital was identified, and social capital varies by distance: The prestige of accessed positions is highly associated with the geographical distances between egos and reached alters. Higher-status networks tend to be geographically distant.
2. Prestige Homophily principle works Over the Proximity principle: People of a higher prestige form networks with each other, despite the likely long distance separating them.
3. “The Strength of Distant Ties”: A geographically distant social capital delivers a stronger effect on the acquisition of job information than a geographically closer one. Beneficial effect of social capital gets discounted when network bounded locally.
4. The function of spatial influence on network utility may not be linear. (curvelinear ?)
25
Discussion
Spatial Extensity is congruent with the concept of Social Capital Individuals with a wide variety of networks (i.e., extensity, diversity) might
also have networks of wider geographic reach.
Such spatial extensity can probably prevent them from being constrained by local networks that mostly deliver redundant information, as weak-ties and structural holes arguments suggest.
Instead of asking “Why do weak ties have strength?”, we should ask
Why do ties with strength tend to be WEAK?
This study suggests that it’s probably because valuable networks tend to be geographically distant; as the result, the relationships may tend to be weaker as well).
Is SPACE an endogenous dimension of social capital? remember the prestige-spatial network structure that we identified

26
Is “Structural Holes” A Spatial Concept?
Ave. Distance of Robert’s Ties > Ave. Distance of James’ Ties

27
Thank You!