16th annual budget forum - constant...
TRANSCRIPT

16th Annual
Budget Forum
Building a Budget
for Connecticut's
Future
Fiscal Overview
• State of the economy as it relates to children and families
• Investments in children
• General fund and revenue trends
• Looking forward
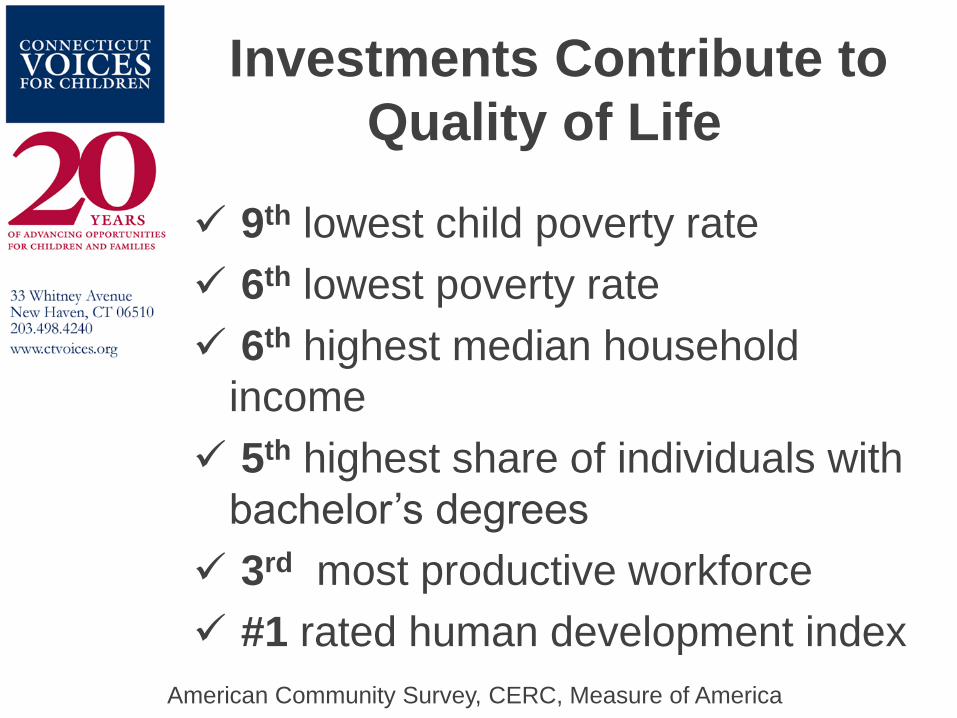
Investments Contribute to
Quality of Life
9th lowest child poverty rate
6th lowest poverty rate
6th highest median household
income
5th highest share of individuals with
bachelor’s degrees
3rd most productive workforce
#1 rated human development index
American Community Survey, CERC, Measure of America
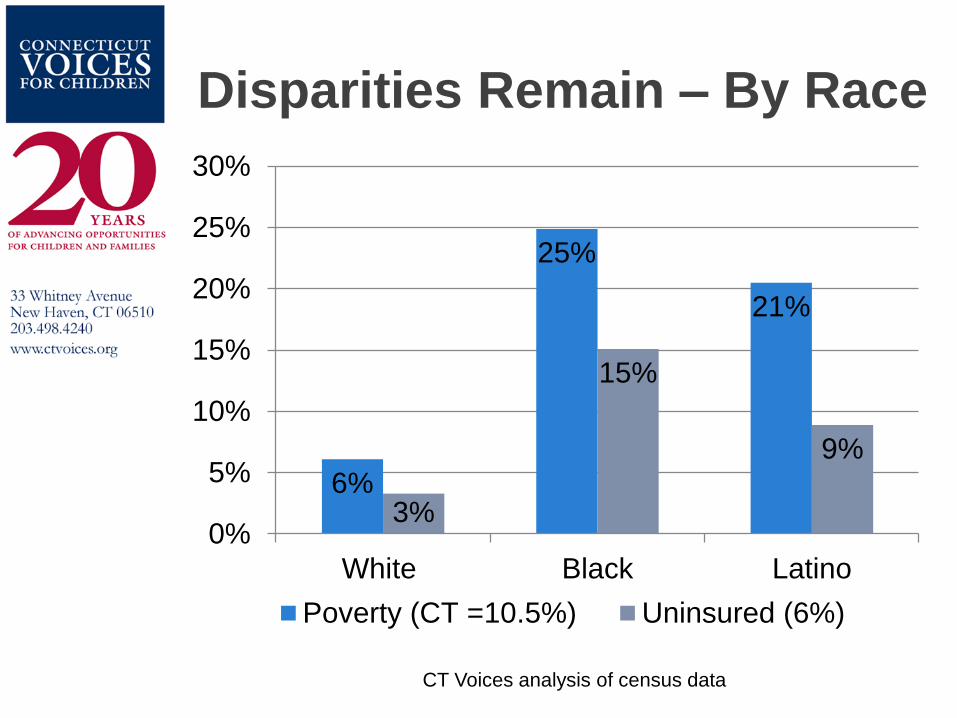
Disparities Remain – By Race
6%
25%
21%
3%
15%
9%
0%
5%
10%
15%
20%
25%
30%
White Black Latino
Poverty (CT =10.5%) Uninsured (6%)
CT Voices analysis of census data
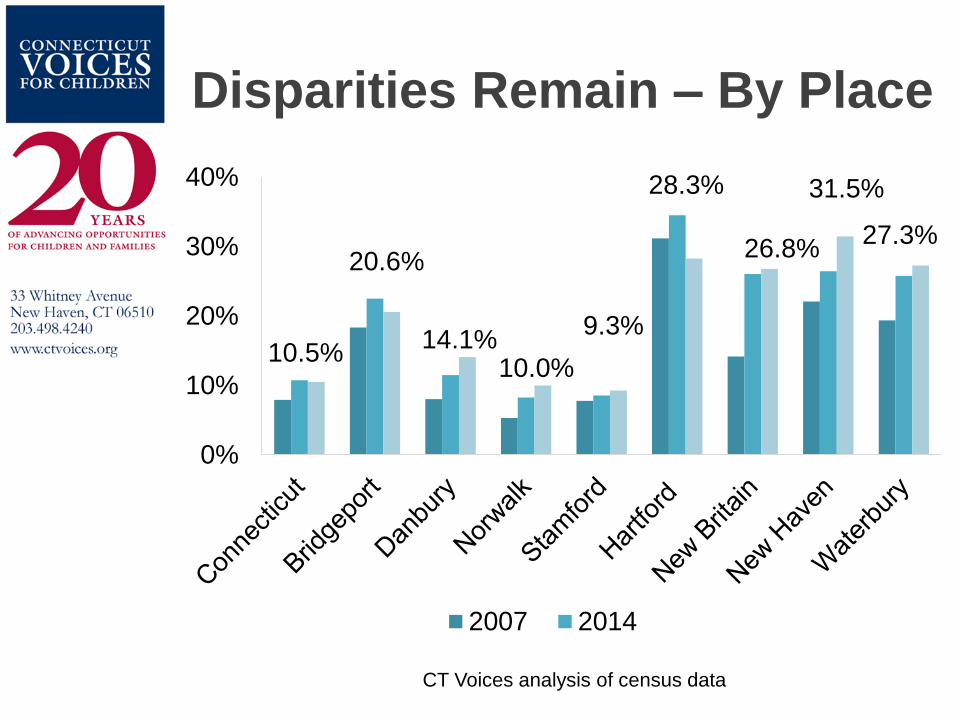
Disparities Remain – By Place
CT Voices analysis of census data
10.5%
20.6%
14.1% 10.0%
9.3%
28.3%
26.8%
31.5%
27.3%
0%
10%
20%
30%
40%
2007 2014
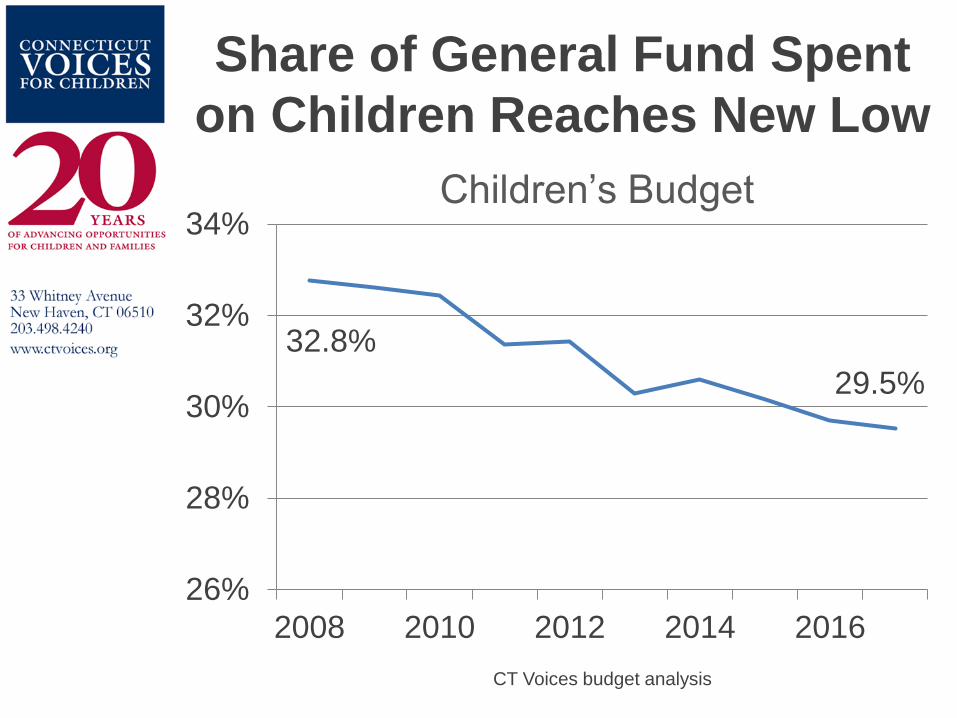
Share of General Fund Spent
on Children Reaches New Low
32.8%
29.5%
26%
28%
30%
32%
34%
2008 2010 2012 2014 2016
Children’s Budget
CT Voices budget analysis
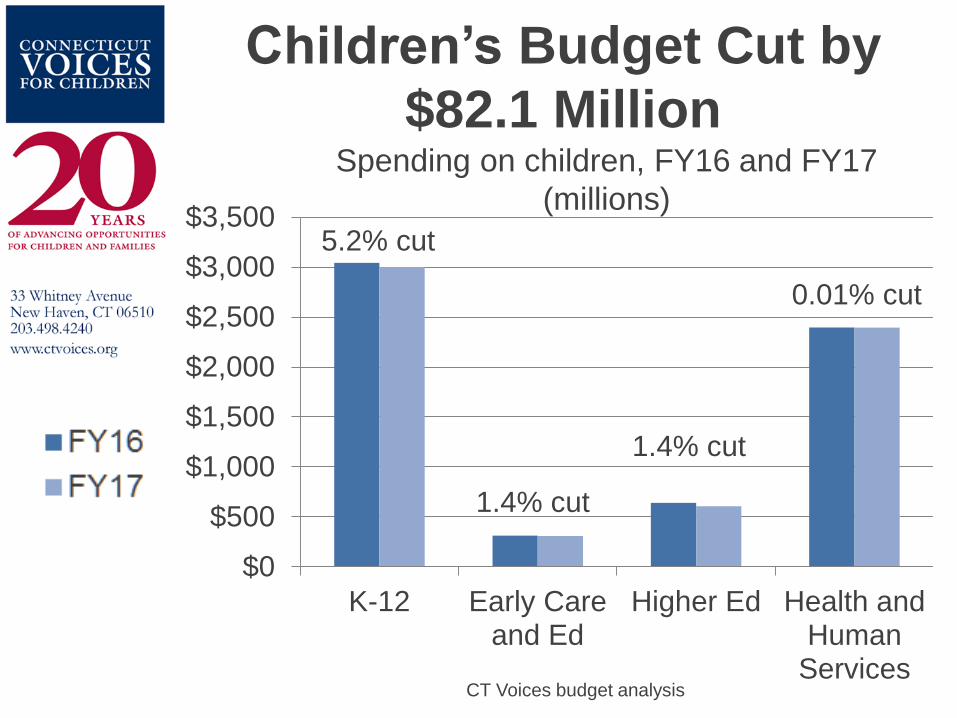
Children’s Budget Cut by
$82.1 Million
$0
$500
$1,000
$1,500
$2,000
$2,500
$3,000
$3,500
K-12 Early Careand Ed
Higher Ed Health andHuman
Services
1.4% cut
1.4% cut
0.01% cut
CT Voices budget analysis
5.2% cut
Spending on children, FY16 and FY17
(millions)
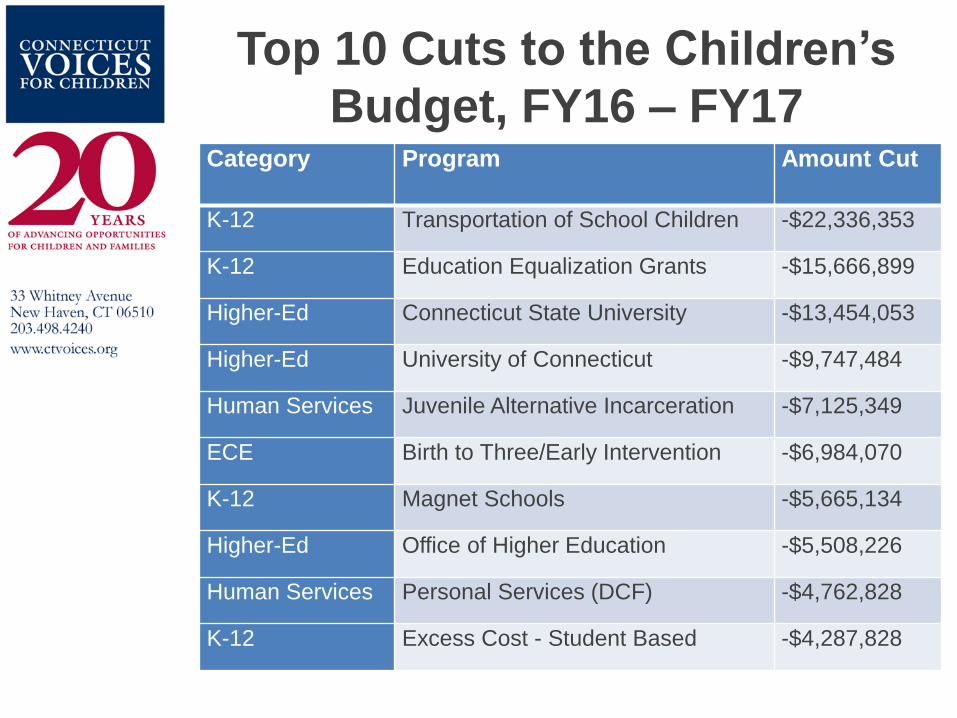
Top 10 Cuts to the Children’s
Budget, FY16 – FY17 Category Program Amount Cut
K-12 Transportation of School Children -$22,336,353
K-12 Education Equalization Grants -$15,666,899
Higher-Ed Connecticut State University -$13,454,053
Higher-Ed University of Connecticut -$9,747,484
Human Services Juvenile Alternative Incarceration -$7,125,349
ECE Birth to Three/Early Intervention -$6,984,070
K-12 Magnet Schools -$5,665,134
Higher-Ed Office of Higher Education -$5,508,226
Human Services Personal Services (DCF) -$4,762,828
K-12 Excess Cost - Student Based -$4,287,828
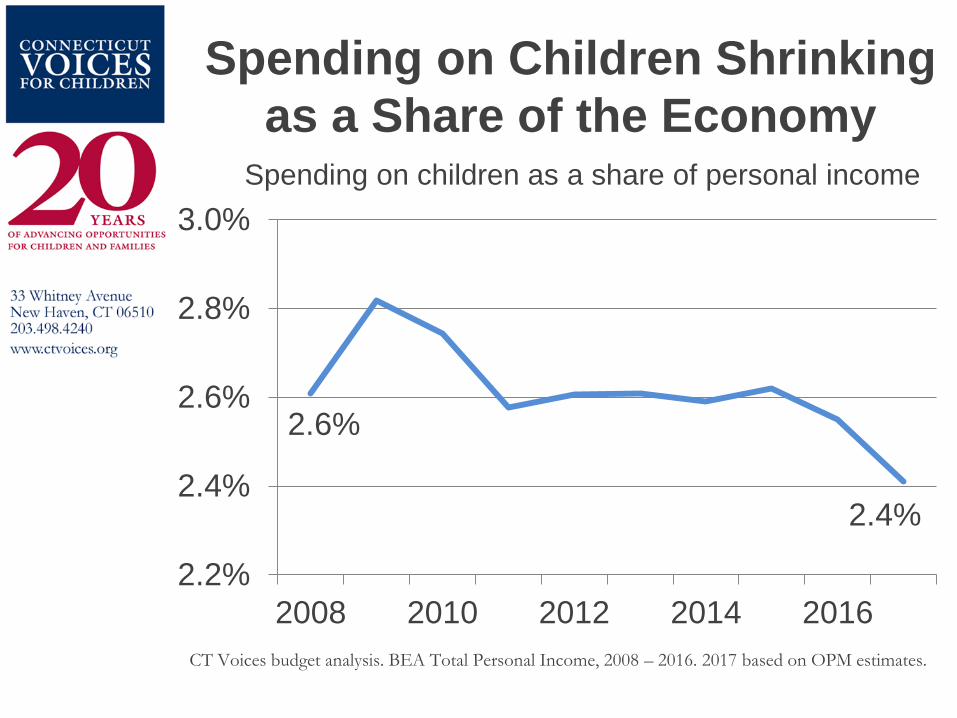
Spending on Children Shrinking
as a Share of the Economy
2.6%
2.4%
2.2%
2.4%
2.6%
2.8%
3.0%
2008 2010 2012 2014 2016
CT Voices budget analysis. BEA Total Personal Income, 2008 – 2016. 2017 based on OPM estimates.
Spending on children as a share of personal income
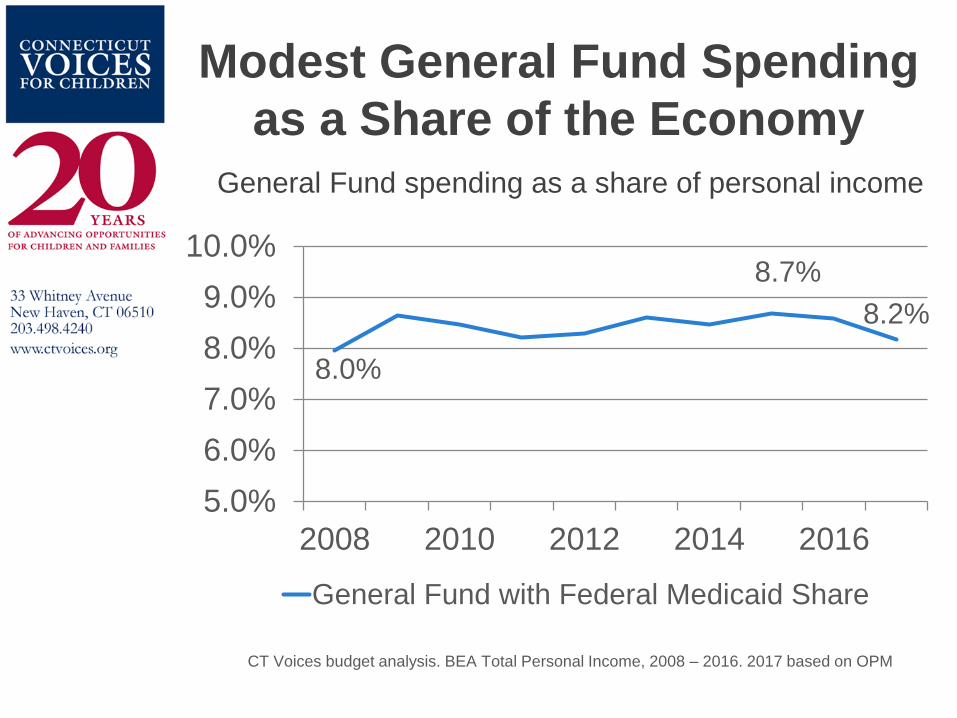
Modest General Fund Spending
as a Share of the Economy
8.0%
8.7%
8.2%
5.0%
6.0%
7.0%
8.0%
9.0%
10.0%
2008 2010 2012 2014 2016
General Fund with Federal Medicaid Share
CT Voices budget analysis. BEA Total Personal Income, 2008 – 2016. 2017 based on OPM
General Fund spending as a share of personal income
Major Revenue Sources Stagnant
as a Share of the Economy
3.34% 3.40%
0.30% 0.29%
1.73% 1.70%
0.0%
1.0%
2.0%
3.0%
4.0%
2008 2010 2012 2014
Personal Income Tax Corporate Income Tax Sales Tax
CT Voices budget analysis. BEA Total Personal Income, 2008 – 2016. 2017 based on OPM estimates
Taxes as a share of personal income, 2008 - 2015
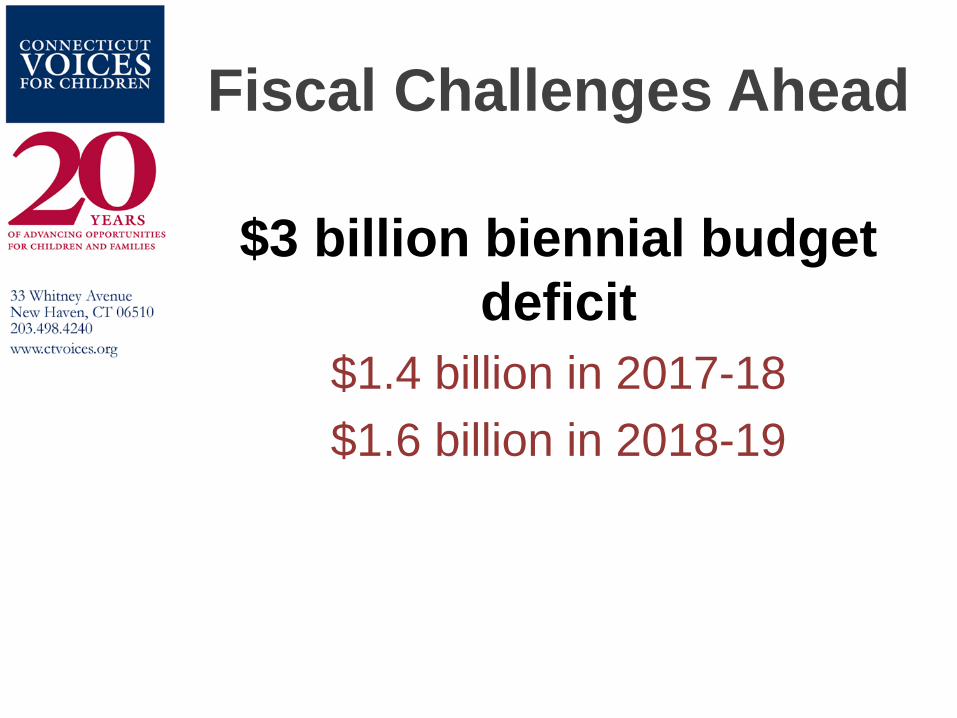
Fiscal Challenges Ahead
$3 billion biennial budget
deficit
$1.4 billion in 2017-18
$1.6 billion in 2018-19
A Balanced Approach
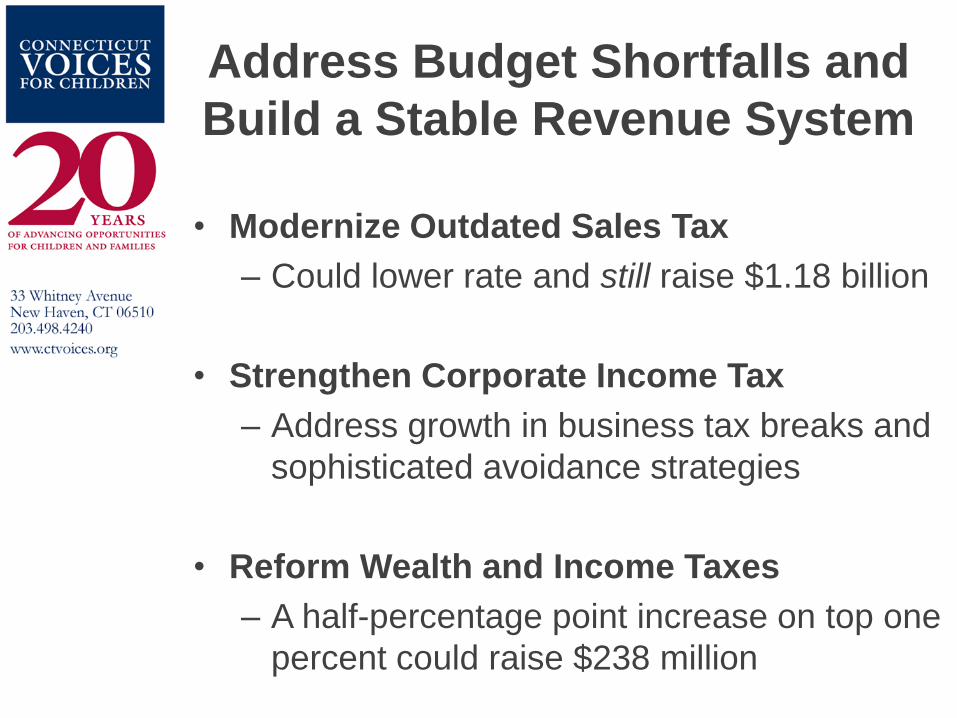
Address Budget Shortfalls and
Build a Stable Revenue System
• Modernize Outdated Sales Tax
– Could lower rate and still raise $1.18 billion
• Strengthen Corporate Income Tax
– Address growth in business tax breaks and
sophisticated avoidance strategies
• Reform Wealth and Income Taxes
– A half-percentage point increase on top one
percent could raise $238 million
16th Annual
Budget Forum
Building a Budget
for Connecticut's
Future
Equal Funding for Equal
Effort
A Model Reforming Property
Tax Funding for Local
Education in Connecticut
Ray Noonan
Connecticut Voices for Children
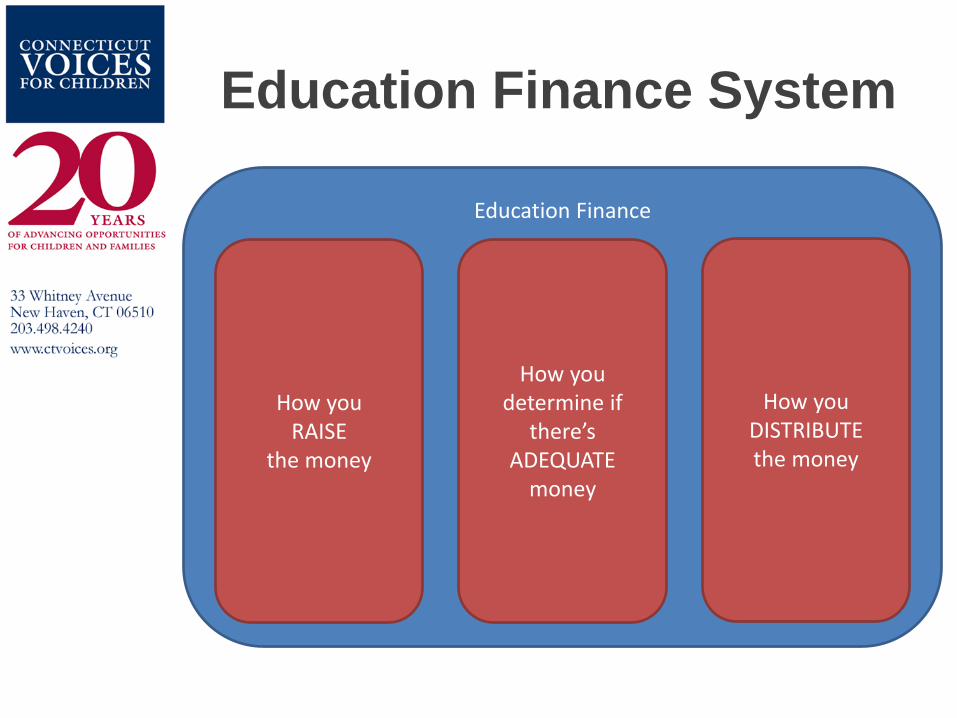
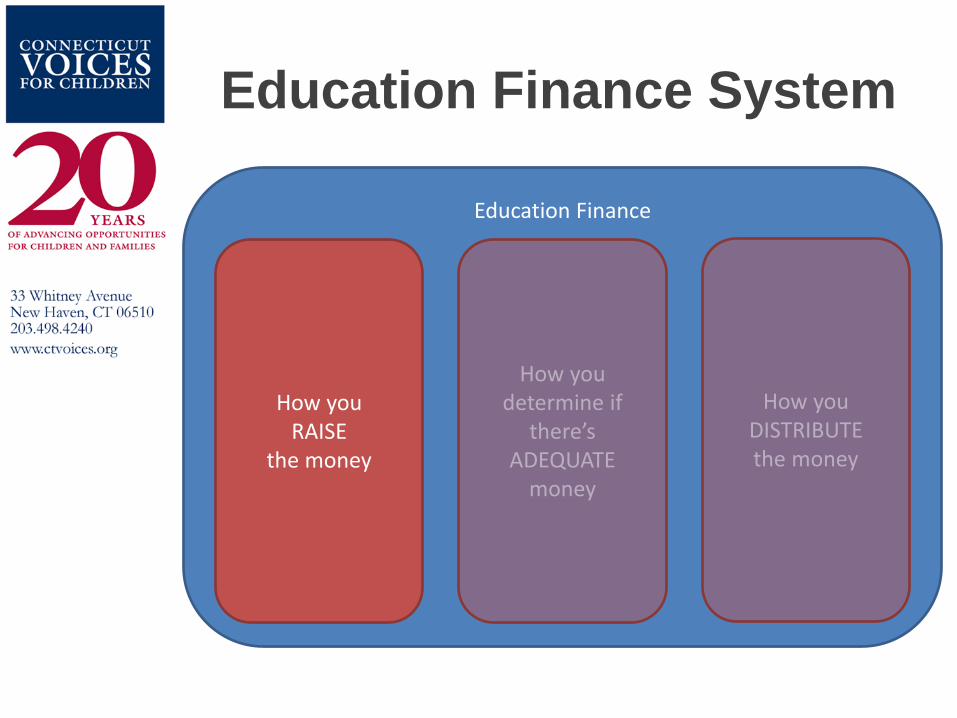
Education Finance System
Education Finance
How you RAISE
the money
How you determine if
there’s ADEQUATE
money
How you DISTRIBUTE the money
Education Finance System
Education Finance
How you RAISE
the money
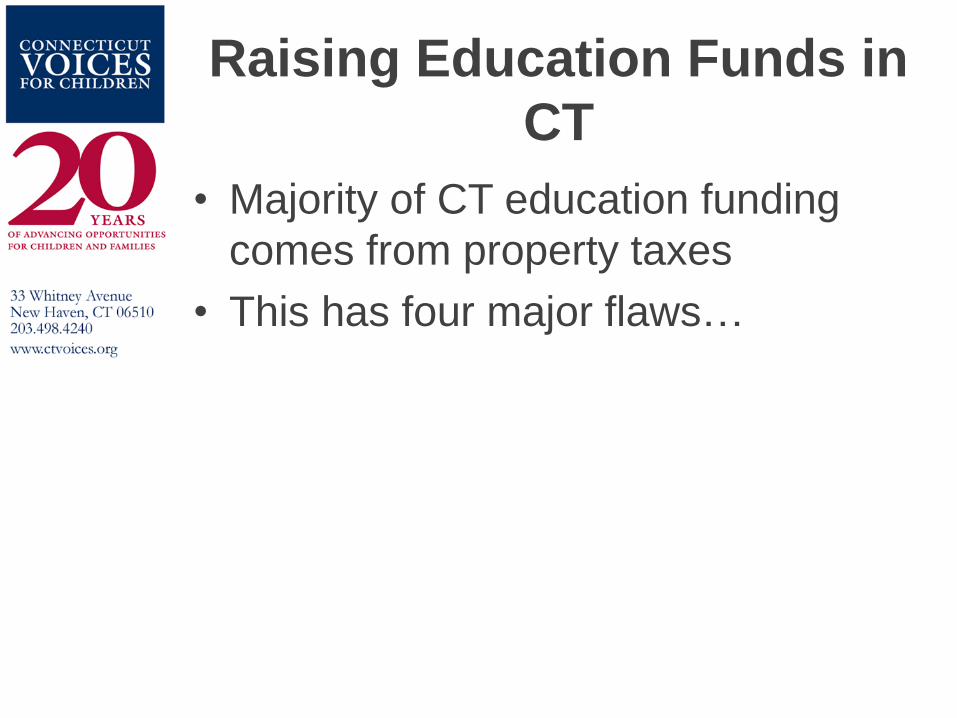
Raising Education Funds in
CT
• Majority of CT education funding
comes from property taxes
• This has four major flaws…
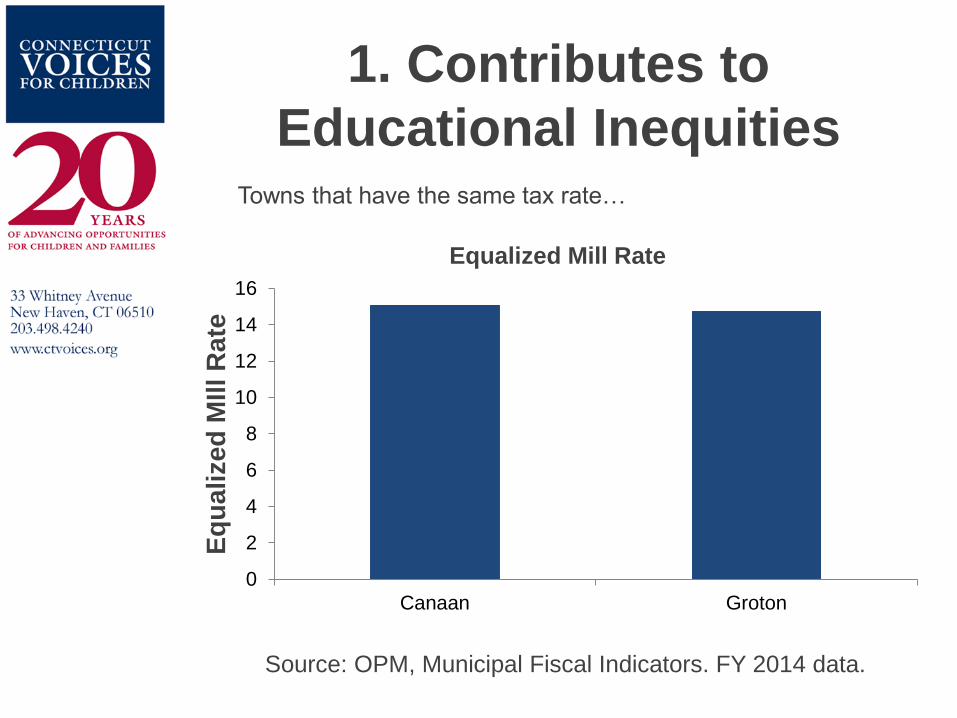
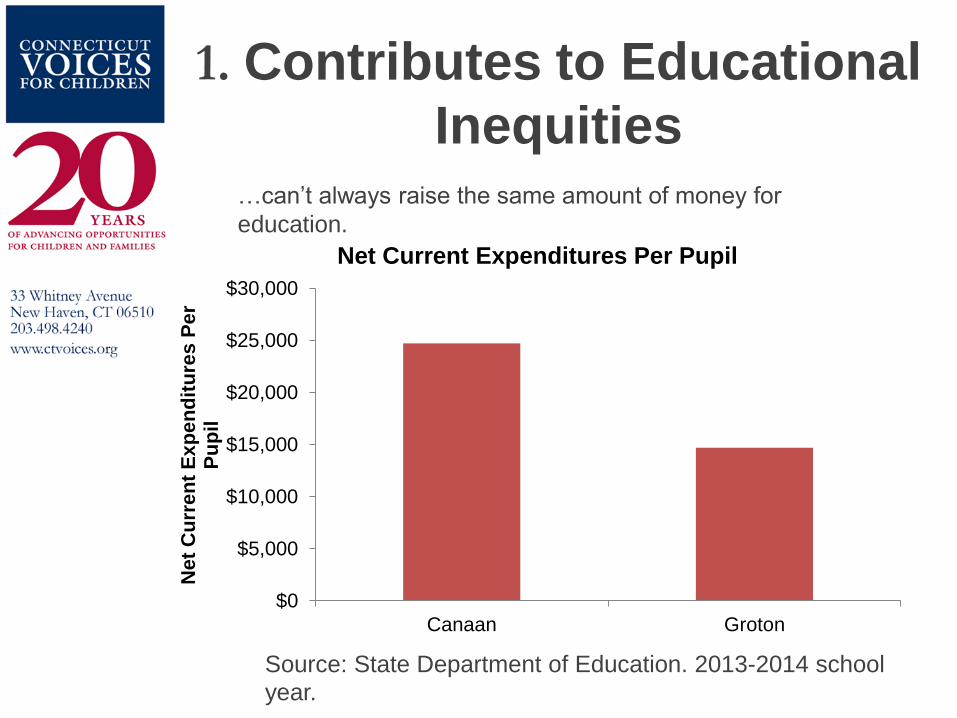
1. Contributes to
Educational Inequities
Source: OPM, Municipal Fiscal Indicators. FY 2014 data.
0
2
4
6
8
10
12
14
16
Canaan Groton
Eq
ua
lize
d M
Ill R
ate
Equalized Mill Rate
Towns that have the same tax rate…
1. Contributes to Educational
Inequities
Source: State Department of Education. 2013-2014 school
year.
…can’t always raise the same amount of money for
education.
$0
$5,000
$10,000
$15,000
$20,000
$25,000
$30,000
Canaan Groton
Net
Cu
rre
nt
Ex
pe
nd
itu
res
Pe
r P
up
il
Net Current Expenditures Per Pupil
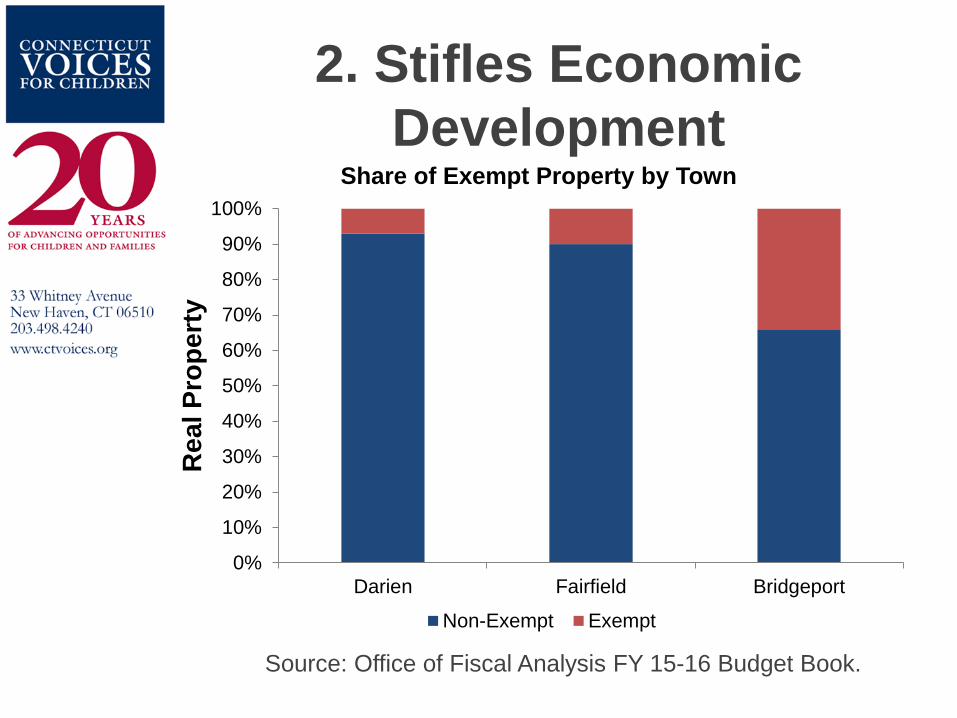
2. Stifles Economic
Development
0%
10%
20%
30%
40%
50%
60%
70%
80%
90%
100%
Darien Fairfield Bridgeport
Re
al P
rop
ert
y
Share of Exempt Property by Town
Non-Exempt Exempt
Source: Office of Fiscal Analysis FY 15-16 Budget Book.
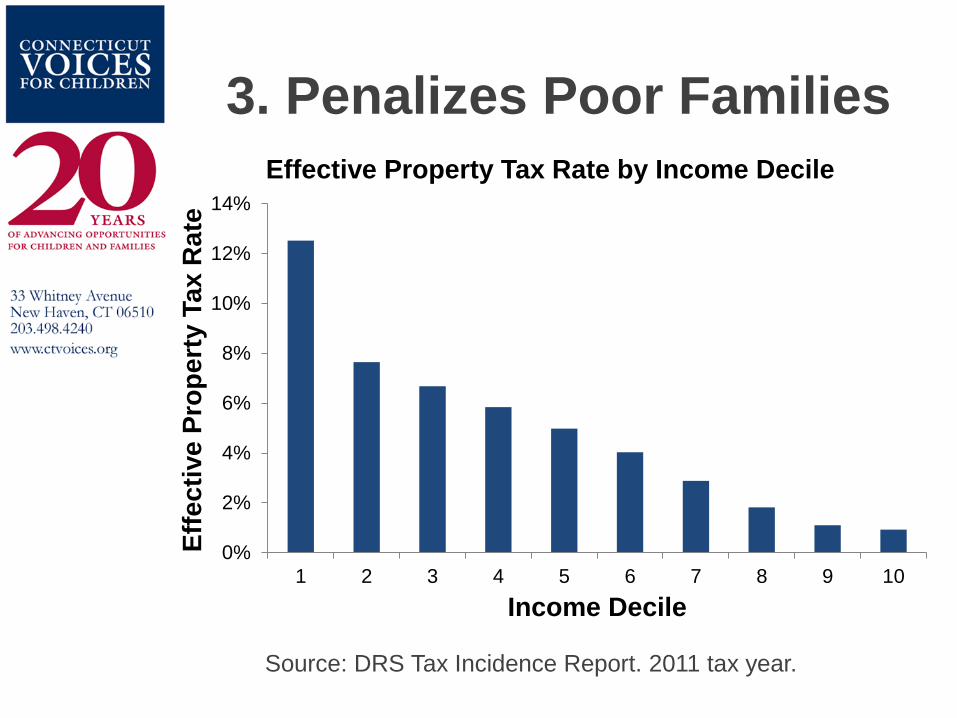
3. Penalizes Poor Families
Source: DRS Tax Incidence Report. 2011 tax year.
0%
2%
4%
6%
8%
10%
12%
14%
1 2 3 4 5 6 7 8 9 10
Eff
ec
tive
Pro
pe
rty T
ax
Ra
te
Income Decile
Effective Property Tax Rate by Income Decile
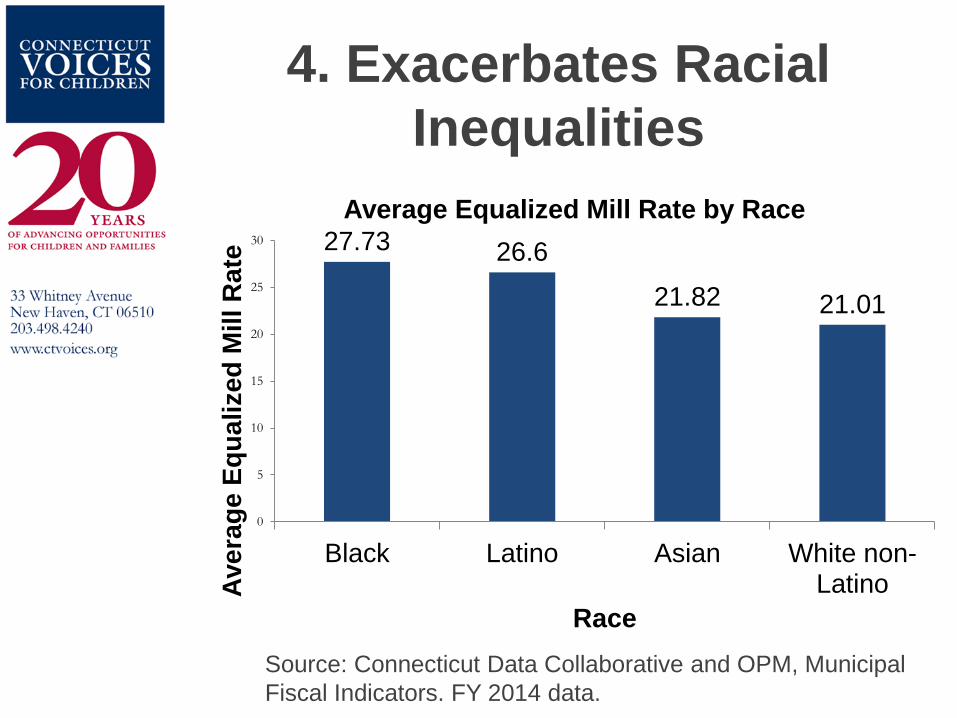
4. Exacerbates Racial
Inequalities
Source: Connecticut Data Collaborative and OPM, Municipal
Fiscal Indicators. FY 2014 data.
27.73 26.6
21.82 21.01
0
5
10
15
20
25
30
Black Latino Asian White non-LatinoA
ve
rag
e E
qu
alize
d M
ill R
ate
Race
Average Equalized Mill Rate by Race
What can we do about
this?
The Vermont Model
Equal effort means equal spending
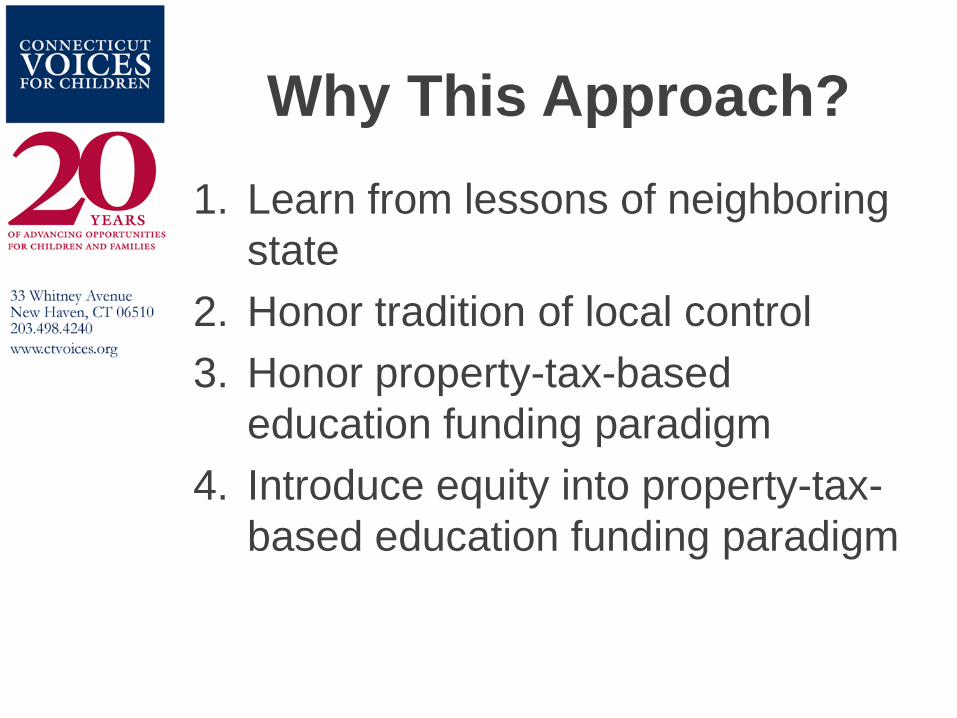
Why This Approach?
1. Learn from lessons of neighboring
state
2. Honor tradition of local control
3. Honor property-tax-based
education funding paradigm
4. Introduce equity into property-tax-
based education funding paradigm
How it Works
Let’s follow Wolcott through this process…
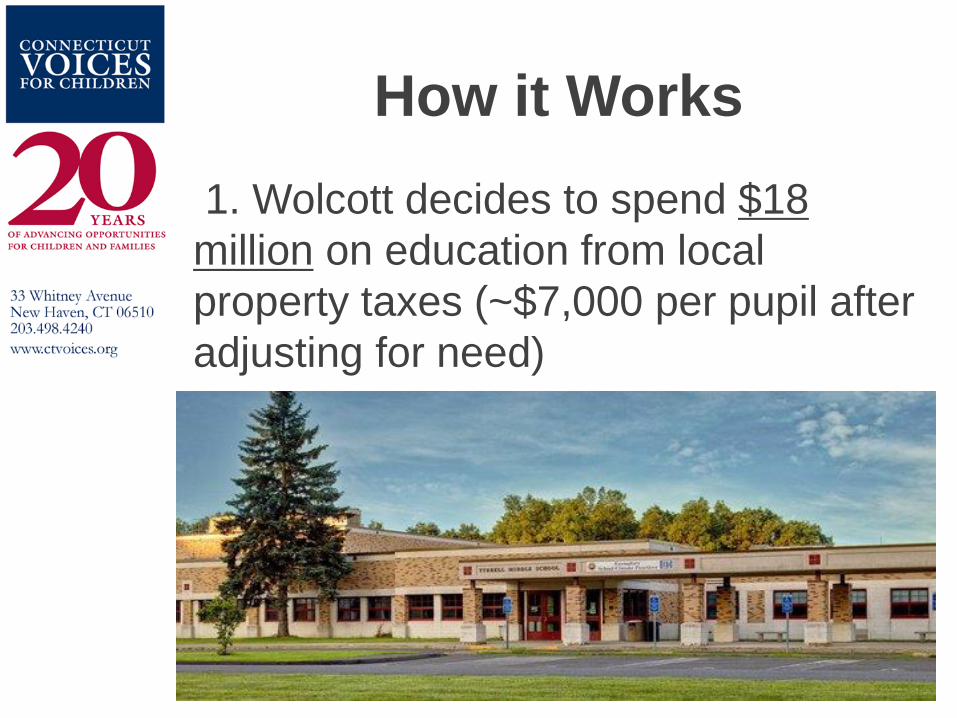
How it Works
1. Wolcott decides to spend $18
million on education from local
property taxes (~$7,000 per pupil after
adjusting for need)
How it Works
2. General Assembly sets three rates:
- Nonresidential tax rate (15.35 mills)
- Residential tax rate (14.03 mills)
How it Works
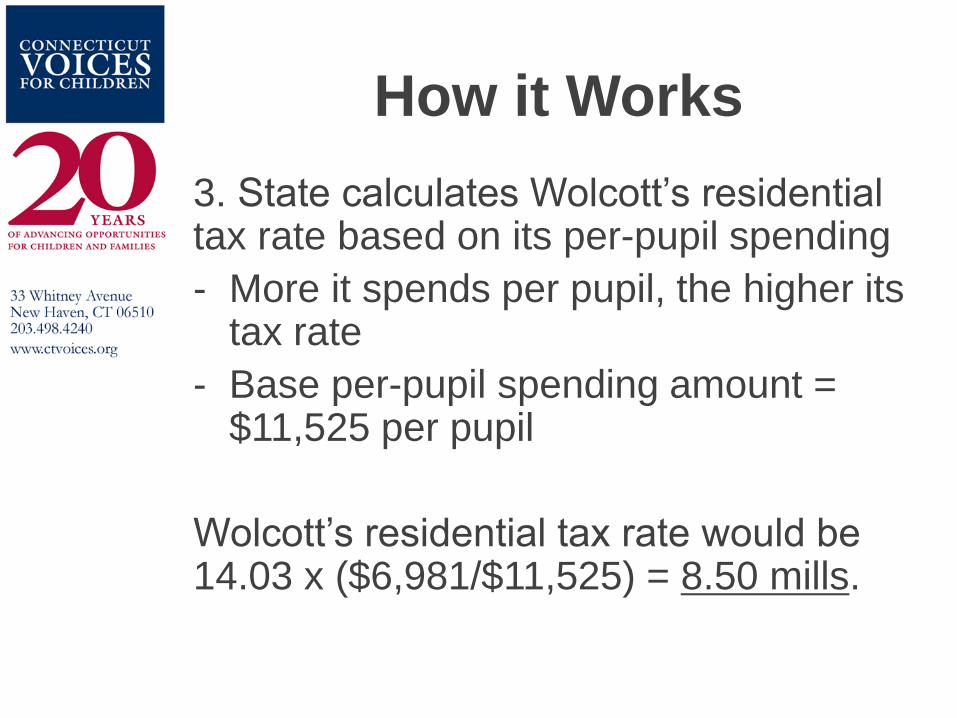
3. State calculates Wolcott’s residential tax rate based on its per-pupil spending
- More it spends per pupil, the higher its tax rate
- Base per-pupil spending amount = $11,525 per pupil
Wolcott’s residential tax rate would be 14.03 x ($6,981/$11,525) = 8.50 mills.
How it Works
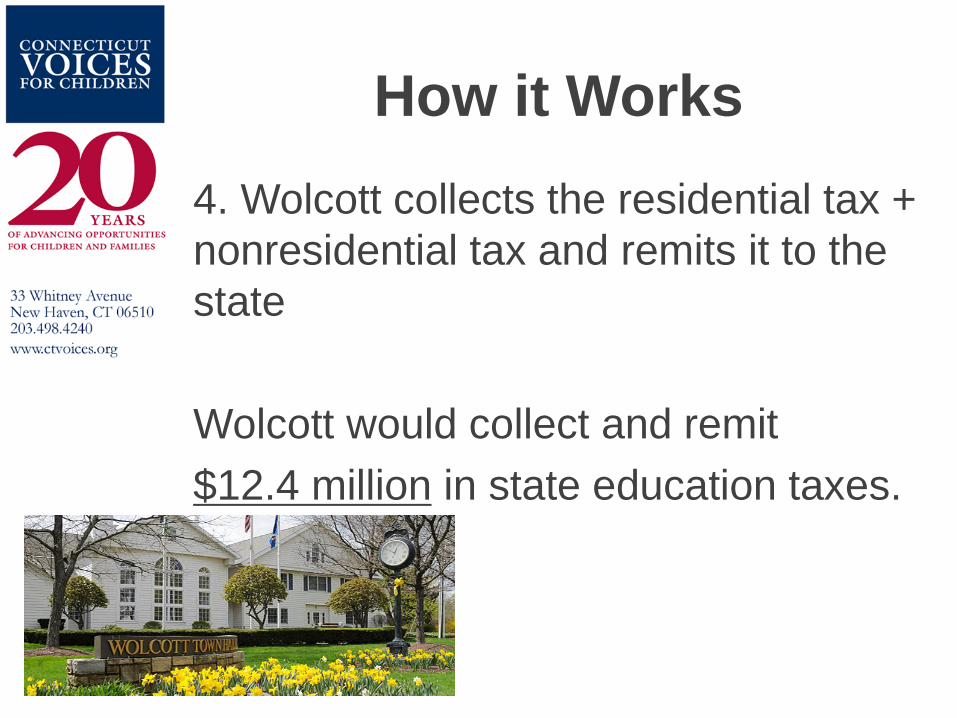
4. Wolcott collects the residential tax +
nonresidential tax and remits it to the
state
Wolcott would collect and remit
$12.4 million in state education taxes.
How it Works
5. The General Assembly gives
Wolcott its $18 million in education
funding plus its $2,000 in statutory
PILOT funds owed
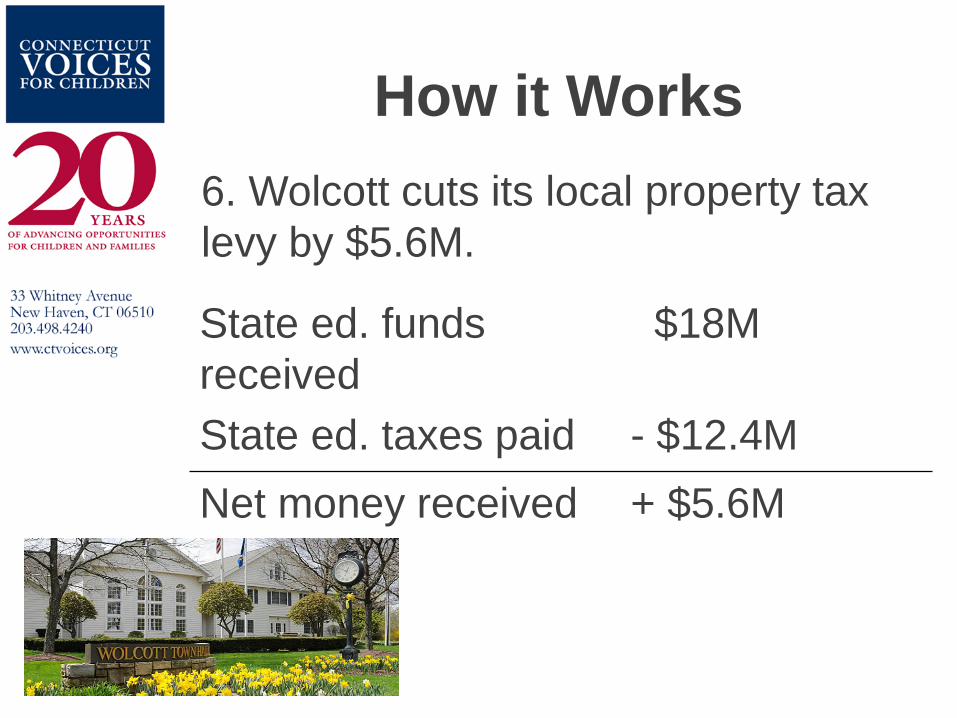
How it Works
State ed. funds
received
$18M
State ed. taxes paid - $12.4M
Net money received + $5.6M
6. Wolcott cuts its local property tax
levy by $5.6M.
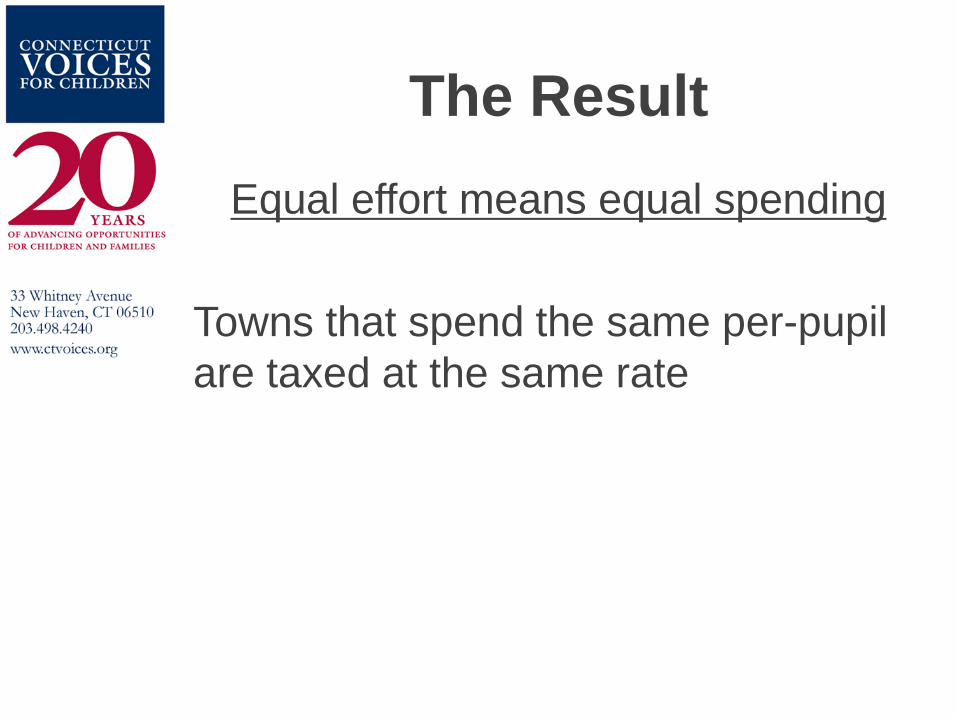
The Result
Equal effort means equal spending
Towns that spend the same per-pupil
are taxed at the same rate
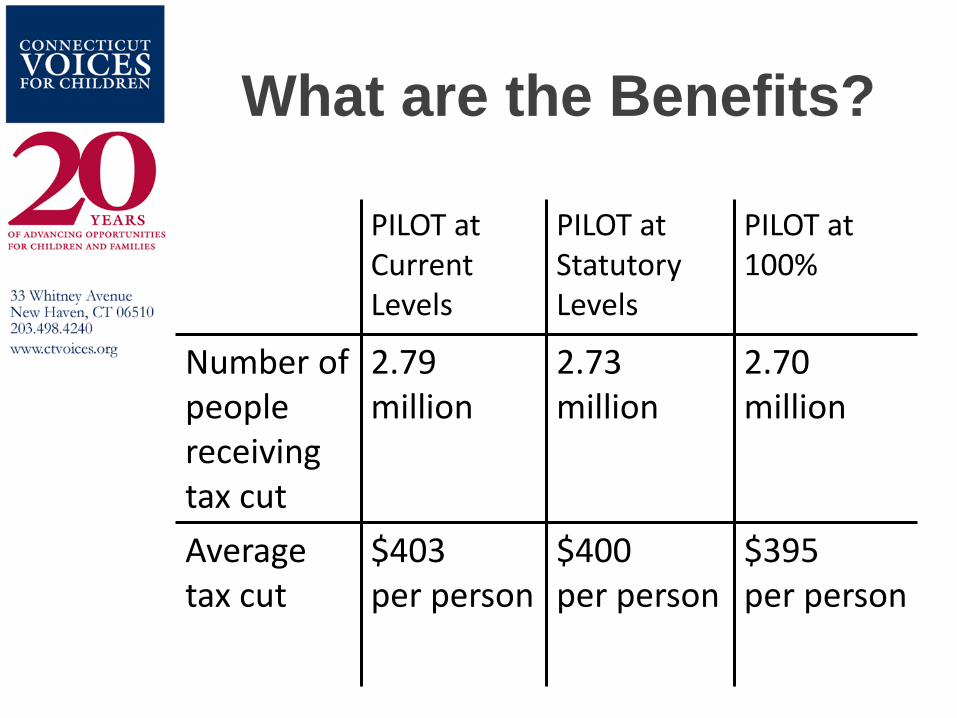
What are the Benefits?
PILOT at Current Levels
PILOT at Statutory Levels
PILOT at 100%
Number of people receiving tax cut
2.79 million
2.73 million
2.70 million
Average tax cut
$403 per person
$400 per person
$395 per person
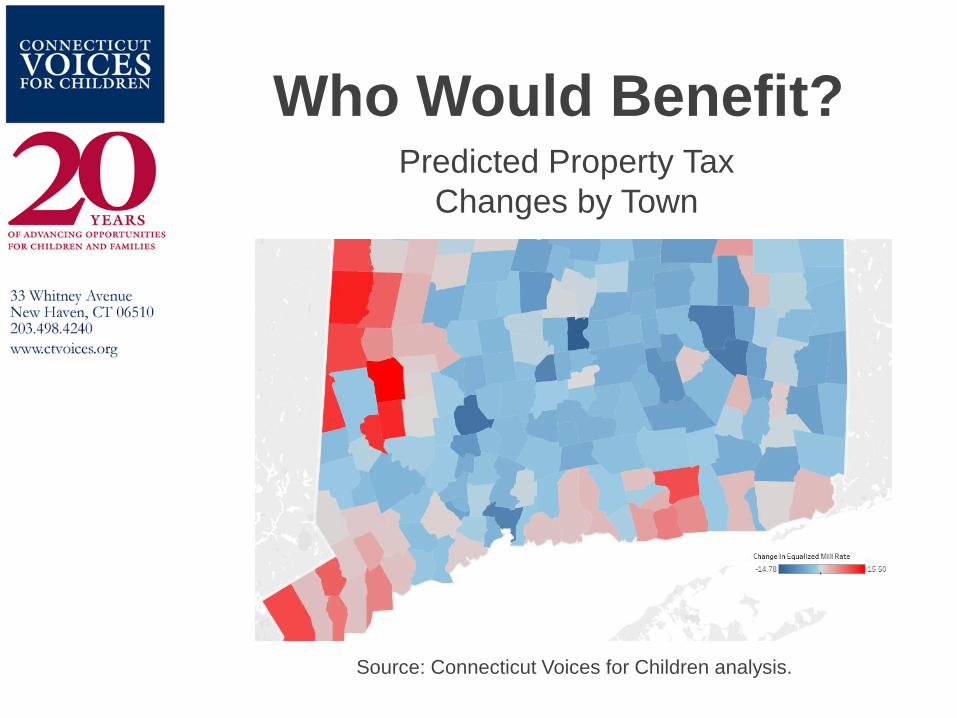
Who Would Benefit? Predicted Property Tax
Changes by Town
Source: Connecticut Voices for Children analysis.
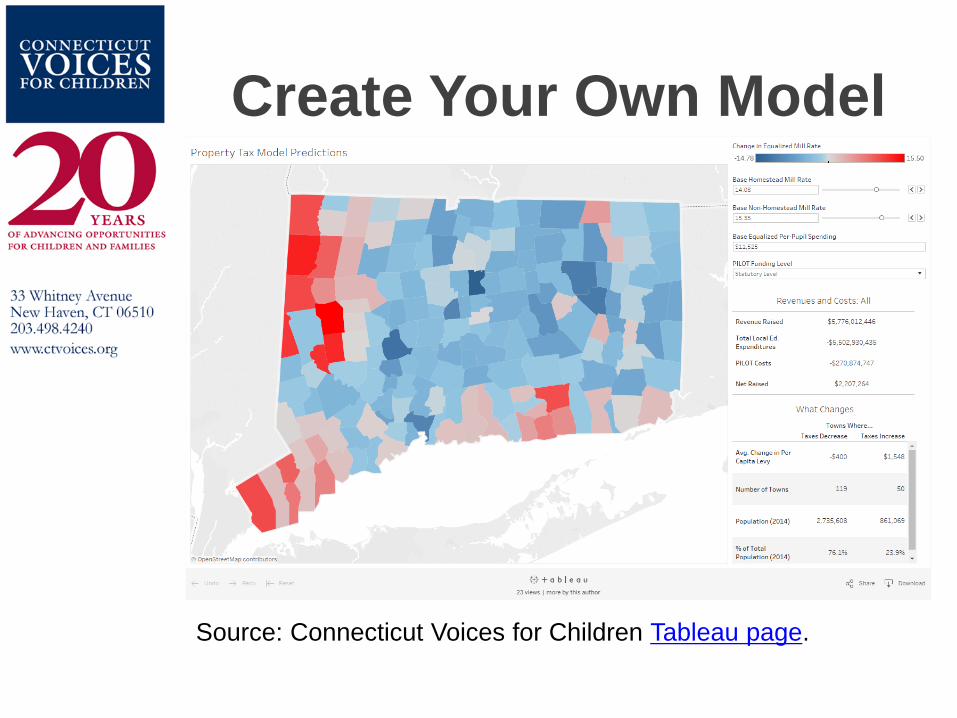
Create Your Own Model
Source: Connecticut Voices for Children Tableau page.
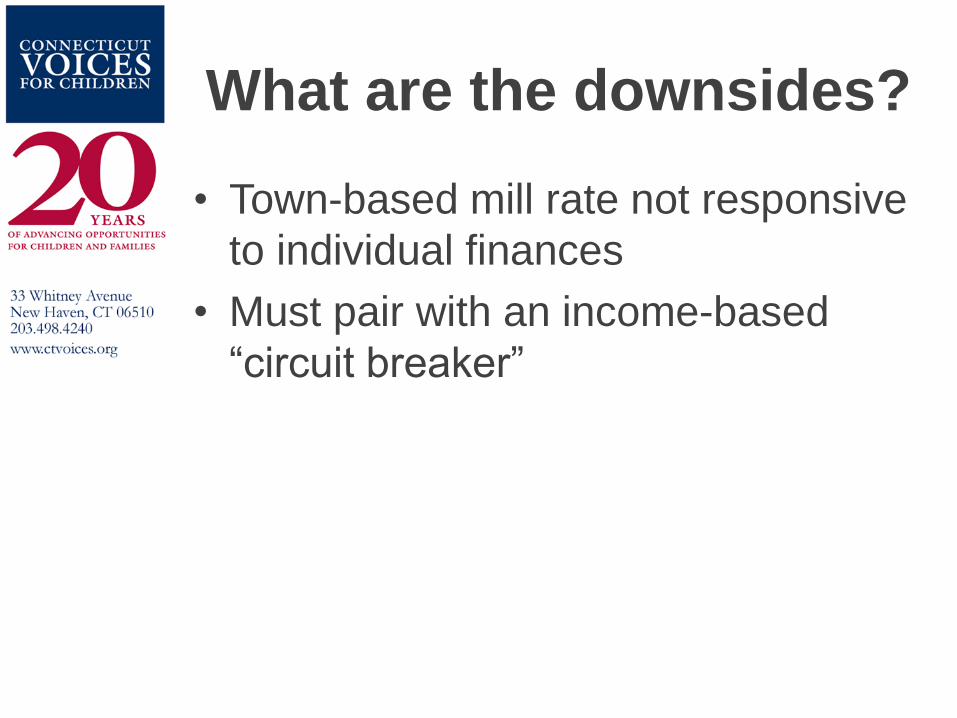
What are the downsides?
• Town-based mill rate not responsive
to individual finances
• Must pair with an income-based
“circuit breaker”
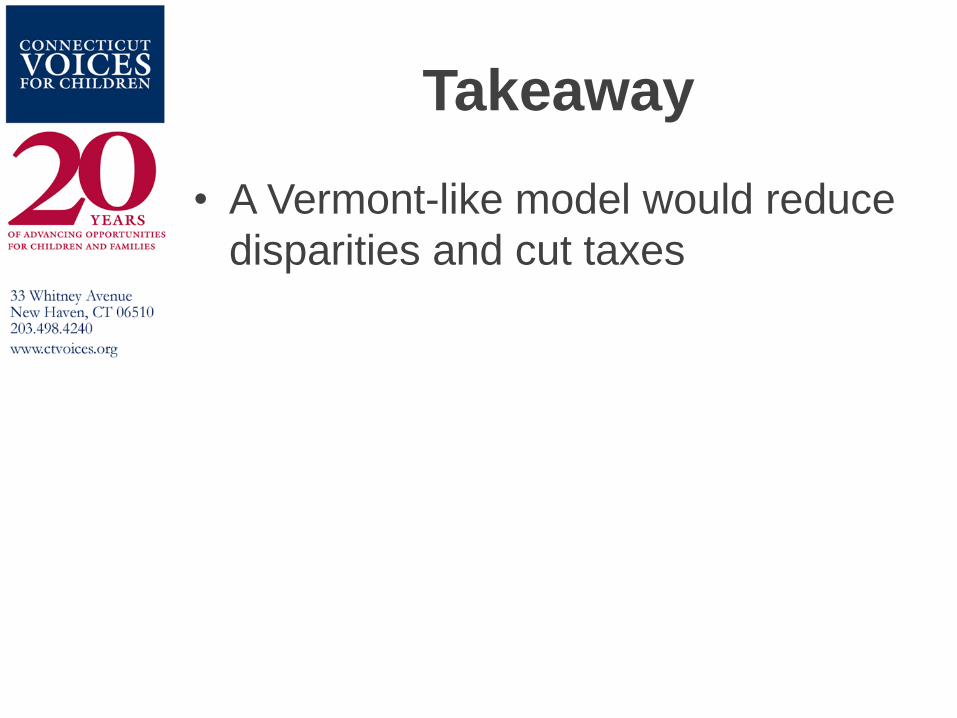
Takeaway
• A Vermont-like model would reduce
disparities and cut taxes
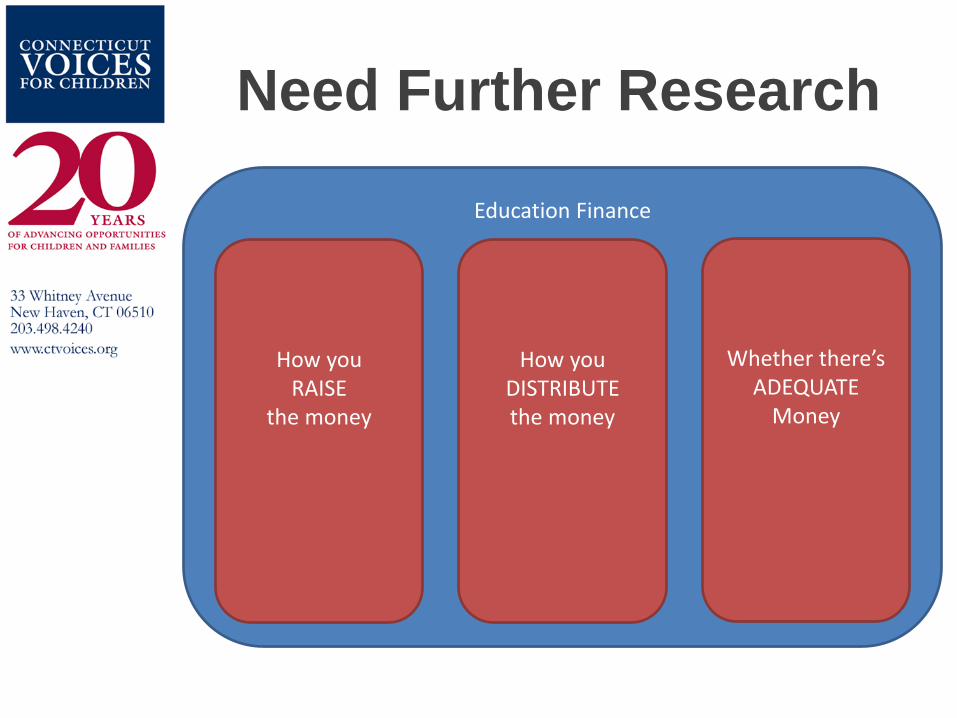
Need Further Research
Education Finance
How you RAISE
the money
How you DISTRIBUTE the money
Whether there’s ADEQUATE
Money
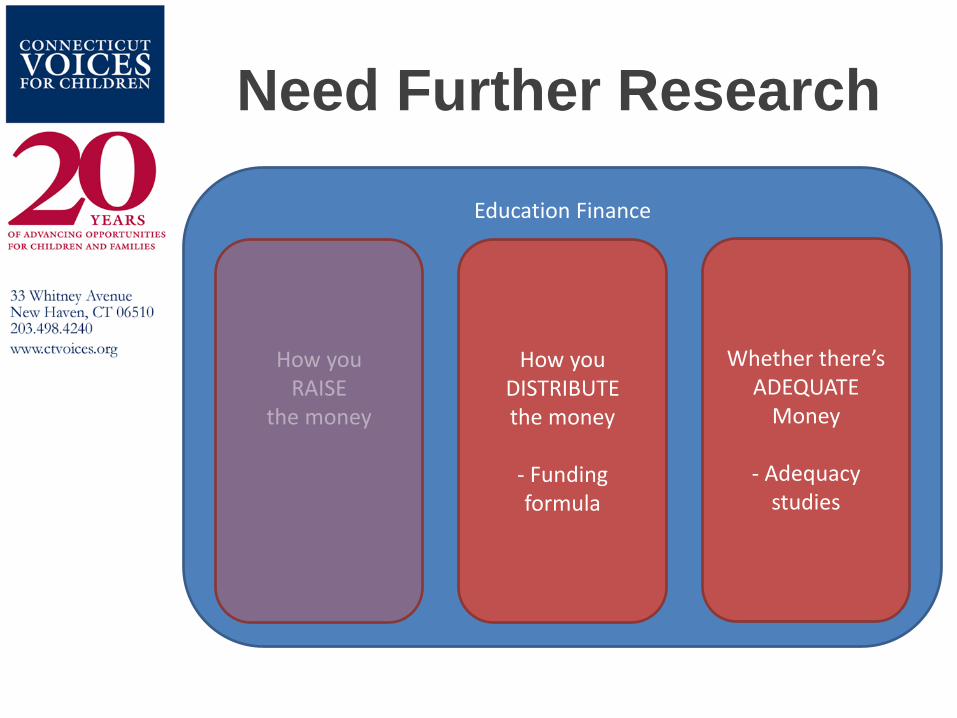
Need Further Research
Education Finance
How you DISTRIBUTE the money
- Funding formula
Whether there’s ADEQUATE
Money
- Adequacy studies

16th Annual
Budget Forum
Building a Budget
for Connecticut's
Future
A Fair Approach at Developing
Connecticut’s Economy
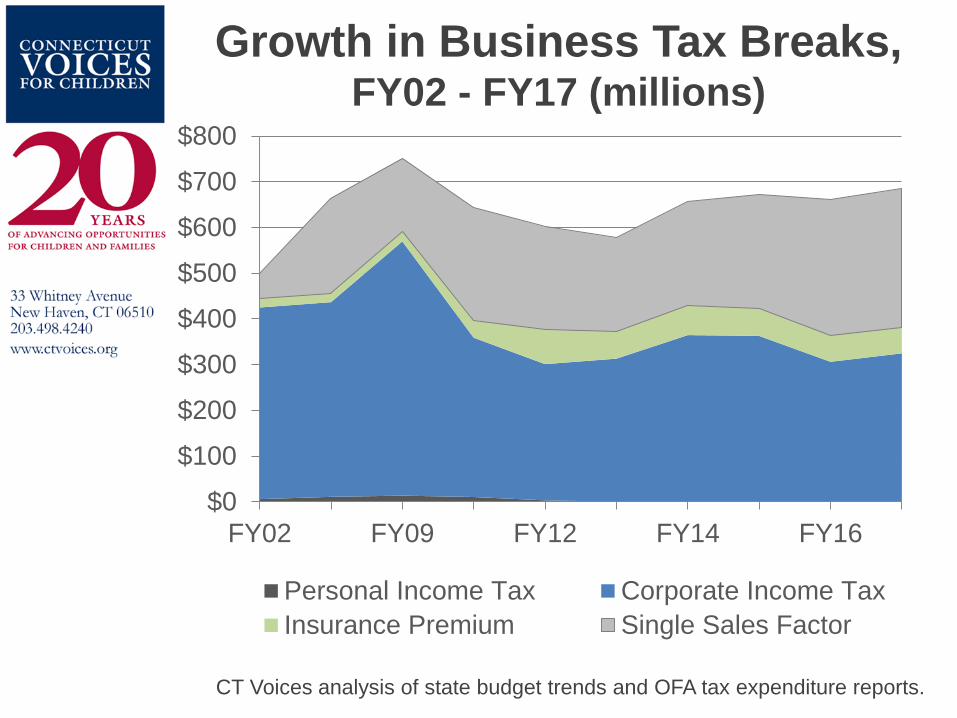
Growth in Business Tax Breaks, FY02 - FY17 (millions)
$0
$100
$200
$300
$400
$500
$600
$700
$800
FY02 FY09 FY12 FY14 FY16
Personal Income Tax Corporate Income Tax
Insurance Premium Single Sales Factor
CT Voices analysis of state budget trends and OFA tax expenditure reports.
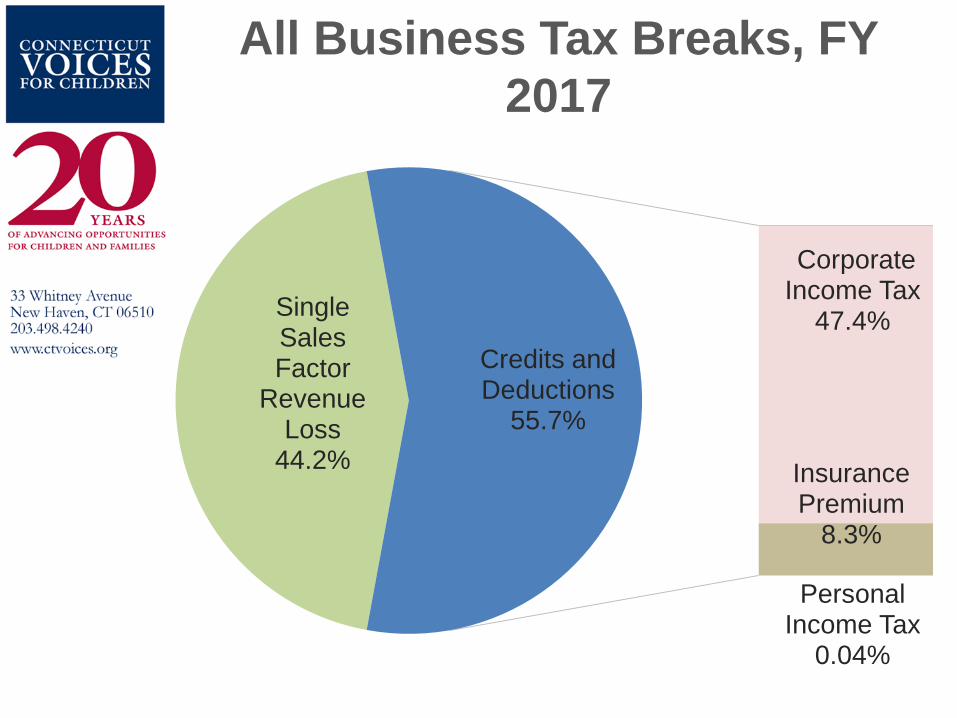
All Business Tax Breaks, FY
2017
Single Sales Factor
Revenue Loss
44.2%
Personal Income Tax
0.04%
Corporate Income Tax
47.4%
Insurance Premium
8.3%
Credits and Deductions
55.7%
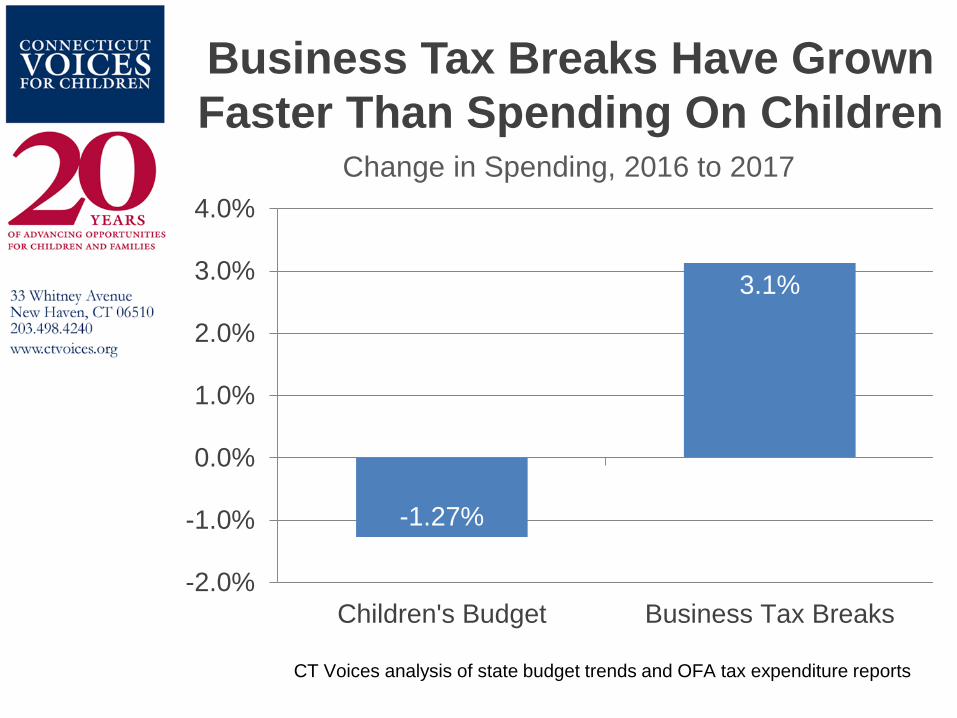
Business Tax Breaks Have Grown
Faster Than Spending On Children
-1.27%
3.1%
-2.0%
-1.0%
0.0%
1.0%
2.0%
3.0%
4.0%
Children's Budget Business Tax Breaks
Change in Spending, 2016 to 2017
CT Voices analysis of state budget trends and OFA tax expenditure reports
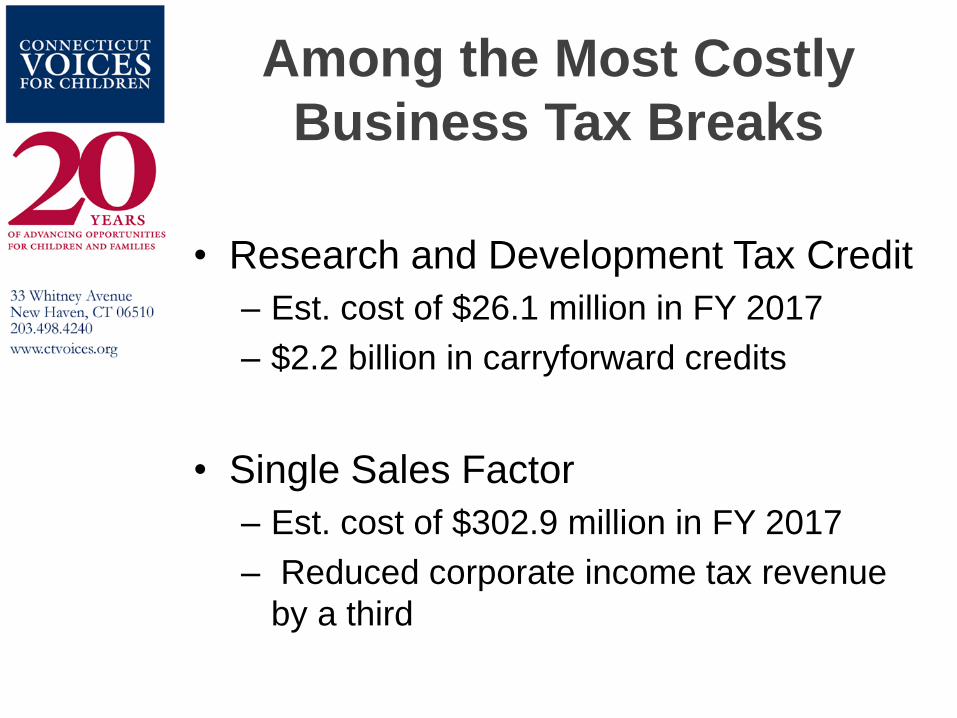
Among the Most Costly
Business Tax Breaks
• Research and Development Tax Credit
– Est. cost of $26.1 million in FY 2017
– $2.2 billion in carryforward credits
• Single Sales Factor
– Est. cost of $302.9 million in FY 2017
– Reduced corporate income tax revenue
by a third
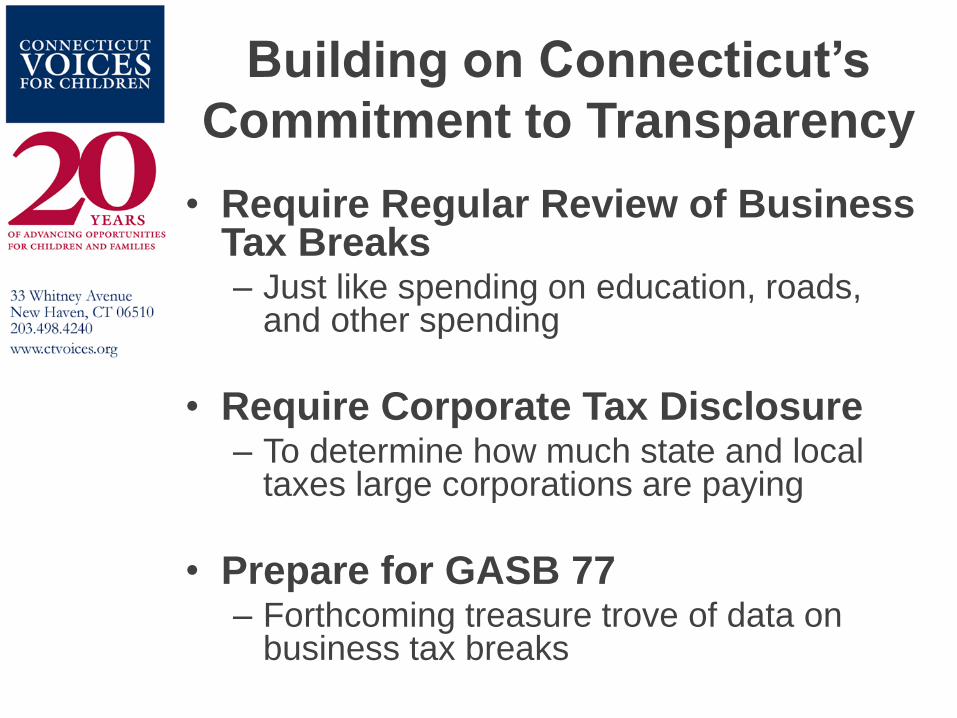
Building on Connecticut’s
Commitment to Transparency
• Require Regular Review of Business Tax Breaks – Just like spending on education, roads,
and other spending
• Require Corporate Tax Disclosure – To determine how much state and local
taxes large corporations are paying
• Prepare for GASB 77 – Forthcoming treasure trove of data on
business tax breaks
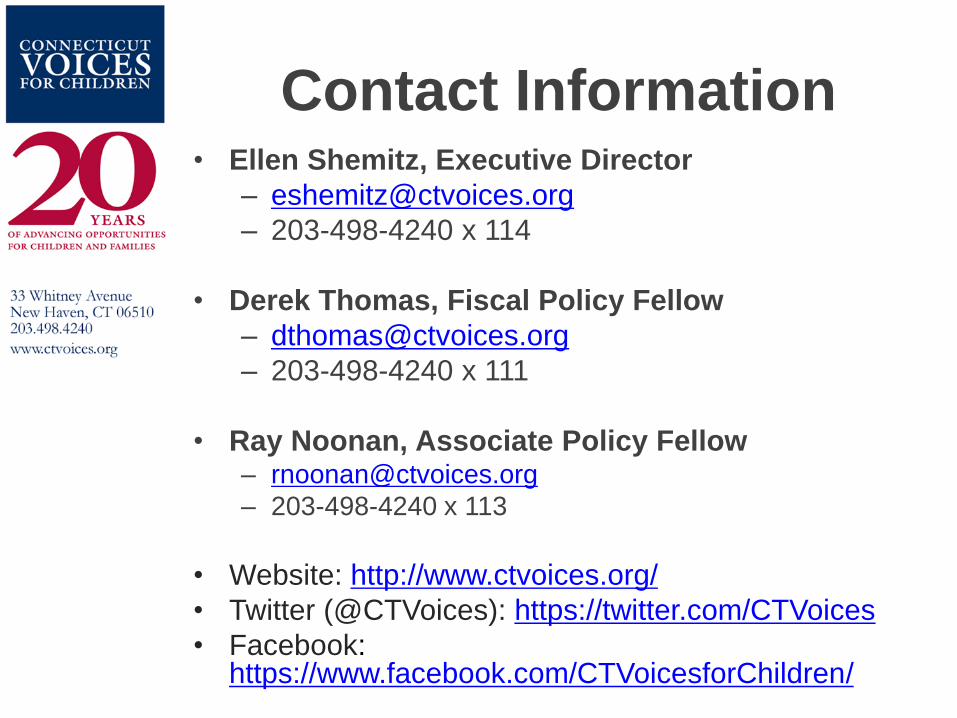
Contact Information • Ellen Shemitz, Executive Director
– 203-498-4240 x 114
• Derek Thomas, Fiscal Policy Fellow
– 203-498-4240 x 111
• Ray Noonan, Associate Policy Fellow – [email protected]
– 203-498-4240 x 113
• Website: http://www.ctvoices.org/
• Twitter (@CTVoices): https://twitter.com/CTVoices
• Facebook: https://www.facebook.com/CTVoicesforChildren/

16th Annual
Budget Forum
Building a Budget
for Connecticut's
Future