2005-2006 wheat research verification program … wheat research verification program ... and rice,...
TRANSCRIPT

2006 Arkansas
U.S. Department of Agriculture and County Governments Cooperating
The Wheat Research Verification Program is funded by Arkansas wheat producers
through checkoff monies administered by the Arkansas Wheat Promotion Board.
AG 976

Table of Contents Page
Authors and Acknowledgments……………………………………………………………….…. 2
Abstract…………………………………………………………………………………………… 3
Introduction………………………………………………………………………………………. 4
WRVP Methodology……………………………………………………………………………... 5
Results and Discussion………………………………………………………….……………….. 7
Table 1. Variety, Field Size, and Preplant Fertilizer, WRVP Fields, 2006……………………… 7
Table 2. General Soils Information, WRVP Fields, 2006……………………………………….. 8
Table 3. Fall 2005 Soil Test Results…………………………………………………………….. 9
Table 4. Previous Crop and Preplant Tillage Operations for WRVP Fields, 2006……………… 9
Table 5. Variety, Seeding Date, Rate, and Method, WRVP Fields, Fall, 2005………….……… 10
Table 6. Spring Nitrogen, WRVP Fields, 2006………………………………………….….…… 11
Table 7. Weed, Disease, and Insect Summary, WRVP Fields, 2006……………………………. 12
Table 8. Harvest Date, Grain Yield, Test Weight for WRVP Fields and Pounds of Nitrogen per Bushel,2006………………………………………………….……………….………... 13
Economic Analysis……………………………………………………………………………….. 14
Table 9. Economic Summary of WRVP Fields, 2006…………………………………….…….. 17
Table 10. Various Specified Operating Costs of WRVP Fields, 2006…………………………... 18
Appendix, Economic Analysis By County………………………………………………….……. 19
1
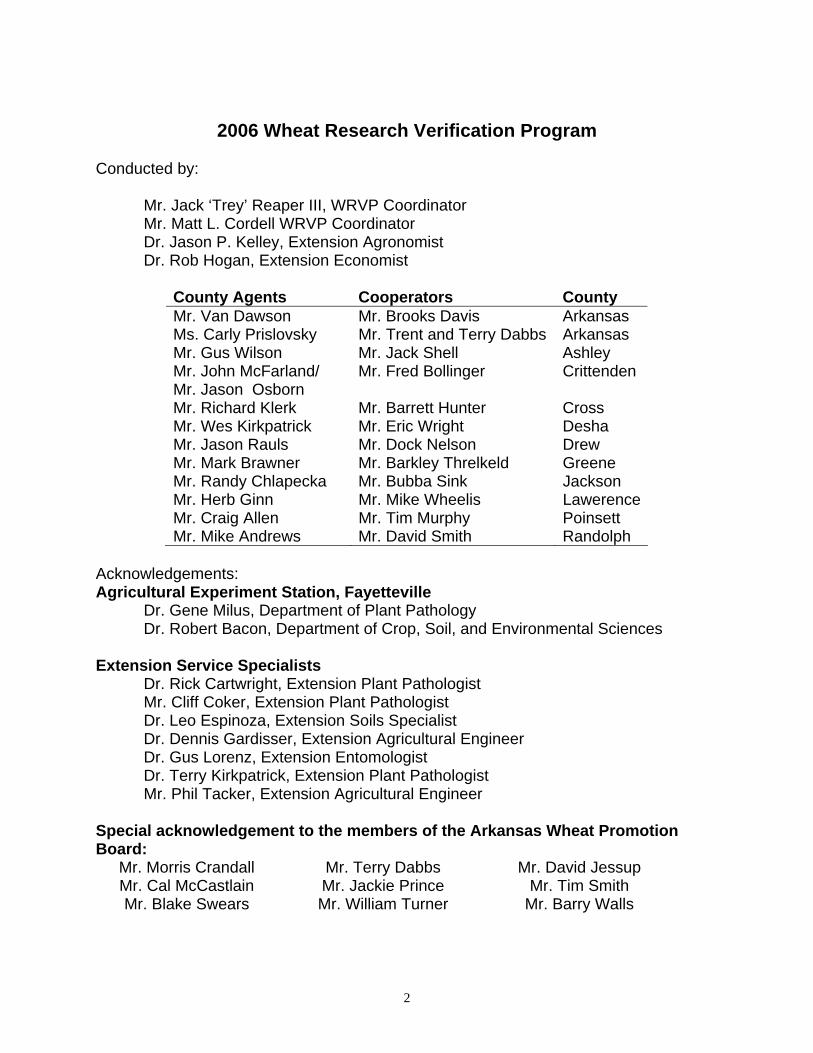
2006 Wheat Research Verification Program
Conducted by: Mr. Jack ‘Trey’ Reaper III, WRVP Coordinator Mr. Matt L. Cordell WRVP Coordinator Dr. Jason P. Kelley, Extension Agronomist Dr. Rob Hogan, Extension Economist
County Agents Cooperators County Mr. Van Dawson Mr. Brooks Davis Arkansas Ms. Carly Prislovsky Mr. Trent and Terry Dabbs Arkansas Mr. Gus Wilson Mr. Jack Shell Ashley Mr. John McFarland/ Mr. Jason Osborn
Mr. Fred Bollinger Crittenden
Mr. Richard Klerk Mr. Barrett Hunter Cross Mr. Wes Kirkpatrick Mr. Eric Wright Desha Mr. Jason Rauls Mr. Dock Nelson Drew Mr. Mark Brawner Mr. Barkley Threlkeld Greene Mr. Randy Chlapecka Mr. Bubba Sink Jackson Mr. Herb Ginn Mr. Mike Wheelis Lawerence Mr. Craig Allen Mr. Tim Murphy Poinsett Mr. Mike Andrews Mr. David Smith Randolph
Acknowledgements: Agricultural Experiment Station, Fayetteville Dr. Gene Milus, Department of Plant Pathology Dr. Robert Bacon, Department of Crop, Soil, and Environmental Sciences Extension Service Specialists Dr. Rick Cartwright, Extension Plant Pathologist Mr. Cliff Coker, Extension Plant Pathologist Dr. Leo Espinoza, Extension Soils Specialist Dr. Dennis Gardisser, Extension Agricultural Engineer Dr. Gus Lorenz, Extension Entomologist Dr. Terry Kirkpatrick, Extension Plant Pathologist Mr. Phil Tacker, Extension Agricultural Engineer Special acknowledgement to the members of the Arkansas Wheat Promotion Board:
Mr. Morris Crandall Mr. Terry Dabbs Mr. David Jessup Mr. Cal McCastlain Mr. Jackie Prince Mr. Tim Smith Mr. Blake Swears Mr. William Turner Mr. Barry Walls
2

Abstract
The 2006 Wheat Research Verification Program (WRVP) was implemented by the University of Arkansas Cooperative Extension Service on 12 producer fields located in Arkansas, Ashley, Crittenden, Cross, Desha, Drew, Greene, Jackson, Lawrence, Poinsett, and Randolph Counties. This is an increase from 7 fields in the program in 2005. This increase in WRVP fields is in direct relation to the increased wheat acreage in Arkansas this past year. Cooperators from the counties above selected 9 varieties from a short list provided by the agent and research verification coordinator. These varieties were selected based upon performance and characteristics determined by the University of Arkansas variety tests. Soil types ranged from sandy loam to clay, with previous crops of corn, soybean, and rice, as well as one field left fallow prior to wheat planting. Seeding dates ranged from October 4 through November 11, with seeding rates varying from 113 to 165 lbs/ac. Nine fields were drill seeded and three were broadcast seeded. Cooperators in Arkansas, Ashley, Desha, and Randolph Counties utilized a bedded seedbed to provide multiple drain furrows that became critical in periods of heavy precipitation. Eight of the 12 fields in the WRVP were treated with herbicides. Leaf and stripe were a decreased problem with only two fields treated in 2006. Insects were also not a factor throughout the season; however, many fields showed the typical minor symptoms of barley yellow dwarf virus (BYDV), which is vectored by aphids. Some fields experienced wet weather occasionally, but dry weather prevailed for much of the winter and throughout the spring months. This allowed for an earlier than usual harvest in most fields. Harvest dates ranged from May 20 through June 9. Average yield for the WRVP was 73.1 bu/ac, compared to a state average yield of 61 bu/ac on 300,000 harvested acres. Yields ranged from 52.7 bu/ac in Jackson County to 93.7 bu/ac in Greene County. Dry conditions during harvest improved test weight, and the average test weigh was 59.6 lb/bu this year. Improved variety selection, good surface drainage, timely fertilization, and effective pest management practices have been frequently mentioned by producers and county agents as factors which make WRVP fields more profitable and/or produce higher yields. Economic analysis was conducted using a budget generator to estimate specific costs of production for each field. Returns were calculated using the cooperator’s sales price or the average June price reported by the Arkansas Market News Service from terminals at Wynne and Dermott. Ten of the 12 WRVP fields resulted in a positive net return. Fertilizer remains the greatest input cost associated with wheat production in Arkansas. The Wheat Research Verification Program continues to demonstrate that Extension’s research-based recommendations can produce profitable, high yielding wheat across a wide range of conditions and soil types. Over a 20-year period, the WRVP has averaged 13.3 bu/ac greater than the state average yield. The program is funded by the wheat checkoff dollars and administered through the Arkansas Wheat Promotion Board.
3

Introduction
The Wheat Research Verification Program (WRVP) represents an interdisciplinary effort of farmers, county Extension agents, Extension specialists, and researchers committed to improving the profitability of wheat production in Arkansas. The WRVP program began in 1986 under the direction of the University of Arkansas Cooperative Extension Service. The Arkansas Wheat Promotion Board has allocated the funding necessary for the WRVP program each year since its inception. The WRVP program is designed as on-farm demonstrations of all the research-based recommendations required to grow wheat profitably in Arkansas. The WRVP program is part of the University of Arkansas Extension Service's goal of helping wheat producers make economically, agronomically, and environmentally sound decisions on their farms. The specific objectives of the program are: 1. To verify research-based recommendations for profitable wheat production in
all wheat producing areas of Arkansas. 2. To develop a database for economic analysis of all aspects of wheat
production. 3. To demonstrate that consistently high yields of wheat can be produced
economically with the use of available technology and inputs. 4. To identify specific problems and opportunities in Arkansas wheat production
for further investigation. 5. To promote timely cultural and management practices among all wheat
farmers. 6. To provide training and assistance to county agents with limited expertise in
wheat production.
4
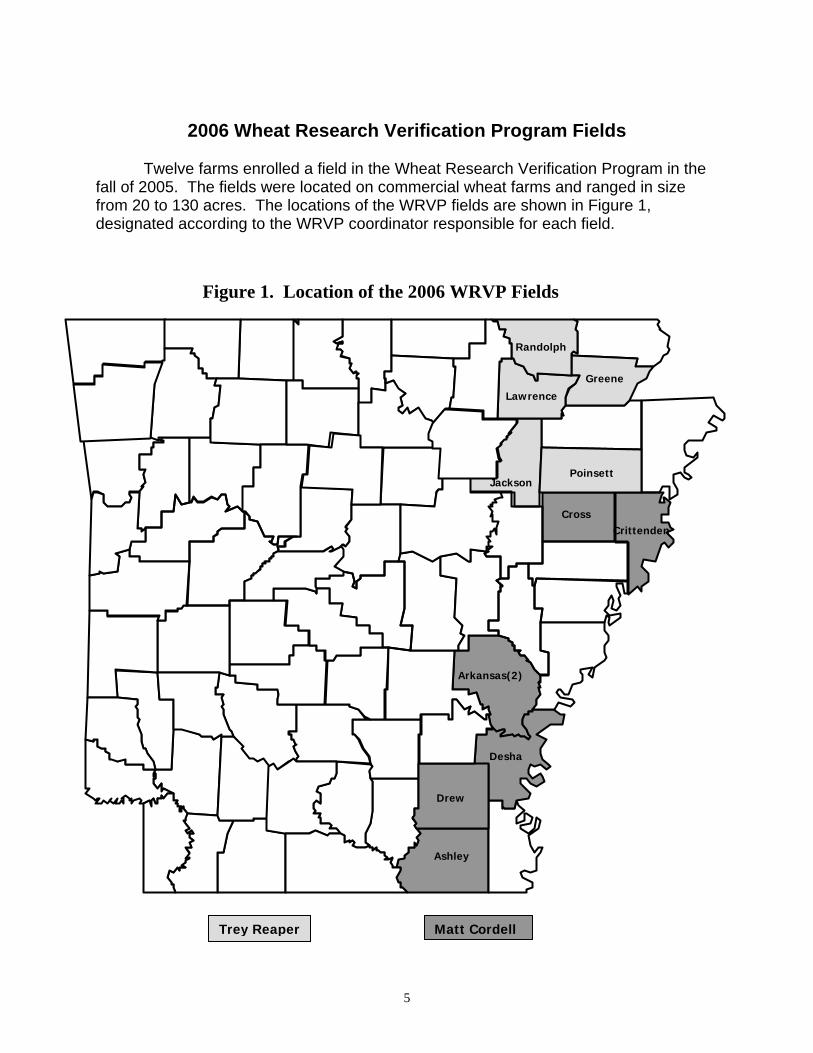
2006 Wheat Research Verification Program Fields
Twelve farms enrolled a field in the Wheat Research Verification Program in the fall of 2005. The fields were located on commercial wheat farms and ranged in size from 20 to 130 acres. The locations of the WRVP fields are shown in Figure 1, designated according to the WRVP coordinator responsible for each field.
Figure 1. Location of the 2006 WRVP Fields
Drew
Ashley
Crittenden
Poinsett
Cross
Greene
Lawrence
Randolph
Jackson
Arkansas(2)
Desha
Trey Reaper Matt Cordell
5

The program is conducted for two consecutive years with each grower/cooperator. When an interested cooperator was identified, the cooperator, county agent, and specialist selected a field to enroll in the program in the fall of 2005. Prospective fields are required to meet the following criteria specified by the WRVP advisory committee: 1. Field size of at least 15 acres. 2. A yield potential equal to or greater than the county average. 3. A soil pH above 5.6. 4. A previous crop of corn, sorghum (without atrazine), soybeans, summer fallow,
rice, or pasture. 5. The potential for good surface drainage. A representative soil sample of the field was analyzed and the field was inspected by the coordinator and county agent. When the soil test results were obtained, the county agent, cooperator, and coordinator met to discuss recommended practices for seedbed preparation, wheat variety selection, and fertilization. All management decisions were made based on current Extension recommendations. For situations where there were no specific recommendations included in the field plan, a member of the Wheat Verification Committee was consulted. As often as practical, members of the committee were consulted and updated on the condition of the fields. Once seedbed preparation began, the day-to-day management decisions were made by the county agent and coordinator with assistance from appropriate specialists and researchers as conditions warranted. Data were collected on stand counts, growth stage, tillering, heads per square foot, diseases, weeds, and insects during the course of the growing season. Grain yields and test weights were determined by elevator weigh tickets on all WRVP fields. An economic analysis of each field was conducted by an Extension economist and is included in the appendix of this report. To facilitate comparisons among fields and to allow year-to-year comparisons, average costs of certain operations are computed and used to generate the budgets in this report.
6

Results and Discussion
The variety, field size and preplant fertilizer for each WRVP field are listed in Table 1. The average field size was 55.2 acres ranging from 20 to 130 acres.
Table 1. Variety, Field Size, and Preplant Fertilizer, WRVP Fields 2006
County Variety Field Size(Acres)
Preplant Fertilizer1
(lbs/ac) Arkansas 1 AgriPro/Coker Beretta 46 0-60-0 Arkansas 2 Delta King 9410 20 27-69-90
Ashley Hornbeck 3266 125 0-50-60 Crittenenden Delta King 9410 40 None
Cross AgriPro/Coker Beretta 60 27-69-0 Desha Terral LA841 30 0-40-80 Drew Delta King 9410 29 None
Greene AgriPro/Coker Natchez 35 27-69-0
Jackson Delta Grow 4500 130 46-46-47 as 1 ton/ac chicken litter
Lawrence FFR 8302 38 0-78-78 Poinsett Armor 3330 75 40-100-100
Randolph Croplan 8302 34 40-80-80 1Nitrogen – Phosphorus – Potassium.
Coordinators of the Wheat Research Verification Program met with the Extension Wheat Agronomist to develop a short list of varieties suited to each potential verification field’s environment. Initially, 15 WRVP fields were planned for the 2006 growing season. Unfortunately, a very dry summer and fall made for less than adequate soil moisture at planting time in much of the state. After a tough summer crop, an increase in prices of nitrogen fertilizer also lessened the interest in planting wheat. For those fields that were planted, the Wheat Update, a summary of variety trials conducted by the University of Arkansas Agricultural Experiment Station, was used to obtain yield, physiological, and disease data for certain varieties on a range of soil types. The producer made the final variety selection using those on the list provided by the county agent. The best overall disease resistance and yield history is sought in variety selection. Nine varieties were planted in the WRVP in the fall of 2005, reflecting the specific needs of different soil types, geographic regions, and the overall management strategy employed by the cooperators.
7

Table 2 shows the soil classification for each WRVP field. These fields consisted of clay, sand, and silt loam soils. The range in soil types reflects the range of soils where wheat could be planted in Arkansas during the fall of 2005. Good surface drainage is key to profitable wheat production, and each WRVP cooperator was encouraged to provide the best drainage possible. Drainage furrows were constructed at regular intervals to enhance surface drainage in all fields. Fields in Arkansas, Ashley, Desha, and Randolph were planted on raised beds allowing multiple drain furrows across the field with the option to furrow-irrigate double-cropped soybean. Additionally, growers were requested to monitor and maintain drainage from planting through harvest.
Table 2. General Soil Information, WRVP Fields 2006 County Soil Classification
Arkansas 1 Stuttgart silt loam, DeWitt silt loam Arkansas 2 Rilla silt loam
Ashley Calloway silt loam Crittenenden Sharkey clay
Cross Calloway silt loam Desha Herbert silt loam, Rilla silt loam Drew Perry clay
Greene Calhoun silt loam
Jackson Bosket fine sandy loam, Dundee silt loam, and Amagon silt loam
Lawrence Crowley silt loam Poinsett Calloway silt loam
Randolph Broseley loamy fine sand The soil analysis results for each field are displayed in Table 3. These data were used to establish fall fertilization recommendations. Fields in Arkansas, Cross, Greene, Jackson, Poinsett, and Randolph Counties received supplemental fall nitrogen due to previous crops of either corn or rice. All others received mixed fertilizer. In most cases, it is expedient and practical to apply fertilizer for both wheat and double-cropped soybeans in the fall. Thus, the fertilizer applied may not accurately reflect the needs of the wheat crop alone. This is especially true for the fields where large amounts of potash and phosphorus were applied. Furthermore, the cost of preplant fertilizer was assigned to wheat according to the following schedule: 100% of nitrogen applied and 50% of phosphorus and potassium.
8

Table 3. Fall 2005 Soil Test Results, WRVP County pH P K Ca Mg Na SO4-S Fe Mn Cu Zn CEC
Arkansas 1 6.7 50 251 2668 226 62 26 357 117 2.3 5.2 10 Arkansas 2 6.3 78 136 1257 232 79 25 377 87 1.9 3.7 7
Ashley 6.5 29 127 2363 270 73 17 315 118 2.4 4.8 10 Cross 5.7 23 216 2220 366 39 22 239 388 1.4 13.1 12 Desha 6.8 78 145 2029 233 77 23 356 147 1.6 7.6 9 Drew 5.3 15 695 5081 2338 242 32 290 199 2.9 7.3 30
Greene 6.1 62 236 2288 279 28 25 295 351 2 6.5 11 Jackson 5.7 76 189 1314 159 35 18 266 348 1.9 9 8.5
Lawrence 7.5 32 124 3815 711 149 22 249 441 1.8 4.5 15 Poinsett 6.8 30 128 2219 412 68 34 268 258 3.5 21 10
Randolph 6.4 54 103 1552 210 43 18 248 115 1.4 9.5 7
Previous crop and tillage operations are listed in Table 4. Eight fields were
planted following soybean, two following corn, one following rice, and one that was fallow the previous growing season. Fields following rice or corn generally require more tillage operations due to heavy crop residue. Conventional tillage operations were used for seedbed preparation in most fields with the exception of fields in Arkansas, Ashley, and Cross County, which were planted in a no-till system.
Table 4. Previous Crop and Preplant Tillage Operation for WRVP Fields, 2006.
County Previous Crop Tillage Operations Arkansas 1 Fallow Disk, Field Cultivate (2X), Float Arkansas 2 Rice Mow
Ashley Soybean None Crittenenden Soybean Field Cultivate
Cross Soybean None Desha Soybean Hip Drew Soybean Disk (2X)
Greene Soybean Disk, Float, Field Cultivate (2X) Jackson Corn V-Ripped, Disk, Field Cultivate
Lawrence Soybean Disk (2X) Poinsett Soybean Disk, Float, Field Cultivate
Randolph Corn Disk, Field Cultivate, Bedder/Roller
9
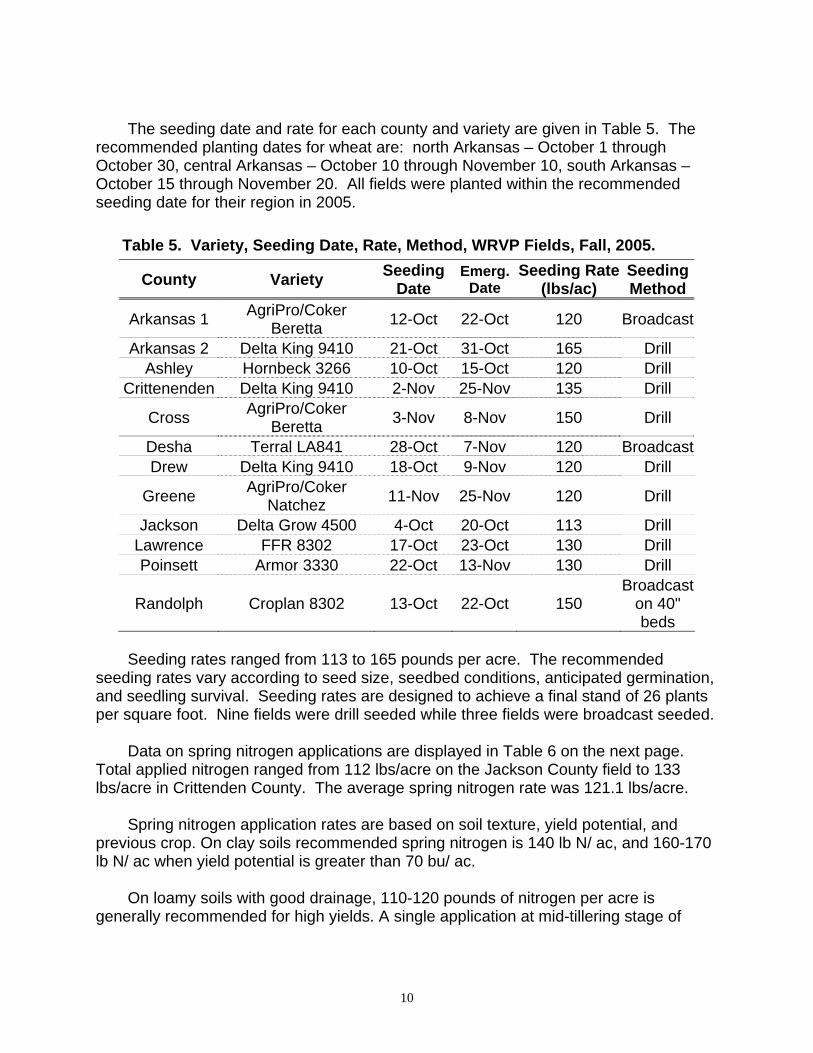
The seeding date and rate for each county and variety are given in Table 5. The recommended planting dates for wheat are: north Arkansas – October 1 through October 30, central Arkansas – October 10 through November 10, south Arkansas – October 15 through November 20. All fields were planted within the recommended seeding date for their region in 2005.
Table 5. Variety, Seeding Date, Rate, Method, WRVP Fields, Fall, 2005.
County Variety Seeding Date
Emerg. Date
Seeding Rate (lbs/ac)
Seeding Method
Arkansas 1 AgriPro/Coker Beretta 12-Oct 22-Oct 120 Broadcast
Arkansas 2 Delta King 9410 21-Oct 31-Oct 165 Drill Ashley Hornbeck 3266 10-Oct 15-Oct 120 Drill
Crittenenden Delta King 9410 2-Nov 25-Nov 135 Drill
Cross AgriPro/Coker Beretta 3-Nov 8-Nov 150 Drill
Desha Terral LA841 28-Oct 7-Nov 120 BroadcastDrew Delta King 9410 18-Oct 9-Nov 120 Drill
Greene AgriPro/Coker Natchez 11-Nov 25-Nov 120 Drill
Jackson Delta Grow 4500 4-Oct 20-Oct 113 Drill Lawrence FFR 8302 17-Oct 23-Oct 130 Drill Poinsett Armor 3330 22-Oct 13-Nov 130 Drill
Randolph Croplan 8302 13-Oct 22-Oct 150 Broadcast
on 40" beds
Seeding rates ranged from 113 to 165 pounds per acre. The recommended seeding rates vary according to seed size, seedbed conditions, anticipated germination, and seedling survival. Seeding rates are designed to achieve a final stand of 26 plants per square foot. Nine fields were drill seeded while three fields were broadcast seeded. Data on spring nitrogen applications are displayed in Table 6 on the next page. Total applied nitrogen ranged from 112 lbs/acre on the Jackson County field to 133 lbs/acre in Crittenden County. The average spring nitrogen rate was 121.1 lbs/acre. Spring nitrogen application rates are based on soil texture, yield potential, and previous crop. On clay soils recommended spring nitrogen is 140 lb N/ ac, and 160-170 lb N/ ac when yield potential is greater than 70 bu/ ac. On loamy soils with good drainage, 110-120 pounds of nitrogen per acre is generally recommended for high yields. A single application at mid-tillering stage of
10

wheat development may often satisfy the nitrogen requirements of the crop. However, heavy or frequent spring rainfall causes saturated soils and subsequent loss and/or leaching of nitrates outside the root zone. Thus, split applications of nitrogen are often required to avoid excessive nitrogen losses. In addition, standing water may cause nitrogen losses that can be corrected with supplemental fertilizer of 20-40 pounds of nitrogen per acre, according to Extension recommendations. Frequent rainfall, heavy rainfall, and standing water did not pose as a problem on WRVP fields in the spring. Spring nitrogen was applied in a timely manner in WRVP fields as well as the majority of wheat fields in Arkansas in 2006. All 2006 WRVP fields received split applications of nitrogen, with Greene County receiving a three-way split application. Nine of the twelve WRVP fields received sulfur with the first spring nitrogen application. Sulfur was applied due to low soil test sulfur levels (Table 3).
Table 6. Spring Nitrogen, WRVP Fields, 2006. First Application Second Application
County Date Source
Date Source Total lb N/A
Arkansas 1 28-Feb 100# urea + 50# A.S. 13-Mar 140# urea 121
Arkansas 2 28-Feb 75# urea + 75# A.S. 10-Mar 140# urea 115
Ashley 15-Feb 110# urea + 40# A.S. 15-Mar 125# urea 117
Crittenenden 28-Feb 75# urea + 75# A.S. 13-Mar 180# urea 133
Cross 27-Feb 70-45-45 25-Mar 75# urea + 75#
A.S. 121
Desha 28-Feb 100# urea + 50# A.S. 15-Mar 140# urea 121
Drew 28-Feb
100# urea + 130# DAP 16-Mar 130# urea 129
Greene 27-Jan 80# urea
28-Feb 3rd
App.: 17-Mar
80# urea + 50# A.S.
3rd App.: 80# urea
121
Jackson 8-Feb 120# urea + 50# A.S. 6-Mar 100# urea 112 Lawrence 9-Feb 127# urea + 50# A.S. 7-Mar 100# urea 115
Poinsett 28-Feb 125# urea + 50# A.S. 31-Mar 125# urea 125
Randolph 9-Feb 135# urea + 50# A.S. 6-Mar 110# urea 123
11

The 2006 WRVP fields were not immune to weeds and disease. A summary of pests and chemicals used is displayed in Table 7. Ryegrass was not a major problem in 2005. The Jackson County field was the only one treated with Osprey for ryegrass and other winter weeds. The new chemical provided good control of these pests. Cross and Arkansas WRVP fields were treated with Hoelon to control ryegrass around field borders. Others had minimal pressure but didn’t require treatment. Six fields in the program were treated for winter broadleaf weeds with spring applications. Unlike the previous year, stripe and leaf rusts were not an issue across the state in 2006. Stripe rust was not present in any WRVP field in 2006. Leaf rust however was observed in several WRVP fields, but in most cases the infection was late in the growing season and did not warrant an application of fungicide. Leaf rust and powdery mildew were a problem earlier in the season in Jackson and Poinsett Counties and Tilt was applied at 4 oz/A. Barley yellow dwarf virus was observed in wheat and oat fields across the state, but the disease was noticed at only minimal or normal levels in most WRVP fields in 2006. Geese damage was minor this year for most WRVP fields; however, above- average damage did occur in Arkansas(2) County. Wheat typically recovers from geese damage, and this field was no exception. Table 7. Weed, Disease, and Insect Summary - WRVP, 2006
County Pest Summary and Chemical Application Arkansas 1 2 pts/ac Hoelon (border) for ryegrass Arkansas 2 1.5 pts/ac 2,4-D for cutleaf evening primrose
Ashley None
Crittenenden 1.5 pts/ac 2,4-D + 0.5 oz/ac Harmony Ex. for wild garlic and misc. broadleaf weeds
Cross 2 pts/ac Hoelon (border) for ryegrass Desha None Drew None
Greene 1.5 pts/ac 2,4-D for buttercups
Jackson 4.75 oz/ac Osprey (border) for ryegrass
0.5 oz/ac Harmony Extra for winter broadleaf weeds 4 oz/ac Tilt for leaf rust & powdery mildew
Lawrence None
Poinsett 0.5 oz/ac Harmony Ex. (border) for winter broadleaf weeds 4 oz/ac Tilt for leaf rust & powdery mildew
Randolph 0.33 oz/ac Express for vetch
The harvest date, grain yield, test weight, and pounds of nitrogen per bushel are shown in Table 8. A hot, dry spring allowed for a timely harvest of all WRVP fields. Conditions were dry for most of the growing season, and this led to a record yielding wheat crop in Arkansas. 2006 WRVP fields achieved a respectable average yield of
12

73.1 bu/ac. This average was 2.6 bu/ac more than last year’s WRVP, and remains higher than the predicted state average yield 61 bu/ac reported by the USDA. The Arkansas(1) and Greene Co. fields exceeded our yield expectations and averaged over 90 bu/ac each. Only the Jackson and Randolph Co. fields yielded below the predicted state average yield. The poor yield of these fields could be from several factors including freeze damage, effects of Barley Yellow Dwarf Virus, and possibly negative effects from lack of rainfall.
The WRVP attempts to avoid low test weights by planting varieties with good test weight characteristics and timely harvest. Low test weights were reported across the state as well as for some WRVP fields. WRVP test weights ranged from 57.0 to 61.8 with an average of 59.6 lb/bu.
The pounds of nitrogen per bushel variable is a simple ratio of total applied
nitrogen divided by the grain yield. It attempts to measure the efficiency of nitrogen fertilizer applications. The efficiency ranged from 1.29 lbs N/bu to 2.13 lbs N/bu and averaged 1.7 lb N/bu of wheat.
Table 8. Harvest Date, Grain Yield, Test Weight for WRVP Fields, 2006
County Harvest Date Test Weight (lb/bu)
Yield (bu/ac @ 13.5%)
Pounds N/bu
Arkansas 1 27-May 61.8 90.2 1.34 Arkansas 2 8-Jun 59.8 65.9 1.75
Ashley 20-May 60.2 85.0 1.38 Crittenenden 9-Jun 62.5 2.13
Cross 6-Jun 57.0 70.6 1.71 Desha 24-May 59.0 75.5 1.60 Drew 8-Jun 58.2 64.6 2.00
Greene 6-Jun 60.4 93.7 1.29 Jackson 4-Jun 57.9 52.7 2.13
Lawrence 8-Jun 60.4 75.4 1.53 Poinsett 9-Jun 59.4 80.7 1.55
Randolph 7-Jun 61.0 60.4 2.04
WRVP Average: 73.1 Predicted State Yield Average: 61.0
13

ECONOMIC ANALYSIS: 2006 WRVP
This section provides information on the development of estimated production costs for the 2006 Wheat Research Verification Program. Records of field operations on each field provided the basis for estimating these costs (see Appendix). The field records were compiled by participating county Extension faculty and the coordinators of the Wheat Research Verification Program. Presented in this analysis are specified operating and ownership costs for each trial. Not included are overhead labor costs, other overhead costs, insurance costs, and opportunity costs for management and unpaid family labor. Assuming a 25% share rent for each field incorporates land costs. Direct Expenses Direct expenses are those expenditures that would generally require annual cash outlays and would be included on an annual operating loan application. Actual quantities of all operating inputs as reported by the cooperators were used in this analysis. The prices used for these inputs were, for the most part, the same as those reported in the “2006 Cost of Production Estimates” published by the Cooperative Extension Service. If an input were used that did not have a published price, a price quote for that input was obtained from a supply dealer. Fuel and repair costs for machinery were calculated using a budget generator based on parameters and standards published in the American Society of Agricultural Engineers 1993 Handbook. Therefore, the producers' actual machinery costs will vary from the machinery cost estimates that are presented in this report. However, the producers' actual field operations were used as a basis for calculations and his equipment size and type were matched as closely as possible to the existing data set used in the annual set of state crop budgets. Direct expenses for the twelve WRVP fields range from $106.49 per acre for Drew County to $152.65 per acre for Greene County and averaged $133.45 per acre. Direct expenses per bushel ranged from $1.50 in Ashley County to $2.44 in Jackson County and averaged $1.90 per bushel. Fixed Expenses The fixed expenses category in Table 9 represents the cost of owning and using farm equipment. These costs can vary greatly from one farm to another depending on the farm's size, management skills, and annual use. The fixed expenses presented in Table 9 include depreciation and interest. These costs are based on estimated initial cost and expected useful life of machinery similar to that used by the producer. Ownership costs were allocated on a per acre basis using estimated performance rates and hours of annual use. Calculations were made by using a budget generator based
14

on parameters and standards published in the American Society of Agricultural Engineers 1993 Handbook. Economic costs may differ from short-run tax based cash accounting figures for a particular year. The economic approach spreads these costs over the entire useful life of the machinery. In the long-run, the farm business must cover these costs to remain viable. Fixed expenses for the twelve fields ranged from $15.85 per acre for Desha County to $25.77 per acre for Greene County and averaged $20.62 per acre. High fixed expenses can be the result of numerous trips across the field.
Using custom operators rather than owning equipment replaces fixed expenses with direct expenses (custom work). Cooperators with high fixed expenses but low custom work expenses probably used high-clearance sprayers for insecticide, herbicide, and/or fungicide treatments instead of using custom aerial application. Total Specified Expenses Since fixed costs can be substituted for direct cost and vice-versa, total specified expense is calculated to give the true picture of expenses. Not included in the total specified expenses in Table 9 are charges for land, risk, overhead, and management. The overhead and management costs would be better addressed in a whole-farm analysis and will not be dealt with in this discussion. Total specified expenses per acre for the twelve fields ranged from $127.24 for Drew County to $178.42 for Greene County and averaged $154.07. Total specified expenses per bushel ranged from $1.73 in Ashley County to $2.87 in Jackson County and averaged $2.20 for the twelve fields. Land Costs Land costs incurred by producers participating in the Wheat Research Verification Program would likely vary from land ownership, cash rent, or some form of crop share arrangement. Therefore, a comparison of these divergent cost structures would contribute little to this analysis. For this reason, a 25 percent (25%) crop share rental arrangement with no cost sharing was assumed. This is not meant to imply that this arrangement is normal or that it should be used in place of existing arrangements. It is simply a consistent measure to be used across all trials. There are many other tenancy arrangements that are in use. Table 9 presents the cost of production per bushel after 25 percent of the yield is given to the landlord. These break-even prices ranged from $2.30 per bushel in Ashley County to $3.83 per bushel in Jackson County. The average cost of production for the twelve fields was $2.93 per bushel.
15

16
Returns per Acre Break-even prices, such as those displayed in Table 9, are very useful information, especially for making marketing decisions. However, having the lowest break-even price does not guarantee the highest returns. The total yield available for sale still plays a key role in determining returns per acre. Per acre returns for each of the twelve fields are presented in Table 10. Government payments and other sources of farm income, which contribute to overall farm income, have been ignored in this table. The wheat price used in Table 10 is either the cooperator’s sales price or the average June price reported by the Arkansas Market News Service from terminals at Wynne and Dermott. The most profitable field, Poinsett County had net returns of $91.20 per acre. The least profitable field was Jackson County losing $12.62 per acre. The objective in any one year is to receive sufficient sales to at least cover direct expenses and rent. This allows the business to repay operating debts and farm again next year. Across several years, per acre returns over total expenses and rent in Table 10 need to be positive for the farm business to remain solvent.
The general trend in Table 10 shows that the higher yielding fields resulted in higher net returns. Arkansas, Ashley, Greene, and Poinsett Counties were the higher yielding counties and had higher net returns. Jackson County had the least yield and suffered the most negative net return.

Table 9. Estimated costs per acre and breakeven prices: 2006 Wheat Research Verification Program. Arkansas 1 Arkansas 2 Ashley Crittenden Cross Desha Drew Greene Jackson Lawrence Poinsett Randolph W. Average Total AcresAcres 46 23 120.1 40 53.6 30 24 31 130 38 75 34 644.7Direct Exp. ($/acre) ($/acre) ($/acre) ($/acre) ($/acre) ($/acre) ($/acre) ($/acre) ($/acre) ($/acre) ($/acre) ($/acre) ($/acre) Custom Work 36.20 27.02 26.50 32.38 21.95 25.83 21.94 37.25 20.66 26.35 29.10 22.67 26.43 Fertilizer1 54.17 68.74 60.25 57.47 67.87 63.33 49.81 58.57 57.27 54.53 63.99 61.37 59.81 Herbicides 8.76 3.15 3.58 9.51 3.35 3.93 0.64 1.84 2.63 Fungicide 10.23 10.23 Crop Seed 19.20 26.40 19.20 21.60 24.00 24.00 14.40 23.87 18.08 21.12 20.80 24.00 20.60 Operator Labor 3.19 2.43 2.10 1.96 1.79 2.14 3.04 3.81 3.12 2.66 3.14 3.69 2.72 Hand Labor 2.18 1.20 0.51 0.96 0.51 0.77 0.51 0.85 0.64 0.51 1.73 0.85 Diesel Fuel2 11.46 6.47 6.59 6.38 5.32 6.26 7.75 12.39 9.55 6.76 10.32 9.56 8.32 Repairs & Maint. 4.77 5.52 4.91 4.07 4.52 3.68 5.34 5.67 5.35 4.81 5.15 5.97 5.00 Interest on Op. Cap. 4.17 3.65 3.52 4.64 3.60 3.61 3.44 6.65 3.50 3.39 4.03 3.48 3.84
Total Direct Exp.3 141.92 145.56 127.85 138.52 133.36 129.36 106.49 152.65 128.61 120.26 147.91 134.31 133.45Total Fixed Exp.4 22.81 18.64 18.78 17.72 16.52 15.85 20.75 25.77 22.74 18.50 22.96 23.89 20.62
Total Specified Exp.5 164.73 164.20 146.63 156.24 149.88 145.21 127.24 178.42 151.35 138.76 170.87 158.20 154.07
Per Acre Yield6 90.2 65.9 85.0 62.5 70.6 75.5 64.6 93.7 52.7 75.4 80.7 60.4 72.4Breakeven Price Over: Direct Expenses7 $1.57 $2.21 $1.50 $2.22 $1.89 $1.71 $1.65 $1.63 $2.44 $1.59 $1.83 $2.22 $1.90 Total Expenses8 $1.83 $2.49 $1.73 $2.50 $2.12 $1.92 $1.97 $1.90 $2.87 $1.84 $2.12 $2.62 $2.20 Total Expenses and Rent9 $2.44 $3.32 $2.30 $3.33 $2.83 $2.56 $2.63 $2.54 $3.83 $2.45 $2.82 $3.49 $2.931Only one half of all P & K is charged to wheat crop. The other half is charged to soybeans.2Price of diesel was taken to be $2.20 per gallon.3Specified out-of-pocket expenses, such as seed, fertilizer, herbicides, interest on all machinery and irrigation equipment, etc.4Total ownership costs which include charges for depreciation , taxes, and insurance.5Total specified operating costs plus ownership costs.6Yields adjusted to 13.5%.7Price per bushel required by the farmer to equal total specified operating costs. Does not include land, overhead, risk, and management cost.8Price per bushel required by the farmer to equal total specified operating and ownership costs. Does not include land, risk, and management costs. 17

18
Table 10. Esti lphAcresPer Acre Yield
mated returns per acre: 2006 Wheat Research Verification Program
Arkansas 1 Arkansas 2 Ashley Crittenden Cross Desha Drew Greene Jackson Lawrence Poinsett Rando46 23 120.1 40 53.6 30 24 31 130 38 75 34
1 90.2 65.9 85.0 62.5 70.6 75.5 64.6 93.7 52.7 75.4 80.7 60.4Sales Price2 $3.38 $3.88 $3.45 $3.60 $3.38 $3.70 $3.38 $3.96 $3.51 $3.38 $4.33 $3.3
$304.61 $255.69 $293.25 $225.00 $238.63 $279.35 $218.16 $371.05 $184.98 $254.85 $349.43 $204.
p.
8
Sales 15
Total Direct Ex 3 $141.92 $145.56 $127.85 $138.52 $133.36 $129.36 $106.49 $152.65 $128.61 $120.26 $147.91 $134.ir. Exp. $162.69 $110.13 $165.40 $86.48 $105.27 $149.99 $111.67 $218.40 $56.37 $134.59 $201.52 $69.84
d Exp.
31 Returns over D
Total Specifie 4 $164.73 $164.20 $146.63 $156.24 $149.88 $145.21 $127.24 $178.42 $151.35 $138.76 $170.87 $158.al Exp. $139.88 $91.49 $146.62 $68.76 $88.75 $134.14 $90.92 $192.63 $33.63 $116.09 $178.56 $45.95
are)
20 Returns over Tot
Rent (25% sh 5 $76.15 $63.92 $73.31 $56.25 $59.66 $69.84 $54.54 $92.76 $46.24 $63.71 $87.36 $51.04 Total Exp.
$63.73 $27.57 $73.31 $12.51 $29.09 $64.30 $36.38 $99.87 -$12.62 $52.38 $91.20 -$5.09 Returns over and Rent1Yields adjusted to 13.5%.2Sales Price is the greater of average Arkansas market price July through June and CCC Loan Price.3Specified out-of-pocket expenses, such as seed, fertilizer, herbicides, interest on all machinery and irrigation equipment, etc.4Total specified operating costs plus ownership costs which include charges for depreciation , taxes, and insurance.5A 25% crop share rent was assumed as a land charge for a renter situation. No cost sharing was assumed.

19

20
Appendix
Economic Analysis by County
Estimated operating expenses and crop input costs

21
Table 1.A Estimated resource use and costs for field operations, per acre Lawrence County University of Arkansas _______________________________________________________________________________________________________________________________________________ POWER UNIT COST EQUIPMENT COST ALLOC LABOR OPERATING/DURABLE INPUT OPERATION/ SIZE/ POWER UNIT PERF TIMES -------------- -------------- ------------- ----------------------- TOTAL OPERATING INPUT UNIT SIZE RATE OVER MTH DIRECT FIXED DIRECT FIXED HOURS COST AMOUNT PRICE COST COST _______________________________________________________________________________________________________________________________________________ ------------dollars----------- dollars ---------dollars--------- Disk Harrow 24' MFWD 150 0.081 2.00 Oct 3.26 3.46 1.18 3.00 0.16 1.33 12.23 0-26-26 lb 0.25 Oct 77.5000 0.11 8.53 8.53 Cstm Ap Grd Fert acre 0.2500 4.75 1.19 1.19 Planting 1.00 Oct Grain Drill 24' MFWD 150 0.078 1.56 1.66 0.82 1.90 0.15 1.28 7.22 Wheat Seed Private lb 132.0000 0.16 21.12 21.12 Urea, Solid (46% N) lb 1.00 Feb 127.0000 0.17 22.38 22.38 Amm Sulfate (21% N) lb 50.0000 0.12 6.00 6.00 Cstm Ap Air Fert lb 177.0000 0.05 8.85 8.85 Urea, Solid (46% N) lb 1.00 Mar 100.0000 0.17 17.62 17.62 Cstm Ap Air Fert lb 100.0000 0.05 5.00 5.00 Harvest 1.00 Jun Header Wheat/Sorghum 30' Rigid275hp 0.085 4.31 7.69 0.44 0.79 0.08 0.69 13.92 Cstm Haul Wheat bu 75.4000 0.15 11.31 11.31 ------- ------- ------- ------- ------ ------- ------- -------- TOTALS 9.13 12.81 2.44 5.69 0.40 3.30 102.00 135.37 INTEREST ON OPERATING CAPITAL 3.39 UNALLOCATED LABOR 0.00 TOTAL SPECIFIED COST 138.76 _______________________________________________________________________________________________________________________________________________

22
Table 1.F Estimated costs per acre Lawrence County
University of Arkansas _______________________________________________________________________ ITEM UNIT PRICE QUANTITY AMOUNT YOUR FARM _______________________________________________________________________ dollars dollars DIRECT EXPENSES FERTILIZERS 0-26-26 lb 0.11 77.5000 8.53 _________ Urea, Solid (46% N) lb 0.17 227.0000 40.00 _________ Amm Sulfate (21% N) lb 0.12 50.0000 6.00 _________ CROP SEED Wheat Seed Private lb 0.16 132.0000 21.12 _________ CUSTOM HIRE Cstm Ap Grd Fert acre 4.75 0.2500 1.19 _________ Cstm Ap Air Fert lb 0.05 277.0000 13.85 _________ Cstm Haul Wheat bu 0.15 75.4000 11.31 _________ OPERATOR LABOR Tractors hour 8.12 0.2422 1.97 _________ Harvesters hour 8.12 0.0851 0.69 _________ HAND LABOR Implements hour 8.12 0.0785 0.64 _________ DIESEL FUEL Tractors gal 2.20 1.8705 4.11 _________ Harvesters gal 2.20 1.2047 2.65 _________ REPAIR & MAINTENANCE Implements acre 2.44 1.0000 2.44 _________ Tractors acre 0.71 1.0000 0.71 _________ Harvesters acre 1.66 1.0000 1.66 _________ INTEREST ON OP. CAP. acre 3.39 1.0000 3.39 _________ --------- TOTAL DIRECT EXPENSES 120.26 _________ FIXED EXPENSES Implements acre 5.69 1.0000 5.69 _________ Tractors acre 5.12 1.0000 5.12 _________ Harvesters acre 7.69 1.0000 7.69 _________ --------- TOTAL FIXED EXPENSES 18.50 _________ --------- TOTAL SPECIFIED EXPENSES 138.76 _________ _______________________________________________________________________

23
Table 2.A Estimated resource use and costs for field operations, per acre Greene County , University of Arkansas _______________________________________________________________________________________________________________________________________________ POWER UNIT COST EQUIPMENT COST ALLOC LABOR OPERATING/DURABLE INPUT OPERATION/ SIZE/ POWER UNIT PERF TIMES -------------- -------------- ------------- ----------------------- TOTAL OPERATING INPUT UNIT SIZE RATE OVER MTH DIRECT FIXED DIRECT FIXED HOURS COST AMOUNT PRICE COST COST _______________________________________________________________________________________________________________________________________________ ------------dollars----------- dollars ---------dollars--------- Disk Harrow 32' MFWD 225 0.061 1.00 Oct 1.81 1.89 0.54 1.37 0.06 0.50 6.11 Land Plane 50'x16' MFWD 225 0.121 1.00 Oct 3.59 3.73 0.16 0.50 0.12 0.99 8.97 0-33-16 lb 0.25 Oct 45.0000 0.15 6.75 6.75 Cstm Ap Grd Fert acre 0.2500 4.75 1.19 1.19 Field Cultivate 24' MFWD 225 0.062 1.00 Oct 1.85 1.91 0.28 1.42 0.06 0.51 5.97 Cultipacker 20' MFWD 225 0.074 1.00 Nov 2.21 2.30 0.19 0.32 0.07 0.61 5.63 Grain Drill 30' MFWD 225 0.062 1.00 Nov 1.86 1.93 0.82 1.92 0.12 1.02 7.55 Wheat Seed Private lb 120.0000 0.16 19.20 19.20 Fungicide Seed Trt lbseed 120.0000 0.03 4.67 4.67 Urea, Solid (46% N) lb 1.00 Jan 100.0000 0.17 17.62 17.62 Cstm Ap Air Fert lb 100.0000 0.05 5.00 5.00 Amm Sulfate (21% N) lb 1.00 Feb 50.0000 0.12 6.00 6.00 Urea, Solid (46% N) lb 80.0000 0.17 14.10 14.10 Cstm Ap Air Fert lb 130.0000 0.05 6.50 6.50 Barrage (2, 4-D) oz 1.00 Mar 12.0000 0.29 3.48 3.48 Surfactant (80-20) pt 0.3875 1.15 0.45 0.45 Cstm Ap Air Herb acre 1.0000 5.50 5.50 5.50 Urea, Solid (46% N) lb 1.00 Mar 80.0000 0.17 14.10 14.10 Cstm Ap Air Fert acre 1.0000 5.00 5.00 5.00 Harvest 1.00 Jun Header Wheat/Sorghum 30' Rigid275hp 0.085 4.31 7.69 0.44 0.79 0.08 0.69 13.92 Cstm Haul Wheat bu 93.7000 0.15 14.06 14.06 ------- ------- ------- ------- ------ ------- ------- -------- TOTALS 15.63 19.45 2.43 6.32 0.53 4.32 123.62 171.77 INTEREST ON OPERATING CAPITAL 6.65 UNALLOCATED LABOR 0.00 TOTAL SPECIFIED COST 178.42 _______________________________________________________________________________________________________________________________________________

24
Table 2.F Estimated costs per acre Greene County , University of Arkansas _______________________________________________________________________ ITEM UNIT PRICE QUANTITY AMOUNT YOUR FARM _______________________________________________________________________ dollars dollars DIRECT EXPENSES FERTILIZERS 0-33-16 lb 0.15 45.0000 6.75 _________ Urea, Solid (46% N) lb 0.17 260.0000 45.82 _________ Amm Sulfate (21% N) lb 0.12 50.0000 6.00 _________ HERBICIDES Barrage (2, 4-D) oz 0.29 12.0000 3.48 _________ CROP SEED Wheat Seed Private lb 0.16 120.0000 19.20 _________ Fungicide Seed Trt lbseed 0.03 120.0000 4.67 _________ ADJUVANTS Surfactant (80-20) pt 1.15 0.3875 0.45 _________ CUSTOM HIRE Cstm Ap Grd Fert acre 4.75 0.2500 1.19 _________ Cstm Ap Air Fert lb 0.05 230.0000 11.50 _________ Cstm Ap Air Herb acre 5.50 1.0000 5.50 _________ Cstm Ap Air Fert acre 5.00 1.0000 5.00 _________ Cstm Haul Wheat bu 0.15 93.7000 14.06 _________ OPERATOR LABOR Tractors hour 8.12 0.3824 3.12 _________ Harvesters hour 8.12 0.0851 0.69 _________ HAND LABOR Implements hour 8.12 0.0628 0.51 _________ DIESEL FUEL Tractors gal 2.20 4.4291 9.74 _________ Harvesters gal 2.20 1.2047 2.65 _________ REPAIR & MAINTENANCE Implements acre 2.43 1.0000 2.43 _________ Tractors acre 1.58 1.0000 1.58 _________ Harvesters acre 1.66 1.0000 1.66 _________ INTEREST ON OP. CAP. acre 6.65 1.0000 6.65 _________ --------- TOTAL DIRECT EXPENSES 152.65 _________ FIXED EXPENSES Implements acre 6.32 1.0000 6.32 _________ Tractors acre 11.76 1.0000 11.76 _________ Harvesters acre 7.69 1.0000 7.69 _________ --------- TOTAL FIXED EXPENSES 25.77 _________ --------- TOTAL SPECIFIED EXPENSES 178.42 _________ _______________________________________________________________________

25
Table 3.A Estimated resource use and costs for field operations, per acre Randolph County , University of Arkansas _______________________________________________________________________________________________________________________________________________ POWER UNIT COST EQUIPMENT COST ALLOC LABOR OPERATING/DURABLE INPUT OPERATION/ SIZE/ POWER UNIT PERF TIMES -------------- -------------- ------------- ----------------------- TOTAL OPERATING INPUT UNIT SIZE RATE OVER MTH DIRECT FIXED DIRECT FIXED HOURS COST AMOUNT PRICE COST COST _______________________________________________________________________________________________________________________________________________ ------------dollars----------- dollars ---------dollars--------- Rotary Cutter 12' MFWD 170 0.098 1.00 Oct 2.21 2.39 0.62 0.52 0.09 0.80 6.54 BURN LABOR hour 1.00 Oct 0.15 1.22 1.22 Disk Harrow 24' MFWD 170 0.081 1.00 Oct 1.85 2.00 0.59 1.50 0.08 0.66 6.60 Field Cultivate 32' MFWD 170 0.046 1.00 Oct 1.05 1.14 0.27 1.38 0.04 0.38 4.22 12-24-24 lb 0.25 Oct 81.2500 0.15 12.19 12.19 Cstm Ap Grd Fert acre 0.2500 4.75 1.19 1.19 Disk Bed w/roller 12R-30 MFWD 170 0.062 1.00 Oct 1.40 1.52 0.32 1.03 0.06 0.51 4.78 Grain Drill 30' MFWD 170 0.062 1.00 Oct 1.41 1.53 0.82 1.92 0.12 1.02 6.70 Wheat Seed Private lb 150.0000 0.16 24.00 24.00 Urea, Solid (46% N) lb 1.00 Feb 135.0000 0.17 23.79 23.79 Amm Sulfate (21% N) lb 50.0000 0.12 6.00 6.00 Cstm Ap Air Fert acre 1.0000 5.00 5.00 5.00 Urea, Solid (46% N) lb 1.00 Mar 110.0000 0.17 19.39 19.39 Cstm Ap Air Fert acre 1.0000 5.00 5.00 5.00 Express oz 0.44 Mar 0.1452 12.69 1.84 1.84 Cstm Ap Air Herb acre 0.4400 5.50 2.42 2.42 Header Wheat/Sorghum 25' Rigid 240hp 0.102 1.00 Jun 4.53 8.13 0.46 0.83 0.10 0.83 14.78 Cstm Haul Wheat bu 60.4000 0.15 9.06 9.06 ------- ------- ------- ------- ------ ------- ------- -------- TOTALS 12.45 16.71 3.08 7.18 0.66 5.42 109.88 154.72 INTEREST ON OPERATING CAPITAL 3.48 UNALLOCATED LABOR 0.00 TOTAL SPECIFIED COST 158.20 _______________________________________________________________________________________________________________________________________________

26
Table 3.F Estimated costs per acre Randolph County , University of Arkansas _______________________________________________________________________ ITEM UNIT PRICE QUANTITY AMOUNT YOUR FARM _______________________________________________________________________ dollars dollars DIRECT EXPENSES FERTILIZERS 12-24-24 lb 0.15 81.2500 12.19 _________ Urea, Solid (46% N) lb 0.17 245.0000 43.18 _________ Amm Sulfate (21% N) lb 0.12 50.0000 6.00 _________ HERBICIDES Express oz 12.69 0.1452 1.84 _________ CROP SEED Wheat Seed Private lb 0.16 150.0000 24.00 _________ CUSTOM HIRE Cstm Ap Grd Fert acre 4.75 0.2500 1.19 _________ Cstm Ap Air Fert acre 5.00 2.0000 10.00 _________ Cstm Ap Air Herb acre 5.50 0.4400 2.42 _________ Cstm Haul Wheat bu 0.15 60.4000 9.06 _________ OPERATOR LABOR Tractors hour 8.12 0.3520 2.86 _________ Harvesters hour 8.12 0.1021 0.83 _________ HAND LABOR Implements hour 8.12 0.0628 0.51 _________ BURN LABOR Special Labor hour 8.12 0.1500 1.22 _________ DIESEL FUEL Tractors gal 2.20 3.0808 6.78 _________ Harvesters gal 2.20 1.2617 2.78 _________ REPAIR & MAINTENANCE Implements acre 3.08 1.0000 3.08 _________ Tractors acre 1.14 1.0000 1.14 _________ Harvesters acre 1.75 1.0000 1.75 _________ INTEREST ON OP. CAP. acre 3.48 1.0000 3.48 _________ --------- TOTAL DIRECT EXPENSES 134.31 _________ FIXED EXPENSES Implements acre 7.18 1.0000 7.18 _________ Tractors acre 8.58 1.0000 8.58 _________ Harvesters acre 8.13 1.0000 8.13 _________ --------- TOTAL FIXED EXPENSES 23.89 _________ --------- TOTAL SPECIFIED EXPENSES 158.20 _________ _______________________________________________________________________

27
Table 4.A Estimated resource use and costs for field operations, per acre Arkansas County 1 , University of Arkansas _______________________________________________________________________________________________________________________________________________ POWER UNIT COST EQUIPMENT COST ALLOC LABOR OPERATING/DURABLE INPUT OPERATION/ SIZE/ POWER UNIT PERF TIMES -------------- -------------- ------------- ----------------------- TOTAL OPERATING INPUT UNIT SIZE RATE OVER MTH DIRECT FIXED DIRECT FIXED HOURS COST AMOUNT PRICE COST COST _______________________________________________________________________________________________________________________________________________ ------------dollars----------- dollars ---------dollars--------- Heavy Disk 27' 4WD 500 0.075 1.00 Oct 4.57 3.74 0.67 1.70 0.07 0.61 11.29 Field Cultivate 32' 2WD 190 0.046 1.00 Oct 1.15 1.12 0.27 1.38 0.04 0.38 4.30 Land Plane 50'x16' 2WD 190 0.121 1.00 Oct 3.00 2.91 0.16 0.50 0.12 0.99 7.56 Cstm Ap Grd Seed acre 1.00 Oct 1.0000 4.75 4.75 4.75 Wheat Seed Private lb 120.0000 0.16 19.20 19.20 Cstm Ap Grd Fert acre 0.50 Oct 0.5000 4.75 2.38 2.38 Phoshate (0-46-0) lb 66.5000 0.14 9.40 9.40 Field Cultivate 32' 2WD 190 0.046 1.00 Oct 1.15 1.12 0.27 1.38 0.04 0.38 4.30 Cstm Ap Grd. Herb acre 0.43 Dec 0.4300 4.75 2.04 2.04 Hoelon 3EC pt 1.1438 7.66 8.76 8.76 Cstm Ap Air Fert lb 1.00 Feb 150.0000 0.05 7.50 7.50 Urea, Solid (46% N) lb 100.0000 0.17 17.62 17.62 Amm Sulfate (21% N) lb 50.0000 0.12 6.00 6.00 Cstm Ap Air Fert lb 1.00 Mar 120.0000 0.05 6.00 6.00 Urea, Solid (46% N) lb 120.0000 0.17 21.15 21.15 Header Wheat/Sorghum 25' Rigid 240hp 0.102 1.00 May 4.53 8.13 0.46 0.83 0.10 0.83 14.78 Cstm Haul Wheat bu 90.2000 0.15 13.53 13.53 ------- ------- ------- ------- ------ ------- ------- -------- TOTALS 14.40 17.02 1.83 5.79 0.39 3.19 118.33 160.56 INTEREST ON OPERATING CAPITAL 4.17 UNALLOCATED LABOR 0.00 TOTAL SPECIFIED COST 164.73 _______________________________________________________________________________________________________________________________________________

28
Table 4.F Estimated costs per acre Arkansas County 1 , University of Arkansas _______________________________________________________________________ ITEM UNIT PRICE QUANTITY AMOUNT YOUR FARM _______________________________________________________________________ dollars dollars DIRECT EXPENSES FERTILIZERS Phoshate (0-46-0) lb 0.14 66.5000 9.40 _________ Urea, Solid (46% N) lb 0.17 220.0000 38.77 _________ Amm Sulfate (21% N) lb 0.12 50.0000 6.00 _________ HERBICIDES Hoelon 3EC pt 7.66 1.1438 8.76 _________ CROP SEED Wheat Seed Private lb 0.16 120.0000 19.20 _________ CUSTOM HIRE Cstm Ap Grd Seed acre 4.75 1.0000 4.75 _________ Cstm Ap Grd Fert acre 4.75 0.5000 2.38 _________ Cstm Ap Grd. Herb acre 4.75 0.4300 2.04 _________ Cstm Ap Air Fert lb 0.05 270.0000 13.50 _________ Cstm Haul Wheat bu 0.15 90.2000 13.53 _________ OPERATOR LABOR Tractors hour 8.12 0.2903 2.36 _________ Harvesters hour 8.12 0.1021 0.83 _________ DIESEL FUEL Tractors gal 2.20 3.9494 8.68 _________ Harvesters gal 2.20 1.2617 2.78 _________ REPAIR & MAINTENANCE Implements acre 1.83 1.0000 1.83 _________ Tractors acre 1.19 1.0000 1.19 _________ Harvesters acre 1.75 1.0000 1.75 _________ INTEREST ON OP. CAP. acre 4.17 1.0000 4.17 _________ --------- TOTAL DIRECT EXPENSES 141.92 _________ FIXED EXPENSES Implements acre 5.79 1.0000 5.79 _________ Tractors acre 8.89 1.0000 8.89 _________ Harvesters acre 8.13 1.0000 8.13 _________ --------- TOTAL FIXED EXPENSES 22.81 _________ --------- TOTAL SPECIFIED EXPENSES 164.73 _________ _______________________________________________________________________

29
Table 5.A Estimated resource use and costs for field operations, per acre Arkansas County 2 , University of Arkansas _______________________________________________________________________________________________________________________________________________ POWER UNIT COST EQUIPMENT COST ALLOC LABOR OPERATING/DURABLE INPUT OPERATION/ SIZE/ POWER UNIT PERF TIMES -------------- -------------- ------------- ----------------------- TOTAL OPERATING INPUT UNIT SIZE RATE OVER MTH DIRECT FIXED DIRECT FIXED HOURS COST AMOUNT PRICE COST COST _______________________________________________________________________________________________________________________________________________ ------------dollars----------- dollars ---------dollars--------- Rotary Cutter 15' MFWD 190 0.078 1.00 Oct 1.97 2.11 0.80 0.68 0.07 0.64 6.20 BURN LABOR hour 1.00 Oct 0.15 1.22 1.22 NT Grain Drill 20' MFWD 150 0.117 1.00 Oct 2.34 2.49 1.89 4.40 0.23 1.92 13.04 Wheat Seed Private lb 165.0000 0.16 26.40 26.40 Cstm Ap Grd Fert acre 0.50 Oct 0.5000 4.75 2.38 2.38 Potash (0-0-60) lb 75.0000 0.12 9.38 9.38 DAP 18-46-0 lb 75.0000 0.14 10.71 10.71 Cstm Ap Grd. Herb acre 1.00 Feb 1.0000 4.75 4.75 4.75 2,4-D Amine pt 1.5000 2.10 3.15 3.15 Cstm Ap Air Fert acre 1.00 Feb 1.0000 5.00 5.00 5.00 Amm Sulfate (21% N) lb 75.0000 0.12 9.00 9.00 Urea, Solid (46% N) lb 75.0000 0.17 13.22 13.22 Cstm Ap Air Fert acre 1.00 Mar 1.0000 5.00 5.00 5.00 Urea, Solid (46% N) lb 150.0000 0.17 26.43 26.43 Header Wheat/Sorghum 25' Rigid 240hp 0.102 1.00 Jun 4.53 8.13 0.46 0.83 0.10 0.83 14.78 Cstm Haul Wheat bu 65.9000 0.15 9.89 9.89 ------- ------- ------- ------- ------ ------- ------- -------- TOTALS 8.84 12.73 3.15 5.91 0.56 4.61 125.31 160.55 INTEREST ON OPERATING CAPITAL 3.65 UNALLOCATED LABOR 0.00 TOTAL SPECIFIED COST 164.20 _______________________________________________________________________________________________________________________________________________

30
Table 5.F Estimated costs per acre Arkansas County 2 , University of Arkansas _______________________________________________________________________ ITEM UNIT PRICE QUANTITY AMOUNT YOUR FARM _______________________________________________________________________ dollars dollars DIRECT EXPENSES FERTILIZERS Potash (0-0-60) lb 0.12 75.0000 9.38 _________ DAP 18-46-0 lb 0.14 75.0000 10.71 _________ Amm Sulfate (21% N) lb 0.12 75.0000 9.00 _________ Urea, Solid (46% N) lb 0.17 225.0000 39.65 _________ HERBICIDES 2,4-D Amine pt 2.10 1.5000 3.15 _________ CROP SEED Wheat Seed Private lb 0.16 165.0000 26.40 _________ CUSTOM HIRE Cstm Ap Grd Fert acre 4.75 0.5000 2.38 _________ Cstm Ap Grd. Herb acre 4.75 1.0000 4.75 _________ Cstm Ap Air Fert acre 5.00 2.0000 10.00 _________ Cstm Haul Wheat bu 0.15 65.9000 9.89 _________ OPERATOR LABOR Tractors hour 8.12 0.1964 1.60 _________ Harvesters hour 8.12 0.1021 0.83 _________ HAND LABOR Implements hour 8.12 0.1178 0.96 _________ BURN LABOR Special Labor hour 8.12 0.1500 1.22 _________ DIESEL FUEL Tractors gal 2.20 1.6783 3.69 _________ Harvesters gal 2.20 1.2617 2.78 _________ REPAIR & MAINTENANCE Implements acre 3.15 1.0000 3.15 _________ Tractors acre 0.62 1.0000 0.62 _________ Harvesters acre 1.75 1.0000 1.75 _________ INTEREST ON OP. CAP. acre 3.65 1.0000 3.65 _________ --------- TOTAL DIRECT EXPENSES 145.56 _________ FIXED EXPENSES Implements acre 5.91 1.0000 5.91 _________ Tractors acre 4.60 1.0000 4.60 _________ Harvesters acre 8.13 1.0000 8.13 _________ --------- TOTAL FIXED EXPENSES 18.64 _________ --------- TOTAL SPECIFIED EXPENSES 164.20 _________ _______________________________________________________________________
31
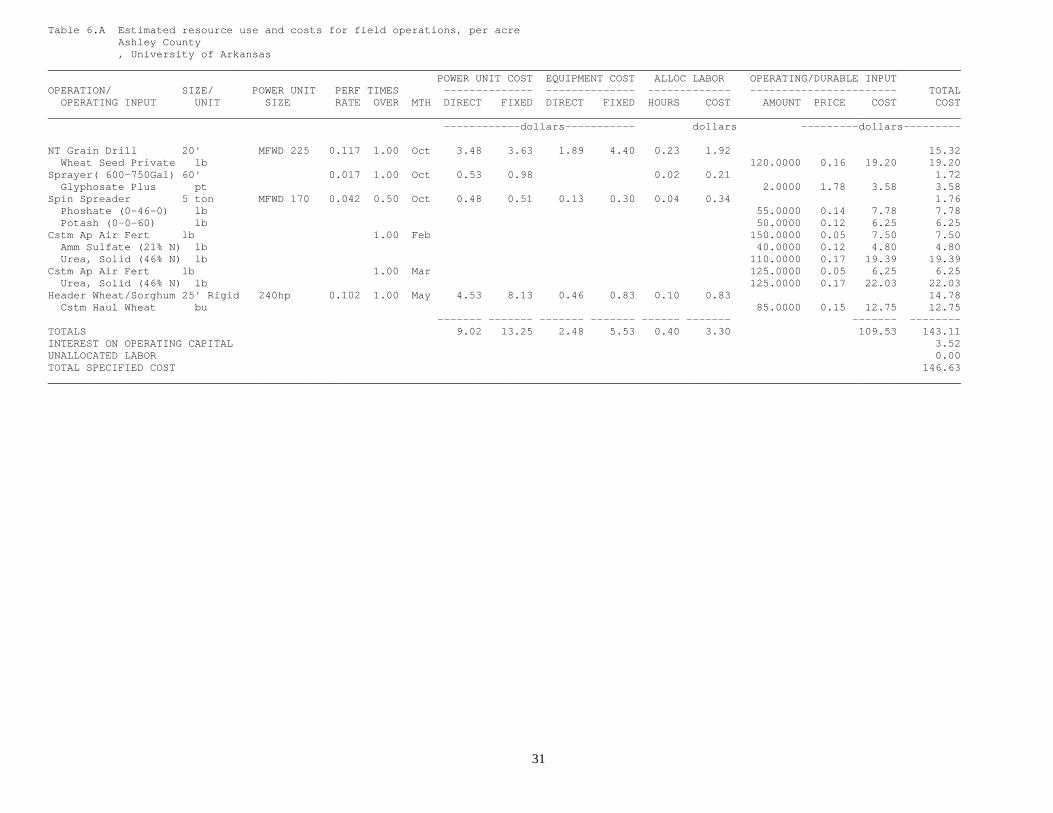
Table 6.A Estimated resource use and costs for field operations, per acre Ashley County , University of Arkansas _______________________________________________________________________________________________________________________________________________ POWER UNIT COST EQUIPMENT COST ALLOC LABOR OPERATING/DURABLE INPUT OPERATION/ SIZE/ POWER UNIT PERF TIMES -------------- -------------- ------------- ----------------------- TOTAL OPERATING INPUT UNIT SIZE RATE OVER MTH DIRECT FIXED DIRECT FIXED HOURS COST AMOUNT PRICE COST COST _______________________________________________________________________________________________________________________________________________ ------------dollars----------- dollars ---------dollars--------- NT Grain Drill 20' MFWD 225 0.117 1.00 Oct 3.48 3.63 1.89 4.40 0.23 1.92 15.32 Wheat Seed Private lb 120.0000 0.16 19.20 19.20 Sprayer( 600-750Gal) 60' 0.017 1.00 Oct 0.53 0.98 0.02 0.21 1.72 Glyphosate Plus pt 2.0000 1.78 3.58 3.58 Spin Spreader 5 ton MFWD 170 0.042 0.50 Oct 0.48 0.51 0.13 0.30 0.04 0.34 1.76 Phoshate (0-46-0) lb 55.0000 0.14 7.78 7.78 Potash (0-0-60) lb 50.0000 0.12 6.25 6.25 Cstm Ap Air Fert lb 1.00 Feb 150.0000 0.05 7.50 7.50 Amm Sulfate (21% N) lb 40.0000 0.12 4.80 4.80 Urea, Solid (46% N) lb 110.0000 0.17 19.39 19.39 Cstm Ap Air Fert lb 1.00 Mar 125.0000 0.05 6.25 6.25 Urea, Solid (46% N) lb 125.0000 0.17 22.03 22.03 Header Wheat/Sorghum 25' Rigid 240hp 0.102 1.00 May 4.53 8.13 0.46 0.83 0.10 0.83 14.78 Cstm Haul Wheat bu 85.0000 0.15 12.75 12.75 ------- ------- ------- ------- ------ ------- ------- -------- TOTALS 9.02 13.25 2.48 5.53 0.40 3.30 109.53 143.11 INTEREST ON OPERATING CAPITAL 3.52 UNALLOCATED LABOR 0.00 TOTAL SPECIFIED COST 146.63 _______________________________________________________________________________________________________________________________________________

32
Table 6.F Estimated costs per acre Ashley County , University of Arkansas _______________________________________________________________________ ITEM UNIT PRICE QUANTITY AMOUNT YOUR FARM _______________________________________________________________________ dollars dollars DIRECT EXPENSES FERTILIZERS Phoshate (0-46-0) lb 0.14 55.0000 7.78 _________ Potash (0-0-60) lb 0.12 50.0000 6.25 _________ Amm Sulfate (21% N) lb 0.12 40.0000 4.80 _________ Urea, Solid (46% N) lb 0.17 235.0000 41.41 _________ HERBICIDES Glyphosate Plus pt 1.78 2.0000 3.58 _________ CROP SEED Wheat Seed Private lb 0.16 120.0000 19.20 _________ CUSTOM HIRE Cstm Ap Air Fert lb 0.05 275.0000 13.75 _________ Cstm Haul Wheat bu 0.15 85.0000 12.75 _________ OPERATOR LABOR Tractors hour 8.12 0.1389 1.13 _________ Harvesters hour 8.12 0.1021 0.83 _________ Self-Propelled hour 8.12 0.0176 0.14 _________ HAND LABOR Implements hour 8.12 0.1389 1.13 _________ Self-Propelled hour 8.12 0.0088 0.07 _________ DIESEL FUEL Tractors gal 2.20 1.5491 3.41 _________ Harvesters gal 2.20 1.2617 2.78 _________ Self-Propelled gal 2.20 0.1815 0.40 _________ REPAIR & MAINTENANCE Implements acre 2.48 1.0000 2.48 _________ Tractors acre 0.55 1.0000 0.55 _________ Harvesters acre 1.75 1.0000 1.75 _________ Self-Propelled acre 0.13 1.0000 0.13 _________ INTEREST ON OP. CAP. acre 3.52 1.0000 3.52 _________ --------- TOTAL DIRECT EXPENSES 127.85 _________ FIXED EXPENSES Implements acre 5.53 1.0000 5.53 _________ Tractors acre 4.14 1.0000 4.14 _________ Harvesters acre 8.13 1.0000 8.13 _________ Self-Propelled acre 0.98 1.0000 0.98 _________ --------- TOTAL FIXED EXPENSES 18.78 _________ --------- TOTAL SPECIFIED EXPENSES 146.63 _________ _______________________________________________________________________

33
Table 7.A Estimated resource use and costs for field operations, per acre Crittenden County , University of Arkansas _______________________________________________________________________________________________________________________________________________ POWER UNIT COST EQUIPMENT COST ALLOC LABOR OPERATING/DURABLE INPUT OPERATION/ SIZE/ POWER UNIT PERF TIMES -------------- -------------- ------------- ----------------------- TOTAL OPERATING INPUT UNIT SIZE RATE OVER MTH DIRECT FIXED DIRECT FIXED HOURS COST AMOUNT PRICE COST COST _______________________________________________________________________________________________________________________________________________ ------------dollars----------- dollars ---------dollars--------- Field Cultivate 32' MFWD 225 0.046 2.00 Oct 2.76 2.87 0.54 2.76 0.09 0.76 9.69 Grain Drill 30' MFWD 190 0.062 1.00 Oct 1.58 1.69 0.82 1.92 0.12 1.02 7.03 Wheat Seed Private lb 135.0000 0.16 21.60 21.60 Cstm Ap Air Fert lb 1.00 Feb 150.0000 0.05 7.50 7.50 Amm Sulfate (21% N) lb 75.0000 0.12 9.00 9.00 Urea, Solid (46% N) lb 75.0000 0.17 13.22 13.22 Cstm Ap Air Fert lb 1.00 Mar 200.0000 0.05 10.00 10.00 Urea, Solid (46% N) lb 200.0000 0.17 35.25 35.25 Cstm Ap Air Herb acre 1.00 Mar 1.0000 5.50 5.50 5.50 2,4-D Amine pt 1.5000 2.10 3.15 3.15 Harmony Extra oz 0.5000 12.72 6.36 6.36 Header Wheat/Sorghum 30' Rigid 275hp 0.085 1.00 Jun 4.31 7.69 0.44 0.79 0.08 0.69 13.92 Cstm Haul Wheat bu 62.5000 0.15 9.38 9.38 ------- ------- ------- ------- ------ ------- ------- -------- TOTALS 8.65 12.25 1.80 5.47 0.30 2.47 120.96 151.60 INTEREST ON OPERATING CAPITAL 4.64 UNALLOCATED LABOR 0.00 TOTAL SPECIFIED COST 156.24 _______________________________________________________________________________________________________________________________________________

34
Table 7.F Estimated costs per acre Crittenden County , University of Arkansas _______________________________________________________________________ ITEM UNIT PRICE QUANTITY AMOUNT YOUR FARM _______________________________________________________________________ dollars dollars DIRECT EXPENSES FERTILIZERS Amm Sulfate (21% N) lb 0.12 75.0000 9.00 _________ Urea, Solid (46% N) lb 0.17 275.0000 48.46 _________ HERBICIDES 2,4-D Amine pt 2.10 1.5000 3.15 _________ Harmony Extra oz 12.72 0.5000 6.36 _________ CROP SEED Wheat Seed Private lb 0.16 135.0000 21.60 _________ CUSTOM HIRE Cstm Ap Air Fert lb 0.05 350.0000 17.50 _________ Cstm Ap Air Herb acre 5.50 1.0000 5.50 _________ Cstm Haul Wheat bu 0.15 62.5000 9.38 _________ OPERATOR LABOR Tractors hour 8.12 0.1561 1.27 _________ Harvesters hour 8.12 0.0851 0.69 _________ HAND LABOR Implements hour 8.12 0.0628 0.51 _________ DIESEL FUEL Tractors gal 2.20 1.6955 3.73 _________ Harvesters gal 2.20 1.2047 2.65 _________ REPAIR & MAINTENANCE Implements acre 1.80 1.0000 1.80 _________ Tractors acre 0.61 1.0000 0.61 _________ Harvesters acre 1.66 1.0000 1.66 _________ INTEREST ON OP. CAP. acre 4.64 1.0000 4.64 _________ --------- TOTAL DIRECT EXPENSES 138.52 _________ FIXED EXPENSES Implements acre 5.47 1.0000 5.47 _________ Tractors acre 4.56 1.0000 4.56 _________ Harvesters acre 7.69 1.0000 7.69 _________ --------- TOTAL FIXED EXPENSES 17.72 _________ --------- TOTAL SPECIFIED EXPENSES 156.24 _________ _______________________________________________________________________

35
Table 8.A Estimated resource use and costs for field operations, per acre Cross County , University of Arkansas _______________________________________________________________________________________________________________________________________________ POWER UNIT COST EQUIPMENT COST ALLOC LABOR OPERATING/DURABLE INPUT OPERATION/ SIZE/ POWER UNIT PERF TIMES -------------- -------------- ------------- ----------------------- TOTAL OPERATING INPUT UNIT SIZE RATE OVER MTH DIRECT FIXED DIRECT FIXED HOURS COST AMOUNT PRICE COST COST _______________________________________________________________________________________________________________________________________________ ------------dollars----------- dollars ---------dollars--------- Cstm Ap Grd Fert acre 0.50 Oct 0.5000 4.75 2.38 2.38 DAP 18-46-0 lb 75.0000 0.14 10.71 10.71 NT Grain Drill 20' MFWD 190 0.117 1.00 Oct 2.96 3.16 1.89 4.40 0.23 1.92 14.33 Wheat Seed Private lb 150.0000 0.16 24.00 24.00 Cstm Ap Grd. Herb acre 0.33 Feb 0.3360 4.75 1.60 1.60 Hoelon 3EC pt 0.4368 7.66 3.35 3.35 Cstm Ap Grd Fert acre 0.50 Mar 0.5000 4.75 2.38 2.38 Urea, Solid (46% N) lb 163.0000 0.17 28.73 28.73 Phoshate (0-46-0) lb 45.5000 0.14 6.43 6.43 Potash (0-0-60) lb 35.0000 0.12 4.38 4.38 Cstm Ap Air Fert lb 1.00 Mar 100.0000 0.05 5.00 5.00 Urea, Solid (46% N) lb 100.0000 0.17 17.62 17.62 Header Wheat/Sorghum 25' Rigid 240hp 0.102 1.00 Jun 4.53 8.13 0.46 0.83 0.10 0.83 14.78 Cstm Haul Wheat bu 70.6000 0.15 10.59 10.59 ------- ------- ------- ------- ------ ------- ------- -------- TOTALS 7.49 11.29 2.35 5.23 0.33 2.75 117.17 146.28 INTEREST ON OPERATING CAPITAL 3.60 UNALLOCATED LABOR 0.00 TOTAL SPECIFIED COST 149.88 _______________________________________________________________________________________________________________________________________________

36
Table 8.F Estimated costs per acre Cross County , University of Arkansas _______________________________________________________________________ ITEM UNIT PRICE QUANTITY AMOUNT YOUR FARM _______________________________________________________________________ dollars dollars DIRECT EXPENSES FERTILIZERS DAP 18-46-0 lb 0.14 75.0000 10.71 _________ Urea, Solid (46% N) lb 0.17 263.0000 46.35 _________ Phoshate (0-46-0) lb 0.14 45.5000 6.43 _________ Potash (0-0-60) lb 0.12 35.0000 4.38 _________ HERBICIDES Hoelon 3EC pt 7.66 0.4368 3.35 _________ CROP SEED Wheat Seed Private lb 0.16 150.0000 24.00 _________ CUSTOM HIRE Cstm Ap Grd Fert acre 4.75 1.0000 4.75 _________ Cstm Ap Grd. Herb acre 4.75 0.3360 1.60 _________ Cstm Ap Air Fert lb 0.05 100.0000 5.00 _________ Cstm Haul Wheat bu 0.15 70.6000 10.59 _________ OPERATOR LABOR Tractors hour 8.12 0.1178 0.96 _________ Harvesters hour 8.12 0.1021 0.83 _________ HAND LABOR Implements hour 8.12 0.1178 0.96 _________ DIESEL FUEL Tractors gal 2.20 1.1526 2.54 _________ Harvesters gal 2.20 1.2617 2.78 _________ REPAIR & MAINTENANCE Implements acre 2.35 1.0000 2.35 _________ Tractors acre 0.42 1.0000 0.42 _________ Harvesters acre 1.75 1.0000 1.75 _________ INTEREST ON OP. CAP. acre 3.60 1.0000 3.60 _________ --------- TOTAL DIRECT EXPENSES 133.36 _________ FIXED EXPENSES Implements acre 5.23 1.0000 5.23 _________ Tractors acre 3.16 1.0000 3.16 _________ Harvesters acre 8.13 1.0000 8.13 _________ --------- TOTAL FIXED EXPENSES 16.52 _________ --------- TOTAL SPECIFIED EXPENSES 149.88 _________ _______________________________________________________________________
37
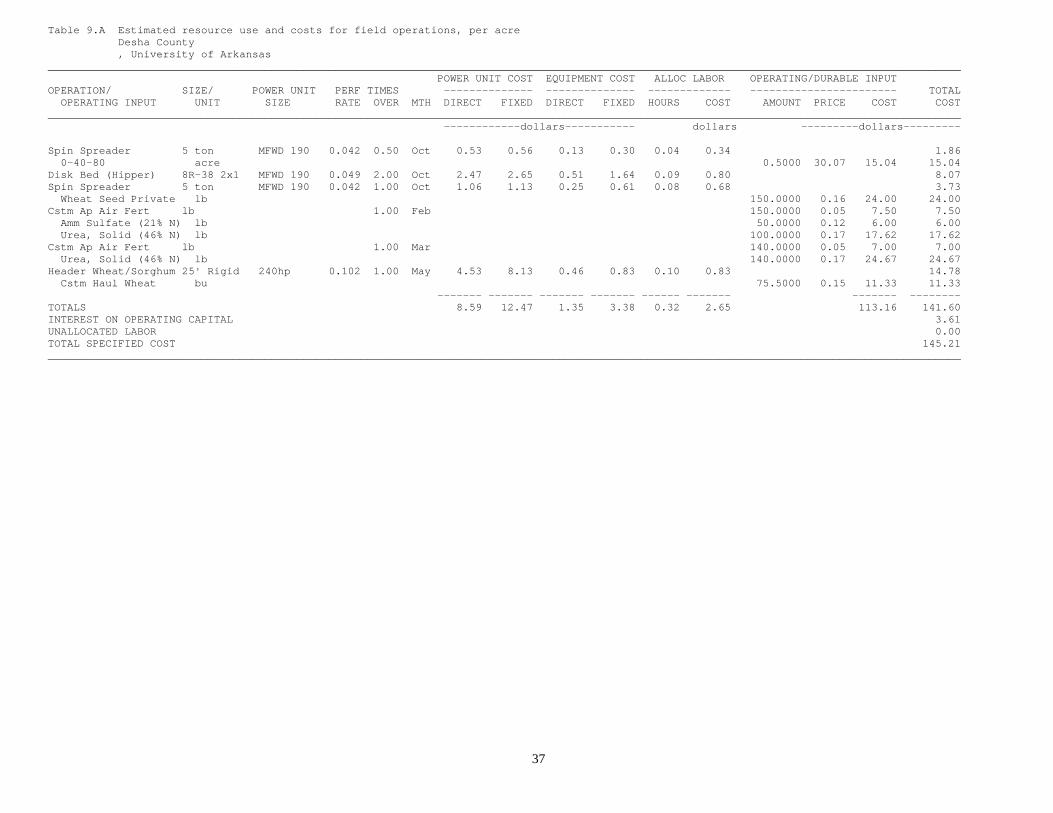
Table 9.A Estimated resource use and costs for field operations, per acre Desha County , University of Arkansas _______________________________________________________________________________________________________________________________________________ POWER UNIT COST EQUIPMENT COST ALLOC LABOR OPERATING/DURABLE INPUT OPERATION/ SIZE/ POWER UNIT PERF TIMES -------------- -------------- ------------- ----------------------- TOTAL OPERATING INPUT UNIT SIZE RATE OVER MTH DIRECT FIXED DIRECT FIXED HOURS COST AMOUNT PRICE COST COST _______________________________________________________________________________________________________________________________________________ ------------dollars----------- dollars ---------dollars--------- Spin Spreader 5 ton MFWD 190 0.042 0.50 Oct 0.53 0.56 0.13 0.30 0.04 0.34 1.86 0-40-80 acre 0.5000 30.07 15.04 15.04 Disk Bed (Hipper) 8R-38 2x1 MFWD 190 0.049 2.00 Oct 2.47 2.65 0.51 1.64 0.09 0.80 8.07 Spin Spreader 5 ton MFWD 190 0.042 1.00 Oct 1.06 1.13 0.25 0.61 0.08 0.68 3.73 Wheat Seed Private lb 150.0000 0.16 24.00 24.00 Cstm Ap Air Fert lb 1.00 Feb 150.0000 0.05 7.50 7.50 Amm Sulfate (21% N) lb 50.0000 0.12 6.00 6.00 Urea, Solid (46% N) lb 100.0000 0.17 17.62 17.62 Cstm Ap Air Fert lb 1.00 Mar 140.0000 0.05 7.00 7.00 Urea, Solid (46% N) lb 140.0000 0.17 24.67 24.67 Header Wheat/Sorghum 25' Rigid 240hp 0.102 1.00 May 4.53 8.13 0.46 0.83 0.10 0.83 14.78 Cstm Haul Wheat bu 75.5000 0.15 11.33 11.33 ------- ------- ------- ------- ------ ------- ------- -------- TOTALS 8.59 12.47 1.35 3.38 0.32 2.65 113.16 141.60 INTEREST ON OPERATING CAPITAL 3.61 UNALLOCATED LABOR 0.00 TOTAL SPECIFIED COST 145.21 _______________________________________________________________________________________________________________________________________________

38
Table 9.F Estimated costs per acre Desha County , University of Arkansas _______________________________________________________________________ ITEM UNIT PRICE QUANTITY AMOUNT YOUR FARM _______________________________________________________________________ dollars dollars DIRECT EXPENSES FERTILIZERS 0-40-80 acre 30.07 0.5000 15.04 _________ Amm Sulfate (21% N) lb 0.12 50.0000 6.00 _________ Urea, Solid (46% N) lb 0.17 240.0000 42.30 _________ CROP SEED Wheat Seed Private lb 0.16 150.0000 24.00 _________ CUSTOM HIRE Cstm Ap Air Fert lb 0.05 290.0000 14.50 _________ Cstm Haul Wheat bu 0.15 75.5000 11.33 _________ OPERATOR LABOR Tractors hour 8.12 0.1618 1.31 _________ Harvesters hour 8.12 0.1021 0.83 _________ HAND LABOR Implements hour 8.12 0.0631 0.51 _________ DIESEL FUEL Tractors gal 2.20 1.5825 3.48 _________ Harvesters gal 2.20 1.2617 2.78 _________ REPAIR & MAINTENANCE Implements acre 1.35 1.0000 1.35 _________ Tractors acre 0.58 1.0000 0.58 _________ Harvesters acre 1.75 1.0000 1.75 _________ INTEREST ON OP. CAP. acre 3.61 1.0000 3.61 _________ --------- TOTAL DIRECT EXPENSES 129.36 _________ FIXED EXPENSES Implements acre 3.38 1.0000 3.38 _________ Tractors acre 4.34 1.0000 4.34 _________ Harvesters acre 8.13 1.0000 8.13 _________ --------- TOTAL FIXED EXPENSES 15.85 _________ --------- TOTAL SPECIFIED EXPENSES 145.21 _________ _______________________________________________________________________

39
Table 10.A Estimated resource use and costs for field operations, per acre Drew County , University of Arkansas _______________________________________________________________________________________________________________________________________________ POWER UNIT COST EQUIPMENT COST ALLOC LABOR OPERATING/DURABLE INPUT OPERATION/ SIZE/ POWER UNIT PERF TIMES -------------- -------------- ------------- ----------------------- TOTAL OPERATING INPUT UNIT SIZE RATE OVER MTH DIRECT FIXED DIRECT FIXED HOURS COST AMOUNT PRICE COST COST _______________________________________________________________________________________________________________________________________________ ------------dollars----------- dollars ---------dollars--------- Disk Harrow 24' MFWD 150 0.081 2.00 Oct 3.26 3.46 1.18 3.00 0.16 1.33 12.23 Grain Drill 20' 2WD 170 0.094 1.00 Oct 2.08 1.98 0.94 2.18 0.18 1.54 8.72 Wheat Seed Private lb 90.0000 0.16 14.40 14.40 Cstm Ap Air Fert lb 0.50 Feb 115.0000 0.05 5.75 5.75 DAP 18-46-0 lb 65.0000 0.14 9.28 9.28 Urea, Solid (46% N) lb 100.0000 0.17 17.62 17.62 Cstm Ap Air Fert lb 1.00 Mar 130.0000 0.05 6.50 6.50 Urea, Solid (46% N) lb 130.0000 0.17 22.91 22.91 Header Wheat/Sorghum 22' Rigid 240hp 0.116 1.00 Jun 5.14 9.24 0.49 0.89 0.11 0.94 16.70 Cstm Haul Wheat bu 64.6000 0.15 9.69 9.69 ------- ------- ------- ------- ------ ------- ------- -------- TOTALS 10.48 14.68 2.61 6.07 0.46 3.81 86.15 123.80 INTEREST ON OPERATING CAPITAL 3.44 UNALLOCATED LABOR 0.00 TOTAL SPECIFIED COST 127.24 _______________________________________________________________________________________________________________________________________________

40
Table 10.F Estimated costs per acre Drew County , University of Arkansas _______________________________________________________________________ ITEM UNIT PRICE QUANTITY AMOUNT YOUR FARM _______________________________________________________________________ dollars dollars DIRECT EXPENSES FERTILIZERS DAP 18-46-0 lb 0.14 65.0000 9.28 _________ Urea, Solid (46% N) lb 0.17 230.0000 40.53 _________ CROP SEED Wheat Seed Private lb 0.16 90.0000 14.40 _________ CUSTOM HIRE Cstm Ap Air Fert lb 0.05 245.0000 12.25 _________ Cstm Haul Wheat bu 0.15 64.6000 9.69 _________ OPERATOR LABOR Tractors hour 8.12 0.2579 2.10 _________ Harvesters hour 8.12 0.1161 0.94 _________ HAND LABOR Implements hour 8.12 0.0942 0.77 _________ DIESEL FUEL Tractors gal 2.20 2.0889 4.60 _________ Harvesters gal 2.20 1.4338 3.15 _________ REPAIR & MAINTENANCE Implements acre 2.61 1.0000 2.61 _________ Tractors acre 0.74 1.0000 0.74 _________ Harvesters acre 1.99 1.0000 1.99 _________ INTEREST ON OP. CAP. acre 3.44 1.0000 3.44 _________ --------- TOTAL DIRECT EXPENSES 106.49 _________ FIXED EXPENSES Implements acre 6.07 1.0000 6.07 _________ Tractors acre 5.44 1.0000 5.44 _________ Harvesters acre 9.24 1.0000 9.24 _________ --------- TOTAL FIXED EXPENSES 20.75 _________ --------- TOTAL SPECIFIED EXPENSES 127.24 _________ _______________________________________________________________________

41
Table 11.A Estimated resource use and costs for field operations, per acre Poinsett County , University of Arkansas _______________________________________________________________________________________________________________________________________________ POWER UNIT COST EQUIPMENT COST ALLOC LABOR OPERATING/DURABLE INPUT OPERATION/ SIZE/ POWER UNIT PERF TIMES -------------- -------------- ------------- ----------------------- TOTAL OPERATING INPUT UNIT SIZE RATE OVER MTH DIRECT FIXED DIRECT FIXED HOURS COST AMOUNT PRICE COST COST _______________________________________________________________________________________________________________________________________________ ------------dollars----------- dollars ---------dollars--------- Disk Harrow 28' MFWD 225 0.070 1.00 Oct 2.08 2.16 0.56 1.42 0.07 0.57 6.79 Land Plane 50'x16' MFWD 225 0.121 1.00 Oct 3.59 3.73 0.16 0.50 0.12 0.99 8.97 Cstm Ap Grd Fert acre 0.25 Oct 0.2500 4.75 1.19 1.19 40-100-100 lbs 25.0000 0.55 13.93 13.93 Field Cultivate 32' MFWD 225 0.046 1.00 Oct 1.38 1.44 0.27 1.38 0.04 0.38 4.85 Grain Drill 30' MFWD 225 0.062 1.00 Oct 1.86 1.93 0.82 1.92 0.12 1.02 7.55 Wheat Seed Private lb 130.0000 0.16 20.80 20.80 Cstm Ap Grd Fert acre 1.00 Feb 1.0000 4.75 4.75 4.75 Amm Sulfate (21% N) lb 50.0000 0.12 6.00 6.00 Urea, Solid (46% N) lb 125.0000 0.17 22.03 22.03 Urea, Solid (46% N) lb 1.00 Mar 125.0000 0.17 22.03 22.03 Cstm Ap Air Fert acre 1.0000 5.00 5.00 5.00 Harmony Extra oz 0.10 Apr 0.0500 12.72 0.64 0.64 Cstm Ap Air Herb acre 0.1000 5.50 0.55 0.55 Cstm Ap Air Fung acre 1.00 Apr 1.0000 5.50 5.50 5.50 Tilt oz 4.0000 2.55 10.23 10.23 Header Wheat/Sorghum 30' Rigid 275hp 0.085 1.00 Jun 4.31 7.69 0.44 0.79 0.08 0.69 13.92 Cstm Haul Wheat bu 80.7000 0.15 12.11 12.11 ------- ------- ------- ------- ------ ------- ------- -------- TOTALS 13.22 16.95 2.25 6.01 0.44 3.65 124.76 166.84 INTEREST ON OPERATING CAPITAL 4.03 UNALLOCATED LABOR 0.00 TOTAL SPECIFIED COST 170.87 _______________________________________________________________________________________________________________________________________________

42
Table 11.F Estimated costs per acre Poinsett County , University of Arkansas _______________________________________________________________________ ITEM UNIT PRICE QUANTITY AMOUNT YOUR FARM _______________________________________________________________________ dollars dollars DIRECT EXPENSES FERTILIZERS 40-100-100 lbs 0.55 25.0000 13.93 _________ Amm Sulfate (21% N) lb 0.12 50.0000 6.00 _________ Urea, Solid (46% N) lb 0.17 250.0000 44.06 _________ FUNGICIDES Tilt oz 2.55 4.0000 10.23 _________ HERBICIDES Harmony Extra oz 12.72 0.0500 0.64 _________ CROP SEED Wheat Seed Private lb 0.16 130.0000 20.80 _________ CUSTOM HIRE Cstm Ap Grd Fert acre 4.75 1.2500 5.94 _________ Cstm Ap Air Fert acre 5.00 1.0000 5.00 _________ Cstm Ap Air Herb acre 5.50 0.1000 0.55 _________ Cstm Ap Air Fung acre 5.50 1.0000 5.50 _________ Cstm Haul Wheat bu 0.15 80.7000 12.11 _________ OPERATOR LABOR Tractors hour 8.12 0.3009 2.45 _________ Harvesters hour 8.12 0.0851 0.69 _________ HAND LABOR Implements hour 8.12 0.0628 0.51 _________ DIESEL FUEL Tractors gal 2.20 3.4858 7.67 _________ Harvesters gal 2.20 1.2047 2.65 _________ REPAIR & MAINTENANCE Implements acre 2.25 1.0000 2.25 _________ Tractors acre 1.24 1.0000 1.24 _________ Harvesters acre 1.66 1.0000 1.66 _________ INTEREST ON OP. CAP. acre 4.03 1.0000 4.03 _________ --------- TOTAL DIRECT EXPENSES 147.91 _________ FIXED EXPENSES Implements acre 6.01 1.0000 6.01 _________ Tractors acre 9.26 1.0000 9.26 _________ Harvesters acre 7.69 1.0000 7.69 _________ --------- TOTAL FIXED EXPENSES 22.96 _________ --------- TOTAL SPECIFIED EXPENSES 170.87 _________ _______________________________________________________________________

43
Table 12.A Estimated resource use and costs for field operations, per acre Jackson County , University of Arkansas _______________________________________________________________________________________________________________________________________________ POWER UNIT COST EQUIPMENT COST ALLOC LABOR OPERATING/DURABLE INPUT OPERATION/ SIZE/ POWER UNIT PERF TIMES -------------- -------------- ------------- ----------------------- TOTAL OPERATING INPUT UNIT SIZE RATE OVER MTH DIRECT FIXED DIRECT FIXED HOURS COST AMOUNT PRICE COST COST _______________________________________________________________________________________________________________________________________________ ------------dollars----------- dollars ---------dollars--------- Chisel Plow(Rigid) 24' MFWD 190 0.077 1.00 Sep 1.94 2.07 0.21 0.44 0.07 0.63 5.29 Disk Harrow 28' MFWD 225 0.070 1.00 Oct 2.08 2.16 0.56 1.42 0.07 0.57 6.79 Cust App Chicken Lit acre 0.50 Oct 0.5000 4.50 2.25 2.25 Chicken Litter ton 0.5000 25.00 12.50 12.50 Field Cultivate 32' MFWD 225 0.046 1.00 Oct 1.38 1.44 0.27 1.38 0.04 0.38 4.85 Grain Drill 30' MFWD 190 0.062 1.00 Oct 1.58 1.69 0.82 1.92 0.12 1.02 7.03 Wheat Seed Private lb 113.0000 0.16 18.08 18.08 Spin Spreader 5 ton MFWD 190 0.042 1.00 Feb 1.06 1.13 0.25 0.61 0.08 0.68 3.73 Urea, Solid (46% N) lb 120.0000 0.17 21.15 21.15 Amm Sulfate (21% N) lb 50.0000 0.12 6.00 6.00 Urea, Solid (46% N) lb 1.00 Mar 100.0000 0.17 17.62 17.62 Cstm Ap Air Fert lb 100.0000 0.05 5.00 5.00 Tilt oz 1.00 Apr 4.0000 2.55 10.23 10.23 Cstm Ap Air Fung acre 1.0000 5.50 5.50 5.50 Header Wheat/Sorghum 30' Rigid 275hp 0.085 1.00 Jun 4.31 7.69 0.44 0.79 0.08 0.69 13.92 Cstm Haul Wheat bu 52.7000 0.15 7.91 7.91 ------- ------- ------- ------- ------ ------- ------- -------- TOTALS 12.35 16.18 2.55 6.56 0.48 3.97 106.24 147.85 INTEREST ON OPERATING CAPITAL 3.50 UNALLOCATED LABOR 0.00 TOTAL SPECIFIED COST 151.35

44
Table 12.F Estimated costs per acre Jackson County , University of Arkansas _______________________________________________________________________ ITEM UNIT PRICE QUANTITY AMOUNT YOUR FARM _______________________________________________________________________ dollars dollars DIRECT EXPENSES FERTILIZERS Chicken Litter ton 25.00 0.5000 12.50 _________ Urea, Solid (46% N) lb 0.17 220.0000 38.77 _________ Amm Sulfate (21% N) lb 0.12 50.0000 6.00 _________ FUNGICIDES Tilt oz 2.55 4.0000 10.23 _________ CROP SEED Wheat Seed Private lb 0.16 113.0000 18.08 _________ CUSTOM HIRE Cust App Chicken Lit acre 4.50 0.5000 2.25 _________ Cstm Ap Air Fert lb 0.05 100.0000 5.00 _________ Cstm Ap Air Fung acre 5.50 1.0000 5.50 _________ Cstm Haul Wheat bu 0.15 52.7000 7.91 _________ OPERATOR LABOR Tractors hour 8.12 0.2987 2.43 _________ Harvesters hour 8.12 0.0851 0.69 _________ HAND LABOR Implements hour 8.12 0.1049 0.85 _________ DIESEL FUEL Tractors gal 2.20 3.1325 6.90 _________ Harvesters gal 2.20 1.2047 2.65 _________ REPAIR & MAINTENANCE Implements acre 2.55 1.0000 2.55 _________ Tractors acre 1.14 1.0000 1.14 _________ Harvesters acre 1.66 1.0000 1.66 _________ INTEREST ON OP. CAP. acre 3.50 1.0000 3.50 _________ --------- TOTAL DIRECT EXPENSES 128.61 _________ FIXED EXPENSES Implements acre 6.56 1.0000 6.56 _________ Tractors acre 8.49 1.0000 8.49 _________ Harvesters acre 7.69 1.0000 7.69 _________ --------- TOTAL FIXED EXPENSES 22.74 _________ --------- TOTAL SPECIFIED EXPENSES 151.35 _________ _______________________________________________________________________