2010 lga cuts - mn2020
TRANSCRIPT

8/9/2019 2010 LGA cuts - MN2020
http://slidepdf.com/reader/full/2010-lga-cuts-mn2020 1/16
2010 LGA& Credits
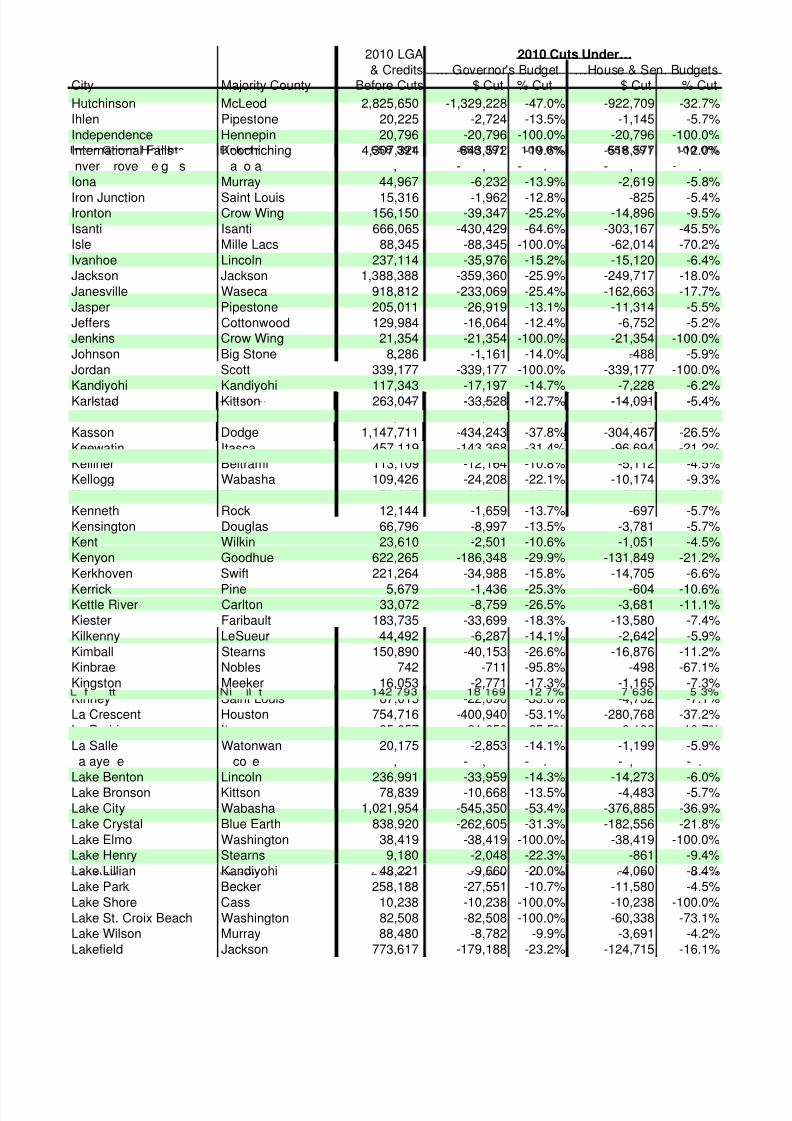
2010 City Local Government Aid (LGA) and Market Value Credit (MVC)
Reductions Under Governor's Budget and House & Senate Budgets
2010 Cuts Under…… Governor's Budget …House & Sen. Budgets
City Majority County Before Cuts $ Cut % Cut $ Cut % Cut
Ada Norman 714,073 -157,104 -22.0% -109,495 -15.3%Adams Mower 248,319 -34,303 -13.8% -14,417 -5.8%Adrian Nobles 484,743 -139,028 -28.7% -96,594 -19.9%Afton Washington 25,465 -25,465 -100.0% -25,465 -100.0%Aitkin Aitkin 924,745 -248,649 -26.9% -171,875 -18.6%Akeley Hubbard 73,353 -20,890 -28.5% -8,780 -12.0%Alban Stearns 780 221 -208 053 -26.7% -144 729 -18.5%, , . , .Albert Lea Freeborn 5,982,567 -1,632,297 -27.3% -1,137,443 -19.0%Alberta Stevens 33,873 -7,054 -20.8% -2,965 -8.8%Albertville Wright 112,380 -112,380 -100.0% -112,380 -100.0%Alden Freeborn 177,087 -26,722 -15.1% -11,231 -6.3%Aldrich Wadena 7,513 -946 -12.6% -398 -5.3%Alexandria Douglas 1,908,242 -1,012,910 -53.1% -702,187 -36.8%
Alpha Jackson 40,567 -5,917 -14.6% -2,487 -6.1%Altura Winona 58,984 -11,702 -19.8% -4,918 -8.3%Alvarado Marshall 63,963 -7,354 -11.5% -3,091 -4.8%Amboy Blue Earth 158,269 -27,718 -17.5% -11,650 -7.4%Andover Anoka 528,122 -528,122 -100.0% -528,122 -100.0%Annandale Wright 459,729 -231,626 -50.4% -159,488 -34.7%Anoka Anoka 1,773,550 -1,164,139 -65.6% -812,223 -45.8%Apple Valley Dakota 1,058,525 -1,058,525 -100.0% -1,058,525 -100.0%Appleton Swift 1,093,843 -324,561 -29.7% -219,317 -20.1%Arco Lincoln 27,632 -4,125 -14.9% -1,734 -6.3%Arden Hills Ramsey 63,664 -63,664 -100.0% -63,664 -100.0%Argyle Marshall 224,242 -25,395 -11.3% -10,673 -4.8%Arlington Sibley 836,905 -229,955 -27.5% -159,662 -19.1%
Ashby Grant 122,750 -22,501 -18.3% -9,457 -7.7%Askov Pine 77,801 -16,127 -20.7% -6,778 -8.7%Atwater Kandiyohi 323,469 -97,944 -30.3% -68,075 -21.0%
- - - -u u on ec er , - , - . - , - .Aurora Saint Louis 778,433 -230,079 -29.6% -142,287 -18.3%Austin Mower 8,524,622 -1,847,577 -21.7% -1,284,824 -15.1%Avoca Murray 30,773 -4,886 -15.9% -2,054 -6.7%Avon Stearns 289,399 -147,924 -51.1% -103,154 -35.6%Babbitt Saint Louis 472,724 -233,447 -49.4% -132,494 -28.0%Backus Cass 40,654 -13,102 -32.2% -5,506 -13.5%Badger Roseau 115,101 -15,416 -13.4% -6,479 -5.6%Bagley Clearwater 477,791 -144,469 -30.2% -100,478 -21.0%
Balaton Lyon 235,571 -32,278 -13.7% -13,566 -5.8%Barnesville Clay 765,192 -176,625 -23.1% -121,797 -15.9%Barnum Carlton 143,478 -22,594 -15.7% -9,496 -6.6%Barrett Grant 75,807 -22,423 -29.6% -9,100 -12.0%Barry Big Stone 2,972 -872 -29.3% -366 -12.3%Battle Lake Otter Tail 115,946 -86,111 -74.3% -59,708 -51.5%Baudette Lake of the Woods 350 160 -87 382 -25.0% -60 750 -17.3% , , . , .Baxter Crow Wing 197,524 -197,524 -100.0% -197,524 -100.0%Bayport Washington 499,666 -235,982 -47.2% -164,946 -33.0%Beardsley Big Stone 82,864 -9,363 -11.3% -3,935 -4.7%Beaver Bay Lake 27,264 -27,264 -100.0% -14,911 -54.7%Beaver Creek Rock 57,937 -15,045 -26.0% -6,323 -10.9%

8/9/2019 2010 LGA cuts - MN2020
http://slidepdf.com/reader/full/2010-lga-cuts-mn2020 2/16
2010 LGA& Credits
City Majority County Before Cuts $ Cut % Cut $ Cut % Cut
2010 Cuts Under…… Governor's Budget …House & Sen. Budgets
Becker Sherburne 67,887 -67,887 -100.0% -67,887 -100.0%Bejou Mahnomen 21,492 -2,244 -10.4% -943 -4.4%Belgrade Stearns 218,028 -39,302 -18.0% -16,518 -7.6%Belle Plaine Scott 531,543 -531,543 -100.0% -445,942 -83.9%
e ec es er oo ue , - , - . - , - .Bellingham Lac Qui Parle 67,614 -7,056 -10.4% -2,965 -4.4%
Beltrami Polk 29,307 -4,062 -13.9% -1,707 -5.8%Belview Redwood 119,318 -14,833 -12.4% -6,234 -5.2%Bemidji Beltrami 3,636,118 -1,066,986 -29.3% -730,000 -20.1%Bena Cass 29,461 -3,059 -10.4% -1,286 -4.4%Benson Swift 1,063,239 -338,971 -31.9% -232,413 -21.9%Bertha Todd 146,071 -15,328 -10.5% -6,442 -4.4%Bethel Anoka 45,718 -22,799 -49.9% -9,582 -21.0%Big Falls Koochiching 77,609 -9,904 -12.8% -4,163 -5.4%Big Lake Sherburne 637,037 -614,970 -96.5% -428,767 -67.3%Bigelow Nobles 58,547 -8,207 -14.0% -3,449 -5.9%Bigfork Itasca 94,823 -18,711 -19.7% -7,864 -8.3%Bingham Lake Cottonwood 32,315 -7,953 -24.6% -3,343 -10.3%Birchwood Washington 13,042 -13,042 -100.0% -13,042 -100.0%Bird Island Renville 479 695 -118 795 -24.8% -83 073 -17.3%, - , - . - , - .Biscay McLeod 16,163 -2,307 -14.3% -970 -6.0%Biwabik Saint Louis 354,283 -141,552 -40.0% -72,266 -20.4%Blackduck Beltrami 223,939 -32,723 -14.6% -13,753 -6.1%Blaine Anoka 909,052 -909,052 -100.0% -909,052 -100.0%Blomkest Kandiyohi 23,477 -4,480 -19.1% -1,883 -8.0%Blooming Prairie Steele 834,153 -227,152 -27.2% -158,217 -19.0%Bloomington Hennepin 1,371,763 -1,371,763 -100.0% -1,371,763 -100.0%Blue Earth Faribault 1,877,350 -424,792 -22.6% -284,260 -15.1%Bluffton Otter Tail 41,088 -6,001 -14.6% -2,522 -6.1%Bock Mille Lacs 18,164 -2,884 -15.9% -1,212 -6.7%Borup Norman 20,253 -2,170 -10.7% -912 -4.5%
Bovey Itasca 286,307 -43,682 -15.3% -18,359 -6.4%Bowlus Morrison 43,848 -5,548 -12.7% -2,332 -5.3%Boy River Cass 5,809 -706 -12.2% -297 -5.1%Boyd Lac Qui Parle 73,308 -11,875 -16.2% -4,816 -6.6%, , . , .Braham Isanti 544,092 -153,011 -28.1% -106,159 -19.5%Brainerd Crow Wing 4,619,884 -1,305,885 -28.3% -909,925 -19.7%Brandon Douglas 112,649 -22,380 -19.9% -9,406 -8.3%Breckenridge Wilkin 1,424,561 -317,706 -22.3% -219,680 -15.4%Breezy Point Crow Wing 69,702 -69,702 -100.0% -69,702 -100.0%Brewster Nobles 202,111 -25,897 -12.8% -10,884 -5.4%Bricelyn Faribault 140,755 -21,463 -15.2% -9,021 -6.4%
roo ar ne , - , - . - , - .Brooklyn Center Hennepin 2,111,844 -2,111,844 -100.0% -1,573,498 -74.5%Brooklyn Park Hennepin 1,539,278 -1,539,278 -100.0% -1,539,278 -100.0%Brooks Red Lake 32,618 -3,905 -12.0% -1,641 -5.0%Brookston Saint Louis 9,788 -2,621 -26.8% -1,102 -11.3%Brooten Stearns 168,294 -28,650 -17.0% -12,041 -7.2%Browerville Todd 238,340 -31,841 -13.4% -13,382 -5.6%Browns Valley Traverse 382,347 -46,801 -12.2% -17,500 -4.6%Brownsdale Mower 199,595 -29,163 -14.6% -12,257 -6.1%Brownsville Houston 72,211 -14,040 -19.4% -5,901 -8.2%Brownton McLeod 275,510 -47,245 -17.1% -19,857 -7.2%Bruno Pine 20,397 -2,509 -12.3% -1,055 -5.2%Buckman Morrison 19,907 -3,089 -15.5% -1,298 -6.5%

8/9/2019 2010 LGA cuts - MN2020
http://slidepdf.com/reader/full/2010-lga-cuts-mn2020 3/16
2010 LGA& Credits
City Majority County Before Cuts $ Cut % Cut $ Cut % Cut
2010 Cuts Under…… Governor's Budget …House & Sen. Budgets
Buffalo Wright 811,800 -811,800 -100.0% -580,762 -71.5%Buffalo Lake Renville 249,926 -53,912 -21.6% -20,496 -8.2%Buhl Saint Louis 377,367 -59,202 -15.7% -24,882 -6.6%Burnsville Dakota 1,164,636 -1,164,636 -100.0% -1,164,636 -100.0%
ur rum o , - , - . - , - .Butterfield Watonwan 180,264 -23,360 -13.0% -9,818 -5.4%
Byron Olmsted 421,798 -368,034 -87.3% -256,448 -60.8%Caledonia Houston 1,008,732 -237,107 -23.5% -162,927 -16.2%Callaway Becker 41,565 -5,893 -14.2% -2,477 -6.0%Calumet Itasca 136,331 -23,121 -17.0% -9,717 -7.1%Cambridge Isanti 1,039,228 -847,708 -81.6% -590,286 -56.8%Campbell Wilkin 63,367 -7,558 -11.9% -3,176 -5.0%Canby Yellow Medicine 835,131 -209,001 -25.0% -143,373 -17.2%Cannon Falls Goodhue 814,520 -470,846 -57.8% -328,807 -40.4%Canton Fillmore 99,785 -15,142 -15.2% -6,364 -6.4%Carlos Douglas 66,471 -14,847 -22.3% -6,240 -9.4%Carlton Carlton 256,328 -39,321 -15.3% -16,526 -6.4%Carver Carver 267,425 -267,425 -100.0% -226,321 -84.6%Cass Lake Cass 434,424 -57,784 -13.3% -23,100 -5.3%Cedar Mills Meeker 9 324 -2 088 -22.4% -877 -9.4%, - , - . - - .Center City Chisago 49,861 -32,855 -65.9% -22,947 -46.0%Centerville Anoka 80,168 -80,168 -100.0% -80,168 -100.0%Ceylon Martin 142,398 -22,093 -15.5% -9,285 -6.5%Champlin Hennepin 615,079 -615,079 -100.0% -615,079 -100.0%Chandler Murray 81,674 -12,730 -15.6% -5,350 -6.6%Chanhassen Carver 179,650 -179,650 -100.0% -179,650 -100.0%Chaska Carver 587,019 -587,019 -100.0% -555,732 -94.7%Chatfield Fillmore 890,798 -292,523 -32.8% -203,643 -22.9%Chickamaw Beach Cass 3,476 -3,476 -100.0% -3,305 -95.1%Chisago City Chisago 145,524 -145,524 -100.0% -145,524 -100.0%Chisholm Saint Louis 3,132,977 -644,605 -20.6% -385,087 -12.3%
Chokio Stevens 144,788 -21,589 -14.9% -9,074 -6.3%Circle Pines Anoka 332,410 -332,410 -100.0% -255,299 -76.8%Clara City Chippewa 497,295 -157,184 -31.6% -108,404 -21.8%Claremont Dodge 178,469 -40,937 -22.9% -16,940 -9.5%, , . , .Clarissa Todd 182,835 -24,652 -13.5% -10,361 -5.7%Clarkfield Yellow Medicine 388,604 -52,614 -13.5% -22,113 -5.7%Clarks Grove Freeborn 181,289 -20,725 -11.4% -8,710 -4.8%Clear Lake Sherburne 54,847 -53,106 -96.8% -36,445 -66.4%Clearbrook Clearwater 167,274 -26,523 -15.9% -11,147 -6.7%Clearwater Wright 245,464 -176,878 -72.1% -118,198 -48.2%Clements Redwood 42,001 -6,713 -16.0% -2,821 -6.7%
eve an e ueur , - , - . - , - .Climax Polk 51,404 -7,787 -15.1% -3,273 -6.4%Clinton Big Stone 152,686 -15,250 -10.0% -6,409 -4.2%Clitherall Otter Tail 19,434 -1,976 -10.2% -830 -4.3%Clontarf Swift 29,043 -5,027 -17.3% -2,113 -7.3%Cloquet Carlton 2,606,556 -854,665 -32.8% -619,579 -23.8%Coates Dakota 1,907 -1,907 -100.0% -1,907 -100.0%Cobden Brown 3,709 -408 -11.0% -172 -4.6%Cohasset Itasca 40,964 -40,964 -100.0% -40,964 -100.0%Cokato Wright 589,232 -237,193 -40.3% -164,380 -27.9%Cold Spring Stearns 630,090 -223,858 -35.5% -156,867 -24.9%Coleraine Itasca 415,053 -151,501 -36.5% -94,263 -22.7%Cologne Carver 163,941 -137,365 -83.8% -95,565 -58.3%

8/9/2019 2010 LGA cuts - MN2020
http://slidepdf.com/reader/full/2010-lga-cuts-mn2020 4/16
2010 LGA& Credits
City Majority County Before Cuts $ Cut % Cut $ Cut % Cut
2010 Cuts Under…… Governor's Budget …House & Sen. Budgets
Columbia Heights Anoka 2,191,589 -1,568,024 -71.5% -1,063,487 -48.5%Columbus Anoka 72,068 -72,068 -100.0% -72,068 -100.0%Comfrey Brown 124,345 -22,634 -18.2% -9,513 -7.7%Comstock Clay 20,772 -2,728 -13.1% -1,147 -5.5%
onger ree orn , - , - . - , - .Cook Saint Louis 183,482 -37,926 -20.7% -15,940 -8.7%
Coon Rapids Anoka 1,609,979 -1,384,979 -86.0% -1,384,979 -86.0%Corcoran Hennepin 49,317 -49,317 -100.0% -49,317 -100.0%Correll Big Stone 9,847 -1,504 -15.3% -632 -6.4%Cosmos Meeker 162,844 -28,341 -17.4% -11,911 -7.3%Cottage Grove Washington 636,502 -636,502 -100.0% -636,502 -100.0%Cottonwood Lyon 348,808 -114,013 -32.7% -79,135 -22.7%Courtland Nicollet 75,976 -14,500 -19.1% -6,094 -8.0%Cromwell Carlton 30,464 -11,373 -37.3% -4,780 -15.7%Crookston Polk 3,615,494 -794,757 -22.0% -557,402 -15.4%Crosby Crow Wing 994,696 -319,151 -32.1% -191,538 -19.3%Crosslake Crow Wing 29,926 -29,926 -100.0% -29,926 -100.0%Crystal Hennepin 2,770,616 -1,687,482 -60.9% -1,153,356 -41.6%Currie Murray 82,937 -13,126 -15.8% -5,517 -6.7%Cu una Crow Win 21 037 -19 823 -94.2% -13 842 -65.8%, - , - . - , - .Cyrus Pope 88,029 -9,759 -11.1% -4,102 -4.7%Dakota Winona 49,668 -11,834 -23.8% -4,974 -10.0%Dalton Otter Tail 58,683 -8,433 -14.4% -3,544 -6.0%Danube Renville 164,245 -22,175 -13.5% -9,320 -5.7%Danvers Swift 14,042 -3,127 -22.3% -1,314 -9.4%Darfur Watonwan 43,711 -5,830 -13.3% -2,450 -5.6%Darwin Meeker 45,284 -7,276 -16.1% -3,058 -6.8%Dassel Meeker 408,535 -138,304 -33.9% -96,691 -23.7%Dawson Lac Qui Parle 690,749 -198,242 -28.7% -117,413 -17.0%Dayton Hennepin 71,730 -71,730 -100.0% -71,730 -100.0%De Graff Swift 27,660 -3,185 -11.5% -1,339 -4.8%
Deephaven Hennepin 830 -830 -100.0% -830 -100.0%Deer Creek Otter Tail 70,586 -9,029 -12.8% -3,795 -5.4%Deer River Itasca 326,535 -61,955 -19.0% -25,900 -7.9%Deerwood Crow Wing 53,826 -53,826 -100.0% -47,920 -89.0%, , . , .Delano Wright 230,595 -230,595 -100.0% -230,595 -100.0%Delavan Faribault 61,008 -12,281 -20.1% -4,928 -8.1%Delhi Redwood 17,815 -2,630 -14.8% -1,105 -6.2%Dellwood Washington 415 -415 -100.0% -415 -100.0%Denham Pine 1,115 -634 -56.9% -267 -23.9%Dennison Goodhue 20,750 -16,922 -81.6% -11,888 -57.3%Dent Otter Tail 51,956 -8,649 -16.6% -3,635 -7.0%
e ro a es ec er , , - , - . - , - .Dexter Mower 86,455 -15,989 -18.5% -6,720 -7.8%Dilworth Clay 721,998 -291,871 -40.4% -200,998 -27.8%Dodge Center Dodge 860,255 -294,374 -34.2% -205,568 -23.9%Donaldson Kittson 5,435 -1,807 -33.2% -759 -14.0%Donnelly Stevens 59,611 -7,721 -13.0% -3,245 -5.4%Doran Wilkin 13,657 -1,993 -14.6% -838 -6.1%Dover Olmsted 112,601 -24,208 -21.5% -10,174 -9.0%Dovray Murray 15,892 -2,302 -14.5% -968 -6.1%Duluth Saint Louis 32,647,346 -7,500,819 -23.0% -5,198,309 -15.9%Dumont Traverse 23,907 -4,758 -19.9% -2,000 -8.4%Dundas Rice 139,639 -116,151 -83.2% -78,979 -56.6%Dundee Nobles 24,583 -3,313 -13.5% -1,393 -5.7%

8/9/2019 2010 LGA cuts - MN2020
http://slidepdf.com/reader/full/2010-lga-cuts-mn2020 5/16
2010 LGA& Credits
City Majority County Before Cuts $ Cut % Cut $ Cut % Cut
2010 Cuts Under…… Governor's Budget …House & Sen. Budgets
Dunnell Martin 69,939 -12,769 -18.3% -5,068 -7.2%Eagan Dakota 1,036,495 -1,036,495 -100.0% -1,036,495 -100.0%Eagle Bend Todd 183,555 -25,055 -13.6% -10,530 -5.7%Eagle Lake Blue Earth 602,746 -163,051 -27.1% -112,639 -18.7%
as e e no a , - , - . - , - .East Grand Forks Polk 3,096,999 -884,954 -28.6% -615,425 -19.9%
East Gull Lake Cass 6,335 -6,335 -100.0% -6,335 -100.0%Easton Faribault 45,994 -12,655 -27.5% -5,264 -11.4%Echo Yellow Medicine 83,154 -16,244 -19.5% -6,692 -8.0%Eden Prairie Hennepin 428,529 -428,529 -100.0% -428,529 -100.0%Eden Valley Meeker 269,967 -51,599 -19.1% -21,686 -8.0%Edgerton Pipestone 359,451 -49,599 -13.8% -20,846 -5.8%Edina Hennepin 224,252 -224,252 -100.0% -224,252 -100.0%Effie Itasca 12,751 -2,742 -21.5% -1,152 -9.0%Eitzen Houston 45,443 -10,550 -23.2% -4,434 -9.8%Elba Winona 34,936 -5,477 -15.7% -2,302 -6.6%Elbow Lake Grant 477,832 -158,118 -33.1% -102,114 -21.4%Elgin Wabasha 323,986 -53,279 -16.4% -22,392 -6.9%Elizabeth Otter Tail 37,141 -5,096 -13.7% -2,142 -5.8%Elk River Sherburne 1 094 813 -1 094 813 -100.0% -1 094 813 -100.0%, , - , , - . - , , - .Elko New Market Scott 390,600 -321,901 -82.4% -225,860 -57.8%Elkton Mower 17,336 -3,969 -22.9% -1,668 -9.6%Ellendale Steele 163,084 -32,702 -20.1% -13,744 -8.4%Ellsworth Nobles 191,513 -27,747 -14.5% -11,662 -6.1%Elmdale Morrison 8,127 -1,803 -22.2% -758 -9.3%Elmore Faribault 249,794 -36,056 -14.4% -15,154 -6.1%Elrosa Stearns 30,543 -4,340 -14.2% -1,824 -6.0%Ely Saint Louis 2,052,551 -492,007 -24.0% -293,567 -14.3%Elysian LeSueur 79,607 -75,561 -94.9% -47,535 -59.7%Emily Crow Wing 20,555 -20,555 -100.0% -20,555 -100.0%Emmons Freeborn 106,352 -18,172 -17.1% -7,638 -7.2%
Erhard Otter Tail 33,652 -4,313 -12.8% -1,813 -5.4%Erskine Polk 114,608 -21,055 -18.4% -8,849 -7.7%Evan Brown 17,422 -2,365 -13.6% -994 -5.7%Evansville Douglas 152,101 -28,069 -18.5% -11,797 -7.8%, , . , .Eveleth Saint Louis 2,530,882 -529,609 -20.9% -299,567 -11.8%Excelsior Hennepin 102,695 -102,695 -100.0% -102,695 -100.0%Eyota Olmsted 551,649 -170,710 -30.9% -119,069 -21.6%Fairfax Renville 524,980 -138,832 -26.4% -96,450 -18.4%Fairmont Martin 4,526,598 -1,109,003 -24.5% -772,821 -17.1%Falcon Heights Ramsey 473,932 -227,032 -47.9% -158,001 -33.3%Faribault Rice 6,187,664 -1,880,501 -30.4% -1,314,766 -21.2%
arm ng on a o a , - , - . - , - .Farwell Pope 17,008 -1,987 -11.7% -835 -4.9%Federal Dam Cass 4,979 -4,979 -100.0% -4,979 -100.0%Felton Clay 30,948 -3,667 -11.8% -1,541 -5.0%Fergus Falls Otter Tail 4,565,658 -1,304,268 -28.6% -912,797 -20.0%Fertile Polk 293,141 -35,495 -12.1% -14,918 -5.1%Fifty Lakes Crow Wing 8,104 -8,104 -100.0% -8,104 -100.0%Finlayson Pine 45,597 -11,800 -25.9% -4,959 -10.9%Fisher Polk 87,614 -14,424 -16.5% -6,062 -6.9%Flensburg Morrison 27,402 -3,934 -14.4% -1,654 -6.0%Floodwood Saint Louis 156,520 -33,431 -21.4% -14,051 -9.0%Florence Lyon 10,720 -1,684 -15.7% -708 -6.6%Foley Benton 813,257 -250,909 -30.9% -176,033 -21.6%

8/9/2019 2010 LGA cuts - MN2020
http://slidepdf.com/reader/full/2010-lga-cuts-mn2020 6/16
2010 LGA& Credits
City Majority County Before Cuts $ Cut % Cut $ Cut % Cut
2010 Cuts Under…… Governor's Budget …House & Sen. Budgets
Forada Douglas 5,637 -5,637 -100.0% -5,637 -100.0%Forest Lake Washington 312,066 -312,066 -100.0% -312,066 -100.0%Foreston Mille Lacs 80,997 -15,468 -19.1% -6,501 -8.0%Fort Ripley Crow Wing 2,229 -2,229 -100.0% -1,827 -82.0%
oss on o , - , - . - , - .Fountain Fillmore 83,354 -17,945 -21.5% -7,542 -9.0%
Foxhome Wilkin 28,876 -3,462 -12.0% -1,455 -5.0%Franklin Renville 157,394 -23,026 -14.6% -9,678 -6.1%Frazee Becker 520,922 -115,645 -22.2% -80,340 -15.4%Freeborn Freeborn 74,316 -11,736 -15.8% -4,932 -6.6%Freeport Stearns 115,135 -36,095 -31.4% -14,560 -12.6%Fridley Anoka 2,011,593 -1,780,875 -88.5% -1,227,286 -61.0%Frost Faribault 63,981 -12,434 -19.4% -5,226 -8.2%Fulda Murray 526,495 -120,880 -23.0% -84,405 -16.0%Funkley Beltrami 288 -93 -32.3% -39 -13.5%Garfield Douglas 43,042 -9,339 -21.7% -3,925 -9.1%Garrison Crow Wing 5,566 -5,566 -100.0% -5,566 -100.0%Garvin Lyon 42,205 -7,274 -17.2% -3,057 -7.2%Gary Norman 58,512 -7,556 -12.9% -3,176 -5.4%Ga lord Sible 978 899 -252 859 -25.8% -175 983 -18.0%, - , - . - , - .Gem Lake Ramsey 7,485 -7,485 -100.0% -7,485 -100.0%Geneva Freeborn 82,511 -13,368 -16.2% -5,618 -6.8%Genola Morrison 2,546 -2,302 -90.4% -1,613 -63.4%Georgetown Clay 15,452 -2,568 -16.6% -1,079 -7.0%Ghent Lyon 97,702 -14,433 -14.8% -6,066 -6.2%Gibbon Sibley 269,364 -48,114 -17.9% -20,222 -7.5%Gilbert Saint Louis 882,152 -250,513 -28.4% -146,300 -16.6%Gilman Benton 11,241 -2,135 -19.0% -897 -8.0%Glencoe McLeod 1,497,344 -520,114 -34.7% -360,672 -24.1%Glenville Freeborn 216,177 -27,705 -12.8% -11,644 -5.4%Glenwood Pope 855,425 -273,406 -32.0% -190,914 -22.3%
Glyndon Clay 348,009 -107,380 -30.9% -74,821 -21.5%Golden Valley Hennepin 339,716 -339,716 -100.0% -339,716 -100.0%Gonvick Clearwater 71,902 -12,343 -17.2% -5,187 -7.2%Good Thunder Blue Earth 186,152 -34,043 -18.3% -14,308 -7.7%, , . , .Goodhue Goodhue 238,709 -47,406 -19.9% -19,924 -8.3%Goodridge Pennington 24,559 -2,642 -10.8% -1,111 -4.5%Goodview Winona 252,650 -241,169 -95.5% -168,114 -66.5%Graceville Big Stone 217,010 -31,100 -14.3% -13,071 -6.0%Granada Martin 104,385 -10,602 -10.2% -4,456 -4.3%Grand Marais Cook 218,576 -153,002 -70.0% -106,999 -49.0%Grand Meadow Mower 316,770 -53,063 -16.8% -22,302 -7.0%
ran ap s asca , , - , , - . - , - .Granite Falls Yellow Medicine 897,997 -332,626 -37.0% -230,160 -25.6%Grant Washington 11,310 -11,310 -100.0% -11,310 -100.0%Grasston Kanabec 17,392 -2,317 -13.3% -974 -5.6%Green Isle Sibley 86,478 -41,974 -48.5% -14,224 -16.4%Greenbush Roseau 246,285 -33,023 -13.4% -13,879 -5.6%Greenfield Hennepin 13,427 -13,427 -100.0% -13,427 -100.0%Greenwald Stearns 34,196 -4,733 -13.8% -1,989 -5.8%Greenwood Hennepin - 0 n/a 0 n/aGrey Eagle Todd 74,502 -13,671 -18.3% -5,746 -7.7%Grove City Meeker 187,715 -27,560 -14.7% -11,583 -6.2%Grygla Marshall 49,651 -7,638 -15.4% -3,210 -6.5%Gully Polk 17,638 -2,079 -11.8% -874 -5.0%

8/9/2019 2010 LGA cuts - MN2020
http://slidepdf.com/reader/full/2010-lga-cuts-mn2020 7/16
2010 LGA& Credits
City Majority County Before Cuts $ Cut % Cut $ Cut % Cut
2010 Cuts Under…… Governor's Budget …House & Sen. Budgets
Hackensack Cass 18,149 -18,149 -100.0% -18,149 -100.0%Hadley Murray 18,655 -3,496 -18.7% -1,469 -7.9%Hallock Kittson 483,368 -127,318 -26.3% -88,835 -18.4%Halma Kittson 13,046 -1,610 -12.3% -677 -5.2%
a s a orman , - , - . - , - .Ham Lake Anoka 163,069 -163,069 -100.0% -163,069 -100.0%
Hamburg Carver 84,406 -37,727 -44.7% -15,596 -18.5%Hammond Wabasha 47,386 -5,530 -11.7% -2,324 -4.9%Hampton Dakota 103,540 -24,899 -24.0% -10,465 -10.1%Hancock Stevens 263,268 -39,413 -15.0% -16,565 -6.3%Hanley Falls Yellow Medicine 85,107 -13,152 -15.5% -5,528 -6.5%Hanover Wright 225,456 -225,456 -100.0% -162,636 -72.1%Hanska Brown 135,118 -18,981 -14.0% -7,978 -5.9%Harding Morrison 3,078 -833 -27.1% -350 -11.4%Hardwick Rock 52,037 -5,975 -11.5% -2,511 -4.8%Harmony Fillmore 452,343 -141,894 -31.4% -92,654 -20.5%Harris Chisago 200,746 -94,538 -47.1% -64,766 -32.3%Hartland Freeborn 66,162 -13,893 -21.0% -5,839 -8.8%Hastings Dakota 1,013,395 -1,013,395 -100.0% -1,013,395 -100.0%Hatfield Pi estone 4 875 -976 -20.0% -410 -8.4%, - - . - - .Hawley Clay 652,815 -157,386 -24.1% -108,933 -16.7%Hayfield Dodge 469,882 -138,028 -29.4% -96,613 -20.6%Hayward Freeborn 44,464 -13,699 -30.8% -5,758 -12.9%Hazel Run Yellow Medicine 15,891 -1,910 -12.0% -803 -5.1%Hector Renville 427,314 -145,323 -34.0% -95,639 -22.4%Heidelberg LeSueur 2,232 -2,232 -100.0% -2,232 -100.0%Henderson Sibley 322,112 -75,387 -23.4% -26,320 -8.2%Hendricks Lincoln 252,859 -39,388 -15.6% -16,554 -6.5%Hendrum Norman 74,086 -14,224 -19.2% -5,978 -8.1%Henning Otter Tail 291,684 -36,414 -12.5% -15,304 -5.2%Henriette Pine 14,219 -2,854 -20.1% -1,199 -8.4%
Herman Grant 134,535 -29,397 -21.9% -11,648 -8.7%Hermantown Saint Louis 719,301 -569,630 -79.2% -388,398 -54.0%Heron Lake Jackson 316,643 -41,566 -13.1% -17,470 -5.5%Hewitt Todd 68,017 -8,911 -13.1% -3,745 -5.5%, , . , .Hibbing Saint Louis 9,530,713 -2,208,416 -23.2% -1,340,710 -14.1%Hill City Aitkin 72,733 -24,344 -33.5% -10,232 -14.1%Hillman Morrison 4,035 -599 -14.8% -252 -6.2%Hills Rock 168,397 -20,129 -12.0% -8,460 -5.0%Hilltop Anoka 138,355 -62,766 -45.4% -22,148 -16.0%Hinckley Pine 301,191 -117,802 -39.1% -81,383 -27.0%Hitterdal Clay 46,723 -5,773 -12.4% -2,426 -5.2%
o man ran , - , - . - , - .Hokah Houston 188,011 -36,909 -19.6% -15,288 -8.1%Holdingford Stearns 196,888 -34,607 -17.6% -14,545 -7.4%Holland Pipestone 53,892 -6,135 -11.4% -2,578 -4.8%Hollandale Freeborn 53,382 -12,107 -22.7% -5,088 -9.5%Holloway Swift 18,881 -18,881 -100.0% -8,438 -44.7%Holt Marshall 17,430 -1,683 -9.7% -707 -4.1%Hopkins Hennepin 282,850 -282,850 -100.0% -282,850 -100.0%Houston Houston 390,168 -117,598 -30.1% -81,405 -20.9%Howard Lake Wright 615,832 -188,259 -30.6% -131,302 -21.3%Hoyt Lakes Saint Louis 558,150 -285,466 -51.1% -152,827 -27.4%Hugo Washington 277,084 -277,084 -100.0% -277,084 -100.0%Humboldt Kittson 12,516 -1,138 -9.1% -478 -3.8%
8/9/2019 2010 LGA cuts - MN2020
http://slidepdf.com/reader/full/2010-lga-cuts-mn2020 8/16
2010 LGA& Credits
City Majority County Before Cuts $ Cut % Cut $ Cut % Cut
2010 Cuts Under…… Governor's Budget …House & Sen. Budgets
Hutchinson McLeod 2,825,650 -1,329,228 -47.0% -922,709 -32.7%Ihlen Pipestone 20,225 -2,724 -13.5% -1,145 -5.7%Independence Hennepin 20,796 -20,796 -100.0% -20,796 -100.0%International Falls Koochiching 4,307,324 -843,572 -19.6% -518,577 -12.0%nver rove e g s a o a , - , - . - , - .Iona Murray 44,967 -6,232 -13.9% -2,619 -5.8%
Iron Junction Saint Louis 15,316 -1,962 -12.8% -825 -5.4%Ironton Crow Wing 156,150 -39,347 -25.2% -14,896 -9.5%Isanti Isanti 666,065 -430,429 -64.6% -303,167 -45.5%Isle Mille Lacs 88,345 -88,345 -100.0% -62,014 -70.2%Ivanhoe Lincoln 237,114 -35,976 -15.2% -15,120 -6.4%Jackson Jackson 1,388,388 -359,360 -25.9% -249,717 -18.0%Janesville Waseca 918,812 -233,069 -25.4% -162,663 -17.7%Jasper Pipestone 205,011 -26,919 -13.1% -11,314 -5.5%Jeffers Cottonwood 129,984 -16,064 -12.4% -6,752 -5.2%Jenkins Crow Wing 21,354 -21,354 -100.0% -21,354 -100.0%Johnson Big Stone 8,286 -1,161 -14.0% -488 -5.9%Jordan Scott 339,177 -339,177 -100.0% -339,177 -100.0%Kandiyohi Kandiyohi 117,343 -17,197 -14.7% -7,228 -6.2%Karlstad Kittson 263 047 -33 528 -12.7% -14 091 -5.4%, - , - . - , - .Kasota LeSueur 160,632 -17,654 -11.0% -7,420 -4.6%Kasson Dodge 1,147,711 -434,243 -37.8% -304,467 -26.5%Keewatin Itasca 457,119 -143,368 -31.4% -96,694 -21.2%Kelliher Beltrami 113,109 -12,164 -10.8% -5,112 -4.5%Kellogg Wabasha 109,426 -24,208 -22.1% -10,174 -9.3%Kennedy Kittson 76,337 -11,974 -15.7% -5,033 -6.6%Kenneth Rock 12,144 -1,659 -13.7% -697 -5.7%Kensington Douglas 66,796 -8,997 -13.5% -3,781 -5.7%Kent Wilkin 23,610 -2,501 -10.6% -1,051 -4.5%Kenyon Goodhue 622,265 -186,348 -29.9% -131,849 -21.2%Kerkhoven Swift 221,264 -34,988 -15.8% -14,705 -6.6%
Kerrick Pine 5,679 -1,436 -25.3% -604 -10.6%Kettle River Carlton 33,072 -8,759 -26.5% -3,681 -11.1%Kiester Faribault 183,735 -33,699 -18.3% -13,580 -7.4%Kilkenny LeSueur 44,492 -6,287 -14.1% -2,642 -5.9%, , . , .Kimball Stearns 150,890 -40,153 -26.6% -16,876 -11.2%Kinbrae Nobles 742 -711 -95.8% -498 -67.1%Kingston Meeker 16,053 -2,771 -17.3% -1,165 -7.3%Kinney Saint Louis 67,015 -22,090 -33.0% -4,732 -7.1%La Crescent Houston 754,716 -400,940 -53.1% -280,768 -37.2%La Prairie Itasca 85,057 -21,656 -25.5% -9,102 -10.7%La Salle Watonwan 20,175 -2,853 -14.1% -1,199 -5.9%
a aye e co e , - , - . - , - .Lake Benton Lincoln 236,991 -33,959 -14.3% -14,273 -6.0%Lake Bronson Kittson 78,839 -10,668 -13.5% -4,483 -5.7%Lake City Wabasha 1,021,954 -545,350 -53.4% -376,885 -36.9%Lake Crystal Blue Earth 838,920 -262,605 -31.3% -182,556 -21.8%Lake Elmo Washington 38,419 -38,419 -100.0% -38,419 -100.0%Lake Henry Stearns 9,180 -2,048 -22.3% -861 -9.4%Lake Lillian Kandiyohi 48,221 -9,660 -20.0% -4,060 -8.4%Lake Park Becker 258,188 -27,551 -10.7% -11,580 -4.5%Lake Shore Cass 10,238 -10,238 -100.0% -10,238 -100.0%Lake St. Croix Beach Washington 82,508 -82,508 -100.0% -60,338 -73.1%Lake Wilson Murray 88,480 -8,782 -9.9% -3,691 -4.2%Lakefield Jackson 773,617 -179,188 -23.2% -124,715 -16.1%

8/9/2019 2010 LGA cuts - MN2020
http://slidepdf.com/reader/full/2010-lga-cuts-mn2020 9/16
2010 LGA& Credits
City Majority County Before Cuts $ Cut % Cut $ Cut % Cut
2010 Cuts Under…… Governor's Budget …House & Sen. Budgets
Lakeland Washington 155,380 -155,380 -100.0% -119,847 -77.1%Lakeland Shores Washington 2,367 -2,367 -100.0% -2,367 -100.0%Lakeville Dakota 777,335 -777,335 -100.0% -777,335 -100.0%Lamberton Redwood 331,078 -48,441 -14.6% -20,359 -6.1%
ancas er son , - , - . - , - .Landfall Washington 135,390 -77,908 -57.5% -55,413 -40.9%
Lanesboro Fillmore 254,694 -51,033 -20.0% -20,384 -8.0%Laporte Hubbard 15,141 -5,254 -34.7% -2,208 -14.6%Lastrup Morrison 5,621 -1,427 -25.4% -600 -10.7%Lauderdale Ramsey 647,093 -185,033 -28.6% -128,895 -19.9%Le Center LeSueur 870,706 -210,240 -24.1% -143,412 -16.5%Le Roy Mower 352,308 -65,736 -18.7% -25,004 -7.1%Le Sueur LeSueur 1,101,678 -426,233 -38.7% -298,478 -27.1%Lengby Polk 23,816 -2,498 -10.5% -1,050 -4.4%Leonard Clearwater 4,693 -557 -11.9% -234 -5.0%Leonidas Saint Louis 37,756 -5,238 -13.9% -1,596 -4.2%Lester Prairie McLeod 544,333 -170,982 -31.4% -118,288 -21.7%Lewiston Winona 516,222 -163,765 -31.7% -113,871 -22.1%Lewisville Watonwan 79,601 -9,891 -12.4% -4,157 -5.2%Lexin ton Anoka 447 702 -214 091 -47.8% -150 833 -33.7%, - , - . - , - .Lilydale Dakota 23,175 -23,175 -100.0% -23,175 -100.0%Lindstrom Chisago 246,912 -246,912 -100.0% -195,382 -79.1%Lino Lakes Anoka 261,640 -261,640 -100.0% -261,640 -100.0%Lismore Nobles 78,576 -13,765 -17.5% -5,785 -7.4%Litchfield Meeker 2,114,673 -646,324 -30.6% -450,657 -21.3%Little Canada Ramsey 529,364 -473,116 -89.4% -331,913 -62.7%Little Falls Morrison 2,745,236 -830,796 -30.3% -579,291 -21.1%Littlefork Koochiching 239,362 -26,245 -11.0% -11,030 -4.6%Long Beach Pope 5,125 -5,125 -100.0% -5,125 -100.0%Long Lake Hennepin 156,162 -156,162 -100.0% -129,270 -82.8%Long Prairie Todd 899,436 -218,538 -24.3% -151,233 -16.8%
Longville Cass 6,769 -6,769 -100.0% -6,769 -100.0%Lonsdale Rice 478,760 -297,302 -62.1% -208,666 -43.6%Loretto Hennepin 22,186 -22,186 -100.0% -22,186 -100.0%Louisburg Lac Qui Parle 8,907 -1,628 -18.3% -684 -7.7%, , . .Lowry Pope 65,958 -12,024 -18.2% -5,053 -7.7%Lucan Redwood 61,179 -10,719 -17.5% -4,505 -7.4%Luverne Rock 1,537,430 -382,747 -24.9% -263,771 -17.2%Lyle Mower 183,490 -20,541 -11.2% -8,633 -4.7%Lynd Lyon 69,357 -15,132 -21.8% -6,360 -9.2%Mabel Fillmore 273,884 -44,893 -16.4% -18,868 -6.9%Madelia Watonwan 1,034,064 -229,352 -22.2% -159,550 -15.4%
a son ac u ar e , - , - . - , - .Madison Lake Blue Earth 149,776 -44,136 -29.5% -18,550 -12.4%Magnolia Rock 49,345 -5,937 -12.0% -2,495 -5.1%Mahnomen Mahnomen 525,163 -112,617 -21.4% -79,776 -15.2%Mahtomedi Washington 78,233 -78,233 -100.0% -78,233 -100.0%Manchester Freeborn 15,911 -2,023 -12.7% -850 -5.3%Manhattan Beach Crow Wing 1,620 -1,620 -100.0% -1,620 -100.0%Mankato Blue Earth 8,486,849 -3,264,414 -38.5% -2,269,848 -26.7%Mantorville Dodge 293,244 -105,441 -36.0% -73,557 -25.1%Maple Grove Hennepin 837,255 -837,255 -100.0% -837,255 -100.0%Maple Lake Wright 551,928 -200,694 -36.4% -140,583 -25.5%Maple Plain Hennepin 400,383 -234,345 -58.5% -161,017 -40.2%Mapleton Blue Earth 630,300 -170,582 -27.1% -117,625 -18.7%

8/9/2019 2010 LGA cuts - MN2020
http://slidepdf.com/reader/full/2010-lga-cuts-mn2020 10/16
2010 LGA& Credits
City Majority County Before Cuts $ Cut % Cut $ Cut % Cut
2010 Cuts Under…… Governor's Budget …House & Sen. Budgets
Mapleview Mower 57,596 -6,676 -11.6% -2,806 -4.9%Maplewood Ramsey 574,427 -574,427 -100.0% -574,427 -100.0%Marble Itasca 250,867 -34,943 -13.9% -14,686 -5.9%Marietta Lac Qui Parle 56,450 -5,603 -9.9% -2,355 -4.2%
ar ne on . ro x as ng on , - , - . - , - .Marshall Lyon 2,916,032 -1,133,920 -38.9% -787,997 -27.0%
Mayer Carver 370,336 -218,099 -58.9% -150,395 -40.6%Maynard Chippewa 137,088 -21,188 -15.5% -8,905 -6.5%Mazeppa Wabasha 189,968 -36,194 -19.1% -15,212 -8.0%McGrath Aitkin 8,900 -1,198 -13.5% -504 -5.7%McGregor Aitkin 104,608 -25,487 -24.4% -10,712 -10.2%McIntosh Polk 222,055 -28,205 -12.7% -11,854 -5.3%McKinley Saint Louis 56,349 -6,608 -11.7% -2,380 -4.2%Meadowlands Saint Louis 25,286 -5,861 -23.2% -2,463 -9.7%Medford Steele 239,079 -100,654 -42.1% -70,129 -29.3%Medicine Lake Hennepin - 0 n/a 0 n/aMedina Hennepin 6,291 -6,291 -100.0% -6,291 -100.0%Meire Grove Stearns 16,250 -2,839 -17.5% -1,193 -7.3%Melrose Stearns 871,806 -320,349 -36.7% -224,122 -25.7%Menah a Wadena 364 794 -103 309 -28.3% -71 930 -19.7%, - , - . - , - .Mendota Dakota 28,948 -22,926 -79.2% -15,853 -54.8%Mendota Heights Dakota 115,335 -115,335 -100.0% -115,335 -100.0%Mentor Polk 37,485 -5,440 -14.5% -2,286 -6.1%Middle River Marshall 92,394 -12,097 -13.1% -5,084 -5.5%Miesville Dakota 4,318 -4,318 -100.0% -4,318 -100.0%Milaca Mille Lacs 734,766 -231,351 -31.5% -159,516 -21.7%Milan Chippewa 104,379 -17,021 -16.3% -7,154 -6.9%Millerville Douglas 10,391 -1,655 -15.9% -696 -6.7%Millville Wabasha 22,691 -3,573 -15.7% -1,502 -6.6%Milroy Redwood 73,146 -15,802 -21.6% -6,642 -9.1%Miltona Douglas 46,135 -14,393 -31.2% -6,049 -13.1%
Minneapolis Hennepin 96,251,499 -50,287,141 -52.2% -32,264,768 -33.5%Minneiska Wabasha 7,991 -1,411 -17.7% -593 -7.4%Minneota Lyon 537,548 -141,642 -26.3% -98,554 -18.3%Minnesota City Winona 44,775 -5,326 -11.9% -2,238 -5.0%, , . , .Minnesota Lake Faribault 166,237 -31,223 -18.8% -13,123 -7.9%Minnetonka Hennepin 485,930 -485,930 -100.0% -485,930 -100.0%Minnetonka Beach Hennepin 3,680 -3,680 -100.0% -3,680 -100.0%Minnetrista Hennepin 12,703 -12,703 -100.0% -12,703 -100.0%Mizpah Koochiching 6,994 -713 -10.2% -300 -4.3%Montevideo Chippewa 2,113,334 -558,337 -26.4% -388,816 -18.4%Montgomery LeSueur 899,429 -344,306 -38.3% -240,017 -26.7%
on ce o r g , - , - . - , - .Montrose Wright 629,295 -219,408 -34.9% -153,125 -24.3%Moorhead Clay 8,482,892 -2,381,101 -28.1% -1,654,466 -19.5%Moose Lake Carlton 652,417 -157,076 -24.1% -108,635 -16.7%Mora Kanabec 860,826 -217,514 -25.3% -151,476 -17.6%Morgan Redwood 345,633 -51,240 -14.8% -21,536 -6.2%Morris Stevens 2,488,723 -553,609 -22.2% -384,235 -15.4%Morristown Rice 310,371 -86,575 -27.9% -60,548 -19.5%Morton Renville 152,220 -24,246 -15.9% -10,190 -6.7%Motley Morrison 155,776 -36,940 -23.7% -15,526 -10.0%Mound Hennepin 161,031 -161,031 -100.0% -161,031 -100.0%Mounds View Ramsey 753,135 -720,621 -95.7% -499,714 -66.4%Mountain Iron Saint Louis 1,416,102 -442,387 -31.2% -233,532 -16.5%

8/9/2019 2010 LGA cuts - MN2020
http://slidepdf.com/reader/full/2010-lga-cuts-mn2020 11/16
2010 LGA& Credits
City Majority County Before Cuts $ Cut % Cut $ Cut % Cut
2010 Cuts Under…… Governor's Budget …House & Sen. Budgets
Mountain Lake Cottonwood 1,001,859 -225,884 -22.5% -157,090 -15.7%Murdock Swift 80,629 -12,028 -14.9% -5,055 -6.3%Myrtle Freeborn 13,040 -1,704 -13.1% -716 -5.5%Nashua Wilkin 1,002 -1,002 -100.0% -892 -89.0%
as wau asca , - , - . - , - .Nassau Lac Qui Parle 20,435 -2,672 -13.1% -1,123 -5.5%
Nelson Douglas 30,634 -4,959 -16.2% -2,084 -6.8%Nerstrand Rice 24,433 -4,514 -18.5% -1,897 -7.8%Nevis Hubbard 66,162 -20,434 -30.9% -8,588 -13.0%New Auburn Sibley 131,921 -24,391 -18.5% -10,251 -7.8%New Brighton Ramsey 346,067 -346,067 -100.0% -346,067 -100.0%New Germany Carver 25,289 -17,998 -71.2% -7,564 -29.9%New Hope Hennepin 1,124,535 -1,124,535 -100.0% -1,064,963 -94.7%New London Kandiyohi 361,503 -108,777 -30.1% -75,423 -20.9%New Munich Stearns 84,270 -13,189 -15.7% -5,543 -6.6%New Prague Scott 1,033,716 -697,767 -67.5% -483,683 -46.8%New Richland Waseca 420,237 -102,197 -24.3% -71,205 -16.9%New Trier Dakota 4,382 -3,301 -75.3% -1,388 -31.7%New Ulm Brown 5,353,587 -1,572,169 -29.4% -1,093,367 -20.4%New York Mills Otter Tail 439 583 -118 758 -27.0% -82 601 -18.8%, - , - . - , - .Newfolden Marshall 89,977 -10,676 -11.9% -4,487 -5.0%Newport Washington 876,294 -420,362 -48.0% -289,351 -33.0%Nicollet Nicollet 227,324 -62,399 -27.4% -42,623 -18.7%Nielsville Polk 24,800 -4,074 -16.4% -1,712 -6.9%Nimrod Wadena 5,201 -1,724 -33.1% -724 -13.9%Nisswa Crow Wing 37,158 -37,158 -100.0% -37,158 -100.0%Norcross Grant 19,787 -3,467 -17.5% -1,457 -7.4%North Branch Chisago 656,689 -656,689 -100.0% -471,290 -71.8%North Mankato Nicollet 2,157,676 -1,040,764 -48.2% -725,368 -33.6%North Oaks Ramsey 1,431 -1,431 -100.0% -1,431 -100.0%North St. Paul Ramsey 2,458,679 -846,637 -34.4% -580,497 -23.6%
Northfield Rice 3,257,191 -1,436,706 -44.1% -1,007,907 -30.9%Northome Koochiching 74,790 -9,508 -12.7% -3,996 -5.3%Northrop Martin 54,844 -7,762 -14.2% -3,262 -5.9%Norwood Young America Carver 348,342 -302,674 -86.9% -208,765 -59.9%, , . , .Nowthen Anoka 43,808 -43,808 -100.0% -43,808 -100.0%Oak Grove Anoka 327,411 -327,411 -100.0% -327,411 -100.0%Oak Park Heights Washington 87,965 -87,965 -100.0% -87,965 -100.0%Oakdale Washington 577,970 -577,970 -100.0% -577,970 -100.0%Odessa Big Stone 41,799 -4,849 -11.6% -2,038 -4.9%Odin Watonwan 29,797 -3,679 -12.3% -1,546 -5.2%Ogema Becker 32,576 -4,557 -14.0% -1,915 -5.9%
g v e ana ec , - , - . - , - .Okabena Jackson 61,974 -12,047 -19.4% -4,872 -7.9%Oklee Red Lake 126,622 -20,854 -16.5% -8,765 -6.9%Olivia Renville 923,553 -268,357 -29.1% -185,409 -20.1%Onamia Mille Lacs 255,554 -36,035 -14.1% -15,145 -5.9%Ormsby Watonwan 31,200 -4,078 -13.1% -1,714 -5.5%Orono Hennepin 5,871 -5,871 -100.0% -5,871 -100.0%Oronoco Olmsted 84,027 -84,027 -100.0% -60,067 -71.5%Orr Saint Louis 51,022 -11,108 -21.8% -4,668 -9.1%Ortonville Big Stone 877,809 -218,557 -24.9% -151,843 -17.3%Osakis Douglas 494,243 -145,511 -29.4% -101,688 -20.6%Oslo Marshall 93,918 -18,238 -19.4% -7,665 -8.2%Osseo Hennepin 843,892 -297,580 -35.3% -204,110 -24.2%

8/9/2019 2010 LGA cuts - MN2020
http://slidepdf.com/reader/full/2010-lga-cuts-mn2020 12/16
2010 LGA& Credits
City Majority County Before Cuts $ Cut % Cut $ Cut % Cut
2010 Cuts Under…… Governor's Budget …House & Sen. Budgets
Ostrander Fillmore 67,644 -12,796 -18.9% -5,378 -8.0%Otsego Wright 237,319 -237,319 -100.0% -237,319 -100.0%Ottertail Otter Tail 10,653 -10,653 -100.0% -10,653 -100.0%Owatonna Steele 4,862,130 -2,160,311 -44.4% -1,515,170 -31.2%
a sa e n , - , - . - , - .Park Rapids Hubbard 603,431 -374,027 -62.0% -257,223 -42.6%
Parkers Prairie Otter Tail 324,218 -112,423 -34.7% -78,545 -24.2%Paynesville Stearns 838,874 -204,769 -24.4% -143,829 -17.1%Pease Mille Lacs 19,780 -4,524 -22.9% -1,901 -9.6%Pelican Rapids Otter Tail 1,117,936 -277,899 -24.9% -190,940 -17.1%Pemberton Blue Earth 40,618 -13,295 -32.7% -5,588 -13.8%Pennock Kandiyohi 129,737 -19,178 -14.8% -8,060 -6.2%Pequot Lakes Crow Wing 152,626 -152,626 -100.0% -152,626 -100.0%Perham Otter Tail 674,909 -262,296 -38.9% -182,214 -27.0%Perley Norman 26,958 -3,557 -13.2% -1,495 -5.5%Peterson Fillmore 61,413 -9,422 -15.3% -3,960 -6.4%Pierz Morrison 446,460 -107,581 -24.1% -74,741 -16.7%Pillager Cass 144,656 -27,484 -19.0% -11,551 -8.0%Pine City Pine 615,475 -251,351 -40.8% -174,180 -28.3%Pine Island Goodhue 778 090 -370 121 -47.6% -259 343 -33.3%, - , - . - , - .Pine River Cass 292,409 -51,468 -17.6% -21,631 -7.4%Pine Springs Washington 2,902 -2,902 -100.0% -2,902 -100.0%Pipestone Pipestone 1,935,226 -493,484 -25.5% -340,425 -17.6%Plainview Wabasha 810,157 -319,313 -39.4% -216,120 -26.7%Plato McLeod 37,850 -15,356 -40.6% -6,454 -17.1%Plummer Red Lake 61,807 -14,141 -22.9% -5,943 -9.6%Plymouth Hennepin 552,101 -552,101 -100.0% -552,101 -100.0%Porter Yellow Medicine 41,908 -6,303 -15.0% -2,649 -6.3%Preston Fillmore 632,743 -175,401 -27.7% -115,146 -18.2%Princeton Mille Lacs 880,941 -460,652 -52.3% -321,607 -36.5%Prinsburg Kandiyohi 107,054 -24,890 -23.2% -10,461 -9.8%
Prior Lake Scott 266,847 -266,847 -100.0% -266,847 -100.0%Proctor Saint Louis 1,176,776 -311,185 -26.4% -214,427 -18.2%Quamba Kanabec 19,925 -3,530 -17.7% -1,484 -7.4%Racine Mower 76,993 -17,753 -23.1% -7,461 -9.7%, , . , .Ramsey Anoka 464,279 -464,279 -100.0% -464,279 -100.0%Randall Morrison 146,237 -20,336 -13.9% -8,547 -5.8%Randolph Dakota 17,733 -6,705 -37.8% -2,818 -15.9%Ranier Koochiching 28,290 -4,387 -15.5% -1,844 -6.5%Raymond Kandiyohi 237,140 -31,557 -13.3% -13,263 -5.6%Red Lake Falls Red Lake 684,532 -176,808 -25.8% -123,436 -18.0%Red Wing Goodhue 1,998,986 -1,998,986 -100.0% -1,354,990 -67.8%
e woo a s e woo , , - , - . - , - .Regal Kandiyohi 3,279 -745 -22.7% -313 -9.5%Remer Cass 79,063 -19,936 -25.2% -8,379 -10.6%Renville Renville 536,863 -164,445 -30.6% -104,742 -19.5%Revere Redwood 23,952 -4,030 -16.8% -1,694 -7.1%Rice Benton 199,020 -81,894 -41.1% -56,634 -28.5%Richfield Hennepin 3,262,096 -2,747,520 -84.2% -1,905,627 -58.4%Richmond Stearns 355,091 -141,726 -39.9% -98,870 -27.8%Richville Otter Tail 17,869 -2,716 -15.2% -1,141 -6.4%Riverton Crow Wing 11,943 -4,464 -37.4% -1,876 -15.7%Robbinsdale Hennepin 1,991,278 -1,086,589 -54.6% -749,427 -37.6%Rochester Olmsted 11,202,072 -8,200,233 -73.2% -5,682,742 -50.7%Rock Creek Pine 165,737 -55,400 -33.4% -38,758 -23.4%

8/9/2019 2010 LGA cuts - MN2020
http://slidepdf.com/reader/full/2010-lga-cuts-mn2020 13/16
2010 LGA& Credits
City Majority County Before Cuts $ Cut % Cut $ Cut % Cut
2010 Cuts Under…… Governor's Budget …House & Sen. Budgets
Rockford Wright 391,805 -262,217 -66.9% -182,568 -46.6%Rockville Stearns 58,211 -58,211 -100.0% -58,211 -100.0%Rogers Hennepin 86,337 -86,337 -100.0% -86,337 -100.0%Rollingstone Winona 157,667 -22,944 -14.6% -9,643 -6.1%
ooseve oseau , - , - . - , - .Roscoe Stearns 25,925 -3,303 -12.7% -1,388 -5.4%
Rose Creek Mower 91,838 -15,493 -16.9% -6,511 -7.1%Roseau Roseau 770,082 -274,399 -35.6% -191,639 -24.9%Rosemount Dakota 429,507 -429,507 -100.0% -429,507 -100.0%Roseville Ramsey 468,225 -468,225 -100.0% -468,225 -100.0%Rothsay Wilkin 142,323 -20,645 -14.5% -8,677 -6.1%Round Lake Nobles 136,990 -16,732 -12.2% -7,032 -5.1%Royalton Morrison 215,356 -33,379 -15.5% -14,029 -6.5%Rush City Chisago 742,072 -172,693 -23.3% -119,531 -16.1%Rushford Fillmore 739,705 -210,405 -28.4% -144,728 -19.6%Rushford Village Fillmore 106,685 -60,073 -56.3% -40,702 -38.2%Rushmore Nobles 119,977 -17,281 -14.4% -7,263 -6.1%Russell Lyon 102,103 -13,852 -13.6% -5,822 -5.7%Ruthton Pipestone 90,901 -13,513 -14.9% -5,680 -6.2%Rutled e Pine 8 449 -3 732 -44.2% -1 568 -18.6%, - , - . - , - .Sabin Clay 91,724 -15,666 -17.1% -6,584 -7.2%Sacred Heart Renville 221,317 -38,015 -17.2% -14,028 -6.3%Saint Anthony (Henn.) Hennepin 154,686 -154,686 -100.0% -154,686 -100.0%Saint Anthony (Stearns) Stearns 7,695 -751 -9.8% -315 -4.1%Saint Augusta Stearns 113,624 -113,624 -100.0% -96,755 -85.2%Saint Bonifacius Hennepin 415,928 -171,377 -41.2% -118,935 -28.6%Saint Charles Winona 955,999 -254,980 -26.7% -175,903 -18.4%Saint Clair Blue Earth 212,693 -31,943 -15.0% -13,425 -6.3%Saint Cloud Stearns 14,027,517 -5,615,160 -40.0% -3,918,192 -27.9%Saint Francis Anoka 472,335 -472,335 -100.0% -342,234 -72.5%Saint Hilaire Pennington 72,620 -8,466 -11.7% -3,558 -4.9%
Saint James Watonwan 1,641,031 -370,525 -22.6% -258,341 -15.7%Saint Joseph Stearns 982,246 -421,629 -42.9% -295,679 -30.1%Saint Leo Yellow Medicine 20,595 -2,452 -11.9% -1,031 -5.0%Saint Louis Park Hennepin 682,922 -682,922 -100.0% -682,922 -100.0% , , . , .Saint Martin Stearns 55,462 -12,748 -23.0% -5,358 -9.7%Saint Mary's Point Washington 6,540 -6,540 -100.0% -6,540 -100.0%Saint Michael Wright 207,181 -207,181 -100.0% -207,181 -100.0%Saint Paul Ramsey 67,559,159 -24,553,237 -36.3% -17,048,389 -25.2%Saint Paul Park Washington 392,596 -277,383 -70.7% -193,604 -49.3%Saint Peter Nicollet 3,162,911 -762,172 -24.1% -526,111 -16.6%Saint Rosa Stearns 2,751 -2,751 -100.0% -2,000 -72.7%
a n ep en earns , - , - . - , - .Saint Vincent Kittson 23,061 -2,528 -11.0% -1,063 -4.6%Sanborn Redwood 138,144 -16,536 -12.0% -6,950 -5.0%Sandstone Pine 978,579 -219,760 -22.5% -152,917 -15.6%Sargeant Mower 15,041 -2,640 -17.6% -1,110 -7.4%Sartell Stearns 578,367 -578,367 -100.0% -537,785 -93.0%Sauk Centre Stearns 1,305,406 -422,689 -32.4% -296,197 -22.7%Sauk Rapids Benton 2,245,403 -904,134 -40.3% -633,023 -28.2%Savage Scott 496,749 -496,749 -100.0% -496,749 -100.0%Scandia Washington 60,069 -60,069 -100.0% -60,069 -100.0%Scanlon Carlton 205,339 -35,320 -17.2% -14,844 -7.2%Seaforth Redwood 18,733 -2,207 -11.8% -928 -5.0%Sebeka Wadena 200,763 -30,696 -15.3% -12,901 -6.4%

8/9/2019 2010 LGA cuts - MN2020
http://slidepdf.com/reader/full/2010-lga-cuts-mn2020 14/16
2010 LGA& Credits
City Majority County Before Cuts $ Cut % Cut $ Cut % Cut
2010 Cuts Under…… Governor's Budget …House & Sen. Budgets
Sedan Pope 9,281 -1,775 -19.1% -746 -8.0%Shafer Chisago 166,634 -39,314 -23.6% -16,523 -9.9%Shakopee Scott 542,513 -542,513 -100.0% -542,513 -100.0%Shelly Norman 73,281 -7,248 -9.9% -3,046 -4.2%
er urn ar n , - , - . - , - .Shevlin Clearwater 28,933 -4,109 -14.2% -1,727 -6.0%
Shoreview Ramsey 334,186 -334,186 -100.0% -334,186 -100.0%Shorewood Hennepin 15,542 -15,542 -100.0% -15,542 -100.0%Silver Bay Lake 670,430 -267,654 -39.9% -165,055 -24.6%Silver Lake McLeod 219,062 -52,570 -24.0% -22,094 -10.1%Skyline Blue Earth 10,400 -4,041 -38.9% -1,698 -16.3%Slayton Murray 978,431 -237,788 -24.3% -164,760 -16.8%Sleepy Eye Brown 1,614,127 -394,402 -24.4% -271,783 -16.8%Sobieski Morrison 21,228 -4,379 -20.6% -1,841 -8.7%Solway Beltrami 7,781 -1,578 -20.3% -663 -8.5%South Haven Wright 43,710 -10,704 -24.5% -4,499 -10.3%South St. Paul Dakota 2,922,588 -1,517,143 -51.9% -1,052,098 -36.0%Spicer Kandiyohi 140,111 -139,399 -99.5% -95,446 -68.1%Spring Grove Houston 503,844 -140,241 -27.8% -98,107 -19.5%S rin Hill Stearns 5 106 -1 264 -24.8% -531 -10.4%, - , - . - - .Spring Lake Park Anoka 318,097 -318,097 -100.0% -318,097 -100.0%Spring Park Hennepin 81,414 -81,414 -100.0% -81,414 -100.0%Spring Valley Fillmore 1,051,064 -284,836 -27.1% -199,007 -18.9%Springfield Brown 1,095,253 -269,315 -24.6% -184,292 -16.8%Squaw Lake Itasca 10,755 -2,277 -21.2% -957 -8.9%Stacy Chisago 305,262 -110,933 -36.3% -77,946 -25.5%Staples Todd 1,176,271 -282,278 -24.0% -196,508 -16.7%Starbuck Pope 456,853 -170,943 -37.4% -111,301 -24.4%Steen Rock 39,432 -4,486 -11.4% -1,886 -4.8%Stephen Marshall 219,445 -26,563 -12.1% -11,164 -5.1%Stewart McLeod 169,462 -41,249 -24.3% -14,924 -8.8%
Stewartville Olmsted 931,865 -417,585 -44.8% -288,664 -31.0%Stillwater Washington 1,386,421 -1,386,421 -100.0% -1,210,643 -87.3%Stockton Winona 168,473 -21,050 -12.5% -8,847 -5.3%Storden Cottonwood 83,184 -14,784 -17.8% -6,214 -7.5%, , . , .Strandquist Marshall 19,800 -2,007 -10.1% -844 -4.3%Strathcona Roseau 4,350 -514 -11.8% -216 -5.0%Sturgeon Lake Pine 46,111 -21,914 -47.5% -9,210 -20.0%Sunburg Kandiyohi 29,843 -5,170 -17.3% -2,173 -7.3%Sunfish Lake Dakota 330 -330 -100.0% -330 -100.0%Swanville Morrison 96,211 -13,113 -13.6% -5,511 -5.7%Taconite Itasca 108,428 -19,623 -18.1% -8,247 -7.6%
amarac n , - , - . - - .Taopi Mower 10,539 -1,191 -11.3% -500 -4.7%Taunton Lyon 49,514 -6,452 -13.0% -2,712 -5.5%Taylors Falls Chisago 242,122 -124,321 -51.3% -85,793 -35.4%Tenney Wilkin 1,106 -1,106 -100.0% -332 -30.0%Tenstrike Beltrami 5,580 -2,450 -43.9% -1,030 -18.5%Thief River Falls Pennington 2,893,970 -679,228 -23.5% -474,567 -16.4%Thomson Carlton 16,021 -7,881 -49.2% -3,312 -20.7%Tintah Traverse 13,643 -2,135 -15.6% -897 -6.6%Tonka Bay Hennepin 10,449 -10,449 -100.0% -10,449 -100.0%Tower Saint Louis 104,497 -33,450 -32.0% -13,944 -13.3%Tracy Lyon 1,078,579 -275,348 -25.5% -177,943 -16.5%Trail Polk 3,132 -859 -27.4% -361 -11.5%

8/9/2019 2010 LGA cuts - MN2020
http://slidepdf.com/reader/full/2010-lga-cuts-mn2020 15/16
2010 LGA& Credits
City Majority County Before Cuts $ Cut % Cut $ Cut % Cut
2010 Cuts Under…… Governor's Budget …House & Sen. Budgets
Trimont Martin 259,397 -38,471 -14.8% -16,169 -6.2%Trommald Crow Wing 10,718 -3,071 -28.7% -1,291 -12.0%Trosky Pipestone 23,007 -3,207 -13.9% -1,348 -5.9%Truman Martin 487,050 -105,578 -21.7% -73,472 -15.1%
ur e ver e ram , - , - . - - .Twin Lakes Freeborn 30,144 -3,618 -12.0% -1,521 -5.0%
Twin Valley Norman 302,285 -36,566 -12.1% -15,368 -5.1%Two Harbors Lake 1,446,392 -422,437 -29.2% -293,468 -20.3%Tyler Lincoln 482,273 -103,061 -21.4% -71,442 -14.8%Ulen Clay 151,138 -17,571 -11.6% -7,385 -4.9%Underwood Otter Tail 85,167 -12,390 -14.5% -5,207 -6.1%Upsala Morrison 78,552 -17,771 -22.6% -7,469 -9.5%Urbank Otter Tail 7,901 -825 -10.4% -347 -4.4%Utica Winona 39,273 -6,650 -16.9% -2,795 -7.1%Vadnais Heights Ramsey 142,990 -142,990 -100.0% -142,990 -100.0%Vergas Otter Tail 45,310 -12,609 -27.8% -5,300 -11.7%Vermillion Dakota 18,668 -14,237 -76.3% -5,984 -32.1%Verndale Wadena 149,237 -20,327 -13.6% -8,543 -5.7%Vernon Center Blue Earth 84,405 -21,120 -25.0% -8,876 -10.5%Vesta Redwood 98 853 -15 954 -16.1% -6 705 -6.8%, - , - . - , - .Victoria Carver 54,496 -54,496 -100.0% -54,496 -100.0%Viking Marshall 22,224 -2,805 -12.6% -1,179 -5.3%Villard Pope 49,836 -9,179 -18.4% -3,858 -7.7%Vining Otter Tail 12,389 -1,798 -14.5% -756 -6.1%Virginia Saint Louis 4,859,982 -1,216,873 -25.0% -724,056 -14.9%Wabasha Wabasha 773,696 -256,543 -33.2% -179,029 -23.1%Wabasso Redwood 221,517 -40,361 -18.2% -16,963 -7.7%Waconia Carver 158,714 -158,714 -100.0% -158,714 -100.0%Wadena Wadena 1,435,060 -332,678 -23.2% -231,497 -16.1%Wahkon Mille Lacs 16,714 -16,714 -100.0% -16,714 -100.0%Waite Park Stearns 376,081 -376,081 -100.0% -376,081 -100.0%
Waldorf Waseca 53,603 -8,755 -16.3% -3,679 -6.9%Walker Cass 179,191 -156,160 -87.1% -95,083 -53.1%Walnut Grove Redwood 254,507 -34,611 -13.6% -14,547 -5.7%Walters Faribault 22,075 -3,098 -14.0% -1,302 -5.9%, , . , .Waltham Mower 40,513 -4,843 -12.0% -2,036 -5.0%Wanamingo Goodhue 266,117 -103,339 -38.8% -71,986 -27.1%Wanda Redwood 26,234 -4,675 -17.8% -1,965 -7.5%Warba Itasca 17,700 -4,398 -24.8% -1,848 -10.4%Warren Marshall 690,182 -147,793 -21.4% -102,296 -14.8%Warroad Roseau 875,057 -221,246 -25.3% -142,674 -16.3%Waseca Waseca 3,034,790 -975,507 -32.1% -683,155 -22.5%
a er own arver , - , - . - , - .Waterville LeSueur 616,221 -207,657 -33.7% -145,324 -23.6%Watkins Meeker 292,532 -60,009 -20.5% -25,221 -8.6%Watson Chippewa 69,576 -9,838 -14.1% -4,135 -5.9%Waubun Mahnomen 104,643 -15,725 -15.0% -6,609 -6.3%Waverly Wright 100,982 -100,982 -100.0% -86,976 -86.1%Wayzata Hennepin 6,187 -6,187 -100.0% -6,187 -100.0%Welcome Martin 256,256 -56,302 -22.0% -18,732 -7.3%Wells Faribault 1,117,406 -254,097 -22.7% -175,507 -15.7%Wendell Grant 43,891 -8,055 -18.4% -3,385 -7.7%West Concord Dodge 314,227 -71,718 -22.8% -22,708 -7.2%West St. Paul Dakota 2,057,080 -1,668,022 -81.1% -1,156,094 -56.2%West Union Todd 6,904 -935 -13.5% -393 -5.7%

8/9/2019 2010 LGA cuts - MN2020
http://slidepdf.com/reader/full/2010-lga-cuts-mn2020 16/16
2010 LGA& Credits
City Majority County Before Cuts $ Cut % Cut $ Cut % Cut
2010 Cuts Under…… Governor's Budget …House & Sen. Budgets
Westbrook Cottonwood 271,116 -33,852 -12.5% -14,227 -5.2%Westport Pope 6,850 -867 -12.7% -364 -5.3%Whalan Fillmore 11,795 -2,482 -21.0% -1,043 -8.8%Wheaton Traverse 707,622 -187,628 -26.5% -124,220 -17.6%
e ear a e amsey , , - , , - . - , - .Wilder Jackson 19,220 -3,400 -17.7% -1,429 -7.4%
Willernie Washington 91,874 -20,965 -22.8% -8,811 -9.6%Williams Lake of the Woods 47,004 -8,327 -17.7% -3,500 -7.4%Willmar Kandiyohi 4,985,338 -1,301,348 -26.1% -906,817 -18.2%Willow River Pine 56,378 -10,803 -19.2% -4,540 -8.1%Wilmont Nobles 101,747 -14,340 -14.1% -6,027 -5.9%Wilton Beltrami 9,169 -1,352 -14.7% -568 -6.2%Windom Cottonwood 1,610,957 -462,203 -28.7% -321,001 -19.9%Winger Polk 39,443 -7,450 -18.9% -3,131 -7.9%Winnebago Faribault 638,662 -159,276 -24.9% -110,481 -17.3%Winona Winona 10,960,046 -2,579,966 -23.5% -1,794,909 -16.4%Winsted McLeod 747,840 -270,649 -36.2% -187,243 -25.0%Winthrop Sibley 524,010 -154,566 -29.5% -107,368 -20.5%Winton Saint Louis 32,010 -6,325 -19.8% -2,658 -8.3%Wolf Lake Becker 9 876 -1 679 -17.0% -706 -7.1%, - , - . - - .Wolverton Wilkin 30,380 -4,802 -15.8% -2,018 -6.6%Wood Lake Yellow Medicine 126,961 -18,876 -14.9% -7,933 -6.2%Woodbury Washington 803,055 -803,055 -100.0% -803,055 -100.0%Woodland Hennepin 3,168 -3,168 -100.0% -3,168 -100.0%Woodstock Pipestone 37,490 -4,884 -13.0% -2,052 -5.5%Worthington Nobles 3,407,513 -913,345 -26.8% -638,298 -18.7%Wrenshall Carlton 54,747 -12,311 -22.5% -5,174 -9.5%Wright Carlton 11,095 -2,665 -24.0% -1,120 -10.1%Wykoff Fillmore 143,810 -21,726 -15.1% -9,131 -6.3%Wyoming Chisago 131,254 -131,254 -100.0% -131,254 -100.0%Zemple Itasca 2,071 -1,046 -50.5% -440 -21.2%
Zimmerman Sherburne 434,936 -236,279 -54.3% -164,910 -37.9%Zumbro Falls Wabasha 42,484 -7,242 -17.0% -3,044 -7.2%Zumbrota Goodhue 663,620 -288,541 -43.5% -201,300 -30.3%
618 507 247 -252 710 053 -40.9% -180 345 268 -29.2%COUNTY TOTAL , , , , . , , .
Minnesota 2020, 3/23/10 C:\work\123\aid\[2010 cut run for MN 2020.xls]City