2011!rossismith!academic!publishing,!jaes,!vol!!vii,!iss!2 ... · business perceived success and...
TRANSCRIPT
© 2011 RossiSmith Academic Publishing, JAES, Vol VII, Iss 2, December 2011, Refereed Edition, Page: 1
© 2011 RossiSmith Academic Publishing, JAES, Vol VII, Iss 2, December 2011, Refereed Edition, Page:
2
TABLE OF CONTENT Special Issue Editors and Review Board THE MANY FACETS OF ENTREPRENEURSHIP IN PRACTICE AND RESEARCH: ENCOURAGING THE ACADEMIC DIALOGUE Sean Patrick Sassmannshausen, Alex Maritz, Howard Frederick, Colin Jones and Liora Katzenstein INVESTIGATING THE FIRM LIFE-CYCLE THEORY ON AUSTRALIAN SMES IN THE ICT SECTOR Áron Perényi, Christopher Selvarajah and Siva Muthaly ENTREPRENEUR OPTIMISM AND THE NEW VENTURE CREATION PROCESS Neil James and Amanda Gudmundsson BUSINESS PERCEIVED SUCCESS AND GROWTH INTENTIONS Louis Geneste and Paul Weber THE PARADOXICAL NATURE OF VENTURE FAILURE Noga Gulst and Alex Maritz IS THE WORLD OF VENTURE CAPITAL INVESTORS TURNING FLAT? PERSPECTIVES OF RADICAL STRATEGIC CHANGES IN HIGH-TECHNOLOGY NEW VENTURES Eyal Benjamin, Liora Katzenstein and Eli Gimmon ENTREPRENEURIALISM AND PHILANTHROPY Christopher Baker and Michael Mora
© 2011 RossiSmith Academic Publishing, JAES, Vol VII, Iss 2, December 2011, Refereed Edition, Page:
3
SPECIAL ISSUE EDITORS AND REVIEW BOARD The Editorial Board is grateful for the support by our reviewers.
Sean Patrick Sassmannshausen (Editor in Chief and Reviewer) Schumpeter School of Business and Economics, University of Wuppertal, Germany Alex Maritz (Vice Editor in Chief, 8th AGSE IERE Committee Chair, and Reviewer) The Australian Graduate School of Entrepreneurship, Swinburne University of Technology, Melbourne, Australia Howard Frederick (Editor, 8th AGSE IERE Committee Member, and Reviewer) Centre for Entrepreneurship, Innovation and Community, Deakin University, Australia Stephan Golla (Reviewer) Technology Commercialisation at UWS Innovation & Consulting, University of Western Sydney Marc Grünhagen (Reviewer) Schumpeter School of Business and Economics, University of Wuppertal, Germany Colin Jones (Editor and Reviewer) Australian Innovation Research Centre, University of Tasmania, Australia Liora Katzenstein (Editor and Reviewer) ISEMI-Entrepreneurship College, Israel Christine Volkmann (Reviewer) Schumpeter School of Business and Economics, University of Wuppertal, Germany Murray L. Gillin (Editor Honorius and Creator of the AGSE IERE) Entrepreneurship, Commercialisation & Innovation Centre, University of Adelaide, Australia
© 2011 RossiSmith Academic Publishing, JAES, Vol VII, Iss 2, December 2011, Refereed Edition, Page:
4
Special Issue Editorial
THE MANY FACETS OF ENTREPRENEURSHIP IN PRACTICE AND RESEARCH: ENCOURAGING THE
ACADEMIC DIALOGUE
From the Editors Sean Patrick Sassmannshausen, Alex Maritz, Howard Frederick; Colin Jones,
and Liora Katzenstein
BACKGROUND OF THIS SPECIAL ISSUE
This is the first volume (out of two) of the special issue of selected papers presented at the
8th Australian Graduate School of Entrepreneurship International Entrepreneurship
Research Exchange in Melbourne 2011 (AGSE IERE 2011). We thank the AGSE for the
opportunity to use the 8th AGSE IERE as a resource for this special issue. The academic
dialogue on the nature of Entrepreneurship still continues, as well as the debate on the
boundaries of the academic field. New venture creation, rapid growth of newly founded
businesses, corporate entrepreneurship, family business, or franchising to name just a few,
all have been referred to under the label “Entrepreneurship” by some authors, while
others present different points of view (see e.g. Rocha & Birkinshaw 2007, Davidsson
2003 Davidsson 2005, chapter 1 and 2, Gartner 1985, Carland et al. 1984, Gartner 1988 &
2008, Gartner et al. 1989, Carland et al. 1988, Low & MacMillan 1988, Venkataraman
1997, Low 2001, Shane & Venkataraman 2000 and 2001).
Acknowledging the pluralistic nature of the field, the editors have invited research papers
from various disciplinary backgrounds to these special issues, addressing new venture
creation, growth, and life cycle, family business, small business research, venture capital
and technopreneurship, entrepreneurial failure, entrepreneurship education and other
© 2011 RossiSmith Academic Publishing, JAES, Vol VII, Iss 2, December 2011, Refereed Edition, Page:
5
areas of entrepreneurship. Together, both volumes will cover the broad field of
entrepreneurship. Hindle (2004, p. 583) argued that entrepreneurship may be “insolubly
holistic in nature”, and our selection of papers aims to give – in sum – an impression of
this holistic nature.
With regard to empirical contributions, the two volumes include full scale quantitative
studies as well as explorative and descriptive approaches, qualitative papers, multiple or
single case studies, and best practice reports. In other words: We believe in Paul
Feyerabend’s (1993) idea of methodological pluralism. That is: Different methods can be
applicable, according to the aim of different studies; and new even may methods emerge.
Nonetheless, any method that is used should be applicable, meaningful, generate insights,
and has to be used with rigor.
Our major selection criteria for the special issue were originality and relevance of
interesting topics. The special issue is not limited to research from Asian countries or on
sustainable entrepreneurship. The Asia Journal of Entrepreneurship and Sustainability
(launched in 2005) is listed with ProQuest and covered by Google Scholar. It is an open
access online journal, hence offering broad opportunities to get cited. Gartner et al. (2006,
p. 327) have stated that “Entrepreneurship scholarship is what entrepreneurship scholars
pay attention to.” This special issue gives mostly early stage career researchers room to
gain the attention by the wider academic community. For the editors and reviewers it was
a pleasure to witness the emergence of such new scientific talents. Nevertheless, all
papers have undergone a double blind review process and many have been revised for
resubmission while some have been rejected.
The editors are very pleased with the outcome of the review process. Our idea of
conducting reviews was to help authors getting published, not to hinder them.
Nevertheless, academic quality was our first concern. Hence the reviewers have
conducted fair but rigorous reviews providing detailed and constructive feedback without
compromising scholarship in the field of Entrepreneurship. We are grateful to the
contribution of our review board.
© 2011 RossiSmith Academic Publishing, JAES, Vol VII, Iss 2, December 2011, Refereed Edition, Page:
6
The conference had over 200 full paper submissions, and after the conference’s double
blind review process, 120 papers were accepted for presentation. Out of these 120 papers
many have been invited for submission to this special issue (selected for their
appropriateness by the special issue editorial board) and finally 12 papers have been
accepted after the common review-and-resubmission-procedure (however, two out of the
twelve accepted papers had such a high quality that after reviewing they were accepted
right away without any resubmission process). These twelve papers are split over two
volumes of this conference special issue.
The special issue editors are grateful and want to express their respect for the great work
the conference committee has done in organizing the 8th AGSE International
Entrepreneurship Research Exchange and in selecting papers of great interest for the
conference. Our thanks go to (in alphabetical order) Dr Sanjay Bhowmick (Auckland
University of Technology), Dr Alistair Campbell (University of South Australia),
Professor Per Davidsson (Queensland University of Technology), Professor Evan
Douglas (University of the Sunshine Coast), Professor Noel Lindsay (University of
Adelaide), Professor Tim Mazzarol (University of Western Australia), Ms Carolyn Oates
(Conference Secretariat, AGSE), Dr Allan O’Connor (University of Adelaide), Dr Martie-
Louise Verreynne (University of Queensland), and Professor John Watson (University of
Western Australia). Two members of the special issue editorial team, namely Professor
Howard Frederick (Deakin University) and Professor Alex Maritz (AGSE Swinburne
University of Technology) have also been members of the conference committee; the
latter even chaired the committee and has facilitated the interface between the conference
committee and the editorial board.
© 2011 RossiSmith Academic Publishing, JAES, Vol VII, Iss 2, December 2011, Refereed Edition, Page:
7
AN INTRODUCTION TO THE CONTENT OF THE ARTICLES PUBLISHED IN
THIS SPECIAL ISSUE AND SOME RELATIONS WITH DAVID STOREY’S
THEORY ON OPTIMISM AND CHANCE
Four articles published in this special issue relate to a highly recognized and critically
discussed article published by David Storey in the International Small Business Journal in
late 2011. This is a coincidence since the papers included in this special issue had been
presented at the International Entrepreneurship Research Exchange at the Australian
Graduate School of Entrepreneurship prior to the publication of the aforesaid article by
Storey. However, one could argue that this coincidence provides evidence on how much
the International Entrepreneurship Research Exchange is at the frontier of
entrepreneurship research.
The first article in this special issue (titled “Investigating the Firm Life-cycle Theory on
Australian SMEs in the ICT Sector”) is an empirical study revealing that not every
company follows the ideal typical life-cycle model, as for instance regressions can occur.
A cluster analysis shows that it is difficult to clearly cluster a sample of companies into
ideal typical stages. Nevertheless, progress of companies from one stage to another can be
observed. The article is authored by Áron Perényi, Christopher Selvarajah (both of
Swinburne University of Technology, Hawthorn, Australia) and Siva Muthaly (Graduate
School of Business and Law, RMIT University, Melbourne, Australia). Perényi,
Selvarajah and Muthaly thus provide some empirical evidence for the very recent
discussion on the current limitations of entrepreneurial growth theories, started by David
Storey’s (2011) popular contribution published by the International Small Business
Journal.
However, each life cycle starts with the creation of a new venture. The second article in
this special issue (titled “Entrepreneur Optimism and the New Venture Creation Process”)
therefore takes us straight to that point of departure. The authors Neil James and Amanda
Gudmundsson (both from The Australian Centre for Entrepreneurship Research at
Queensland University of Technology) are also doubting any linear understanding of new
© 2011 RossiSmith Academic Publishing, JAES, Vol VII, Iss 2, December 2011, Refereed Edition, Page:
8
venture development and are adding further arguments in support of the previously
mentioned article by David Storey (2011). James and Gudmundsson are suggesting a
framework to generate deeper insights into entrepreneurial optimism. As one reviewer
commented, “[t]he paper addresses a very important research gap in discussing
components of psychological capital, in particular the construct of entrepreneurial
optimism, and their potential effects on various stages of the entrepreneurial process.”
Consequently the article formulates groundbreaking research propositions at the
interdisciplinary interface of psychology, behavioral research, and entrepreneurship
research. By translating concepts into the language of business studies (like
“psychological capital element of optimism”), the authors provide a rich research
framework that is comfortable and understandable for those of us who have their home
disciplines within management and business schools or schools of economics (see
Landström 2005 on the home disciplines of researchers in entrepreneurship). James and
Gudmundsson are thus providing directions for empirically testing David Storey’s latest
hypotheses on “Optimism and Chance” (2011).
Sometimes optimists are successful, or at least they perceive themselves as successful. In
“Business Perceived Success and Growth Intentions” Louis Geneste and Paull Weber
(both from Curtin Business School at Curtin University in Perth) empirically (n=340)
examine the relationship between the small business owner’s intent to grow their business
and their self-perception of success. Their findings suggest a positive relationship
between the optimistic growth intentions of small business owners and their self-
perception of success. So is David Storey (2011) correct? Is optimism key to
entrepreneurial success, besides chance? One reviewer commented: “[…] the authors
have a valid and important point in focussing on self-perceived past or future expected
success levels (instead of actual success) in the context of growth intent. This is since it
will be mostly self-perceived issues which drive entrepreneurs / business owners’
attitudes and plans towards their own venture, e.g. in terms of continuing / expanding it or
ceasing their business (see, e.g. Wiklund et al., 2003 in terms of expected outcomes of
growth efforts and the seminal work by Davidsson 1989 for the relevance of self-
perceived influence factors in the context of growth intent). From this, the explored
© 2011 RossiSmith Academic Publishing, JAES, Vol VII, Iss 2, December 2011, Refereed Edition, Page:
9
relationship between perceived success and growth intentions is pivotal. And the paper
shows that there are differences in the level of perceived success between the growth and
non-growth subsamples.” Do we – the editors – need to say any more on the article’s
importance and topicality?
Storey’s (2011) suggestions on optimism and chance (as key factors for entrepreneurial
growth) are grounded on the argument that most theories related to factors of growth and
success are one-way bets, meaning that many theories can explain growth, but cannot be
turned upside down to explain decline. In “The Paradoxical Nature of Venture Failure”
Noga Gulst and Alex Maritz (both from Swinburne University of Technology, Australia)
take a different point of view: They ask: What can be learned from failure? instead of
What can be learned from growth and success? A lot, as they show by a mix of qualitative
and quantitative research methods. Some entrepreneurs perceive a rich learning
experience positively, even if learning occurs from failure. Those entrepreneurs are
optimists during (or even because of) experiencing new venture failure. Buy this, Gulst
and Maritz possibly revealed a weak spot in Storey’s argument: A lot of entrepreneurs
remained optimistic during new venture decline and failure. So shouldn’t Storey associate
optimism not only with success but also with failure?
Gulst and Maritz have more to offer than just a fresh empirical perspective on Storey’s
theory. They compare entrepreneurs and intrapreneurs in how both groups perceive new
venture and business failure, suggesting that they observe it differently. They provide
some practical implications, for instance for entrepreneurship education suggesting that
the experiences gained by practiced entrepreneurs and intrapreneurs from their failed
ventures should be added to entrepreneurship courses in universities and colleges. They
provide a framework that can help nascent entrepreneurs and intrapreneurs to “better
understand the issues they may confront on their entrepreneurial journey”.
Occasionally, new ventures require radical strategic changes (RSC) in order to achieve
growth goals or even to survive. This is especially true for high-technology new ventures
(HTNVs), which operate in an environment of great uncertainty – and require substantial

© 2011 RossiSmith Academic Publishing, JAES, Vol VII, Iss 2, December 2011, Refereed Edition, Page:
10
capital investments. Eyal Benjamin, Liora Katzenstein (both from Swinburne University
of Technology, Australia) and Eli Gimmon (from Tel-Hai College, Upper Galilee, Israel)
explore the attitudes of venture capitalists towards such radical changes. By asking “Is the
World of Venture Capital Investors Turning Flat?” the authors search for cultural
differences among venture capitalists (VCs) from different countries. In particular, Israeli
VCs are compared with non-Israeli VCs. Beside its explanatory and descriptive nature,
the study is substantiated by Hofstede’s (1991) theories and observations. The authors
derive hypotheses from Hofstede (1991) and House et al. (2004), applying intercultural
management theories to the context of VC-theory. While previous research suggested that
cultural differences should be expected, findings presented here surprisingly indicate only
limited cross-cultural differences. Based on the findings, Benjamin, Katzenstein and
Gimmon conclude that VCs from different developed countries share fairly similar views
of RSC in HTNVs. A possible explanation of this lack of difference might be the
comparatively small global VC community and the globalization of the high-technology
venture industry.
In entrepreneurship literature it is common to ask what could be done to support
entrepreneurs. Christopher Baker and Michael Moran (both from Swinburne University of
Technology, Australia) take a fresh perspective in their article on “Entrepreneurship and
Philanthropy”, asking what entrepreneurs could do to support others. They explore the
international literature on giving by wealthy entrepreneurs. They search for patterns in
giving and the extent to which entrepreneurialism impacts on the nature of that giving.
Especially, the article compares entrepreneurs in the US and in Australia. The authors
find that in official US-studies entrepreneurs are reported to be relatively generous, while
in Australia there is a lack of such official data. But the authors report on several studies
which found that in general the wealthy Australians are less generous than their US-
counterparts. Cultural differences and an unfavourable Australian tax system are
identified as root courses. The authors conclude that there is a need for specific research
into entrepreneurialism and philanthropy, and that such research needs to be sensitive to
the national peculiarities of political, cultural and regulatory contexts.
© 2011 RossiSmith Academic Publishing, JAES, Vol VII, Iss 2, December 2011, Refereed Edition, Page:
11
More articles have been accepted for publication. Therefore there will be a second special
issue comprising papers on entrepreneurship education and fostering entrepreneurship.
The editors are grateful to the efforts of the authors. We invite our audience to enjoy their
reading regarding the many facets of entrepreneurship.
References CARLAND, JAMES W. / HOY, FRANK / BOULTON, WILLIAM R. / CARLAND, JO ANN (1984):
Differentiating Entrepreneurs from Small Business Owners: A Conceptualization. In: Academy of Management Review, Vol. 9, Nr. 2, S. 354-359.
CARLAND, JAMES W. / HOY, FRANK / CARLAND, JO ANN C. (1988): “Who is an Entrepreneur?” Is a Question Worth Asking. In: American Journal of Small Business, Vol. 4/12, S. 33-39.
DAVIDSSON, PER (1989): 'Entrepreneurship - and after? A study of growth willingness in small firms', Journal of Business Venturing, Vol. 4, S. 211-226.
DAVIDSSON, PER (2003): The Domain of Entrepreneurship Research: Some Suggestions. In: Katz, J. / Shepherd, S. (Hrsg.): Advances in Entrepreneurship, Firm Emergence and Growth, Vol. 6, Oxford, UK: Elsevier / JAI Press, S. 315-372.
DAVIDSSON, PER (2005): The Types and Contextual Fit of Entrepreneurial Processes. In: International Journal of Entrepreneurship Education, Vol. 2, Nr. 4, S. 407-430.
FEYERABEND, PAUL (1993): Wider dem Methodenzwang. 4. Aufl., Frankfurt am Main: Suhrkamp.
GARTNER, WILLIAM B. (1985): A Conceptual Framework for Describing the Phenomenon of New Venture Creation. Academy of Management Review, Vol. 10, Nr. 4, S. 696-706.
GARTNER, WILLIAM B. (1988): “Who is an Entrepreneur?” Is the Wrong Question. In: American Journal of Small Business, Vol. 12, Nr. 4, S. 11-32.
GARTNER, WILLIAM B. (2008): Entrepreneurship—Hop. In: Entrepreneurship Theory & Practice, Vol. 32, Nr. 2, March, S. 361-368.
GARTNER, WILLIAM B. / DAVIDSSON, PER / ZAHRA, SHAKER A. (2006): Are You Talking to Me? The Nature of Community in Entrepreneurship Scholarship. In: Entrepreneurship Theory & Practice, Vol. 30, Nr. 3, S. 321-331.
GARTNER, WILLIAM B. / MITCHELL, TERENCE R. / VESPER, KARL H. (1989): A Taxonomy of New Business Ventures. In: Journal of Business Venturing, Vol. 4, S. 169-186.
HINDLE, KEVIN (2004): Choosing Qualitative Methods for Entrepreneurial Cognition Research: A Canonical Development Approach. In: Entrepreneurship Theory & Practice, Winter, S. 575-607.
HOFSTEDE G (1991) Culture and organizations: software of the mind. McGraw-Hill, London.
LANDSTRÖM, HANS (2005): Pioneers in Entrepreneurship and Small Business Research. New York u.a.: Springer.
© 2011 RossiSmith Academic Publishing, JAES, Vol VII, Iss 2, December 2011, Refereed Edition, Page:
12
LOW, MURRAY B. / MACMILLAN, IAN C. (1988): Entrepreneurship: Past Research and Future Challenges. In: Journal of Management, Vol. 14, S. 139-161.
LOW, MURRAY B. (2001): The Adolescence of Entrepreneurship Research: Specification of Purpose. In: Entrepreneurship Theory & Practice, Vol. 25, Nr. 4, S. 17-25.
ROCHA, HECTOR / BIRKINSHAW, JULIAN (2007): Entrepreneurship Safari: A Phenomenon-Driven Search for Meaning. In: Foundations and Trends in Entrepreneurship, Vol. 3, Nr. 3, Boston, Delft: now Publishers.
SHANE, SCOTT / VENKATARAMAN, S. (2000): The Promise of Entrepreneurship as a Field of Research. In: Academy of Management Review, Vol. 25, S. 217-226.
SHANE, SCOTT / VENKATARAMAN, S. (2001): Entrepreneurship as a Field of Research: A Response to Zahra and Dess, Singh and Erikson. In: Academy of Management Review, Vol. 26, Nr. 1, S. 13-16.
STOREY, DAVID J. (2011): Optimism and chance: The elephants in the entrepreneurship room. In: International Small Business Journal, Vol. 29, Nr. 4, S. 303-321.
VENKATARAMAN, S. (1997): The Destinctive Domain of Entrepreneurship Research. In: Katz, J. / Brockhaus, J. (Hrsg.): Advances in Entrepreneurship, Firm Emergence, and Growth. Greenwich, CT: JAI Press, S. 119-138.
WIKLUND, J. / DAVIDSSON, P. / DELMAR, F. (2003): 'What do they think and feel about growth? An expectancy-value approach to small business managers’ attitudes toward growth', Entrepreneurship Theory and Practice, Vol. 27, No. 3, S. 247-70.
© 2011 RossiSmith Academic Publishing, JAES, Vol VII, Iss 2, December 2011, Refereed Edition, Page:
13
INVESTIGATING THE FIRM LIFE-CYCLE THEORY ON AUSTRALIAN SMES IN THE ICT SECTOR
Dr. Áron Perényi: Swinburne University of Technology, Hawthorn, Australia
Professor Christopher Selvarajah: Swinburne University of Technology, Hawthorn, Australia
Associate Professor Siva Muthaly: Graduate School of Business and Law, RMIT University, Melbourne, Australia
Contact: Áron Perényi, Swinburne University of Technology (AGSE), PO Box 218, 3122
Hawthorn, Australia, (T) +61 405 729 055, (F) +61 3 9214 8381, Email: [email protected]
ABSTRACT
Four points of major criticism can be identified regarding the application of firm life-
cycle theory on SMEs: inconsistency of empirical validation; descriptive nature of the
model; regression in the cycle is neglected; and linear, sequential life-cycle model. Data
was collected on Australian SMEs in the ICT sector, using established quantitative
methodology. Propositions were formulated based on critical literature, and were
evaluated using statistical analysis. It was found, that the life-cycle classification was
possible and meaningful. Progression along the life-cycle path was predominant, but
regression could also be identified. An idle life-cycle stage could not be clearly identified
using clustering. However, when investigating the shift between life-cycle stages, a
substantial group of idle firms has been shown.
© 2011 RossiSmith Academic Publishing, JAES, Vol VII, Iss 2, December 2011, Refereed Edition, Page:
14
1. INTRODUCTION
The firm life-cycle theory has been used to investigate several aspects of small business
studies. Firm life-cycle theory describes the development path of organisations through
various stages, whose characteristics substantially differ from each other, and follow each
other in consecutive order. This definition can be derived from literature, relating life-
cycle theory to business strategy (Lester, Parnell & Carraher 2003; Miller & Friesen
1984), entrepreneurship (Kimberly 1979; Quinn & Cameron 1983) and firm growth
(Fitzsimmons, Steffens & Douglas 2005; Steffens, Fitzsimmons & Davidsson 2006). Firm
life-cycle theory itself has been re-thought and criticised over the course of its
development (Levie and Lichtenstein 2010, O'Farrell & Hitchens 1988), and has proven
to be useful in explaining, or even predicting business behaviour (Lester, Parnell &
Carraher 2003, McMahon 1998, 2001, Smith, Mitchell & Summer 1985), assisting
managers (Adizes 1979, Lippitt and Schmidt 1967), and enabling academics to refine
theories (Hanks 1993, Miller and Friesen 1984, Quinn and Cameron 1983).
Levie and Lichtenstein (2010) provide an overview of firm life-cycle literature published
between 1962 and 2006. They emphasise their finding that the empirical validation of
firm life-cycle theory is not rigorous and its application delivers ambiguous results. Four
major points of criticism have been identified regarding the firm life-cycle theory: (1)
empirical validation; (2) the nature of the life-cycle model (focuses on descriptive
measures and not explanations); (3) life-cycle models considers one-way development
and regression is not considered (O'Farrell & Hitchens 1988); (4) the developmental
models depict a linear pathway and branching off this pathway is not considered (Lester,
Parnell & Carraher 2003; Massey et al. 2006; McMahon 2001). Specifically for SMEs
(Small and Medium Sized Enterprises), a further limitation can be identified. SMEs –
rather than turning into decline – grow out of the size category (Kazanjian & Drazin
1989). This would either indicate a reduction of the number of firm life-cycle stages, or
reverse transition (regression) in the firm life-cycle.
© 2011 RossiSmith Academic Publishing, JAES, Vol VII, Iss 2, December 2011, Refereed Edition, Page:
15
This paper aims at empirically evaluating the applicability of the firm life-cycle theory
based on investigating Australian SMEs in the ICT (Information Communication
Technologies) sector, and reflects on the four points of criticism raised in literature.
2. A REVIEW OF FIRM LIFE-CYCLE THEORIES
Belak, Duh and Belak (2006) summarise different perspectives on firm life-cycle theory.
Models of analogy (1) have been based on the product life-cycle concept as also
discussed by Rink and Swan (1979). Crisis models (2) focus on the process of change
within the organisations as illustrated by Churchill and Lewis (1983). Organisational life-
cycle models (3) examine the development of organisational factors. This latter
conceptual domain originates from the idea of evolutionary firm development described
by Edith Penrose (1952). The focus of this study on the organisational development
perspective is justified by the number of empirical studies operationalising and
investigating SME life-cycle using this approach. A review of these studies is provided in
the following section.
The review of firm life-cycle theory from conceptual and empirical papers indicates
ambiguity, suggesting the need for further empirical validation. This claim is supported
by the extensive review of papers performed by Levie and Lichtenstein (2010)
highlighting sever shortcomings on empirical work investigating the firm life-cycle
theory. Four critical points can be formulated by reviewing the taxonomy of firm life-
cycle theories with regards to SMEs. The propositions reflecting on the points of criticism
are tested using data investigating SMEs in the ICT sector.

© 2011 RossiSmith Academic Publishing, JAES, Vol VII, Iss 2, December 2011, Refereed Edition, Page:
16
2.1. Taxonomy of firm life-cycle models
Researchers have proposed various models to explain organisational life-cycles. Most
life-cycle models were characterised by the fact that the challenges and opportunities of
the firm vary across different stages of the life-cycle (Lynall, Golden & Hillman 2003).
Life-cycle models are reviewed in the following section, using conceptual papers as a
basis. This will allow for the selection of the most applicable life-cycle model for
empirical testing.
2.1.1. Stage numbers in different life-cycle models
The majority of papers discussing organisational life-cycle described four or five stages
(see Table 1). Models consisting of four stages usually did not consider the total life-span
of the examined entity, only the early stages of development.
Table1: Taxonomy of life-cycle models – number of stages
Number of stages Authors
3 Lippitt and Schmidt (1967), Smith, Mitchell & Summer (1985)
4 Kazanjian and Drazin (1989), Kimberly (1979), Lyden (1975), Quinn and Cameron (1983), Steinmetz (1969)
5 Greiner (1972), Hanks et al. (1993), Miller and Friesen (1984), Penrose (1952), Scott and Bruce (1987)
6 Churchill and Lewis (1983) 10 Adizes (1979)
Models with less than four stages are more applicable to SMEs, indicating the difficulty
of identifying a decline stage in SMEs. Models with more than five stages are rare, and
predominantly appear in conceptual papers, suggesting that they are difficult to validate
empirically. This suggests using models with not more than five stages to conceptualise
organisational life cycle.
© 2011 RossiSmith Academic Publishing, JAES, Vol VII, Iss 2, December 2011, Refereed Edition, Page:
17
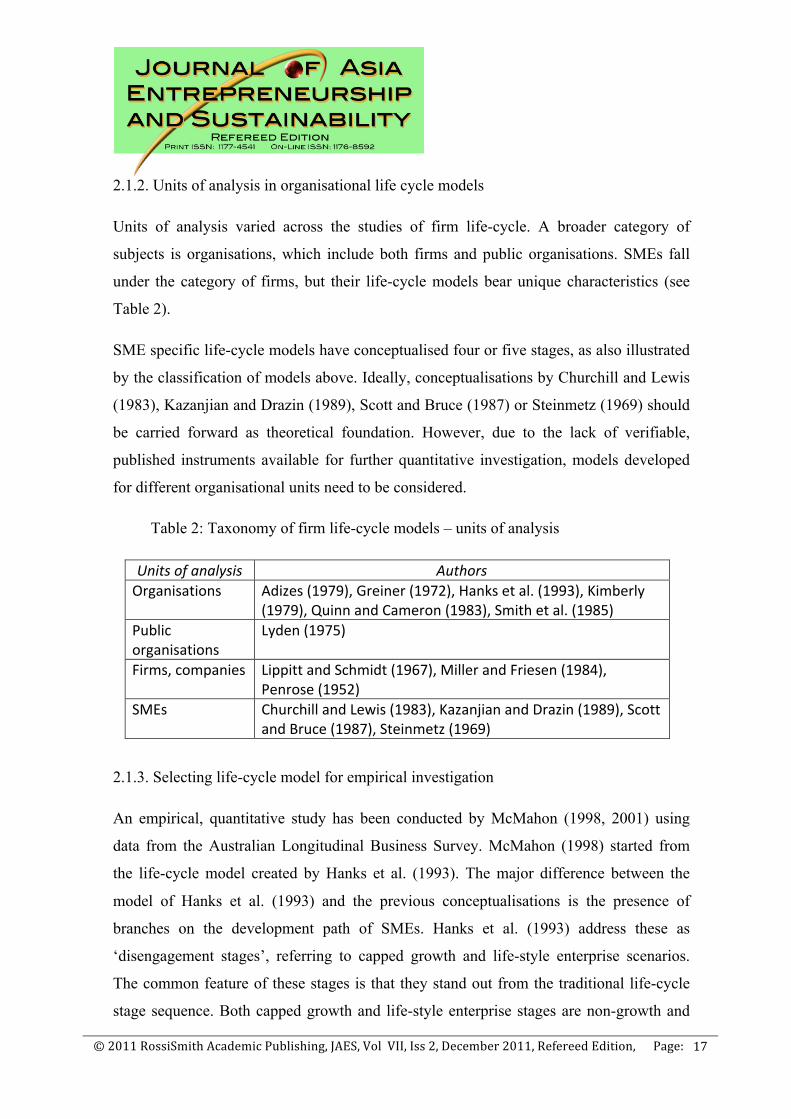
2.1.2. Units of analysis in organisational life cycle models
Units of analysis varied across the studies of firm life-cycle. A broader category of
subjects is organisations, which include both firms and public organisations. SMEs fall
under the category of firms, but their life-cycle models bear unique characteristics (see
Table 2).
SME specific life-cycle models have conceptualised four or five stages, as also illustrated
by the classification of models above. Ideally, conceptualisations by Churchill and Lewis
(1983), Kazanjian and Drazin (1989), Scott and Bruce (1987) or Steinmetz (1969) should
be carried forward as theoretical foundation. However, due to the lack of verifiable,
published instruments available for further quantitative investigation, models developed
for different organisational units need to be considered.
Table 2: Taxonomy of firm life-cycle models – units of analysis
Units of analysis Authors Organisations Adizes (1979), Greiner (1972), Hanks et al. (1993), Kimberly
(1979), Quinn and Cameron (1983), Smith et al. (1985) Public organisations
Lyden (1975)
Firms, companies Lippitt and Schmidt (1967), Miller and Friesen (1984), Penrose (1952)
SMEs Churchill and Lewis (1983), Kazanjian and Drazin (1989), Scott and Bruce (1987), Steinmetz (1969)
2.1.3. Selecting life-cycle model for empirical investigation
An empirical, quantitative study has been conducted by McMahon (1998, 2001) using
data from the Australian Longitudinal Business Survey. McMahon (1998) started from
the life-cycle model created by Hanks et al. (1993). The major difference between the
model of Hanks et al. (1993) and the previous conceptualisations is the presence of
branches on the development path of SMEs. Hanks et al. (1993) address these as
‘disengagement stages’, referring to capped growth and life-style enterprise scenarios.
The common feature of these stages is that they stand out from the traditional life-cycle
stage sequence. Both capped growth and life-style enterprise stages are non-growth and
© 2011 RossiSmith Academic Publishing, JAES, Vol VII, Iss 2, December 2011, Refereed Edition, Page:
18
are not followed by other stages in the sequence. McMahon (2001) has provided
empirical evidence for the life-cycle model, using secondary data made available by the
Australian Bureau of Statistics. The availability of such data is however limited and
replication is thus difficult.
Another empirical study using primary, quantitative data was conducted by Lester et al.
(2003). Lester et al. (2003) base their model of SME life-cycle on ideas and findings of
researchers, such as Penrose (1952), Greiner (1972), Quinn and Cameron (1983) and
Miller and Friesen (1984). Their synthesis model contains five stages and uses a 20-item
scale in assessing how managers perceive their organisations. They assume that the life-
cycle model is a deterministic approach; its stages are a loosely compromised set of
organisational activities and structures, and managerial focus is on external problems in
the early stages and internal problems in the later stages. The five stage life-cycle model
was supported by the research results of Lester et al. (2003) investigating SMEs in the
manufacturing sector in the US. A further advantage of using this study as a basis is, that
Lester et al. (2003) refined a questionnaire based on the empirically verified
conceptualisation of Miller and Friesen (1984).
2.1.4. Review of Lester’s five stage life-cycle model
Lester et al. (2003) empirically validated a five stage life-cycle model. The first stage
(Existence) was characterised by the beginning of the organisation’s development.
Decision making and ownership is concentrated. The second stage (Survival) is the age
when organisations seek to grow and establish their own distinct competencies. This stage
is also characterised by active planning activities. The third stage (Success) is commonly
called maturity, and represents efforts of formalisation, control and bureaucracy. The top
management team usually focuses on planning and strategy. Stage four is the Renewal
stage, in which organisations attempt to foster innovation and creativity. Such attempts
involve creation of matrix structures and de-centralisation. Finally, in the decline stage,
organisations are characterised by politics and power. Centralisation is a consequence of
shrinking market shares and profit.
© 2011 RossiSmith Academic Publishing, JAES, Vol VII, Iss 2, December 2011, Refereed Edition, Page:
19
In order to determine how strongly a particular stage’s characteristics are represented in
an organisation, every stage is assigned a set of four measures. These measures have been
published (see Appendix 1), and Lester et al. (2003) have provided a foundation for
assessing the validity and reliability of a replication study using these measures.
Lester et al. (2003) used principal components factor extraction technique to validate the
five dimensions of the organisational life-cycle construct, and assessed the internal
consistency of the reflective measures by Cronbach alpha scores. The alpha coefficients
ranged between 0.57 and 0.85 indicating reliability of the measures of the five life-cycle
specific sub-constructs. Correlation scores within the factors were relatively high (at
least0.71) and cross correlations low (maximum of 0.31) suggesting validity of the sub-
scales.
2.2. The critique of firm life-cycle models
Authors conducting empirical research into the applicability of the firm life-cycle theory
on SMEs (Churchill & Lewis 1983; Kazanjian & Drazin 1989; Scott & Bruce 1987) have
been able to identify several problematic issues regarding the life-cycle models. The
sequential nature of the stages has not been proven beyond doubt. Further points of
criticism have been raised by O'Farrell and Hitchens (1988), Levie and Lichtenstein
(2010), and regarding the linearity of progression between life-cycle stages (Lester et al.
2003; Massey et al. 2006; McMahon 2001).
2.2.1. The issue of empirical validation
Firstly, O'Farrell and Hitchens (1988) and Levie and Lichtenstein (2010) point out that
this empirical validation has been mostly conducted using small samples and cross-
sectional data, instead of longitudinal data. This criticism is addressed in the studies of
McMahon (2001) and Massey et al. (2006). McMahon (2001) used a relatively large
sample in his effort to validate the life-cycle model, and Massey et al. (2006) conducted
© 2011 RossiSmith Academic Publishing, JAES, Vol VII, Iss 2, December 2011, Refereed Edition, Page:
20
research using a case-study methodology applying the longitudinal approach. McMahon
(2001) approved of the life-cycle model, with the exception that the development may
branch off into non-growth stages. Massey et al. (2006) have found the life-cycle
metaphor meaningful for their respondents. Both groups of authors have found the
existence of the stage model proven, and the life-cycle model meaningful. O'Farrell and
Hitchens (1988) also suggest that the stage model and the business life-cycle theories are
based more on assumptions than scientifically collected evidence. This statement is,
however, countered by a long list of successful empirical validations in the case of SMEs
by Churchill and Lewis (1983), Hanks et al. (1993), Kazanjian and Drazin (1989),
Kimberly (1979), Quinn and Cameron (1983), Scott and Bruce (1987) and Smith et al.
(1985), some of which even date from before the work of O'Farrell and Hitchens (1988).
Later, Müller (1999), McMahon (2001), Lester et al. (2003) and Massey et al. (2006) also
successfully validated the life-cycle model.
2.2.2. Descriptive nature
The second group of critique is made regarding life-cycle and stage models themselves.
The models describe the descriptive characteristics of firm life-cycle rather than
explaining the underlying phenomenon of organisational development (O'Farrell &
Hitchens 1988). The empirical validation efforts mostly have taken a quantitative
approach. However, Massey et al. (2006) applied a qualitative methodology and found the
business life-cycle metaphor proven to be meaningful to the interviewees participating in
the research.
A further weakness of the life-cycle theories is the measurement issue. Typical measures
of firm size are employment (measured in the number of full time equivalent employees),
sales revenues and assets, but more sophisticated measures like product mix, value added
or innovation rate are excluded. The cross-sectional investigation of these parameters
implies descriptive outcomes. It also raises the issue whether and to what extent is it a
valid practice to estimate dynamics (life-cycle stage changes) using static (cross-
© 2011 RossiSmith Academic Publishing, JAES, Vol VII, Iss 2, December 2011, Refereed Edition, Page:
21
sectional) information. However, data availability and retrospective bias limits the
possibilities of extending from descriptive studies on the matter.
2.2.3. Full cycle?
Thirdly, O'Farrell and Hitchens (1988) suggest that, SMEs pass through every stage of the
development model. Regression is not considered. No evidence has been found to support
this statement in the research reviewed in this study. Regression has in fact not been
considered, but non-growth stages have been identified by Churchill and Lewis (1983),
Hanks et al. (1993) and McMahon (2001). For instance, Lester et al. (2003) and Massey
et al. (2006) included external parameters in their models. However, McMahon (2001)
excluded these factors due to the specific nature of the data source used in his study.
Generally speaking, any modelling needs boundaries to be set. The stages analysed in
these models do not cover stages before start-up, though an attempt at such a
conceptualisation has been made by Kimberly (1979).
2.2.4. Linearity
Fourthly, the linear nature of life-cycle models can be strongly criticised (Levie &
Lichtenstein 2010). Empirical evidence of several authors (Lester et al. 2003; Massey et
al. 2006; McMahon 2001) confirm the existence of life-cycle stages which represent a
‘dead end’ in terms of firm growth. These non-growth stages are external to the logic of
the firm life-cycle models discussed earlier.
2.3. Research propositions
Life-cycle models have been applied to predict a probable way of firm development.
They have been used to suggest managerial skills, knowledge, attitudes (Lippitt &
Schmidt 1967), priorities (Scott & Bruce 1987) or efficient ways of problem solving
© 2011 RossiSmith Academic Publishing, JAES, Vol VII, Iss 2, December 2011, Refereed Edition, Page:
22
(Lyden 1975); provide explanation for small business growth (Scott & Bruce 1987);
identify internal (Churchill & Lewis 1983) and external (Quinn & Cameron 1983) factors
responsible for success and failure of SMEs. The role of innovation and entrepreneurial
activity has been analysed in the early stages of firm development by Kimberly (1979)
using this framework.
The life-cycle phenomenon has been found meaningful by SME owner-managers
(Massey et al. 2006), and evidence has been provided for the sequential nature of life-
cycle stages (Lester et al. 2003). One important inconsistency has been recognised in the
life-cycle models by Churchill and Lewis (1983) and Hanks et al. (1993), namely the
existence of non-growth stages. McMahon (2001) has provided empirical evidence for the
existence of these stages.
Researchers of firm life-cycle models have focused on the existence and nature of the
stages (descriptive aspect), rather than the process of development (transition between
stages). Shifting the focus of analysis of the life-cycle theory from description to
transition can allow for further analysis of SME performance and growth.
The question this paper aims to answer is whether the life-cycle theory is applicable for
SMEs. Based on the critique formulated by Levie and Lichtenstein (2010) and O'Farrell
and Hitchens (1988), four propositions can be formulated:
1. SMEs can be classified into life-cycle stages.
2. Firm life-cycle stages follow each other in an established sequence.
3. SMEs typically do not fall into the final stage of the firm life-cycle.
4. An additional, idle stage can be identified in the life-cycle of SMEs.
3. METHODOLOGY
A quantitative methodology was used to assess the progression of SMEs in their life-cycle
employing a survey based on Lester et al. (2003). A quantitative approach can be justified
© 2011 RossiSmith Academic Publishing, JAES, Vol VII, Iss 2, December 2011, Refereed Edition, Page:
23
by the mature nature of firm life-cycle theory (Edmondson & McManus 2007). Data
collection was conducted in Australia using an on-line survey. The owners, managers or
key representatives of SMEs in the ICT sector were invited to participate in the survey.
They were administered a questionnaire, which contained statements on their perception
of the indicators of firm life-cycle stage. A measure previously tested, refined and
published by Lester et al. (2003) was used. The respondents were asked to reflect on the
statements as they see currently, and as they remember to have perceived four years ago.
This solution for the data collection was considered acceptable – even though a strong
response bias could be expected – given the difficulty of aligning respondents to obtain
longitudinal data.
The measurement model was tested using PLS (Partial Least Squares) modelling,
applying SmartPLS (Ringle, Wende & Will 2005). The use of PLS can be justified with
the size of the sample, the distribution of the indicators, and the need for using summated
scales as indicator scores for various life-cycle stages. This choice will be supported by
relevant literature and statistical analysis supplying further justification for the application
of the PLS technique in the following section. The respondents were classified into firm
life-cycle stages using cluster analysis, and the stages were aligned to pre-defined firm
life-cycle stage categories based on weighted average indicator scores. Hierarchical
cluster analysis was applied to determine the potentially optimal number of clusters, and
cluster membership was optimised using a non-hierarchical clustering method. Eventually,
the results of this classification were used to identify the transition of companies between
life-cycle stages within the examined time period.
3.1. The survey instrument
Lester et al. (2003) developed and tested a scale to measure a five-stage firm life-cycle
model for SMEs. The empirical validation of this instrument was based on survey data
obtained from the manufacturing sector. Based on 242 respondents (managers in the US),
a reliability of 0.57 to 0.85 was reached (Lester et al. 2003) in terms of Cronbach’s Alpha
(Cronbach 1951).
© 2011 RossiSmith Academic Publishing, JAES, Vol VII, Iss 2, December 2011, Refereed Edition, Page:
24
The original questionnaire used by Lester et al. (2003) is shown in Appendix 1.
Respondents were asked to rate the statements using Likert response format expressing
the extent to which they agree with them. In order to avoid double-barrelled questions,
question two was broken up into two sub-questions which were presented separately
within the questionnaire (see Appendix 2). The original question was substituted by the
additional questions (generated by splitting an original question) in the measures of the
firm life-cycle stage.
These questions were repeated as retrospective questions (with a different pre-face text)
to allow the consideration of progress in the firm life-cycle path. In the section enquiring
about the current situation, all 21 questions start with “In my opinion, during the last
financial year, …”, and in the section enquiring about the past, questions start with “In
my view, during the financial year four years ago (or at founding), …”.
In order to increase the engagement of the respondents, and avoid the respondents
answering similar questions automatically, the questions were shuffled around between
topics rather than asked in the thematic sequence shown in the original survey. The
questions were numbered 1 to 42 in the survey, and were placed on the second and third
pages of the questionnaire (see Appendix 3 for the link between survey items and
constructs).
Further information was collected on the firms regarding their size (along the dimension
of employment, turnover and asset size), age (year of founding) and growth (along the
same dimensions as firm size: employment, assets and turnover), to enable the
confirmation of firm life-cycle alignment. The measures of firm growth and firm life-
cycle were based on 5 point Likert-type scales (a low value indicating disagreement, a
high value showing agreement). Perceived firm growth was measured over the preceding
four year time period, firm life-cycle was investigated as at the time of the survey (in
2009) and as four years before. The location of respondents was registered by collecting
the post codes. This allowed the assessment of territorial distribution of the respondents.
Firm age was calculated based on the indicated year of founding.
© 2011 RossiSmith Academic Publishing, JAES, Vol VII, Iss 2, December 2011, Refereed Edition, Page:
25
3.2. Data collection
A survey exploring the indicators of firm life-cycle was conducted as part of a longer
questionnaire testing a conceptual framework on the interaction of firm life-cycle,
resources, expansion plans and firm growth (Perényi, Selvarajah & Muthaly 2008) as part
of a PHD project. The questions were placed in the beginning of the 100 question survey.
The high number of questions in the survey impacted upon the response rate.
Porter (2004) points out that there is no reason to assume a lower response rate for web
based compared to paper based surveys. In fact, the response rate gap between the
different kinds of survey administration channels depends on the access for and comfort
of the population in responding via a digital medium. It can reasonably be assumed that
owners, managers or key employees of ICT businesses are comfortable with responding
to web-based surveys, and have sufficient access to email and internet as well.
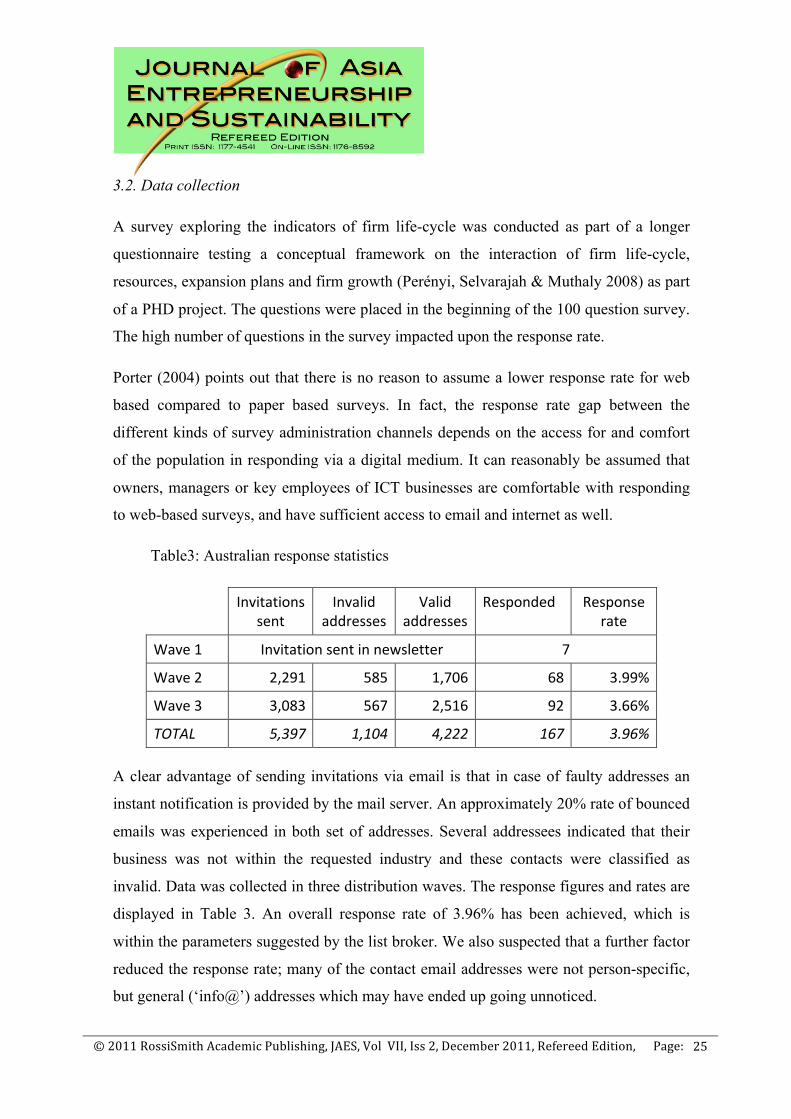
Table3: Australian response statistics
Invitations sent
Invalid addresses
Valid addresses
Responded Response rate
Wave 1 Invitation sent in newsletter 7
Wave 2 2,291 585 1,706 68 3.99%
Wave 3 3,083 567 2,516 92 3.66%
TOTAL 5,397 1,104 4,222 167 3.96% A clear advantage of sending invitations via email is that in case of faulty addresses an
instant notification is provided by the mail server. An approximately 20% rate of bounced
emails was experienced in both set of addresses. Several addressees indicated that their
business was not within the requested industry and these contacts were classified as
invalid. Data was collected in three distribution waves. The response figures and rates are
displayed in Table 3. An overall response rate of 3.96% has been achieved, which is
within the parameters suggested by the list broker. We also suspected that a further factor
reduced the response rate; many of the contact email addresses were not person-specific,
but general (‘info@’) addresses which may have ended up going unnoticed.
© 2011 RossiSmith Academic Publishing, JAES, Vol VII, Iss 2, December 2011, Refereed Edition, Page:
26
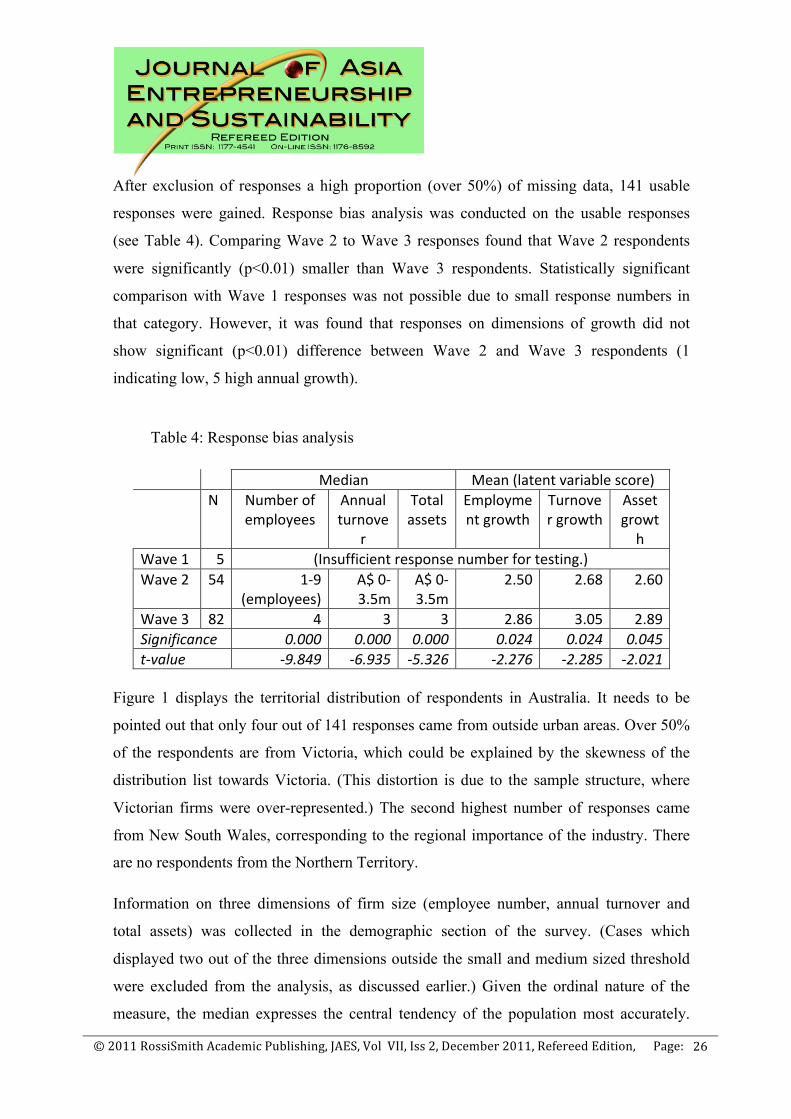
After exclusion of responses a high proportion (over 50%) of missing data, 141 usable
responses were gained. Response bias analysis was conducted on the usable responses
(see Table 4). Comparing Wave 2 to Wave 3 responses found that Wave 2 respondents
were significantly (p<0.01) smaller than Wave 3 respondents. Statistically significant
comparison with Wave 1 responses was not possible due to small response numbers in
that category. However, it was found that responses on dimensions of growth did not
show significant (p<0.01) difference between Wave 2 and Wave 3 respondents (1
indicating low, 5 high annual growth).
Table 4: Response bias analysis
Median Mean (latent variable score) N Number of
employees Annual turnove
r
Total assets
Employment growth
Turnover growth
Asset growth
Wave 1 5 (Insufficient response number for testing.) Wave 2 54 1-‐9
(employees) A$ 0-‐ 3.5m
A$ 0-‐ 3.5m
2.50 2.68 2.60
Wave 3 82 4 3 3 2.86 3.05 2.89 Significance 0.000 0.000 0.000 0.024 0.024 0.045 t-‐value -‐9.849 -‐6.935 -‐5.326 -‐2.276 -‐2.285 -‐2.021
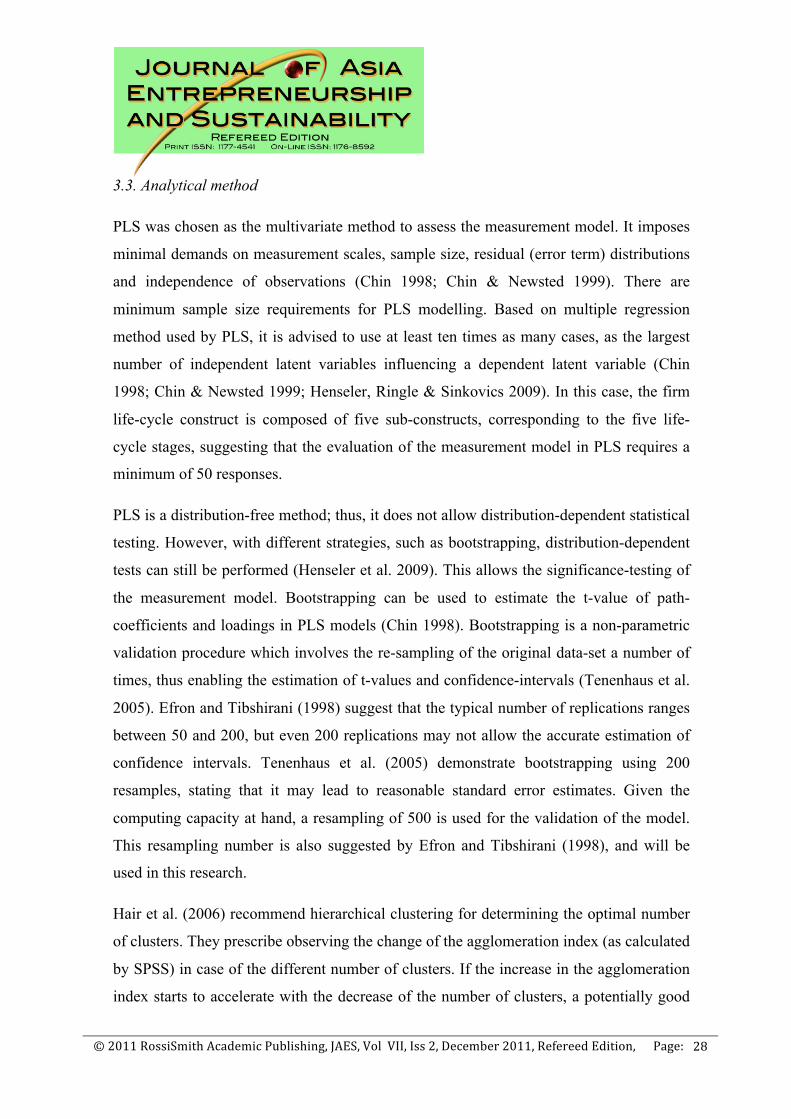
Figure 1 displays the territorial distribution of respondents in Australia. It needs to be
pointed out that only four out of 141 responses came from outside urban areas. Over 50%
of the respondents are from Victoria, which could be explained by the skewness of the
distribution list towards Victoria. (This distortion is due to the sample structure, where
Victorian firms were over-represented.) The second highest number of responses came
from New South Wales, corresponding to the regional importance of the industry. There
are no respondents from the Northern Territory.
Information on three dimensions of firm size (employee number, annual turnover and
total assets) was collected in the demographic section of the survey. (Cases which
displayed two out of the three dimensions outside the small and medium sized threshold
were excluded from the analysis, as discussed earlier.) Given the ordinal nature of the
measure, the median expresses the central tendency of the population most accurately.
© 2011 RossiSmith Academic Publishing, JAES, Vol VII, Iss 2, December 2011, Refereed Edition, Page:
27
The median respondent had 10-19 employees, earning up to A$3.5 million annually with
a capital invested of approximately A$3.5-10 million.
Figure1: Location of respondents in Australia
1
2
3
4
5
6
7
8
Map altered based on Geoscience Australia (2005)
Firm age is measured by asking the respondents for the year of founding and the year in
which the company started its operations. The firm founded earliest was established and
started its operations in 1954. The latest dates of operational start and founding were in
2007. Given that the data collection took pace in 2009, firm age can be calculated by
subtracting the indicated year from 2009. After computing the firm age variable based on
both the year of founding and the start of operations, the median age of firms is 12.
In terms of the total population, the availability of details is limited. The employee size
distribution of SMEs can be used to estimate the expected distribution of firm size in the
ICE sector. There were 2,011,770 actively trading businesses in Australia in June 2007. A
total of 42% of these were employing, less than 1% of which employed 200 or more, 9%
employed 20-199, 90% under 20 people and 30% fewer than five people (ABS 2007).
However, given reliance of the sampling method on the availability of respondent email
contact details, more accurate comparison of respondents to the total population is not
possible.
1: Victoria (71) 2: Tasmania (2) 3: Australian Capital Territory (4) 4: New South Wales (35) 5: Queensland (17) 6: Northern Territory (0) 7: Western Australia (5) 8: South Australia (6)
© 2011 RossiSmith Academic Publishing, JAES, Vol VII, Iss 2, December 2011, Refereed Edition, Page:
28
3.3. Analytical method
PLS was chosen as the multivariate method to assess the measurement model. It imposes
minimal demands on measurement scales, sample size, residual (error term) distributions
and independence of observations (Chin 1998; Chin & Newsted 1999). There are
minimum sample size requirements for PLS modelling. Based on multiple regression
method used by PLS, it is advised to use at least ten times as many cases, as the largest
number of independent latent variables influencing a dependent latent variable (Chin
1998; Chin & Newsted 1999; Henseler, Ringle & Sinkovics 2009). In this case, the firm
life-cycle construct is composed of five sub-constructs, corresponding to the five life-
cycle stages, suggesting that the evaluation of the measurement model in PLS requires a
minimum of 50 responses.
PLS is a distribution-free method; thus, it does not allow distribution-dependent statistical
testing. However, with different strategies, such as bootstrapping, distribution-dependent
tests can still be performed (Henseler et al. 2009). This allows the significance-testing of
the measurement model. Bootstrapping can be used to estimate the t-value of path-
coefficients and loadings in PLS models (Chin 1998). Bootstrapping is a non-parametric
validation procedure which involves the re-sampling of the original data-set a number of
times, thus enabling the estimation of t-values and confidence-intervals (Tenenhaus et al.
2005). Efron and Tibshirani (1998) suggest that the typical number of replications ranges
between 50 and 200, but even 200 replications may not allow the accurate estimation of
confidence intervals. Tenenhaus et al. (2005) demonstrate bootstrapping using 200
resamples, stating that it may lead to reasonable standard error estimates. Given the
computing capacity at hand, a resampling of 500 is used for the validation of the model.
This resampling number is also suggested by Efron and Tibshirani (1998), and will be
used in this research.
Hair et al. (2006) recommend hierarchical clustering for determining the optimal number
of clusters. They prescribe observing the change of the agglomeration index (as calculated
by SPSS) in case of the different number of clusters. If the increase in the agglomeration
index starts to accelerate with the decrease of the number of clusters, a potentially good
© 2011 RossiSmith Academic Publishing, JAES, Vol VII, Iss 2, December 2011, Refereed Edition, Page:
29
cluster number is reached. Hair et al. (2006) point out, that observations cannot be
removed from clusters in the process of hierarchical clustering, which potentially distorts
the cluster solution and creates a sub-optimal cluster structure. They recommend, as non-
hierarchical clustering produces a more robust result, that in order to eliminate the bias of
this distortion, the final cluster membership should be established using a non-
hierarchical clustering method. These recommendations for the process of clustering are
observed and implemented when arranging the respondents into firm life-cycle groups.
4. DATA ANALYSIS
After assessing the extent of the missing data, excluding cases with insufficient
information (lacking more than 50% of the responses for the firm life-cycle measure) and
implementing regression-based imputation (as implemented by SPSS), a dataset of 141
cases was acquired. The distribution of most of the variables significantly deviated from
the normal distribution at the univariate level (see Appendix 4), both according to the
Shapiro-Wilks and the Kolmogorov-Smirnov tests (Hair et al. 2006) at a p<0.01 level,
(df=141). The sample size is relatively small for factor analysis. Basic requirements of
factor analysis state that it is recommended to have ideally up to 10 times as many cases
as indicators (Hair et al. 2006), which would suggest at around 210 respondents for the 21
indicators of the five factor firm life-cycle measure. A further argument supports the use
of an different testing method for the measures. As also stated by Guadagnoli and Velicer
(1988), replicable factor structures tend to have either four variables per factor, with
structure coefficients over 0.6׀ ׀ or have 10 or more structure coefficients with lower
loadings, but substantial sample size. Even though the model of Lester et al. (2003) was
validated using principal components factor analysis, his results did not fulfil such criteria,
suggesting that validation using a similar method would be difficult. Combined with the
ability of PLS to provide latent variable scores, handle data of non-normal distribution
and small sample sizes, this analytical technique has been used to test the reliability of the
measures (correlation matrix of the total data set serving as the basis of analysis is
displayed in Appendix 4).
© 2011 RossiSmith Academic Publishing, JAES, Vol VII, Iss 2, December 2011, Refereed Edition, Page:
30
4.1. Measurement model testing
The measurement model was tested using SmartPLS (Ringle, Wende & Will 2005).
While recognising the limitations of this statistical testing method in comparison to factor
analysis in terms of validating the measurement model, it needs to be noted, that the
validity of the life-cycle stage measures is strongly supported by the empirical results of
Lester et al. (2003) who refined and statistically tested the measures developed by Hanks
et al. (1993). Wilson and Henseler (2007) suggest multiple alternatives of assessing
validity and reliability of higher-order reflective construct models using PLS. Wetzels,
Odekerken-Schroeder & van Oppen (2009) describes the most commonly used validation
process of such hierarchical construct models in detail.
After removing the indicators with insufficient loading, the fit (convergent and
discriminant validity) and reliability of the measurement model was established for both
the Current and the Initial dimensions of the firm life-cycle measurement. Chin (2010)
provides a comprehensive guide to evaluating PLS models and reporting PLS model
results. The recommended indicator for assessing reliability of measures is Composite
Reliability, also referred to as Dillion-Goldstein’s Rho (Dillon & Goldstein 1984). Chin
(2010) also recommends reporting Cronbach’s Alpha as it is a reliability measure
traditionally reported for assessing the reliability of constructs. The higher-order
measurement model of firm growth was confirmed using the framework provided by
Wilson & Henseler (2007) and Wetzels et al. (2009). Appendix 5 provides an account of
the details of the measurement model. It is important to highlight, that the AVE (average
variance extracted, describing the shared variance between the indicators and the average
weighted construct score) indicators for every construct was above 0.5, all composite
reliability indicators were higher than 0.7 (see Tables 5.3 and 5.4 in Appendix 5) and the
values of the correlation matrix were all below the square root of the construct-specific
AVE scores (see Tables 5.1 and 5.2 in Appendix 5) approving of the reliability,
convergent and discriminant validity of the measures (Chin 2010; Wilson & Henseler
2007, wetzels et al. 2009).

© 2011 RossiSmith Academic Publishing, JAES, Vol VII, Iss 2, December 2011, Refereed Edition, Page:
31
One issue can be highlighted based on the loadings and cross-loadings of indicators onto
the life-cycle stage constructs. Even though the loadings (based on which the weighted
average constructs scores have been computed) are sufficiently high (mostly over 0.7, see
Tables 5.3 and 5.4 in Appendix 5), there are a few cross-loadings that are also relatively
high (in the domain of 0.6). This suggests, that even though convergent and discriminant
validity of the measurement model can be confirmed, using the framework of Wetzels et
al. (2009), further analysis based on the weighted average construct scores of the life-
cycle specific factors will be affected. Thus these factors are non-orthogonal. However,
given the empirical support of the factor structure of the measures provided by Hanks et
al. (1993) and Lester et al. (2003), this shortcoming of the data does not justify discarding
the model.
A further issue can be raised regarding the decline construct. As the validation process of
the measurement model only left two items within the construct. These two items quite
strongly cross-load onto the existence construct measures for both the Current and Initial
dimensions of firm life-cycle. The face validity of the measures can also be questioned, as
due to the exclusion of two out of four original items, the decline construct much rather
expresses centralisation within the firm, than characteristics of the decline stage. On this
account, the decline construct is excluded from further analysis.
The results of bootstrapping with a resample size of 500 confirm the significance of every
factor loading in the measurement model at a p<0.01 level (all t-values calculated based
on bootstrapping exceeded 2.54).
4.2. Firm life-cycle clustering
The optimal number of clusters is determined using hierarchical clustering. The final
cluster solution is generated using a non-hierarchical clustering method. The hierarchical
clustering procedure does not allow units of observation to leave a cluster, resulting in a
sub-optimal cluster structure in terms of separation. In this way, the restrictions of
© 2011 RossiSmith Academic Publishing, JAES, Vol VII, Iss 2, December 2011, Refereed Edition, Page:
32
hierarchical clustering can be eliminated while utilising the method’s strength in
determining the optimal cluster number.
4.2.1. Number of clusters
Lester et al. (2003) suggested using hierarchical clustering based on Ward’s distance. The
relative increase of Ward’s agglomeration coefficient in the hierarchical clustering
process indicates potentially optimal cluster-number solutions (Hair et al. 2006). Firstly,
hierarchical clustering was conducted based on the five weighted average factor scores of
the Current dimension of the firm life-cycle. The agglomeration coefficient (calculated by
SPSS using Ward’s distance) starts increasing more rapidly after six clusters (9.96%),
five clusters (10.03%), four clusters (9.25%), three clusters (30.26%) and two clusters
(80.43%). This indicates that the seven-, six-, five-, four-, three- and two-cluster solutions
can be acceptable. The hierarchical clustering of the Initial firm life-cycle stage delivered
similar results. The agglomeration coefficient gradually increased after the six-cluster
solution (9.55%), five-cluster solution (15.05%), four-cluster solution (17.92%), three-
cluster solution (60.6%) and two-cluster solution (78.86%).
Hair et al. (2006) emphasise that two-cluster solutions usually seem relatively attractive
when observing the increase of the agglomeration coefficient. Theory supports the five-
cluster solution with reference to the life-cycle models consisting of five stages.
Discriminant analysis is applied to validate cluster solutions. The five-cluster solution has
a 97.2% predictive accuracy, for both the Current and 95.7% predictive accuracy for the
Initial firm life-cycle classification. This demonstrates that the five-cluster classification
is well applicable.
4.2.2. Firm life-cycle clustering
After using the hierarchical clustering method and discriminant analysis to determine the
applicability of the five-cluster solution, non-hierarchical clustering procedure was used
© 2011 RossiSmith Academic Publishing, JAES, Vol VII, Iss 2, December 2011, Refereed Edition, Page:
33
to identify cluster-membership of the cases. The Current firm life-cycle dimension
clustering solution displays one cluster with very low membership (only 2 members). In
the Initial firm life-cycle five-cluster solution, the distribution of cluster memberships
displays a much more even pattern. For the sake of comparability, the analysis of the five-
cluster solution is further explored for both Current and Initial dimensions.
After investigating the firm life-cycle dimensions for the Current firm life-cycle
classification, the different clusters can be classified into firm life-cycle stages. The
original model of Lester et al. (2003) suggested 5 stages: Existence, Survival, Success,
Renewal and Decline. After comparing the results with the firm age and growth indicators,
as well as the firm size categories, the firm life-cycle stages were identified. The Current
existence cluster contains relatively small and young firms, with a low perceived growth
rate. Firms in the Current survival cluster are of similar age but somewhat larger, and
show more perceived growth. The Current success stage consists of somewhat older,
medium sized firms, displaying some growth. Companies in the renewal 1 stage are
substantially older and larger than the others, showing promising signs of growth. The
renewal 2 cluster only consists of two older firms, which display moderate growth and
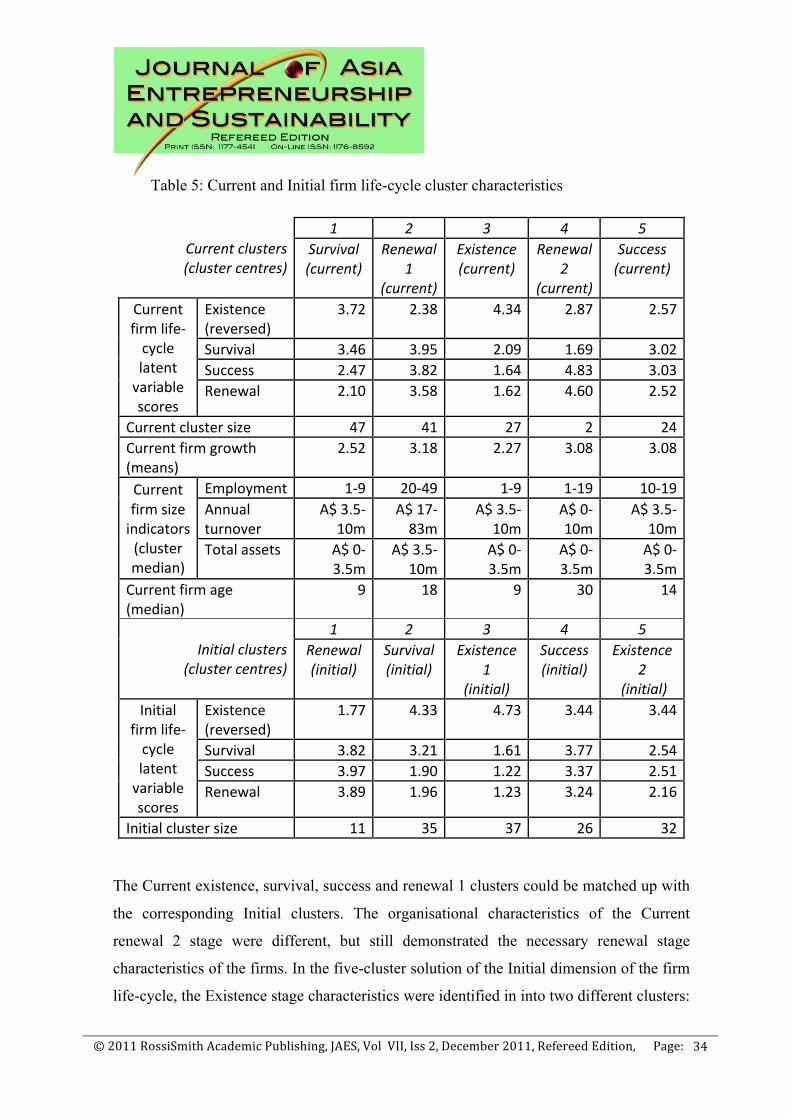
small size, particularly in terms of total assets. Table 5 summarises the cluster
characteristics.
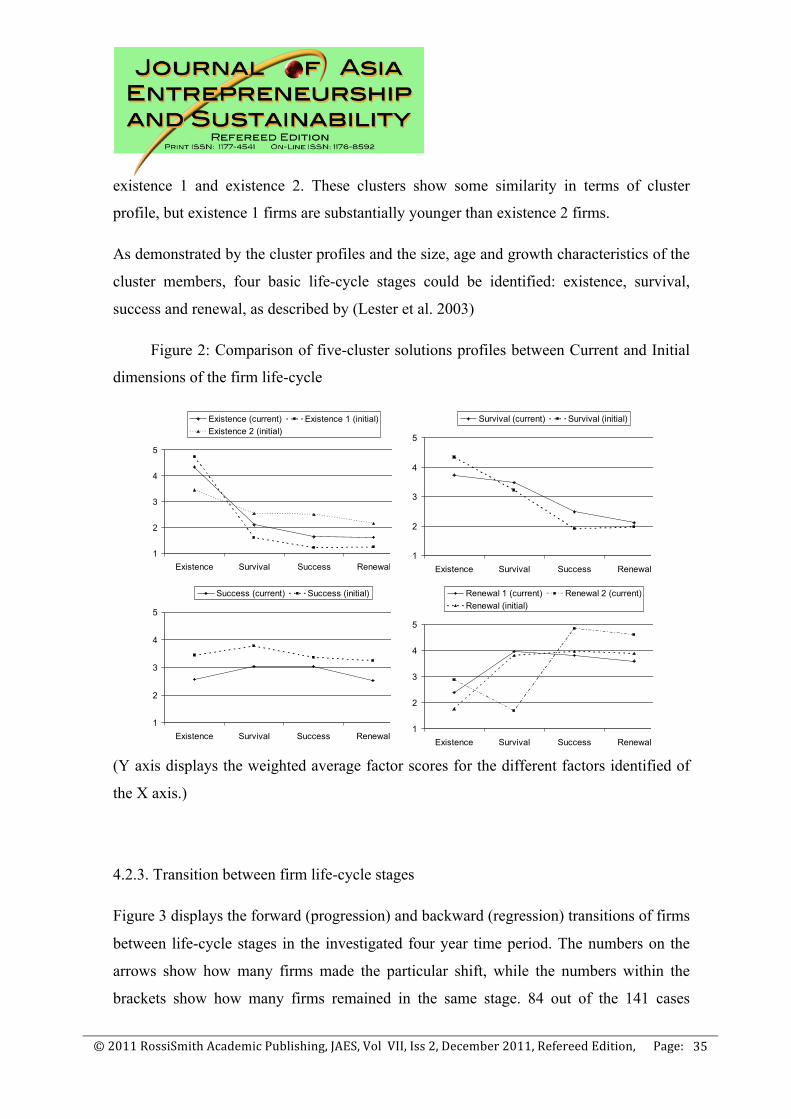
In order to identify the Initial life-cycle stages, the cluster profile characteristics were
compared to the Current firm life-cycle cluster characteristics. Figure 2 displays the
similar cluster-profiles. Firms were assigned to a particular cluster – as discussed above –
based on the weighted average factor scores both according to the Current and Initial
dimensions of the firm life-cycle. In order to identify, which Initial cluster corresponds to
which Current cluster, the cluster profiles are matched up based on the similarity of their
weighted average factor scores. Every life-cycle cluster contains respondents scoring high
– in comparison to other clusters – on the corresponding life-cycle stage specific factor. In
order to match up Initial and Current life-cycle clusters, matching organisational
characteristics profiles were sought between the clusters using these factor scores.
© 2011 RossiSmith Academic Publishing, JAES, Vol VII, Iss 2, December 2011, Refereed Edition, Page:
34
Table 5: Current and Initial firm life-cycle cluster characteristics
Current clusters (cluster centres)
1 2 3 4 5 Survival (current)
Renewal 1
(current)
Existence (current)
Renewal 2
(current)
Success (current)
Current firm life-‐cycle latent variable scores
Existence (reversed)
3.72 2.38 4.34 2.87 2.57
Survival 3.46 3.95 2.09 1.69 3.02 Success 2.47 3.82 1.64 4.83 3.03 Renewal 2.10 3.58 1.62 4.60 2.52
Current cluster size 47 41 27 2 24 Current firm growth (means)
2.52 3.18 2.27 3.08 3.08
Current firm size indicators (cluster median)
Employment 1-‐9 20-‐49 1-‐9 1-‐19 10-‐19 Annual turnover
A$ 3.5-‐ 10m
A$ 17-‐ 83m
A$ 3.5-‐ 10m
A$ 0-‐ 10m
A$ 3.5-‐ 10m
Total assets A$ 0-‐ 3.5m
A$ 3.5-‐ 10m
A$ 0-‐ 3.5m
A$ 0-‐ 3.5m
A$ 0-‐ 3.5m
Current firm age (median)
9 18 9 30 14
Initial clusters (cluster centres)
1 2 3 4 5 Renewal (initial)
Survival (initial)
Existence 1
(initial)
Success (initial)
Existence 2
(initial) Initial
firm life-‐cycle latent variable scores
Existence (reversed)
1.77 4.33 4.73 3.44 3.44
Survival 3.82 3.21 1.61 3.77 2.54 Success 3.97 1.90 1.22 3.37 2.51 Renewal 3.89 1.96 1.23 3.24 2.16
Initial cluster size 11 35 37 26 32 The Current existence, survival, success and renewal 1 clusters could be matched up with
the corresponding Initial clusters. The organisational characteristics of the Current
renewal 2 stage were different, but still demonstrated the necessary renewal stage
characteristics of the firms. In the five-cluster solution of the Initial dimension of the firm
life-cycle, the Existence stage characteristics were identified in into two different clusters:
© 2011 RossiSmith Academic Publishing, JAES, Vol VII, Iss 2, December 2011, Refereed Edition, Page:
35
existence 1 and existence 2. These clusters show some similarity in terms of cluster
profile, but existence 1 firms are substantially younger than existence 2 firms.
As demonstrated by the cluster profiles and the size, age and growth characteristics of the
cluster members, four basic life-cycle stages could be identified: existence, survival,
success and renewal, as described by (Lester et al. 2003)
Figure 2: Comparison of five-cluster solutions profiles between Current and Initial
dimensions of the firm life-cycle
1
2
3
4
5
Existence Survival Success Renewal
Existence (current) Existence 1 (initial)Existence 2 (initial)
1
2
3
4
5
Existence Survival Success Renewal
Survival (current) Survival (initial)
1
2
3
4
5
Existence Survival Success Renewal
Success (current) Success (initial)
1
2
3
4
5
Existence Survival Success Renewal
Renewal 1 (current) Renewal 2 (current)Renewal (initial)
(Y axis displays the weighted average factor scores for the different factors identified of
the X axis.)
4.2.3. Transition between firm life-cycle stages
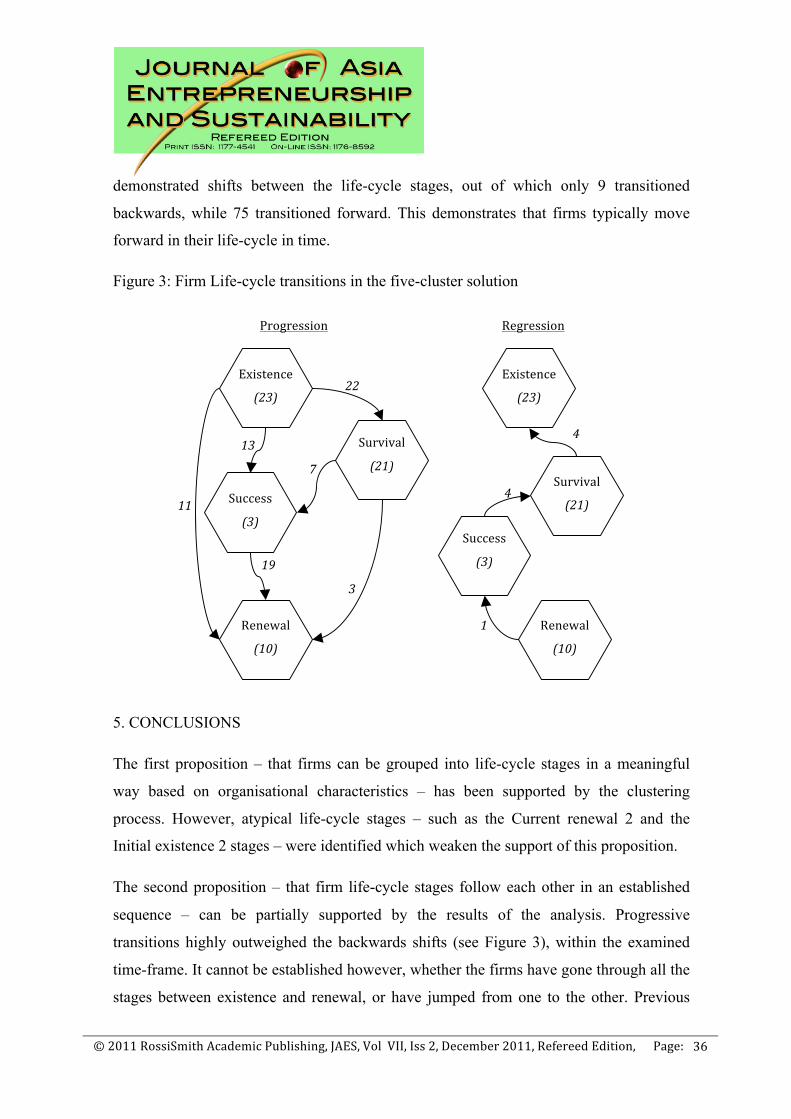
Figure 3 displays the forward (progression) and backward (regression) transitions of firms
between life-cycle stages in the investigated four year time period. The numbers on the
arrows show how many firms made the particular shift, while the numbers within the
brackets show how many firms remained in the same stage. 84 out of the 141 cases
© 2011 RossiSmith Academic Publishing, JAES, Vol VII, Iss 2, December 2011, Refereed Edition, Page:
36
demonstrated shifts between the life-cycle stages, out of which only 9 transitioned
backwards, while 75 transitioned forward. This demonstrates that firms typically move
forward in their life-cycle in time.
Figure 3: Firm Life-cycle transitions in the five-cluster solution
5. CONCLUSIONS
The first proposition – that firms can be grouped into life-cycle stages in a meaningful
way based on organisational characteristics – has been supported by the clustering
process. However, atypical life-cycle stages – such as the Current renewal 2 and the
Initial existence 2 stages – were identified which weaken the support of this proposition.
The second proposition – that firm life-cycle stages follow each other in an established
sequence – can be partially supported by the results of the analysis. Progressive
transitions highly outweighed the backwards shifts (see Figure 3), within the examined
time-frame. It cannot be established however, whether the firms have gone through all the
stages between existence and renewal, or have jumped from one to the other. Previous
Existence
(23)
Survival
(21)
Success
(3)
13
Progression
Renewal
(10)
Existence
(23)
Success
(3)
Survival
(21)
4
Renewal
(10)
11
19
7
3
22
Regression
4
1
© 2011 RossiSmith Academic Publishing, JAES, Vol VII, Iss 2, December 2011, Refereed Edition, Page:
37
investigations on Australian (McMahon 2001) and US (Hanks et al. 1993) SMEs indicate,
that the examined time-frame of 4 years should not allow more than one stage-shift in an
average case. This suggests that even though stages can be assumed to mostly follow each
other in a pre-determined sequence, probably not all firms progress through all stages to
get to one from the other.
The third proposition – that SMEs typically do not fall into the final (decline) stage of the
life-cycle – gained limited support from the analysis described above, as the decline
construct was excluded from the clustering due to the lack of the validity of its measures.
However the fact that measures of the decline stage have not been proven to be valid
suggests, that this decline stage can indeed not be identified, and thus is not there in the
life-cycle of SMEs. Another indication of the lack of a decline stage is the very low
amount of cases transitioning out of the decline stage in the investigated time period.
The fourth proposition – the existence of an idle stage in the firm life-cycle sequence –
can be supported, as 57 of the 141 cases have not shown progress in the life-cycle, with a
particularly high number of firms remaining in the existence (23) and survival (21) stages.
This finding suggests, that these firms were indeed in an idle stage, particularly as the
typical length of this stage exceeds the investigated four year time period, which is shorter
than what firms are supposed to spend in this stage of the life-cycle according to the
results of empirical investigation (Hanks et al. 1993; McMahon 2001).
6. LIMITATIONS AND FURTHER RESEARCH
Altogether it can be concluded, that the propositions on the investigated features of the
firm life-cycle model could be supported, although some limitations needed to be
highlighted. Further, longitudinal investigation would be required to assess the transition
process of firms between life-cycle stages to address the ambiguity of the results
regarding the second proposition. Regarding the third proposition – the lack of a decline
stage in SME life-cycle – further investigation could be conclusive in terms of
establishing the results, which allows sampling firms that have actually gone out of
© 2011 RossiSmith Academic Publishing, JAES, Vol VII, Iss 2, December 2011, Refereed Edition, Page:
38
business, as it can be assumed, that the decline stage in the life of an SME is very short
due to the lack of capital funding unprofitable operations.
An important aspect of the operationalisation of the investigation is, that dynamics
(transitions between life-cycle stages) are being estimated based on static (cross-
sectional) observation. In other words, if one observes the Sun over the equator every 24
hours, one would find it to be still, while observation every 25 hours for instance would
allow the conclusion, that it is moving backwards. The elimination of such a bias in
investigating life-cycle progression can only be eliminated using detailed longitudinal
data. This highlights a serious limitation of the current study. Whether the four year
retrospective time period was appropriate for the investigation, it is hard to tell. Prior
empirical evidence – as shown in the review – indicated that even the shortest life-cycle
stage is, on average, longer than four years (Hanks et al. 1993; McMahon 2001). As the
time-frame of investigation has been specifically chosen for this reason, this limitation
has been addressed to the possible level in this investigation.
It has been noted, that the validation of the measurement model was weakened by strong
cross-loadings of the indicators between the life-cycle specific factors. This allows the
identification of a further limitation of the research, namely, the shortcomings of the
measurement model validation process. The clustering using the weighted average scores
of the non-orthogonal life-cycle specific factors results in potentially overlapping cluster
membership of the firms. In other words, classification into life-cycle stages simplifies
the fact that firms continuously transition between these stages, and display lower, but
still notable organisational characteristics of other life-cycle stages. This could be one of
the reasons, that the decline stage factor was not validated, and identified in the clustering
process. This also may have resulted in inaccurate classification of the respondents into
life-cycle stages to a small extent. This ambiguity calls for the re-thinking of the
measurement model, to achieve stronger validation.
Further research in the topic needs to explore the existence of a decline stage, to clarify
the reason why it was not identifiable. One possibility seems to be, that SMEs exit
quickly, and thus surveying firms in this stage using a cross-sectional approach is
© 2011 RossiSmith Academic Publishing, JAES, Vol VII, Iss 2, December 2011, Refereed Edition, Page:
39
virtually impossible. Another possibility is, that instead of moving on to a decline stage,
SMEs only revert into a previous, stagnant or idle developmental stage. It is also possible,
that this measurement tool – using organisational characteristics to classify respondents
into life-cycle stages – is not able to identify decline-configurations in SMEs. Either way,
this extension of the investigation probably requires a longitudinal, qualitative approach
to explore the problem further.
7. REFERENCES Australian Bureau of Statistics (ABS) 2007, Counts of Australian businesses, including
entries and exits, cat. no. 8165.0, viewed 20 June 2010, http://www.ausstats.abs.gov.au/Ausstats/ subscriber.nsf/0/9B0A351B45344F5FCA2573B0000DA81D/$File/81650_jun%202003%20to%20jun%202007.pdf
Adizes, I 1979, 'Organizational Passages - Diagnosing and Treating Lifecycle Problems of Organizations', Organizational Dynamics, vol. 8, no. Summer, pp. 3 - 25.
Belak, J, Duh, M & Belak, J 2006, 'The MER Model of Enterprise Development: Research Cognitions for its Creation,' International Conference on Management, Enterprise and Benchmarking, Óbudai Egyetem, Keleti Károly Gazdasági Kar.
Chin, WW 1998, 'The Partial Least Squares Approach to Structural Equation Modelling', in Marcoulides, GA (ed) Modern Methods for Business Research, Lawrence Erlbaum Associates, London, pp. 295 - 336.
Chin, WW 2010, 'How to Write up and Report PLS Analyses', in Esposito Vinzi, V, Chin, WW, Henseler, J and Wang, H (eds), Handbook of Partial Least Squares. Concepts, Methods and Applications, Springer-Verlag, Berlin, pp. 655-690.
Chin, WW & Newsted, PR 1999, 'Structural Equation Modelling Analysis With Small Samples Using Partial Least Squares', in Hoyle, RH (ed) Statistical Strategies for Small Sample Research, SAGE Publications, London, pp. 307 - 341.
Churchill, NC & Lewis, VL 1983, 'The five stages of small business growth', Harvard Business Review, vol. 61, no., May - June, pp. 30 - 50.
Cronbach, L 1951, 'Coefficient alpha and the internal structure of tests', Psychometrika, vol. 16, no. 3, pp. 297-334.
Dillon, WR & Goldstein, M 1984, Multivariate Analysis: Methods and Applications, Wiley, New York.
Edmondson, AC & McManus, SE 2007, 'Methodological Fit in Management Field Research', Academy of Management Review, vol. 32, no. 4, pp. 1155-1179.
Efron, B & Tibshirani, RJ 1998, An Introduction to the Bootstrap, CRC Press LLC, Boca Raton, Florida.
Fitzsimmons, JR, Steffens, PR & Douglas, EJ 2005, 'Growth and Profitability in Small and Medium Sized Australian Firms' AGSE Entrepreneurship exchange, Melbourne, AGSE Swinburne University of Technology pp. 164 - 178.
© 2011 RossiSmith Academic Publishing, JAES, Vol VII, Iss 2, December 2011, Refereed Edition, Page:
40
Geoscience Australia 2005, Commonwealth of Australia, Canberra, Attribution-Share Alike 2.5 Generic license.
Greiner, LE 1972, 'Evolution and revolution as organizations grow', Harvard Business Review, vol. 50, no. 4, July - August 1972, pp. 37 - 46.
Götz, O, Liehr-Gobbers, K & Kraft, M 2010, 'Evaluation of Structural Equation Models Using Partial Least Squares (PLS) Approach', in V Esposito Vinzi, WW Chin, J Henseler and H Wang (eds), Handbook of Partial Least Squares. Concepts, Methods and Applications, Springer-Verlag, Berlin, pp. 691-712.
Guadagnoli, E & Velicer, WF 1988, 'Relation to sample size to the stability of component patterns', Psychological Bulletin, vol. 103, no. 2, pp. 265-275.
Hair, JF, Black, WC, Babin, BJ, Anderson, RE & Tatham, RL 2006, Multivariate Data Analysis, 6th edn., Pearson Education International, Upper Saddle River, New Jersey.
Hanks, SH, Watson, CJ, Jansen, E & Chandler, GN 1993, 'Tightening the life cycle construct: A taxonomic study of growth stage configurations in high technology organizations', Entrepreneurship Theory and Practice, vol. 18, no. 2, Winter, pp. 5 - 29.
Henseler, J, Ringle, CM & Sinkovics, RR 2009, 'The use of partial least squares path modeling in international marketing', Advances in International Marketing, vol. 20, no. 2009, pp. p. 277-319.
Kazanjian, RK & Drazin, R 1989, 'An Empirical Test of a Stage of Growth Progression Model', Management Science, vol. 35, no. 12, pp. 1489-1503.
Kimberly, JR 1979, 'Issues in the Creation of Organizations: Initiation, Innovation, and Institutionalization', Academy of Management Journal, vol. 22, no. 3, pp. 437-457.
Lester, DL, Parnell, JA & Carraher, S 2003, 'Organizaitonal life cycle: a five-stage empirical scale', International Journal of Organizational Analysis (2003), vol. 11, no. 4, pp. 339-354.
Levie, J & Lichtenstein, BB 2010, 'A Terminal Assessment of Stages Theory: Introducing a Dynamic States Approach to Entrepreneurship', Entrepreneurship Theory and Practice, vol. 34, no. 2, pp. 317-350.
Lippitt, GL & Schmidt, WH 1967, 'Crises in a developing organization', Harvard Business Review, vol. 45, no. 6, pp. 102 - 112.
Lyden, FJ 1975, 'Using Parsons' Functional Analysis in the Study of Public Organizations', Administrative Science Quarterly, vol. 20, no. 1, p. 59.
Lynall, MD, Golden, BR & Hillman, AJ 2003, 'Board Composition from Adolescence to Maturity: A Multitheoretic View', Academy of Management Review, vol. 28, no. 3, pp. 416-431.
Massey, C, Lewis, K, Warriner, V, Harris, C, Tweed, D, Cheyene, J & Cameron, A 2006, 'Exploring firm development in the context of New Zealand SMEs', Small Enterprise Research: The Journal of SEAANZ, vol. 14, no. 1, pp. 1 - 13.
McMahon, RGP 1998, 'Stage models of SME growth reconsidered', Small Enterprise Research: The Journal of SEAANZ, vol. 6, no. 2, 1998
McMahon, RGP 2001, 'Deriving an Empirical Development Taxonomy for Manufacturing SMEs using data from Australia's Business Longitudinal Survey', Small Business Economics, vol. 17, no., 2001, pp. 197 - 212.
Miller, D & Friesen, PH 1984, 'A longitudinal study of the corporate life cycle', Management Science, vol. 30, no. 10, pp. 1161-1183.
© 2011 RossiSmith Academic Publishing, JAES, Vol VII, Iss 2, December 2011, Refereed Edition, Page:
41
O'Farrell, PN & Hitchens, DMWN 1988, 'Alternative theories of small firm growth: a critical review', Environment and Planning A, vol. 20, no. 10, 1988, pp. 1365 - 1383.
Penrose, E 1952, 'Biological analogies in the theory of the firm', American Economic Review, vol. 42, no. 4, December 1952 pp. 804 - 819.
Perényi, Á, Selvarajah, C & Muthaly, S 2008, 'The Stage Model of Firm Development: A Conceptualization of SME Growth' Regional Frontiers of Entrepreneurship Research 2008, Gillin, M, Melbourne, AGSE, Swinburne University of Technology 23 - 36.
Rink, DR & Swan, JE 1979, 'Product life cycle research: A literature review', Journal of Business Research, vol. 7, no. 3, September 1979, pp. 219 – 242.
Quinn, RE & Cameron, K 1983, 'Organizational life cycles and shifting criteria of effectiveness: some preliminary evidence', Management Science, vol. 29, no. 1, 1 January 1983, pp. 33 - 51.
Ringle, CM, Wende, S & Will, S: SmartPLS 2.0 (M3) Beta, Hamburg 2005, http://www.smartpls.de.
Scott, M & Bruce, R 1987, 'Five stages of growth in small business', Long Range Planning, vol. 20, no. 3, pp. 45-52.
Smith, KG, Mitchell, TR & Summer, CE 1985, 'Top level management priorities in different stages of the organizational life cycle', Academy of Management Journal, vol. 28, no. 4, pp. 799-820.
Steffens, PR, Fitzsimmons, JR & Davidsson, P 2006, 'Small firm performance: patterns of evolution in growth - profitability space' Regional Frontiers of Entrepreneurship, Gillin, LM, Auckland, Swinburne University of Technology pp. 635 - 661.
Steinmetz, LL 1969, 'Critical Stages of Small Business Growth', Business Horizons, vol. 12, no. 1, p. 29.
Tenenhaus, M, Vinzi, VE, Chatelin, Y-M & Lauro, C 2005, 'PLS path modeling', Computational Statistics & Data Analysis, vol. 48, no. 1, pp. 159-205.
Wetzels, M, Odekerken-Schroeder, G & van Oppen, C 2009, 'Using PLS Path Modelling for Assessing Hierarchical Construct Models: Guidelines and Empirical Illustration', MIS Quarterly, vol. 33, pp. 177-195.
Wilson, B & Henseler, J 2007, 'Modeling Reflective Higher-Order Constructs using Three Approaches with PLS Path Modeling: A Monte Carlo Comparison' Australian and New Zealand Marketing Academy Conference, Thyne, M, Deans, K.R., Gnoth, J., Otago, NZ, 3rd–5th December, Department of Marketing, School of Business, University of Otago 791-800.
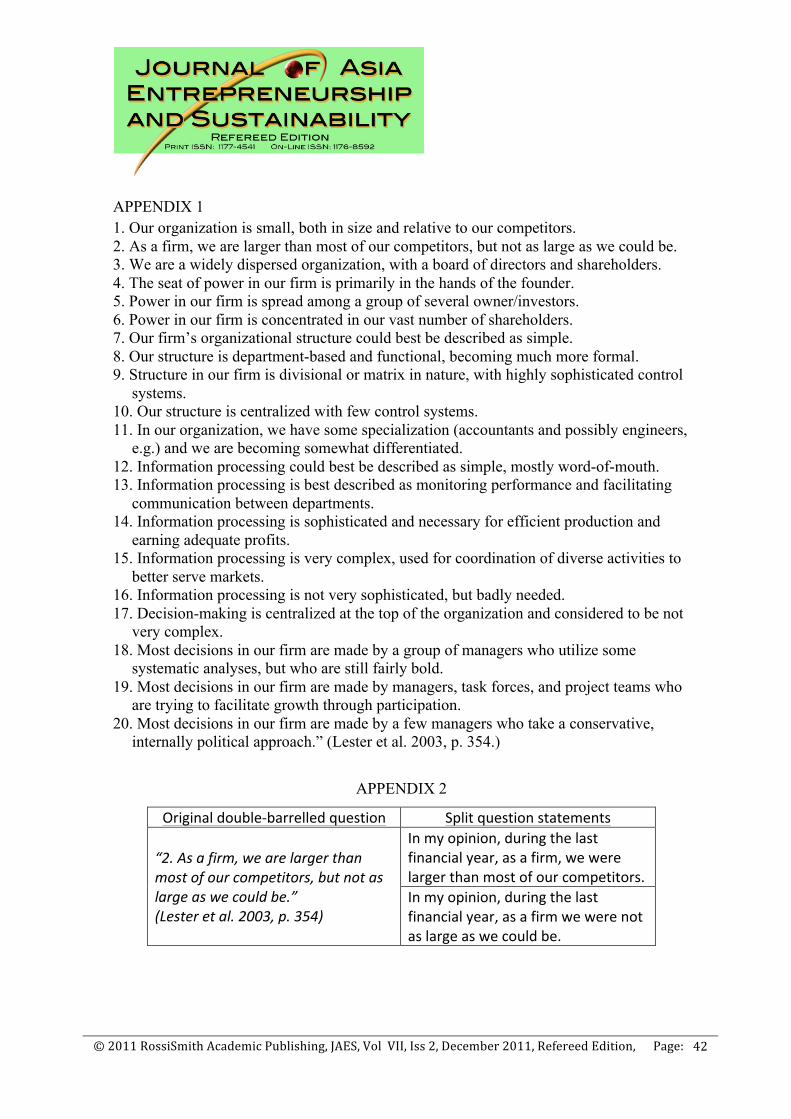
© 2011 RossiSmith Academic Publishing, JAES, Vol VII, Iss 2, December 2011, Refereed Edition, Page:
42
APPENDIX 1 1. Our organization is small, both in size and relative to our competitors. 2. As a firm, we are larger than most of our competitors, but not as large as we could be. 3. We are a widely dispersed organization, with a board of directors and shareholders. 4. The seat of power in our firm is primarily in the hands of the founder. 5. Power in our firm is spread among a group of several owner/investors. 6. Power in our firm is concentrated in our vast number of shareholders. 7. Our firm’s organizational structure could best be described as simple. 8. Our structure is department-based and functional, becoming much more formal. 9. Structure in our firm is divisional or matrix in nature, with highly sophisticated control
systems. 10. Our structure is centralized with few control systems. 11. In our organization, we have some specialization (accountants and possibly engineers,
e.g.) and we are becoming somewhat differentiated. 12. Information processing could best be described as simple, mostly word-of-mouth. 13. Information processing is best described as monitoring performance and facilitating
communication between departments. 14. Information processing is sophisticated and necessary for efficient production and
earning adequate profits. 15. Information processing is very complex, used for coordination of diverse activities to
better serve markets. 16. Information processing is not very sophisticated, but badly needed. 17. Decision-making is centralized at the top of the organization and considered to be not
very complex. 18. Most decisions in our firm are made by a group of managers who utilize some
systematic analyses, but who are still fairly bold. 19. Most decisions in our firm are made by managers, task forces, and project teams who
are trying to facilitate growth through participation. 20. Most decisions in our firm are made by a few managers who take a conservative,
internally political approach.” (Lester et al. 2003, p. 354.)
APPENDIX 2
Original double-‐barrelled question Split question statements
“2. As a firm, we are larger than most of our competitors, but not as large as we could be.” (Lester et al. 2003, p. 354)
In my opinion, during the last financial year, as a firm, we were larger than most of our competitors. In my opinion, during the last financial year, as a firm we were not as large as we could be.
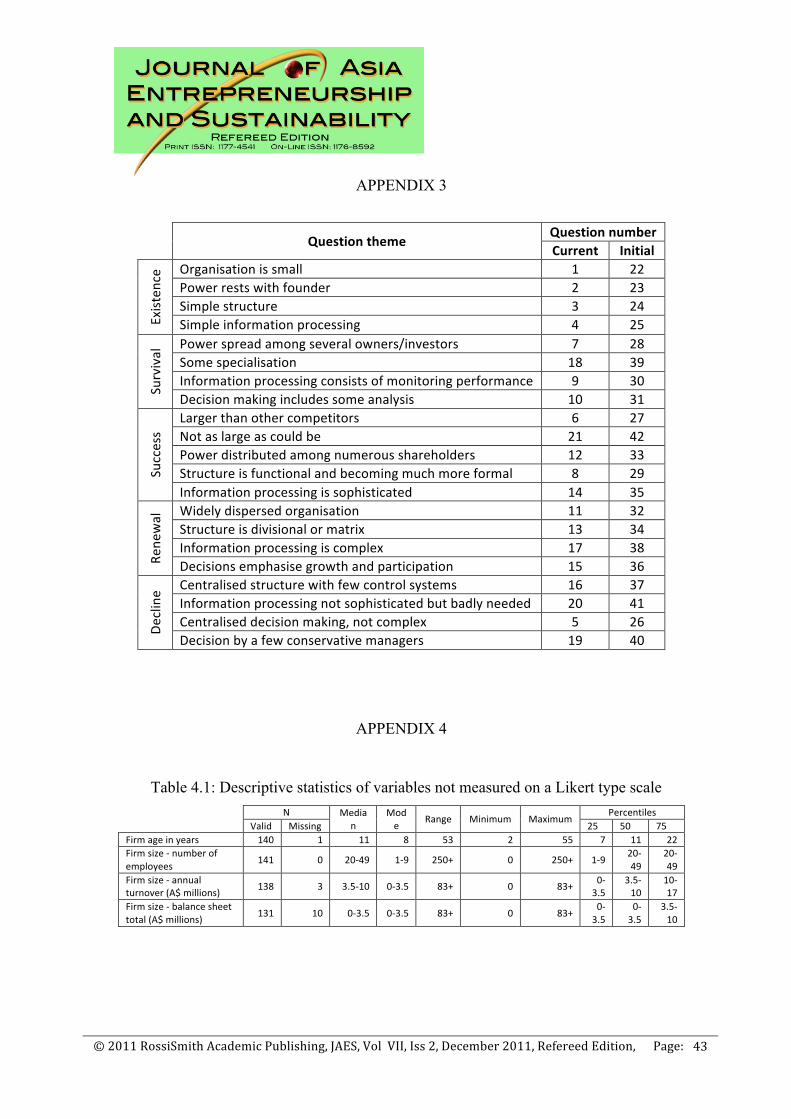
© 2011 RossiSmith Academic Publishing, JAES, Vol VII, Iss 2, December 2011, Refereed Edition, Page:
43
APPENDIX 3
Question theme Question number Current Initial
Existen
ce Organisation is small 1 22
Power rests with founder 2 23 Simple structure 3 24 Simple information processing 4 25
Survival Power spread among several owners/investors 7 28
Some specialisation 18 39 Information processing consists of monitoring performance 9 30 Decision making includes some analysis 10 31
Success
Larger than other competitors 6 27 Not as large as could be 21 42 Power distributed among numerous shareholders 12 33 Structure is functional and becoming much more formal 8 29 Information processing is sophisticated 14 35
Rene
wal Widely dispersed organisation 11 32
Structure is divisional or matrix 13 34 Information processing is complex 17 38 Decisions emphasise growth and participation 15 36
Decline Centralised structure with few control systems 16 37
Information processing not sophisticated but badly needed 20 41 Centralised decision making, not complex 5 26 Decision by a few conservative managers 19 40
APPENDIX 4
Table 4.1: Descriptive statistics of variables not measured on a Likert type scale N Media
n Mode Range Minimum Maximum Percentiles
Valid Missing 25 50 75 Firm age in years 140 1 11 8 53 2 55 7 11 22 Firm size -‐ number of employees 141 0 20-‐49 1-‐9 250+ 0 250+ 1-‐9 20-‐
49 20-‐49
Firm size -‐ annual turnover (A$ millions) 138 3 3.5-‐10 0-‐3.5 83+ 0 83+ 0-‐
3.5 3.5-‐10
10-‐17
Firm size -‐ balance sheet total (A$ millions) 131 10 0-‐3.5 0-‐3.5 83+ 0 83+ 0-‐
3.5 0-‐3.5
3.5-‐10
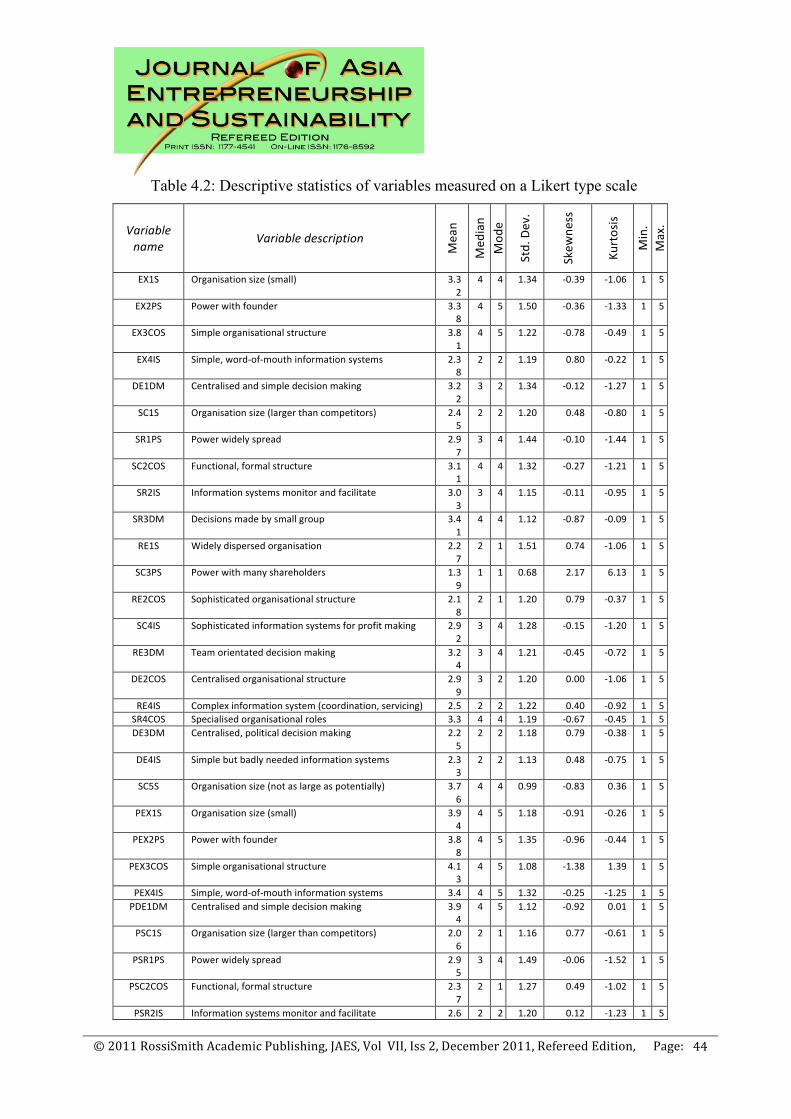
© 2011 RossiSmith Academic Publishing, JAES, Vol VII, Iss 2, December 2011, Refereed Edition, Page:
44
Table 4.2: Descriptive statistics of variables measured on a Likert type scale
Variable name Variable description
Mean
Med
ian
Mod
e
Std. Dev.
Skew
ness
Kurtosis
Min.
Max.
EX1S Organisation size (small) 3.32
4 4 1.34 -‐0.39 -‐1.06 1 5
EX2PS Power with founder 3.38
4 5 1.50 -‐0.36 -‐1.33 1 5
EX3COS Simple organisational structure 3.81
4 5 1.22 -‐0.78 -‐0.49 1 5
EX4IS Simple, word-‐of-‐mouth information systems 2.38
2 2 1.19 0.80 -‐0.22 1 5
DE1DM Centralised and simple decision making 3.22
3 2 1.34 -‐0.12 -‐1.27 1 5
SC1S Organisation size (larger than competitors) 2.45
2 2 1.20 0.48 -‐0.80 1 5
SR1PS Power widely spread 2.97
3 4 1.44 -‐0.10 -‐1.44 1 5
SC2COS Functional, formal structure 3.11
4 4 1.32 -‐0.27 -‐1.21 1 5
SR2IS Information systems monitor and facilitate 3.03
3 4 1.15 -‐0.11 -‐0.95 1 5
SR3DM Decisions made by small group 3.41
4 4 1.12 -‐0.87 -‐0.09 1 5
RE1S Widely dispersed organisation 2.27
2 1 1.51 0.74 -‐1.06 1 5
SC3PS Power with many shareholders 1.39
1 1 0.68 2.17 6.13 1 5
RE2COS Sophisticated organisational structure 2.18
2 1 1.20 0.79 -‐0.37 1 5
SC4IS Sophisticated information systems for profit making 2.92
3 4 1.28 -‐0.15 -‐1.20 1 5
RE3DM Team orientated decision making 3.24
3 4 1.21 -‐0.45 -‐0.72 1 5
DE2COS Centralised organisational structure 2.99
3 2 1.20 0.00 -‐1.06 1 5
RE4IS Complex information system (coordination, servicing) 2.5 2 2 1.22 0.40 -‐0.92 1 5 SR4COS Specialised organisational roles 3.3 4 4 1.19 -‐0.67 -‐0.45 1 5 DE3DM Centralised, political decision making 2.2
5 2 2 1.18 0.79 -‐0.38 1 5
DE4IS Simple but badly needed information systems 2.33
2 2 1.13 0.48 -‐0.75 1 5
SC5S Organisation size (not as large as potentially) 3.76
4 4 0.99 -‐0.83 0.36 1 5
PEX1S Organisation size (small) 3.94
4 5 1.18 -‐0.91 -‐0.26 1 5
PEX2PS Power with founder 3.88
4 5 1.35 -‐0.96 -‐0.44 1 5
PEX3COS Simple organisational structure 4.13
4 5 1.08 -‐1.38 1.39 1 5
PEX4IS Simple, word-‐of-‐mouth information systems 3.4 4 5 1.32 -‐0.25 -‐1.25 1 5 PDE1DM Centralised and simple decision making 3.9
4 4 5 1.12 -‐0.92 0.01 1 5
PSC1S Organisation size (larger than competitors) 2.06
2 1 1.16 0.77 -‐0.61 1 5
PSR1PS Power widely spread 2.95
3 4 1.49 -‐0.06 -‐1.52 1 5
PSC2COS Functional, formal structure 2.37
2 1 1.27 0.49 -‐1.02 1 5
PSR2IS Information systems monitor and facilitate 2.6 2 2 1.20 0.12 -‐1.23 1 5

© 2011 RossiSmith Academic Publishing, JAES, Vol VII, Iss 2, December 2011, Refereed Edition, Page:
45
3 PSR3DM Decisions made by small group 2.9
8 3 4 1.29 -‐0.24 -‐1.23 1 5
PRE1S Widely dispersed organisation 1.9 1 1 1.24 1.30 0.50 1 5 PSC3PS Power with many shareholders 1.5 1 1 0.91 2.63 7.46 1 5 PRE2COS Sophisticated organisational structure 1.9
5 2 1 1.12 1.10 0.38 1 5
PSC4IS Sophisticated information systems for profit making 2.45
2 1 1.28 0.29 -‐1.34 1 5
PRE3DM Team orientated decision making 2.77
3 4 1.30 0.01 -‐1.32 1 5
PDE2COS Centralised organisational structure 3.42
4 4 1.28 -‐0.46 -‐0.98 1 5
PRE4IS Complex information system (coordination, servicing) 2.25
2 1 1.19 0.49 -‐1.03 1 5
PSR4COS Specialised organisational roles 2.76
3 4 1.25 -‐0.15 -‐1.35 1 5
PDE3DM Centralised, political decision making 2.44
2 1 1.30 0.44 -‐1.14 1 5
PDE4IS Simple but badly needed information systems 2.84
3 4 1.29 0.01 -‐1.24 1 5
PSC5S Organisation size (not as large as potentially) 4 4 4 1.05 -‐1.06 0.55 1 5 FTEGO1 Slow employment growth 2.7
7 3 4 1.18 -‐0.01 -‐1.07 1 5
FTEGO2 Employment growth faster than competition 2.96
3 3 1.13 -‐0.36 -‐0.74 1 5
FTEGO3 Employment growth below potential 3.12
3 4 1.13 -‐0.24 -‐0.78 1 5
FTEGO4 Very fast employment growth 2.13
2 1 1.19 0.85 -‐0.35 1 5
ATGO1 Slow turnover growth 2.84
3 2 1.19 0.09 -‐1.10 1 5
ATGO2 Turnover growth faster than competition 3.07
3 3 1.07 -‐0.29 -‐0.57 1 5
ATGO3 Turnover growth below potential 3.72
4 4 0.91 -‐0.89 0.68 1 5
ATGO4 Very fast turnover growth 2.41
2 2 1.26 0.53 -‐0.89 1 5
TVAGO1 Slow asset growth 3.04
3 3 1.10 -‐0.22 -‐0.67 1 5
TVAGO2 Asset growth faster than competition 2.98
3 3 1.00 -‐0.47 -‐0.31 1 5
TVAGO3 Asset growth below potential 3.6 4 4 0.92 -‐0.74 0.24 1 5 TVAGO4 Very fast asset growth 2.3
8 2 2 1.16 0.46 -‐0.69 1 5
N=141

© 2011 RossiSmith Academic Publishing, JAES, Vol VII, Iss 2, December 2011, Refereed Edition, Page:
46

© 2011 RossiSmith Academic Publishing, JAES, Vol VII, Iss 2, December 2011, Refereed Edition, Page:
47

© 2011 RossiSmith Academic Publishing, JAES, Vol VII, Iss 2, December 2011, Refereed Edition, Page:
48
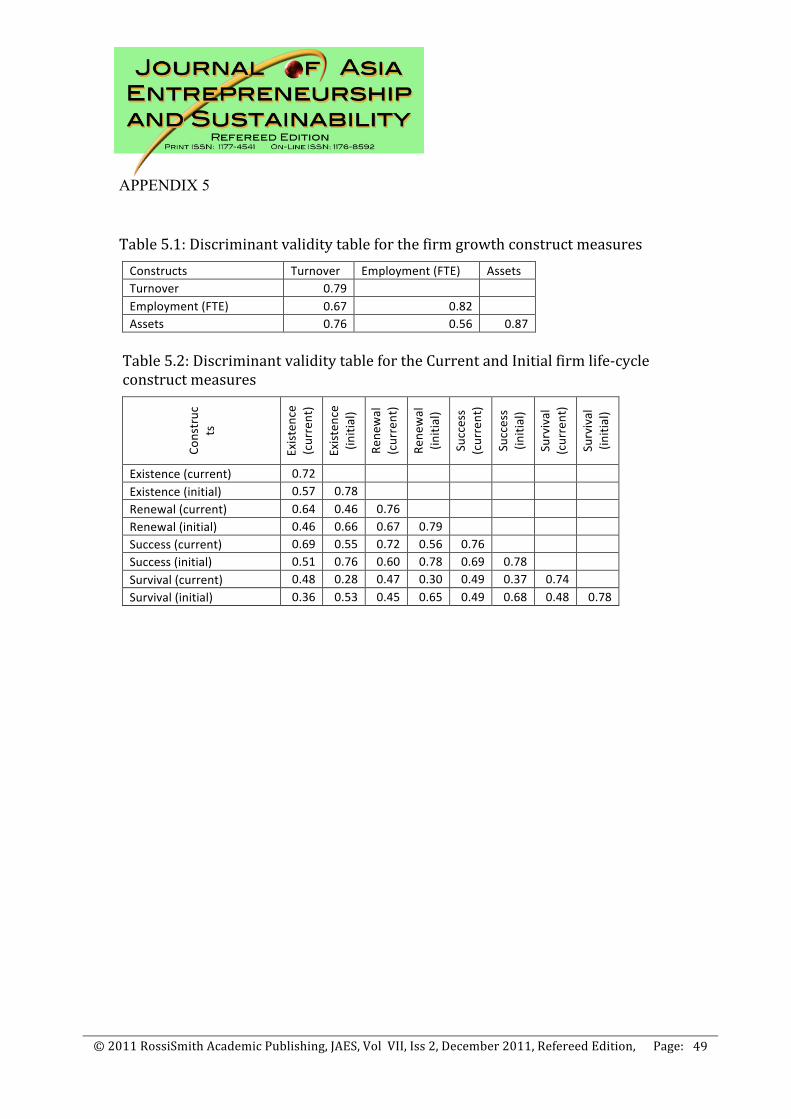
© 2011 RossiSmith Academic Publishing, JAES, Vol VII, Iss 2, December 2011, Refereed Edition, Page:
49
APPENDIX 5 Table 5.1: Discriminant validity table for the firm growth construct measures Constructs Turnover Employment (FTE) Assets Turnover 0.79 Employment (FTE) 0.67 0.82 Assets 0.76 0.56 0.87 Table 5.2: Discriminant validity table for the Current and Initial firm life-‐cycle construct measures
Construc
ts
Existen
ce
(current)
Existen
ce
(initial)
Rene
wal
(current)
Rene
wal
(initial)
Success
(current)
Success
(initial)
Survival
(current)
Survival
(initial)
Existence (current) 0.72 Existence (initial) 0.57 0.78 Renewal (current) 0.64 0.46 0.76 Renewal (initial) 0.46 0.66 0.67 0.79 Success (current) 0.69 0.55 0.72 0.56 0.76 Success (initial) 0.51 0.76 0.60 0.78 0.69 0.78 Survival (current) 0.48 0.28 0.47 0.30 0.49 0.37 0.74 Survival (initial) 0.36 0.53 0.45 0.65 0.49 0.68 0.48 0.78
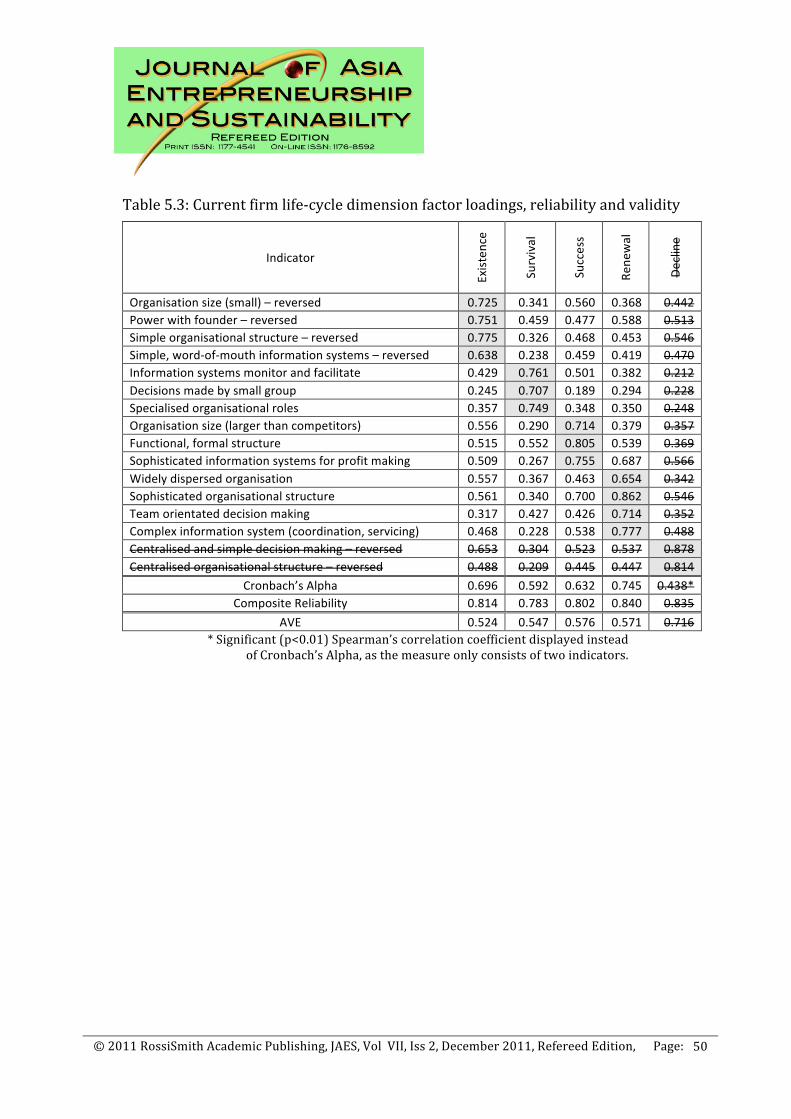
© 2011 RossiSmith Academic Publishing, JAES, Vol VII, Iss 2, December 2011, Refereed Edition, Page:
50
Table 5.3: Current firm life-‐cycle dimension factor loadings, reliability and validity
Indicator
Existen
ce
Survival
Success
Rene
wal
Decline
Organisation size (small) – reversed 0.725 0.341 0.560 0.368 0.442 Power with founder – reversed 0.751 0.459 0.477 0.588 0.513 Simple organisational structure – reversed 0.775 0.326 0.468 0.453 0.546 Simple, word-‐of-‐mouth information systems – reversed 0.638 0.238 0.459 0.419 0.470 Information systems monitor and facilitate 0.429 0.761 0.501 0.382 0.212 Decisions made by small group 0.245 0.707 0.189 0.294 0.228 Specialised organisational roles 0.357 0.749 0.348 0.350 0.248 Organisation size (larger than competitors) 0.556 0.290 0.714 0.379 0.357 Functional, formal structure 0.515 0.552 0.805 0.539 0.369 Sophisticated information systems for profit making 0.509 0.267 0.755 0.687 0.566 Widely dispersed organisation 0.557 0.367 0.463 0.654 0.342 Sophisticated organisational structure 0.561 0.340 0.700 0.862 0.546 Team orientated decision making 0.317 0.427 0.426 0.714 0.352 Complex information system (coordination, servicing) 0.468 0.228 0.538 0.777 0.488 Centralised and simple decision making – reversed 0.653 0.304 0.523 0.537 0.878 Centralised organisational structure – reversed 0.488 0.209 0.445 0.447 0.814
Cronbach’s Alpha 0.696 0.592 0.632 0.745 0.438* Composite Reliability 0.814 0.783 0.802 0.840 0.835
AVE 0.524 0.547 0.576 0.571 0.716 * Significant (p<0.01) Spearman’s correlation coefficient displayed instead
of Cronbach’s Alpha, as the measure only consists of two indicators.
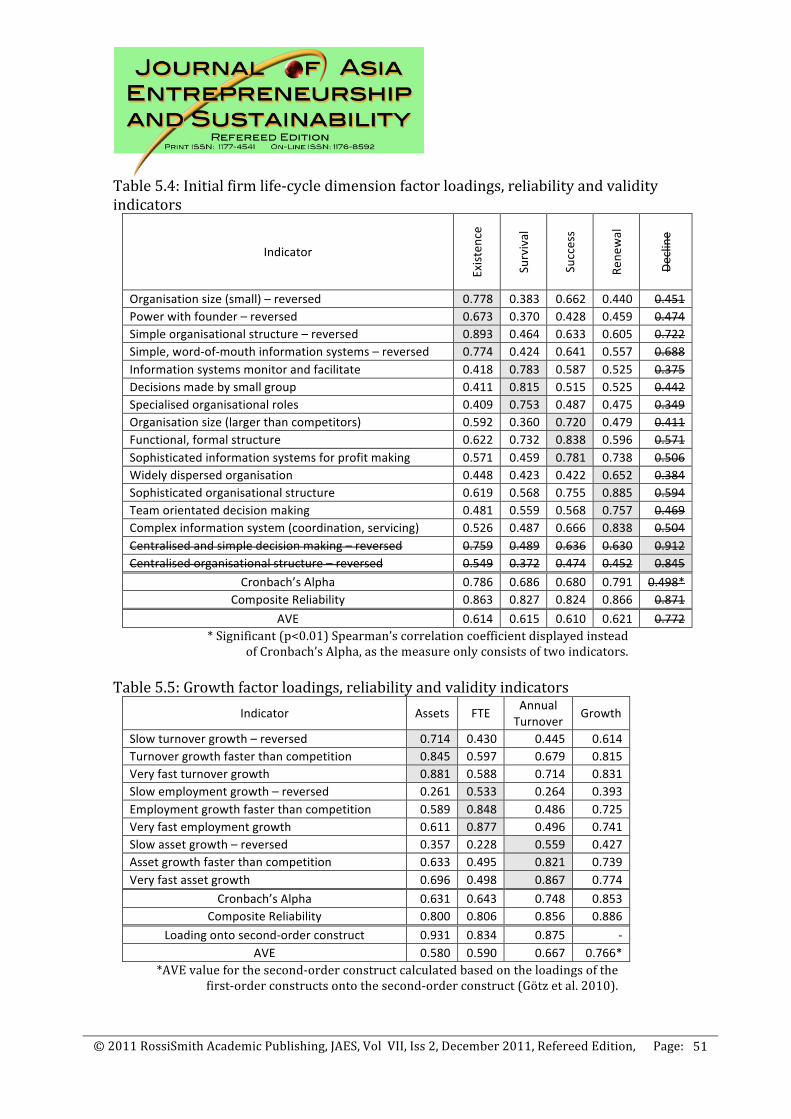
© 2011 RossiSmith Academic Publishing, JAES, Vol VII, Iss 2, December 2011, Refereed Edition, Page:
51
Table 5.4: Initial firm life-‐cycle dimension factor loadings, reliability and validity indicators
Indicator
Existen
ce
Survival
Success
Rene
wal
Decline
Organisation size (small) – reversed 0.778 0.383 0.662 0.440 0.451 Power with founder – reversed 0.673 0.370 0.428 0.459 0.474 Simple organisational structure – reversed 0.893 0.464 0.633 0.605 0.722 Simple, word-‐of-‐mouth information systems – reversed 0.774 0.424 0.641 0.557 0.688 Information systems monitor and facilitate 0.418 0.783 0.587 0.525 0.375 Decisions made by small group 0.411 0.815 0.515 0.525 0.442 Specialised organisational roles 0.409 0.753 0.487 0.475 0.349 Organisation size (larger than competitors) 0.592 0.360 0.720 0.479 0.411 Functional, formal structure 0.622 0.732 0.838 0.596 0.571 Sophisticated information systems for profit making 0.571 0.459 0.781 0.738 0.506 Widely dispersed organisation 0.448 0.423 0.422 0.652 0.384 Sophisticated organisational structure 0.619 0.568 0.755 0.885 0.594 Team orientated decision making 0.481 0.559 0.568 0.757 0.469 Complex information system (coordination, servicing) 0.526 0.487 0.666 0.838 0.504 Centralised and simple decision making – reversed 0.759 0.489 0.636 0.630 0.912 Centralised organisational structure – reversed 0.549 0.372 0.474 0.452 0.845
Cronbach’s Alpha 0.786 0.686 0.680 0.791 0.498* Composite Reliability 0.863 0.827 0.824 0.866 0.871
AVE 0.614 0.615 0.610 0.621 0.772 * Significant (p<0.01) Spearman’s correlation coefficient displayed instead
of Cronbach’s Alpha, as the measure only consists of two indicators. Table 5.5: Growth factor loadings, reliability and validity indicators
Indicator Assets FTE Annual Turnover Growth
Slow turnover growth – reversed 0.714 0.430 0.445 0.614 Turnover growth faster than competition 0.845 0.597 0.679 0.815 Very fast turnover growth 0.881 0.588 0.714 0.831 Slow employment growth – reversed 0.261 0.533 0.264 0.393 Employment growth faster than competition 0.589 0.848 0.486 0.725 Very fast employment growth 0.611 0.877 0.496 0.741 Slow asset growth – reversed 0.357 0.228 0.559 0.427 Asset growth faster than competition 0.633 0.495 0.821 0.739 Very fast asset growth 0.696 0.498 0.867 0.774
Cronbach’s Alpha 0.631 0.643 0.748 0.853 Composite Reliability 0.800 0.806 0.856 0.886
Loading onto second-‐order construct 0.931 0.834 0.875 -‐ AVE 0.580 0.590 0.667 0.766*
*AVE value for the second-‐order construct calculated based on the loadings of the first-‐order constructs onto the second-‐order construct (Götz et al. 2010).
© 2011 RossiSmith Academic Publishing, JAES, Vol VII, Iss 2, December 2011, Refereed Edition, Page:
52
ENTREPRENEUR OPTIMISM AND THE NEW VENTURE CREATION PROCESS
Mr Neil James
Australian Centre for Entrepreneurship Research, QUT Business School, Queensland University of Technology, Brisbane, Australia
Email: [email protected] Dr Amanda Gudmundsson
QUTGraduate School of Business, QUT Business School, Queensland University of Technology, Brisbane, Australia
Email: [email protected]
ABSTRACT
By integrating two theoretical approaches to entrepreneurship research, the psychology of
the entrepreneur and the entrepreneurship process, this paper proposes a new conceptual
model examining entrepreneur behaviour and emotion across the new venture
development process. Existing macro level research on the new venture creation process
recognises the entrepreneur as a central agent in the process yet generally avoids, at each
stage of the process, an examination of the micro level psychological experiences of the
individual entrepreneur. Similarly, behavioural research examining entrepreneur
individual differences has neglected to systematically explore the emotion and behaviour
of the entrepreneur across the cycle of the new venture creation process. We propose a
conceptual framework that integrates the exploitation phase of the new venture creation
process with the psychological capital element of optimism and behaviour of the
individual entrepreneur. Propositions for future research to facilitate deeper insight into
the impact of entrepreneur behaviour and emotion on the new venture creation process
and ultimately the success or failure of the new venture are offered.
© 2011 RossiSmith Academic Publishing, JAES, Vol VII, Iss 2, December 2011, Refereed Edition, Page:
53
INTRODUCTION
The failure rate of new ventures is reportedly as high as 55% (Knaup, 2005). Regrettably
the extent of such failure is contrary to the importance and contribution that
entrepreneurial activity has to the economic well being of society. Successful new
ventures have been directly linked to 19% of economic growth (GEM, 2008), as well as
being associated with indirect value chain influences such as the creation of employment.
Accordingly, it is paramount that research attention focuses on exploring realistic ways to
redress the failure rate of new ventures. Previous research has demonstrated that new
ventures have a low rate of success because of the quality of the start-ups, the ability of
the venture to meet realistic or sustainable growth objectives, and an inability to generate
profits over a sustained period of time (Davidsson, Steffens, Gordon & Reynolds, 2008).
Arguably the new venture creation process is a complex interplay between the
environment, the individual founder, the organisation, and the process adopted (Gartner,
1985). Nevertheless, within the context of such complexity, entrepreneurship theory and
research has generally found that there is a close interconnection between the role of the
founder or individual entrepreneur and the new venture’s success or failure (Davidsson, et
al., 2008). The scholarly field of entrepreneurship is an examination of “how, by whom,
and with what effects opportunities to create future goods and services are discovered,
evaluated, and exploited” (Shane and Venkataraman, 2000, p. 218). Importantly, this
definition indicates that the field of entrepreneurship includes both an analysis of the
entrepreneurial process as well as an analysis of the individuals who are enacting that
process. However, theoretical models at present explore these important concepts
separately. The current paper offers an integration of the entrepreneurial process with the
emotions and behaviours of the individual entrepreneur, particularly in regard to the
psychological element of over optimism.
The purpose of this paper is to establish a conceptual model to derive a set of research
propositions examining the impact of the behaviour and emotion of the individual
entrepreneur across the five stages of the exploitation phase of the new venture creation
process. Shepherd (2011, p412) supports that a ‘deeper understanding of the
© 2011 RossiSmith Academic Publishing, JAES, Vol VII, Iss 2, December 2011, Refereed Edition, Page:
54
entrepreneurial phenomenon’ would come from more investigation on the interplay
between individual difference and decision making in an entrepreneurial context.
Although we recognise that there are a number of perspectives on the new venture
creation process, we have anchored our conceptual model using the holistic macro
perspective that has been captured in Shane and Venkataraman’s (2000) framework. This
framework incorporates the elements of opportunity discovery, evaluation and
exploitation to explain and predict the new venture creation phenomenon. Given that our
focus is on the exploitation phase we have added granularity to the exploitation phase by
incorporating stages theory into the model. Specifically we have adopted the approach
used by Cardon et al. (2005) using the human lifecycle as the metaphor.
In contrast to the macro process model, examining entrepreneurship from a micro
perspective provides explanations of entrepreneurial behaviour such as risk taking, focus
intensity, and decision making through the lens of individual differences such optimism.
This paper proposes an integrative conceptual model that draws together these two
important foundations of entrepreneurship research. Specifically, the paper combines
Shane and Venkataraman’s conceptual framework of the new venture creation process,
focusing on the exploitation phase, with the individual differences surrounding the
emotion and behaviour of the entrepreneur. In this paper entrepreneurial behaviour is
anchored in the broader domain of positive psychology and the specific elements of
Luthans, Youssef and Avolio’s (2007) psychological capital model incorporating the
elements of efficacy, hope, resilience and optimism.
Defining the new venture creation process
“A new venture is the end result of the process of creating and organizing a new business
that develops, produces, and markets products or services to satisfy unmet market needs
for the purposes of profit and growth” (Chrisman, Bauerschmidt, & Hofer, 1998, p.6),
with founders being the individual participants directly attributable to the formation of the
© 2011 RossiSmith Academic Publishing, JAES, Vol VII, Iss 2, December 2011, Refereed Edition, Page:
55
venture. Moreover, a new venture is often considered to be new until it reaches the stage
described in many new venture lifecycle models as maturity (Chrisman, et al., 1999).
The process of new venture creation
Shane and Venkataraman (2000) proposed a model of entrepreneurship that identifies
three distinct processes: the existence and discovery of entrepreneurial opportunities; the
decision to exploit entrepreneurial opportunities; and modes of exploitation.
Fundamentally they argued that in order to have entrepreneurship, opportunities needed to
exist and be recognised or discovered. Once discovered, an explicit decision to develop
the opportunity needs to occur, recognising that there are varying ways in which
opportunity development can be enacted.
The establishment and development of new ventures is dynamic and non linear. Whilst
Shane and Venkataraman’s conceptual model suggest three distinct processes, the reality
of new ventures is that these stages are intertwined and are often overlapping and occur in
different sequences in the process as the opportunity and new venture develops.
Importantly our focus is on the exploitation phase, thereby concentrating on the execution
aspects of the new venture as opposed to opportunity discovery and analysis. Stage theory
has been used extensively in the literature to consider the distinct stages that ventures go
through when they are growing and developing. Levie and Lichtenstein (2010) have
identified 104 different stages models. They concluded that the only constant across all
models is that “businesses tend to operate in some definable state for some period time”
(Levie & Lictenstein, 2010, p330).
Despite this viewpoint, we believe, that in respect to our research, stages theory provides
a way of identifying distinct stages that these ventures move through during the
exploitation phase, that may impact the level of optimism being displayed.
In reality there is a triangulation between the opportunity, the various resources that may
be required and the team to make it happen. These distinct aspects demand that an
© 2011 RossiSmith Academic Publishing, JAES, Vol VII, Iss 2, December 2011, Refereed Edition, Page:
56
entrepreneur is sufficiently capable of maintaining and adopting a sufficient and
appropriate level of management and focus on all three. Similarly, Shane and
Venkataraman’s conceptual framework focusing on entrepreneurship as a process
maintains the entrepreneur as a central agent in the process through the discovery or
recognition of the opportunity, the decision to exploit and develop the opportunity, and
the ways in which the opportunity is able to be exploited. To be an entrepreneur requires
an individual to take action (McMullin&Shepherd, 2006), to ensure that an opportunity
recognised is acted upon to bring the business opportunity to some conclusion. Action
requires individual intervention, thereby further emphasising the integration of the
potential impact of the emotion and behaviour of the entrepreneur. Further support for the
integration between individual difference and decision making in an entrepreneurial
context, particularly around individual tasks and actions has been provided by Shepherd
(2011). This has been further examined by Cardon et al. (2005) where the relational
nature of entrepreneurship was further examined using a “parenthood metaphor” (p.23).
The following table adapted from Cardon et al. (2005) summarises the nature of each
stage.
Stage Description Conception & Gestation Serious commitment to developing the venture
Resource acquisition to support the venture development Activities related to the startup of the venture
Infancy & Toddlerhood High dependence of the venture on the entrepreneur Initial revenue generating activities start to occur, yet market penetration not strongly realized
Childhood & Adolescence Increasing independence of the business given more human capital is being added to support its growth and development More consistent revenue earning activity is occurring, with the venture beginning to become profitable. Requirement for more complexity as regards systems and processes leading to a developing of the ventures culture.
Maturity Transition to professional managers albeit that the entrepreneurial founders are still involved. Consistent profitability with growth occurring. Realistic market share being achieved demonstrating the ‘coming of age’ of the venture.
Exit Entrepreneurial exit. This could be either positive, in terms of value accretive exit by way of trade sale or similar, or negative by way of liquidation through poor performance.
© 2011 RossiSmith Academic Publishing, JAES, Vol VII, Iss 2, December 2011, Refereed Edition, Page:
57
Given that it is likely that the positive psychology of an entrepreneur is generally
considered to be dynamic, examining optimism at varying defined stages of a ventures
exploitation phase is likely to be more appropriate and relevant. Therefore we have
broken the exploitation phase into five stages, namely: conception & gestation, infancy &
toddlerhood, childhood & adolescence, maturity, and exit.
The emotion and behaviour of the entrepreneur
In entrepreneurship research the impact that the founder, or entrepreneur, has on the new
venture creation process cannot be understated. The reality of many new ventures is that
the performance of the venture is closely linked to the behaviour of the founder because
of the strong emotional and behavioural bond between the founder and their venture
(Coelho, De Meza, & Reyniers, 2004). The significance of the emotion of the individual
entrepreneur is persuasively acknowledged in Cardon, Wincent, Singh and Drnovsek’s
(2009) recent conceptual paper. The authors have claimed that research attention must be
directed towards understanding the passion of the entrepreneur to facilitate a deeper
understanding of the nature of the relationship between the entrepreneur and the success
of the new venture. Cardon et al.’s proposed focus on exploring the emotion of the
founder resonates with previous research which has demonstrated that founder motivation
for starting new ventures is more closely aligned with non-monetary rewards (Alstete,
2008), and that entrepreneurs are passionate about their business pursuit. Such a strong
emotional foundation for the individual embarking on an entrepreneurial journey further
personalises the relationship between the new venture and the founder and suggests that
to fully understand the success or failure of a new venture the behaviour and emotion of
the individual entrepreneur needs to be analysed.
The decision to explore and exploit an opportunity may be classified based on the
‘amount of uncertainty perceived’ (Shepherd, 2006, p.136) by the founder and the degree
to which the founder, as an individual, is prepared to take on the risk involved. Indeed, it
is the perception by the individual that may provide the catalyst to pursue an opportunity.
© 2011 RossiSmith Academic Publishing, JAES, Vol VII, Iss 2, December 2011, Refereed Edition, Page:
58
The importance of examining the emotion of the new venture founder has been articulated
in both conceptual and empirical entrepreneurship research (e.g., Cardon et al., 2009,
Hmieleski & Baron, 2009). Theoretically, emotion based explanations have been used to
reason why new venture founders display behaviours such as unconventional risk taking,
extreme focus intensity, and an unwavering belief in his or her dream (Cardon et al.,
2009). Positive emotional states such as optimism, hope and resiliency have been reported
in empirical research of successful leaders of high-technology new ventures (Peterson,
Walumbwa, Byron, & Myrowitz, 2009). The pursuit of a new venture despite potentially
daunting obstacles is suggested by Hmieleski and Baron (2009) as being the result of the
individual entrepreneur being high in dispositional optimism. Indeed previous empirical
evidence has found that dispositional optimism is a defining characteristic of
entrepreneurs involved in founding new ventures(Cooper, Woo, & Dunkelberg, 1988).
However, the generally perceived positive emotions of passion and high levels of
dispositional optimism within the entrepreneur create a tension that is potentially both a
benefit and also a burden for entrepreneurial success. Excessive levels of optimism may
lead to a negative impact on new venture success. Scholars have argued that simply
possessing a great passion for a new venture and having dispositional optimism does not
guarantee new venture success (Crane & Crane, 2007). Indeed, empirical research has
found that entrepreneurs have expressed high levels of optimism irrespective of their
preparedness to lead the venture (Cooper, et al., 1988). Hmieleski and Baron’s (2009)
recent research, adopting a social cognitive perspective, found that entrepreneur optimism
negatively impacted on new venture performance. Hmieleski and Baron have thus
recommended that more research attention needs to be directed towards exploring the
influence of individual entrepreneur emotional states, such as optimism, on new venture
performance.
The psychological capital model
The emergent field of positive psychology is contributing to the development of
knowledge relevant to positive emotional states such as optimism, recognising that such
© 2011 RossiSmith Academic Publishing, JAES, Vol VII, Iss 2, December 2011, Refereed Edition, Page:
59
elements within the individual can enhance organisational performance (Quick, Cooper,
Gibbs, Little, & Nelson, 2010). Luthans, Youssef, and Avolio (2007) have consolidated
and extended the theorising developed in the early positive psychology movement and
proffered a Psychological Capital (PsyCap) model. The model is an integrated conceptual
framework used to explain individual psychological capital and workplace return on
investment outcomes such as efficiency (e.g., return on investment) and effectiveness
(e.g., growth). Within the PsyCap model optimism is recognised as a psychological
capacity, together with the psychological capacities of efficacy, hope and resilience. We
contend that this model is of value for exploring the nature of entrepreneurial emotion and
behaviour across the new venture creation process as it is an empirically validated
framework which incorporates standardised measurement of the psychological capacities.
The PsyCap model of Luthans et al. (2007) thus provides the current study with a model
that can examine the impact of entrepreneurial optimism and other emotional and
behavioural elements such as efficacy, resilience and hope across the new venture
creation process. As explored previously, the challenge with entrepreneur emotions and
behaviour is that when a negative event occurs, the response may be emotionally based
and related to their dream pursuit or passion (Cardon et al. 2009), rather than a rational
decision based on objective analysis of the evidence. The emotionally based decision
potentially further compounds the situation or problem being faced.
Entrepreneur optimism
Given that new ventures often emerge in new or previously unexplored markets,
developing new products and technologies that may not have historical bases from which
to found decisions (Coelho et al., 2004, Ottesen&Gronhaug, 2006), positive emotional
states such as optimism may provide the new venture founder with the necessary
expectation of achieving desirable outcomes (Carver &Scheier, 2005). Entrepreneurs
have reportedly demonstrated a greater tendency towards excessive optimism in
comparison with non-entrepreneurs (Ucbasaran, Westhead, Wright, & Flores, 2010).
Therefore, positive psychological emotions such as optimism may be critical in providing
© 2011 RossiSmith Academic Publishing, JAES, Vol VII, Iss 2, December 2011, Refereed Edition, Page:
60
the motivating behaviour to enable the individual entrepreneur to persist through the
opportunity discovery, evaluation and in particular the exploitation phases of the new
venture process. In addition to optimism, Peterson, Walumbwa, Bryon and Myrowitz
(2009) demonstrated that resiliency and hope were also important in new venture
businesses. Peterson et al.’s study of 121 technology firms reported a positive predictive
relationship between CEO optimism, resiliency and hope and subordinate ratings of
transformational leaders. Moreover these transformational leaders had a stronger and
more positive effect on the performance of start-up organisations in comparison to
established firms.
However, there also appears to be a potential downside to an excessive level of
entrepreneurial optimism. Excessive optimism in the entrepreneur has been suggested by
some scholars as the primary reason for the high incidence of new venture failure
(Gartner, 2005). The challenge with excessive optimism is that it may contribute to poor
or irrational decision making (Palich & Dagby, 1995). Many new venture founders have a
lack of experience or contextual information regarding both the venture and the market in
which it may operate. Excessive optimism may accordingly permit the development of
ineffective behaviours such as ‘unchecked fantasising’ (Coelho et al., 2004, p.397).
Decisions and actions may be made or taken without reference to a clear perspective or an
understanding of reality. This can negatively impact on new ventures in a number of ways
and may include difficulty in securing financial support or the necessary physical and
human resources to ensure venture success.
From a financing perspective Landier and Thesmar (2005, p.1) suggest that “optimists
self-select into short term debt whilst those with a more realist orientation self-select long
term debt”. The excessive optimism of new venture founders may therefore contribute to
the loss of appetite by new venture sector financiers, and could have significant
implications for future economic growth. The findings of research by Puri and Robinson
(2007) support the hesitance of the financial sector, with the extreme optimists in their
study displaying financial habits that were not considered prudent. Furthermore it seems
that over optimists may also have short term planning horizons (Puri & Robinson, 2007)
indicating a potential focus on immediacy rather than the ‘big picture’. As much as this
© 2011 RossiSmith Academic Publishing, JAES, Vol VII, Iss 2, December 2011, Refereed Edition, Page:
61
may impact strategy and decision making, it also has potential significance in respect of
new venture funding requirements. Given that the funding provided by way of venture
capitalists is extremely limited, the ability to encourage and provide more effective
confidence to financiers is critically important. Palich and Bagby (1995) found that
excessive optimism by entrepreneurs lead to an underestimation of the riskiness of their
venture. Once again these findings support the need for more research investigating the
notion of excessive optimistic behaviour in entrepreneurs.
Theoretically, optimism has been described and assessed in a number of ways including
links to mood and morale, tenacity and perseverance, effective problem solving, personal
and business success (Luthans, 2002; Peterson, 2000; Seligman, 2006). Using Seligman’s
explanatory style definition, an optimist is defined as someone who expects positive and
desirable events in the future, as opposed to a pessimist who constantly has negative
thoughts and expects undesirable things to happen. Psychological research further asserts
that optimism exists on a continuum, and thus different levels of optimism may be
observed. Interestingly, although differences may exist in optimism levels, the boundary
between what is realistic and what is excessive in optimism is still unclear (Schneider,
2001). Seligman has also argued previously of the ability of pessimists to make more
objective decisions.
Optimism is argued to have both state and trait aspects (Kluemper, Little & DeGroot,
2009). Trait optimism refers to stable individual levels of optimism that are generally
exhibited, whereas state based optimism is that which is influenced by contextual or
situational factors. The recognition that optimism has state characteristics is important, as
potentially negative influences through excessive optimism may be managed and reduced
(Seligman, 2006). Therefore, if excessive optimism is identified in entrepreneurs then
intervention programs can be designed to facilitate the development of realistic levels of
optimism within these new venture founders.
Given the likelihood of new venture failure, it is clear that entrepreneurs or new venture
founders initially need to have an optimistic perspective to direct and maintain their
motivation (Lowe & Ziedonis, 2006). However, there is perhaps a difference between a
© 2011 RossiSmith Academic Publishing, JAES, Vol VII, Iss 2, December 2011, Refereed Edition, Page:
62
level of optimism that is appropriate to motivate and direct entrepreneurial effort and a
level of optimism fuelled by the founder’s passion for his or her venture which could be
considered excessive and contribute to poor business decisions. In short, we suggest that
realistic optimism may have positive consequences for the new venture creation process
and ultimately improve the chance of new venture success, whereas excessive optimism
may be linked to excessive risk taking and poor decision making and thus may have the
opposite effect on the new venture outcome and negatively impact new venture success.
The proposed conceptual model
As previously contended, we have used the three stages of the new venture creation
process by Shane and Venkataraman (2000) as a macro explanation of the distinct
elements of the entrepreneurial process. Given the focus on exploitation we have further
broken the model down based on the stages proposed by Cardon et al. (2010). Although it
can be argued that the stages are not necessarily linear, new ventures do have a life cycle
that can be distinguished by differing characteristics and tasks within the cycle. We
contend that effectiveness across the new venture process will be enhanced if the
entrepreneur is able to invest the appropriate psychological capital at each stage of the
new venture process. The psychological capital model is thus integrated with the
entrepreneurial process model to assist in the generation of specific propositions for
future empirical examination.
We assert in this paper that relationships exist between the identified psychological
capital elements of efficacy, hope, optimism, and resilience across the stages of the
entrepreneurial new venture creation process. The four psychological resources presented
in the psychological capital model originated with different theoretical perspectives and
definitions yet encompass an empirically validated common positive psychological
construct (Luthans et al., 2007). Summarily the psychological capital model measures,
efficacy or the confidence that an individual has about his or her ability to successfully
execute a task in a given context, hope which is a motivational state based on a perceived
sense of success, optimism which, as defined previously, is the expectation that the
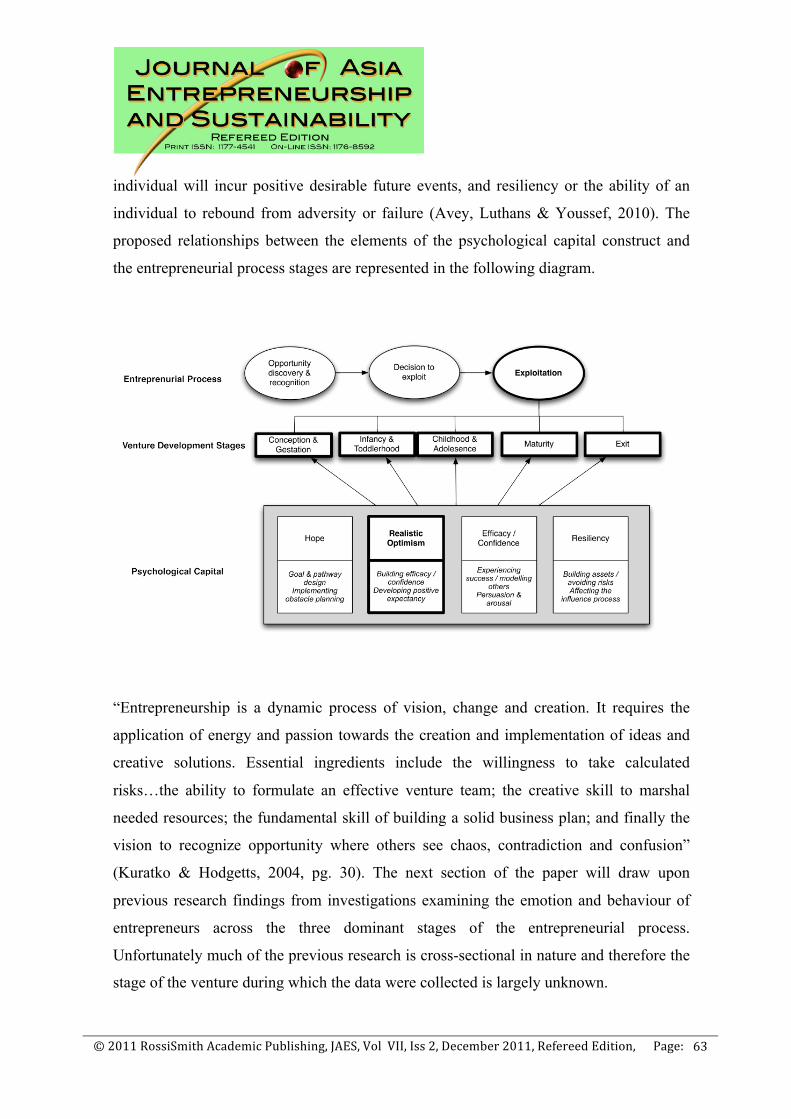
© 2011 RossiSmith Academic Publishing, JAES, Vol VII, Iss 2, December 2011, Refereed Edition, Page:
63
individual will incur positive desirable future events, and resiliency or the ability of an
individual to rebound from adversity or failure (Avey, Luthans & Youssef, 2010). The
proposed relationships between the elements of the psychological capital construct and
the entrepreneurial process stages are represented in the following diagram.
“Entrepreneurship is a dynamic process of vision, change and creation. It requires the
application of energy and passion towards the creation and implementation of ideas and
creative solutions. Essential ingredients include the willingness to take calculated
risks…the ability to formulate an effective venture team; the creative skill to marshal
needed resources; the fundamental skill of building a solid business plan; and finally the
vision to recognize opportunity where others see chaos, contradiction and confusion”
(Kuratko & Hodgetts, 2004, pg. 30). The next section of the paper will draw upon
previous research findings from investigations examining the emotion and behaviour of
entrepreneurs across the three dominant stages of the entrepreneurial process.
Unfortunately much of the previous research is cross-sectional in nature and therefore the
stage of the venture during which the data were collected is largely unknown.
© 2011 RossiSmith Academic Publishing, JAES, Vol VII, Iss 2, December 2011, Refereed Edition, Page:
64
Opportunity exploitation
The first stage of the new venture creation process requires that there is recognition that
an entrepreneurial opportunity exists. Such recognition as argued by Shane and
Venkataraman (2000) is a subjective process, as the variety of options and the potential
consequences of exploiting those options are unknown. Moreover, Shane and
Venkataraman further contend that people make decisions “on the basis of hunches,
intuition, heuristics, and accurate and inaccurate information” (p. 221). While there is
little argument that people (i.e., entrepreneurs) make decisions on the basis of many
reasons, decision making is not a completely rational and cognitive process, with some
authors suggesting that rational decisions afford a bad basis for action and that some
irrationalities are necessary (Brunsson, 1982).
A comprehensive meta-analysis of the relationship between personality to entrepreneurial
intention recently conducted by Zhao, Siebert, and Lumpkin (2010) identified that risk
propensity was moderately related to entrepreneurial intention although it was not
significantly related to entrepreneurial performance. The authors have suggested that their
findings demonstrate that risk propensity may vary across the stages of entrepreneurship
and that it is more likely to be evident during the early stage of the entrepreneurship
process. Such results provide additional support for the contention of this paper that more
research on the impact of individual entrepreneur emotions and behaviours is necessary
across the different stages of the new venture creation process.
The emotional resources called upon by the entrepreneurs to make decisions surrounding
the opportunity or discovery may well be facilitated and fuelled by the entrepreneurs’
hope, efficacy and optimism. The previous review of entrepreneurial optimism has
demonstrated that entrepreneurs are higher in excessive optimism than non-entrepreneurs
(Ucbasaran et al., 2010), have greater levels of dispositional optimism in comparison with
others (Hmiesleki& Baron, 2009), and are more likely to report being prepared for the
new venture challenge (Cooper et al., 1988). Other characteristics such as self-efficacy
have also demonstrated to be significant predictors (r=.378) of entrepreneurial behaviour
(Rauch & Frese, 2007), while hope is suggested by Morrow (2006) as a characteristic that
© 2011 RossiSmith Academic Publishing, JAES, Vol VII, Iss 2, December 2011, Refereed Edition, Page:
65
if developed in entrepreneurs will assist in achieving greater entrepreneurial success.
After seizing upon an opportunity, the entrepreneur needs to then determine whether the
opportunity is worthwhile in pursuing. Although figures on the number of opportunities
that are discovered and the number of those discovered opportunities that are attempted to
be realised are not known, it is reasonable to presume that a great many ideas and
innovations are not progressed further. The evaluation of an entrepreneurial opportunity
and the decision to attempt to exploit a discovered opportunity is suggested by Shane and
Venkataraman (2000, p. 222) to be a function of the “joint characteristic of the
opportunity and the nature of the individual”. The authors argue that in addition the nature
of the venture and the ability to raise capital, individuals who are optimistic, have greater
self-efficacy, stronger internal locus of control, greater tolerance for ambiguity, and a
more dominant need for achievement are more likely than other members of society to
make the decision to exploit the opportunity.
Proposition 1: Psychological capital elements, such as passion, hope, and efficacy
influence the level of optimism displayed by entrepreneurs, at the conception and
gestation phase of exploitation, therefore positively impacting on the likelihood of
moving to the next phase of the new venture process.
In contrast to the above perspective and offering a challenge to the levels of optimism in
entrepreneurs, a recent article in Strategic Directions (2010) suggests that many new
ventures have faltered during the early stage of creation because the venture was the
“brainchild” (p. 7) of an excessively optimistic individual entrepreneur who neglected
attention to detail, had no contingency plan or did not recognise the need for caution. The
findings reported in Hmiesleki and Baron’s (2009) paper also suggest that entrepreneurial
optimism can have a negative impact on new venture success. When generating examples
of behaviour to illustrate their conceptual model, Luthans et al., (2006) have also
suggested that future research on entrepreneurial hope, efficacy and optimism could
clarify whether there is the possibility of “too much a good thing” (p. 80).
Proposition 2:If the individual entrepreneur displays excessive optimism at the early
stages (conception and gestation phase, infancy and toddlerhood) of new venture
© 2011 RossiSmith Academic Publishing, JAES, Vol VII, Iss 2, December 2011, Refereed Edition, Page:
66
exploitation, then the chance of the new venture moving to the next stage of the
development process is decreased.
Shane and Venkataraman (2000) hastened to add in their paper that the individual
attributes which were suggested as increasing the likelihood that an entrepreneur would
attempt to realise an opportunity did not logically increase the probability of the new
venture being a success. In contrast, as an example, they suggested that excessive
optimism “might be associated with a higher probability of both exploitation and failure”
(p. 224). Indeed a recent study indicates that even practiced entrepreneurs who have
experienced a failed venture, although tempered in their level of comparative optimism
(i.e., excessive optimism) they were still optimistic about the new venture. The research
also reported that the way in which comparative optimism influenced experienced
entrepreneurs very much depended upon the nature of the past experiences, to the extent
that those who had no experienced business failure were still “more likely than novice (or
first time) entrepreneurs to report comparative optimism” (Ucbasaran et al., 2010, p. 2).
Proposition3: If the individual entrepreneur displays excessive optimism at the childhood
and adolescence stage of new venture exploitation, then the chance of the new venture
successfully moving to maturity is decreased.
The final stage of the entrepreneurial process as suggested by Shane and Venkataraman
(2000) is the organisation of the new venture into the economy. Two dominant
institutional arrangements are suggested, i.e., new firm creation or the sale of the
opportunity into an existing firm. Research evidence for the impact of the individual
entrepreneur emotion and behaviour during this stage is limited, with the focus of
research examining the ability of the individual to secure financing, first mover
advantages, and barriers to entry and so forth. However, we argue that at this stage of the
entrepreneurial process that the emotion and behaviour of the individual entrepreneur will
continue to impact of the success or otherwise of the new venture. At this stage of the
new venture creation process, we expect that hope, realistic optimism, efficacy and
resiliency are needed.
In an examination of the self-efficacy and optimism of a small sample of Australian
© 2011 RossiSmith Academic Publishing, JAES, Vol VII, Iss 2, December 2011, Refereed Edition, Page:
67
entrepreneurs, Trevelyan (2008) found that the concepts of optimism and self-efficacy
were distinctive. The author reported that both self-efficacy and optimism were required
during the early phases of the new venture when the individual was deciding upon
becoming an entrepreneur, but that over confidence (i.e., high levels of self-efficacy) was
harmful during the decision making phase of the new venture. Trevelyan concluded that
what is needed in future research is a clarification of when during the entrepreneurial
process is optimism beneficial and when is excessive self-efficacy harmful.
Some studies have demonstrated that entrepreneurial optimism may reduce over time or
with experience. For example, based on an economic modelling approach applied to data
collected through the British Social Attitudes Survey, Fraser and Greene (2006) identified
that in comparison to employees entrepreneurs where more optimistic and had greater
belief in their ability (i.e., self-efficacy) although the level of optimism diminished with
experience of new business establishment. The authors suggest that the results provide
evidence to improve the education process for nascent entrepreneurs to assist in them with
a more accurate forecast of future business performance. In another economically
founded paper, de Meza and Southey (1996) found that optimists were more likely than
pessimists to pursue financing their business venture. Not only does excessive optimism
impact negatively on the new venture (Hmiesleki& Baron, 2009), Trevelayn (2006)
argues that in the final phase of the new venture when formal systems and structures are
required to be put in place, an entrepreneur high in self-efficacy may find an “inability to
let go, as the overconfident entrepreneur does not believe anybody else can perform as
well as him/herself” (p. 996).
Proposition 4: If the psychological capital element of realistic optimism is present in the
individual entrepreneur at the maturity phase, then the chance of the new venture
surviving is improved.
© 2011 RossiSmith Academic Publishing, JAES, Vol VII, Iss 2, December 2011, Refereed Edition, Page:
68
CONCLUSION
The position taken in this paper is that excessive entrepreneurial optimism can potentially
be shaped and influenced. Indeed, in order to achieve objectives such as effective capital
raising and the like, optimism may need to be managed so that it is reflected at
appropriate levels. Psychological capital provides an integrated framework to consider the
broader human capital elements in which optimism is anchored. The other psychosocial
capital elements, hope, self-efficacy and resiliency may mean in reality, it is difficult to
separate the specific role that varying levels of optimism play in the venture creation
process.
The need to manage and identify moderators of excessive optimism has not previously
been an area of focus in the entrepreneurship field (D’Intino et al., 2007, Crane & Crane,
2007). Although recent empirical evidence by Hmiesleki and Baron (2009) and
theoretical work by Cardon et al. (2009) has identified the importance of this area of
enquiry, suggesting that excessive optimism may be linked to the difficulty of generating
new venture success. The evidence indicates that whilst positive entrepreneurial states
like passion and optimism have contributory value to the success and development of new
ventures, a lack of moderators to regulate the negative consequences of irrational decision
making can mean that the new venture struggles to meet its performance objectives.
Consequently there is a fundamental gap that exists in the empirical research examined
with respect to the impact of excessive entrepreneurial optimism across the new venture
process. Given that optimism has state based characteristics it is plausible to suggest that
the entrepreneur may experience varying levels of optimism across the life cycle of the
new venture, thus longitudinal based research is warranted. The ability to both generate a
better understanding of entrepreneurial optimism and to provide techniques and tools that
assist with the management of optimism could have a significant economic and social
impact through the extended survival rate and growth of new ventures. The model
proposed in the current paper will also help advance the empirical and theoretical work
currently being conducted on the impact of excessive optimism of entrepreneurs on new
venture performance.
© 2011 RossiSmith Academic Publishing, JAES, Vol VII, Iss 2, December 2011, Refereed Edition, Page:
69
Entrepreneurial activity and new ventures are known to make an important contribution to
the overall economic well-being of a society both in terms of the direct financial impacts
as well as indirect and other downstream benefits. The entrepreneurial process is a
complex interplay between the nature of the new venture, the creation process and the
emotions, behaviour and skill of the new venture founder or entrepreneur. The current
paper has proposed a conceptual model to integrate the macro level processes occurring
across the life cycle of the new venture creation process with the micro level individual
differences evident in the emotions and behaviours of entrepreneurs. The propositions
offered are designed to provide the impetus for empirical examination to enable a deeper
understanding and greater insight to be developed regarding the important yet complex
phenomenon of entrepreneurship.
REFERENCES
Alstete, J.W. (2008). Aspects of entrepreneurial success. .Journal of Small Business and Enterprise Development, 15(3), 584-594.
Avey, J.B., Luthans, F. & Youssef, C.M. (2010). The additive value of positive psychological capital in predicting work attitudes and behaviours. Journal of Management, 36, 430-452.
Brunsson, N. (1982). The irrationality of action and action rationality: Decisions, ideologies and organisational actions. Journal of Management Studies, 19 (1), 29-44.
Cardon, M., Wincent, J., Singh, J., & Drnovsek, M. (2009).The nature and experience of entrepreneurial passion. Academy of Management Review, 34(3), 511-532.
Carver, C.S. & Scheier, M.F. (2005). Optimism. In C.R. Snyder & S.J. Lopez (Eds.), Handbook of Positive Psychology (pp. 231-243). New York: Oxford University Press.
Chrisman, J., Bauerschmidt, A. & Hofer, C. (1998). The determinants of new venture performance: An extended model. Entrepreneurship Theory & Practise, Fall, 5-29.
Coelho, C., De Meza, D. &Reyniers, D. (2004). Irrational exuberance, entrepreneurial finance and public policy.International Tax and Public Finance, 11, 391-417.
Cooper, A.C., Woo, C.W. & Dunkleberg, W.C. (1988). Entrepreneurs’ perceived chances for success. Journal of Business Venturing, 3, 97-108.
Crane, F.G. & Crane, E.C. (2007). Dispositional optimism and entrepreneurial success.The Psychologist-Manager Journal, 10(1), 13-25.
Davidsson, P., Steffens, P.R., Gordon, S.R. & Reynolds, P. (2008).Anatomy of new business activity in Australia: Some early observations from the CAUSEE Project. Technical Report, School of Management, Faculty of Business, QUT.
© 2011 RossiSmith Academic Publishing, JAES, Vol VII, Iss 2, December 2011, Refereed Edition, Page:
70
D’Intino, R.S, Goldsby, M.G., Houghton, J.D. & Neck, C.P. (2007).Self leadership: A process for entrepreneurial success. Journal of Leadership and Organisational Studies, 13(4), 105-120.
de Meza, D. & Southey, C. (1996). The borrowers curse: Optimism, finance and entrepreneurship. The Economic Journal, 16(435), 375-386.
Fraser, S., & Greene, F.J. (2006).The effects of experience on entrepreneurial optimism and uncertainty.Economica, 73, 169-192.
Gartner, W.B (1985). A conceptual framework for describing the phenomenon of new venture creation. The Academy of Management Review, 10(4), 696-706.
Gartner, W.B. (1989). Some suggestions for research on entrepreneurial traits and characteristics. Entrepreneurship Theory & Practise, Fall, 27-37.
Hmieleski, K. & Baron, R. (2009). Entrepreneurs’ optimism and new venture performance: A social cognitive perspective. Academy of Management Journal, 52(3), 473-488.
Landier, A. &Thesmar, D. (2008).Financial contracting with optimistic entrepreneurs. Review of Financial Studies.22(1), 117-150
Linley, P.A., Harrington, S.,& Garcea, N.(2010). Oxford handbook of positive psychology and work. New York: Oxford University Press.
Lovallo, D. & Kahneman, D. (2003). Delusions of Success. Harvard Business Review, July, 57-63.
Lowe, R. & Ziedonis, A. (2006). Overoptimism and the performance of entrepreneurial firms.Management Science, 52(2), 173-186.
Luthans, F. (2002). The need for and meaning of positive organisational behaviour, Journal of Organisational Behaviour, 23, 695-706.
Luthans, F., Youssef, C.M. & Avolio, B.J. (2007).Psychological capital: Developing the human competitive edge. New York: Oxford University Press.
Kuratko, D.F., & Hodgetts, R.M. (2004). Entrepreneurship: theory, process, practise. Ohio: Thomson / Southwestern.
Kluemper, D.H., Little, L.M. & DeGroot, T. (2009). State or trait: effects of state optimism on job-related outcomes. Journal of Organisational Behaviour, 30, 209-231.
Knaup, A. (2005). Survival and longevity in the business employment dynamics data.Monthly Labour Review, May, 50.
McMullin, J.S & Shepherd, D.A. (2006). Entrepreneurial action and the role of uncertainty in the theory of the entrepreneur. Academy of Management Review, 31 (1), 132-152
Morrow, R. (2006). Hope, entrepreneurship and foresight. http://www.pspl.com.au/ ideas-written-down/hope-theory (accessed November 2, 2010).
Ottesen, G.G. & Gronhaug, K. (2006). Pursuing opportunities: Why so many fail and so few succeed. European Journal of Marketing, 40(1/2), 100-112.
Palich, L. & Bagby, D. (1995). Using Cognitive Theory to Explain Entrepreneurial Risk Taking: Challenging Conventional Wisdom. Journal of Business Venturing, 10, 425 – 438.
Peterson, S.J., Walumbwa, F.O., Byron, K. & Myrowitz, J. (2009).CEO positive psychological traits, transformational leadership, and firm performance in high-technology start-up and established firms. Journal of Management, 35, 348-368.
Peterson, C. (2000). The future of optimism. American Psychologist, 55(1), 44-55.
© 2011 RossiSmith Academic Publishing, JAES, Vol VII, Iss 2, December 2011, Refereed Edition, Page:
71
Peterson, S.J., Walumbwa, F.O., Byron, K. & Myrowitz, J. (2009). CEO positive psychological traits, transformational leadership, and firm performance in high-technology start-up and established firms. Journal of Management, 35, 348-368.
Puris, M. & Robinson, D.T. (2007).Optimism and economic choice. Journal of Financial Economics, 86, 71-99
Rauch, A. & Frese, M. (2007). Lets put the person back into entrepreneurship research: A meta-analysis on the relationship between business owners’ personality traits, business creation, and success. Psychology Press, 16 (4) 353-385
Quick, J.C., Cooper, C.L., Gibbs, P.C., Little, L.M. & Nelson, D.L. (2010).Positive Organisational Behaviour at Work.In G.P. Hodgkinson& J.K. Ford (Eds.), International Review of Industrial and Organisational Psychology, Vol 25, 253-291. Chichester, UK: John Wiley & Sons.
Schneider, S.L. (2001). In search of realistic optimism: Meaning, knowledge and warm fuzziness. American Psychologist, 56(3), 250-263.
Seligman, M.E.P. (2006). Learned optimism: How to change your mind and your life. New York: Random House.
Shane, S., & Venkataraman, S. (2000).The promise of entrepreneurship as a field of research. Academy of Management Review, 25 (1), 217 – 226.
Shepherd, D.A. (2011). Multilevel entrepreneurship research: opportunities for studying entrepreneurial decision making. Journal of Management, 37 (2), 412-420
Strategic Directions. (2010). Should we curb entrepreneurs’ optimism? Strategic Directions, 26 (1), 7-10.
Timmons, J. & Spinelli, S. (2009). New venture creation: Entrepreneurship for the 21st Century. New York: McGraw Hill.
Trevelyan, R. (2008). Optimism, overconfidence and entrepreneurial activity, Management Decision, 46(7), 986-1001.
Ucbasarn, D., Westhead, P., Wright, M., & Flores, M. (2010).The nature of entrepreneurial experience, business failure and comparative optimism. Journal of Business Venturing, 25, 541-555.
Zhao, H., Seibert, S.E., & Lumpkin, G.T. (2010). The relationship of personality to entrepreneurial intentions and performance: A meta-analytic review. Journal of Management, 36 (2), 381-404.
© 2011 RossiSmith Academic Publishing, JAES, Vol VII, Iss 2, December 2011, Refereed Edition, Page:
72
BUSINESS PERCEIVED SUCCESS AND GROWTH INTENTIONS
Louis Geneste and Paull Weber
School Of Management, Curtin Business School, Curtin University, Perth, Australia
Contact: Louis Geneste, School of Management, Curtin Business School, Curtin University,
GPO Box U1987, 6845 Perth, Australia, (T) 08 9266 7987, (F) 08 9266 7897, Email: [email protected]
ABSTRACT
This aim of this paper is to examine the relationship between the small business owner’s
intent to grow their business and their self-perception of success. A considerable body of
research has looked at business growth as a measure of small business success but this
approach ignores the possibility that small business owners consider themselves as
successful despite not wishing to grow their firm. Many small business operators choose
not to pursue growth opportunities for fear of losing control and losing the firm’s “small
business” atmosphere. Some business owners do not expand their business due to
lifestyle and family choices. It is possible there are business owners that consider
themselves successful despite not seeking the expansion of their firm. Conversely,
business owners intent on achieving business growth might consider themselves as
unsuccessful if the growth is slower than expected. To examine the relationship between
business growth and self-perception of success, a survey sample of small business owners
(n=340) was analysed according to their intention to expand their firm in terms of number
of employees. The findings of the data analyses provide some evidence that there is a
positive relationship between the growth intentions of small business owners and their
self-perception of success. The results also confirmed the reliability of a scale to measure
the self-perception of success. The results also have implications for a number of research
and policy settings.
© 2011 RossiSmith Academic Publishing, JAES, Vol VII, Iss 2, December 2011, Refereed Edition, Page:
73
INTRODUCTION
This paper examines the relationship between the small business owner’s intention to
grow their business and their self-perception of success. While there has been a
considerable body of research on the growth of the small business and success (Baum,
Locke and Smith 2001; Cliff 1998, Davidsson, Steffens and Fitzsimmons 2009; Wiklund
and Shepherd 2003, Runyan, Droge and Swinney 2008), there has been relatively less
work on the relationship between the small business owner’s self perception of success
and their intention to grow their business. The growth of the firm is frequently used as a
performance measure since small business and entrepreneurship researchers frequently
use growth as an indicator of success (Murphy, Trailer and Hill 1996, Dobbs and
Hamilton 2007). However, many small business owners choose not to pursue growth
opportunities for fear of losing control of the firm’s operations and consequent loss of
earnings. The business owner’s potential loss of the firm’s “small business” atmosphere
also acts as a barrier to growth (Wiklund, Davidsson and Delmar 2003).
Some small business owners are not keen to expand their business simply because of
lifestyle choices (Carlsen, Morrison and Weber 2008). Many small business owners are
content with maintaining the lifestyle their business affords them and do not want to risk
this by undergoing business growth (Frederick, Kuratko and Hodgetts 2006; Trott 2008).
Consequently, there may well be business owners that do not seek the expansion of their
firms yet still consider themselves as successful if they are achieving other business and
lifestyle goals. Conversely, business owners with the intent to grow their business might
be achieving slower than expected business growth and therefore do not consider
themselves as successful. Indeed, despite a business owner’s intention to grow, it is
possible that they are not achieving any growth at all and under these circumstances, self-
perceptions of success are likely to be impacted negatively. Jenkins and Johnson (1997)
argued that simply having the intention to grow a business does not necessarily mean that
this outcome will be achieved. The paper takes a closer look at the differences between
growth and non-growth oriented small business owners and their self-perception of
success.
© 2011 RossiSmith Academic Publishing, JAES, Vol VII, Iss 2, December 2011, Refereed Edition, Page:
74
The larger research project from which this paper was developed is the Western
Australian Small Business Benchmarks (WASBB) project (Weber et al. 2009). WASBB
was designed to develop and implement a model and methodology for measuring success
across a broad range of personal and business metrics that is accessible to, and applicable
by, small business owners. The long-term goal of the project is to generate a simple low
cost set of metrics by which small businesses may benchmark their performance relative
to other similar businesses. In tandem with this project, the questionnaire was used as a
vehicle to support a study into knowledge acquisition by SMEs (Geneste 2010).
The proposition that this paper seeks to explore relates to the relationship between the
growth orientation of the owner and his or her perceived levels of success. It is common
parlance in business popular press and consultancy circles to suggest that success requires
growth, that to stand still is to die. The question we raise here in an era when many small
business owners are more focused on lifestyle than traditional growth is to what extent do
small business owners actually ascribe to this mantra.
Hypothesis
The overall aim of this paper is to investigate if small business owners with the intent of
achieving business growth are different to small business owners who do not share this
intent in relation to their self-perceptions of success. The hypotheses associated with this
study are therefore as follows:
H0: There is no relationship between perceived small business success and the owner’s
willingness to grow their business
H1: There is a relationship between perceived small business success and the owner’s
willingness to grow their business
© 2011 RossiSmith Academic Publishing, JAES, Vol VII, Iss 2, December 2011, Refereed Edition, Page:
75
LITERATURE REVIEW
Small Business Success
Applying the value-laden judgments of researchers is fraught with risk when one tries to
define success, particularly by relying on quantitative and heavily deterministic measures
such as turnover or profit. For some owners, just being in business is enough (Still,
Soutar and Walker 2005); for others it is about doing good, about giving back to society
and making a substantial difference to others (Dees 1998). Thus, it would seem that
whilst quantitative measures of profit and turnover are useful to compare between
subjects, they do not capture the broad spectrum of goals and ambitions that drive small
business owner behaviours.
Curran and Blackburn (2001) described as “dubious” attempts to describe the typical or
average firm based upon specific measures such as turnover, particularly in the one-to-
four employee category. Perhaps success can be measured better by focusing on a
plurality of attainments of both intrinsic or extrinsic goals (Kuratko, Hornsby and
Naffgizer 1997; Robichaud, McGraw and Roger 2001). Particularly within the small
business context, success can be a very personal (intrinsic) thing as Jennings and Beaver
(1997, p. 63) reported:
Contrary to popular belief, and a great deal of economic theory, money and the pursuit of
a personal financial fortune are NOT as significant as the desire for personal involvement,
responsibility and the independent quality and style of life which many small business
owner-managers strive to achieve.
Jennings and Beaver (1997) also argued that academic attempts at defining success in the
small business environment have been either a case of adopting narrow accountancy
measures, or even more crude quantitative measures such as job creation and growth in
turnover. They argue that the best measure of success may well be “the sustained
satisfaction of principal stakeholder aspirations” (Jennings and Beaver 1997, p. 68.). This
satisfaction notion is similar to that espoused by Still and Soutar (2001) who looked at
goal satisfaction as a proxy for success, hypothesizing that exceeding expected targets
© 2011 RossiSmith Academic Publishing, JAES, Vol VII, Iss 2, December 2011, Refereed Edition, Page:
76
would lead to satisfaction and a global feeling of success. However, implicit in this
language of ‘expected targets’ is a continued desire to measure the quantum of such
satisfaction.
Personal or intrinsic success manifests itself in the current study as the internal sense of
satisfaction or achievement that arises from owning and operating the business. Often,
this subjective assessment is captured in the motivation and goal achievement literature,
as well as in the psychological perspective of a workplace (Frese, Brantjes and Hoorn
2002). LeCornu et al. (1996) confirmed the existence of small enterprise owners in
Australia who are not motivated primarily by profit, underscoring the need for diverse
measures of success. Also, King (2002) suggested this manifests itself as a need for
spiritual success as well as monetary reward. Thus, non-financial success measures are
becoming more frequent in the entrepreneurship and small business literature; the
problem is one of selecting between alternate common themes.
Previously, the ABS has used a single-item measure of success, administered to small
business owners in the Characteristics of Small Business series (ABS, 1997, 1999; 2001,
2003). Confirming the inherent limitations of adopting a single-item measure of a
complex issue, other researchers have constructed a bank of four questions that seem to
cover satisfaction with both personal and financial outcomes (Kaufman, Weaver and
Poynter 1996). Space precludes a more substantive discussion around the range of
intrinsic and extrinsic motivations, goals and metrics that have been identified by
WASBB researchers (Weber et al. 2009). It is sufficient, for the purpose of this paper, to
rely on the previously validated scale to compare the identified measures of success to
their growth intentions described next.
Small Business Growth
Despite the problematic nature of defining small business success, growth of the small
firm has frequently been used by researchers as a proxy for small business success (Baum,
Locke and Smith 2001; Cliff 1998, Davidsson, Steffens and Fitzsimmons 2009; Wiklund
© 2011 RossiSmith Academic Publishing, JAES, Vol VII, Iss 2, December 2011, Refereed Edition, Page:
77
and Shepherd 2003, Runyan, Droge and Swinney 2008). While the growth of the firm
might be regarded more appropriately as a measure of organisational performance rather
than success, Murphy, Trailer and Hill (1996) argued organisational performance is
critical to understanding small business success and failure. Small business growth is
measured according to a wide range of criteria including sales and turnover growth,
market share, total assets, profitability and employee numbers (Glancey 1998, Davidsson
et al 2002, Dobbs and Hamilton 2007, Davidsson, Steffens and Fitzsimmons 2009).
Dobbs and Hamilton (2007) reviewed 34 studies on small business growth published
since the mid 1990s and found measures for growth included sales, financial growth,
assets and employment. In nearly two-thirds of these studies, the increase in employee
numbers was the key measure of small business growth (Dobbs and Hamilton 2007). The
focus of economic policy studies on the contribution of small business to economic
growth and job creation helps explain why employee numbers and growth are frequently
used measures of small business success (Hoogstra and van Dijk 2004, Schutjens and
Wever 2000, Dobbs and Hamilton 2007). According to Schutjens and Wever (2000), the
use of employee numbers as the measure of firm growth and size is the most appropriate
since assets and turnover fail to account for non-financial entrepreneurial motivations.
Since most small business owners work full-time in their businesses, most business
decisions must be made by the owners. Accordingly, the personal motivations and
intentions of business owners will impact on whether they want to grow the business or
decide to keep it to a size they are prepared to manage (Walker and Brown 2004, Cassar
2007). Consequently, the most important factor that contributes to small business growth
is the commitment of the firm’s owner to business growth (Dobbs and Hamilton 2007).
There are clear indications that many business owners deliberately refrain from pursuing
and exploiting opportunities to grow their firms (Wiklund, Davidsson and Delmar 2003).
These reasons include concern for employee well-being and the loss of the positive small
business atmosphere that engenders comradeship, involvement and job satisfaction
(Davidsson 1989, Wiklund, Davidsson and Delmar 2003).
© 2011 RossiSmith Academic Publishing, JAES, Vol VII, Iss 2, December 2011, Refereed Edition, Page:
78
The effect of growth on the owner’s ability to maintain the control of the firm’s
operations and the ability to survive crises, such as, an economic downturn and loss of
earnings, are also concerns that affect the SME owner’s willingness to expand their
business (Davidsson 1989, Wiklund, Davidsson & Delmar 2003, Dobbs and Hamilton
2007). Indeed, Wiklund, Davidsson and Delmar (2003) argued that small business
owners’ attitude to growth depended on their expected consequences of that growth. For
instance, if the small business owner expected business growth would lead to negative
consequences such as products and services of lower quality, such anticipated
consequences would lead to a negative attitude toward growth (Wiklund, Davidsson &
Delmar 2003, Davidsson 1989). This is supported by Davidsson’s (1989) research on
Swedish small firms where he found certain expected outcomes of growth are important
determinants of growth willingness (p. 222). For instance, positive motivators for
business growth such as independence and need for achievement, in many cases were
outweighed by negative consequences such as loss of control and reduced employee well-
being (Davidsson, 1989). Some owners are simply not keen to expand their business
because of deliberate ‘lifestyle’ choices (Carlsen, Morrison and Weber 2008). In fact,
many owners identify themselves as lifestylers and expect no, or limited, medium-term
growth potential for their business (Frederick, Kuratko and Hodgetts 2006; Trott 2008).
Lifestyle oriented small firms can be conceptualised as businesses set up to undertake an
activity that adds to perceived enjoyment of life in general via a level of activity that
provides adequate income to the owner (Carlsen, Morrison and Weber 2008).
Although the growth intentions of a small business owner is not a measure for real growth,
given the alternative attitudes of owners toward business growth, it is likely that these
attitudes can be used to help distinguish between growth and non-growth firms (Dobbs
and Hamilton 2007).
METHODOLOGY
Data collected from the 2008 pilot study of the Western Australian Small Business
Benchmarks Survey (Weber et al 2008) were analysed for the purpose of this paper. An
© 2011 RossiSmith Academic Publishing, JAES, Vol VII, Iss 2, December 2011, Refereed Edition, Page:
79
original total of 403 responses were received; 13 questionnaires were not used due
incomplete responses or other unresolvable problems. Of the remaining 390 responses, a
further 39 were removed as being from persons in organizations too large to qualify as
small businesses by our adopted definition. Seven responses were also removed that
ignored other exclusion criteria such as being not-for-profit entities or businesses that had
not traded for a full financial year. Finally, four respondents from the remaining data set
did not provide their growth intentions for their business and were also excluded from
analysis. This meant a pool of 340 respondents was available for analysis (n=340).
This cross-sectional survey of Western Australian small businesses included a previously
tested 4-item, five-point Likert scale on perceived personal success that accounted for the
owners’ sense of achievement of personal, business and financial goals. The
aforementioned perceived success scale was used in this study, and, as in previous studies
(Weber and Schaper 2007; Weber 2008) was found to be a stable, uni-dimensional and
reliable indicator of perceived success. The scale was internally reliable with a
coefficient Alpha (Cronbach 1951) of 0.931. In addition, the scale has excellent uni-
dimensionality with the one factor solution accounting for nearly 83 percent (82.92%) of
total variance. In this particular sample, the Kaiser Meyer Olkin test of sampling
adequacy was a high .856 which is to be expected from a reliable scale drawn from a
sufficiently large sample. In addition, Bartlett’s test of sphericity was significant (0.000
level), further indication of the existence of a single success factor. Therefore, one can be
confident that the analysis is based upon respondents who reliably report on their
‘success’. The four items that constitute the perceived success scale are reproduced
below:
My business has fulfilled or is fulfilling my personal goals
My business has fulfilled or is fulfilling my financial goals.
My business is a success
I have accomplished or am accomplishing what I wanted to do with my business
© 2011 RossiSmith Academic Publishing, JAES, Vol VII, Iss 2, December 2011, Refereed Edition, Page:
80
All items were scored using a five point likert scale with anchors of strongly disagree and
strongly agree.
Sample Profile
Some descriptive statistics for a range of variables will be looked at to examine the data
set more closely. The variables that will be examined include size of the business in
terms of the number of full-time employees, the number of years the owner had been in
the business, the sales turnover of firms in the study and a breakdown of the ANZSIC
industry sectors represented in the study.
The mean number of full-time employees in the businesses surveyed in the study (n=340)
was 4.66, with a standard deviation of 8.39, ranging from a minimum of zero employees
to 48 full-time staff. The majority of businesses within the sample did not have any full-
time employees. This group of 154 businesses represented 45.3% of the respondents.
Businesses with 1-4 employees made up the next largest segment of businesses (90) in
this group representing 26.5% of firms in the study. The next largest segment of
businesses was the 5-19 employee group accounting for a further 72 businesses (21.1%)
in the study. Finally, 24 firms had between 20-49 employees (7.1%).
The number of years the owners had been in their business was also measured. The mean
of business ownership years was 13.67. The lowest amount of years the business had
been owned was 2 years, which was no doubt impacted by the minimum requirement of
12 months ownership for this study. There was a wide range of sales turnover reported by
survey respondents (n=276). The reluctance of some business owners to reveal financial
details of their business was reflected by the number of businesses (64) that did not
provide turnover figures. The lowest reported annual sales turnover figure was $1000 and
the maximum was $9 million. Mean turnover was $1.47 million with a standard
deviation of $2.05 million. Over 60% of businesses reported a turnover of $1 million per
year or less while 25 businesses (15.1%) reported earnings of $5 million or more per year.
Survey respondents were grouped into their respective ANZSIC industry sectors (2006)
based on the description of their business activities. The main divisions represented in the
© 2011 RossiSmith Academic Publishing, JAES, Vol VII, Iss 2, December 2011, Refereed Edition, Page:
81
survey were professional, scientific and technical services (85 firms accounting for 25%
of sample); other services (32 firms, 9.4%); retail trade (32 firms, 9.4%); manufacturing
(30 firms, 8.8%); and construction (28 firms, 8.2%). The “other services” category
represents businesses that offer services such as repair and maintenance, personal care
services and civic and religious services (Australian Bureau of Statistics 2006). The
study was a cross-section of WA businesses and at least one business represented each of
the different ANZSIC industry sectors. This demonstrated the broad range of businesses
that responded to the survey. There were 12 businesses that could not be categorised into
an industry grouping for lack of description of business activity. Businesses were present
from most of the geographical regions of Western Australia.
The Analyses
Analyses were conducted on the data using SPSS version 17 and EQS 6.1. The analyses
of the survey results for the overall success score included an independent t-test analysis
to compare the means of the business owners who indicated a preference to grow their
business and business owners who did not. Additionally, a Pearson correlation analysis
on the business owner’s growth intention and two measures, turnover and lifestyle was
also examined. Finally, confirmatory factor analyses of the success scale were conducted
on the overall sample as well as the growth versus non-growth sub-groups within the
sample.
Independent t-test Analysis
An overall success score representing the sum of the four items was obtained for each
respondent. The growth intentions of the business owners were ascertained depending on
their selection of two options that best described their preference for the future size of
their business – “I want the business to be as large as possible “ or “I want a size I can
manage myself or with a few key employees” (Cassar 2007). Of the 340 respondents,
177 indicated the intention to grow their business and 163 chose the non-growth option.
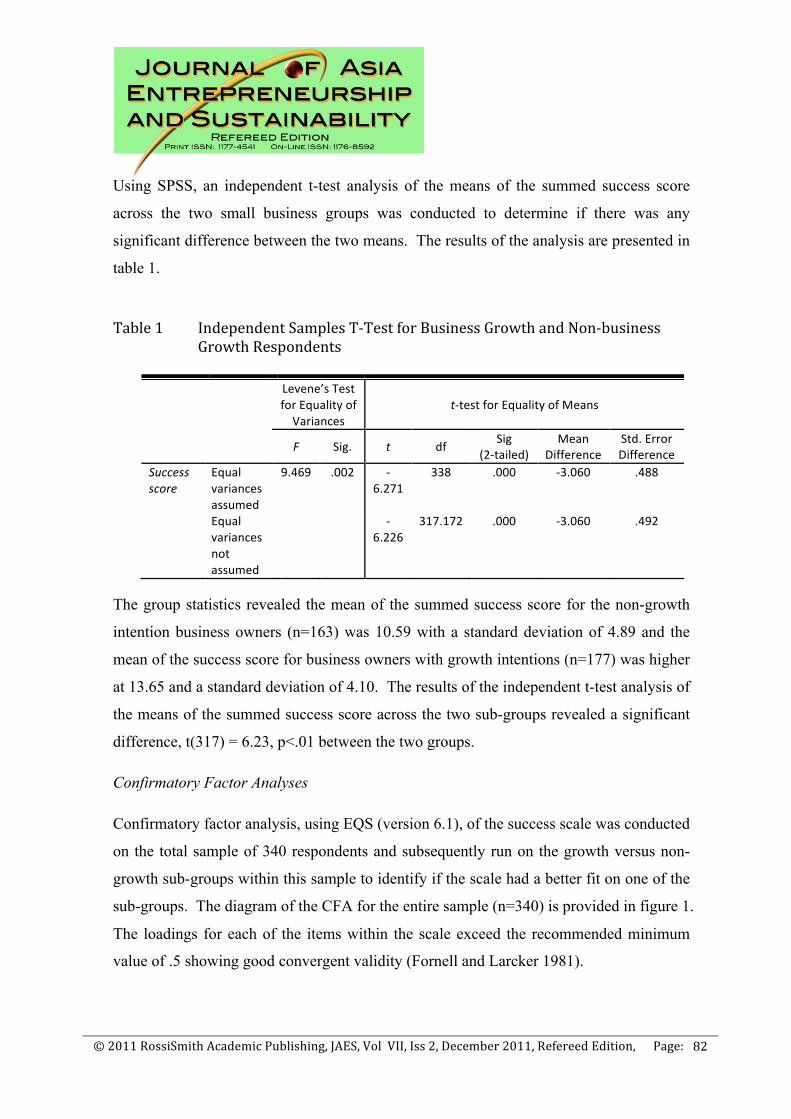
© 2011 RossiSmith Academic Publishing, JAES, Vol VII, Iss 2, December 2011, Refereed Edition, Page:
82
Using SPSS, an independent t-test analysis of the means of the summed success score
across the two small business groups was conducted to determine if there was any
significant difference between the two means. The results of the analysis are presented in
table 1.
Table 1 Independent Samples T-‐Test for Business Growth and Non-‐business
Growth Respondents
Levene’s Test for Equality of Variances
t-‐test for Equality of Means
F Sig. t df Sig (2-‐tailed)
Mean Difference
Std. Error Difference
Success score
Equal variances assumed
9.469 .002 -‐6.271
338 .000 -‐3.060 .488
Equal variances not assumed
-‐6.226
317.172 .000 -‐3.060 .492
The group statistics revealed the mean of the summed success score for the non-growth
intention business owners (n=163) was 10.59 with a standard deviation of 4.89 and the
mean of the success score for business owners with growth intentions (n=177) was higher
at 13.65 and a standard deviation of 4.10. The results of the independent t-test analysis of
the means of the summed success score across the two sub-groups revealed a significant
difference, t(317) = 6.23, p<.01 between the two groups.
Confirmatory Factor Analyses
Confirmatory factor analysis, using EQS (version 6.1), of the success scale was conducted
on the total sample of 340 respondents and subsequently run on the growth versus non-
growth sub-groups within this sample to identify if the scale had a better fit on one of the
sub-groups. The diagram of the CFA for the entire sample (n=340) is provided in figure 1.
The loadings for each of the items within the scale exceed the recommended minimum
value of .5 showing good convergent validity (Fornell and Larcker 1981).
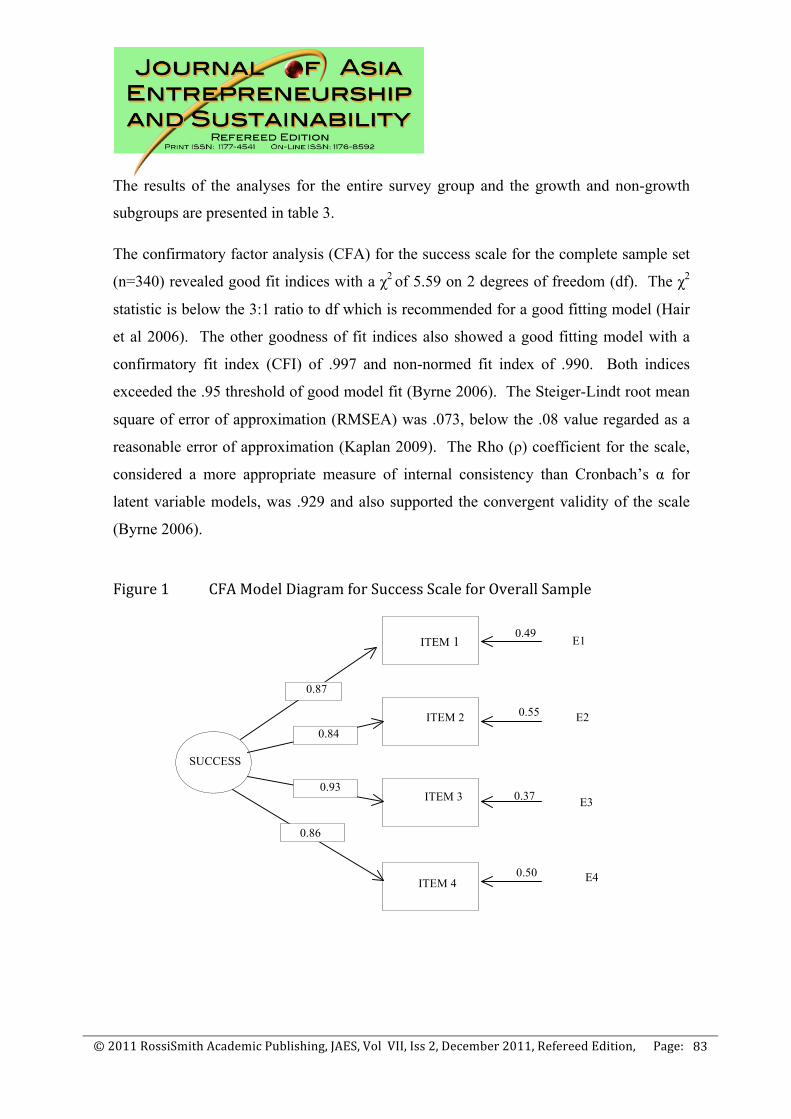
© 2011 RossiSmith Academic Publishing, JAES, Vol VII, Iss 2, December 2011, Refereed Edition, Page:
83
The results of the analyses for the entire survey group and the growth and non-growth
subgroups are presented in table 3.
The confirmatory factor analysis (CFA) for the success scale for the complete sample set
(n=340) revealed good fit indices with a χ2 of 5.59 on 2 degrees of freedom (df). The χ2
statistic is below the 3:1 ratio to df which is recommended for a good fitting model (Hair
et al 2006). The other goodness of fit indices also showed a good fitting model with a
confirmatory fit index (CFI) of .997 and non-normed fit index of .990. Both indices
exceeded the .95 threshold of good model fit (Byrne 2006). The Steiger-Lindt root mean
square of error of approximation (RMSEA) was .073, below the .08 value regarded as a
reasonable error of approximation (Kaplan 2009). The Rho (ρ) coefficient for the scale,
considered a more appropriate measure of internal consistency than Cronbach’s α for
latent variable models, was .929 and also supported the convergent validity of the scale
(Byrne 2006).
Figure 1 CFA Model Diagram for Success Scale for Overall Sample
ITEM 1
ITEM 2
ITEM 3
E1
E3
0.87
0.49
0.84 0.55
0.93 0.37
0.86
0.50 ITEM 4
E2
SUCCESS
E4
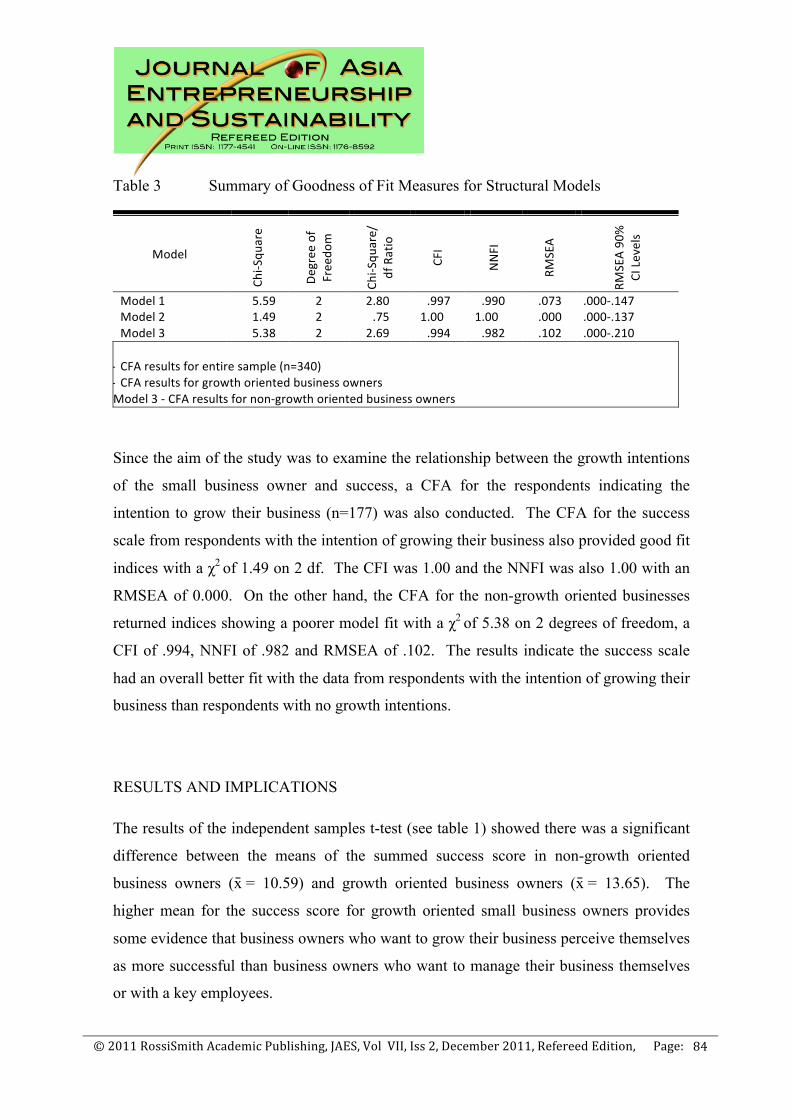
© 2011 RossiSmith Academic Publishing, JAES, Vol VII, Iss 2, December 2011, Refereed Edition, Page:
84
Table 3 Summary of Goodness of Fit Measures for Structural Models
Model Ch
i-‐Squ
are
Degree of
Freedo
m
Chi-‐Squ
are/
df Ratio
CFI
NNFI
RMSEA
RMSEA 90
%
CI Levels
Model 1 5.59 2 2.80 .997 .990 .073 .000-‐.147 Model 2 1.49 2 .75 1.00 1.00 .000 .000-‐.137 Model 3 5.38 2 2.69 .994 .982 .102 .000-‐.210
Legend Model 1 -‐ CFA results for entire sample (n=340) Model 2 -‐ CFA results for growth oriented business owners
Model 3 -‐ CFA results for non-‐growth oriented business owners
Since the aim of the study was to examine the relationship between the growth intentions
of the small business owner and success, a CFA for the respondents indicating the
intention to grow their business (n=177) was also conducted. The CFA for the success
scale from respondents with the intention of growing their business also provided good fit
indices with a χ2 of 1.49 on 2 df. The CFI was 1.00 and the NNFI was also 1.00 with an
RMSEA of 0.000. On the other hand, the CFA for the non-growth oriented businesses
returned indices showing a poorer model fit with a χ2 of 5.38 on 2 degrees of freedom, a
CFI of .994, NNFI of .982 and RMSEA of .102. The results indicate the success scale
had an overall better fit with the data from respondents with the intention of growing their
business than respondents with no growth intentions.
RESULTS AND IMPLICATIONS
The results of the independent samples t-test (see table 1) showed there was a significant
difference between the means of the summed success score in non-growth oriented
business owners (x̄ = 10.59) and growth oriented business owners (x̄ = 13.65). The
higher mean for the success score for growth oriented small business owners provides
some evidence that business owners who want to grow their business perceive themselves
as more successful than business owners who want to manage their business themselves
or with a key employees.
© 2011 RossiSmith Academic Publishing, JAES, Vol VII, Iss 2, December 2011, Refereed Edition, Page:
85
A significant t-test result does not mean much unless the size of the effect it measures is
also calculated. Using the “t” value and the degrees of freedom, the size of the effect, r,
can also be calculated (Field 2005). The resultant value of .33 is considered a medium
effect and reinforces the significance of the result. Admittedly, the intention to achieve
business growth is not a measure of real growth but the results provide some argument
supporting the perception that business growth and success are related.
The results of the confirmatory factor analyses revealed the success scale had a
reasonable fit with the data with overall good fit indices. The RMSEA result is
considered an important goodness-of-fit statistic particularly because it has the advantage
of having a confidence interval that accompanies it (McQuitty 2004). The RMSEA for
the success scale on the main sample (n=340) was .073, a result deemed acceptable
because it was below the .08 threshold value for a reasonable error of approximation
(Kaplan 2009). The fit indices, and particularly the RMSEA for the success scale on the
growth intent group (n=177) of .000, show an overall better fit than that for the entire
sample. The result suggests that success has an overall better fit with business owners
that are oriented towards the growth of their business. The RMSEA of .102 for the non-
growth business owners’ group (n=163) shows a poorer fit with the data and also supports
the finding that the success scale has a better fit with the growth oriented group. Caution
should be taken when interpreting the model fit results, however, since the upper bound
of the 90% confidence interval for the RMSEA result (see table 3) exceeds .1 for each
sample group, a result that indicates the model has low statistical power (McQuitty 2004).
Upper bound levels exceeding .1 indicate problems with model fit; however, this might be
a reflection of the small model size, represented by the very low degrees of freedom
associated with the model (df = 2) and the relatively small sample size (McQuitty 2004).
The overall results of the analyses lend support to H1, that there is a relationship between
small business success and the owner’s growth intentions. The results showed this
relationship to be a positive one, i.e. that the owner’s intention to grow their business has
a positive relationship with their self-perception of success. The results show a
relationship but do not imply any causality between business growth and self-perception
of success. The result might indicate that business owners, who perceive themselves as
© 2011 RossiSmith Academic Publishing, JAES, Vol VII, Iss 2, December 2011, Refereed Edition, Page:
86
successful after having fulfilled personal and financial goals, have a greater disposition
toward business growth particularly if they expect this growth to lead to further goal
attainment (Wiklund, Davidsson and Delmar 2003). This would show a temporal
relationship between business growth and self-perception of success and is an avenue for
future research. Another important outcome of this study was the successful application
of Weber’s (2006) perceived success scale on a diverse sample of small business owners.
The scale proved to be a robust way of measuring success perceptions, with this simple
scale exhibiting a very good Cronbach alpha of 0.931.
CONCLUSION
While the findings are only preliminary and more research is required to examine the
relationship between business growth and perceived success, the study provides some
evidence that business owners who adopt a growth orientation to their business might
have a higher self-perception of success than their non-growth counterparts. Another
finding from the study is a reliable four-item scale of a business owner’s self-perceived
success. There are a number of limitations associated with this study. One limitation is
the use of the business owner’s intent to grow their business as a proxy for business
growth. Simply because a business owner wishes to expand the size of their business in
terms of employee numbers does not necessarily mean that the business will achieve
growth. Another limitation of the study is the relatively small sample size used for the
confirmatory factor analyses and the small model size (in terms of df). This affected the
assessment of the overall statistical power of the model.
Nevertheless, the significant findings of the independent t-test analysis justify further
investigation in the relationship between success and business growth. Further research
to determine the extent to which self-perceived success and growth intentions are
correlated is required. Additionally, research examining the direction of a potential
causal relationship between growth intent and perceived venture success would also be
beneficial. An examination of the correlation in temporal terms could also be conducted
© 2011 RossiSmith Academic Publishing, JAES, Vol VII, Iss 2, December 2011, Refereed Edition, Page:
87
in a future study provided data were collected at multiple time points. The results also
have implications for a number of research and policy settings:
If owners who are growth oriented are also predisposed to positive self perceptions of
their own success, this may result in spurious correlations being explained in some studies
on small business growth.
Where policy makers are intent upon supporting growth oriented firms, use of success
perception scales may be one means of identifying likely candidates for additional
support since it appears to be an indicator of growth intentions. The use of such scales
could be more effective if the direction of causality between self-perceived success and
growth intentions was known and this, as mentioned earlier, would be a promising avenue
for further research.
Looking at the no growth ‘lifestyle group’ is it plausible to suggest that the lower levels
of success perception associated with this group could be somewhat of a self fulfilling
prophesy? If this were the case then one way to encourage the business growth so often
chased by market commentators and management advisors would be a focus upon
measuring and quantifying success that is relevant in the business owner’s eyes.
REFERENCES Australian Bureau of Statistics 1997, Characteristics of Small Business Cat. 8127.0,
A.B.S., Canberra. Australian Bureau of Statistics 1999, Characteristics of Small Business, Australia Cat.
8127.0, A.B.S., Canberra. Australian Bureau of Statistics 2001, Characteristics of Small Business, Australia Cat.
8127.0, A.B.S., Canberra. Australian Bureau of Statistics 2003, Characteristics of Small Business, Australia Cat.
8127.0, A.B.S., Canberra. Australian Bureau of Statistics 2006, Australian and New Zealand standard industrial
classification (ANZSIC), ABS cat no. 1292.0, Commonwealth Government, Canberra. Baum, JR, Locke, EA and Smith, KG 2001, 'A multidimensional model of venture
growth', The Academy of Management Journal, vol. 44, no. 2, pp. 292-303. Byrne, BM 2006, Structural Equation Modeling with EQS: Basic Concepts, Applications,
and Programming, 2nd edn., Lawrence Erlbaum Associates, Inc., Mahway, NJ.
© 2011 RossiSmith Academic Publishing, JAES, Vol VII, Iss 2, December 2011, Refereed Edition, Page:
88
Carlsen, J, Morrison, A and Weber, P 2008, 'Lifestyle Oriented Small Tourism Firms', Tourism Recreation Research, vol. 33, no. 3, pp. 255-63.
Cassar, G. 2007, ‘Money, money, money? A longitudinal investigation of entrepreneur career reasons, growth preferences and achieved growth’, Entrepreneurship and Regional Development, vol. 19, no 1, pp. 89-107
Cliff, JE. 1998, 'Does one size fit all? Exploring the relationship between attitudes towards growth, gender, and business size', Journal of Business Venturing, vol. 13, pp. 523-542.
Cronbach, LJ 1951, 'Coefficient Alpha and the Internal Structure of Tests', Psychometrika, vol. 16, no. 3, pp. 297-335.
Curran, J and Blackburn, R 2001, Researching the Small Enterprise, Sage Publications Ltd, London.
Davidsson, P 1989, 'Entrepreneurship - and after? A study of growth willingness in small firms', Journal of Business Venturing, vol. 4, pp. 211-226.
Davidsson, P, Kirchhoff, B, Hatemi-J, A and Gustavsson, H 2002, 'Empirical analysis of business growth factors using Swedish data', Journal of Small Business Management, vol. 40, no. 4, pp. 332-349.
Davidsson, P, Steffens, P and Fitzsimmons, J 2009, 'Growing profitable or growing from profits: putting the horse in front of the cart?', Journal of Business Venturing, vol. 24, no. 4, pp. 388-406.
Dees, GJ 1998, 'The Meaning of "Social Entrepreneur"'. Kauffman Centre for Entrepreneurial Leadership.
Dobbs, M and Hamilton, RT 2007, 'Small business growth: recent evidence and new directions', International Journal of Entrepreneurial Behaviour and Research, vol. 13, no. 5, pp. 296-322.
Field, A 2005, Discovering Statistics Using SPSS, 2nd edn. Sage Publications, London, UK.
Fornell, C and Larcker D 1981, ‘Evaluating structural equation models with unobservable variables and measurement error’, Journal of Marketing Research, vol. 18, pp. 39-50.
Frederick, HH, Kuratko, DF and Hodgetts, RM 2006, Entrepreneurship: Theory Process Practice, Thomson Learning, South Melbourne.
Frese, M, Brantjes, A and Hoorn, R 2002, 'Psychological Success Factors of Small Scale Businesses in Namibia: The Roles of Strategy Process, Entrepreneurial Orientation and the Environment', Journal of Developmental Entrepreneurship, vol. 7, no. 3, pp. 259-82.
Geneste, L 2010, Knowledge Acquisition by SMEs in Weak Client-Firm Exchange Relationships, unpublished doctoral dissertation, Curtin University.
Glancey, K 1998, 'Determinants of growth and profitability in small entrepreneurial firms', International Journal of Entrepreneurial Behaviour and Research, vol. 4, no. 1, pp. 18-27.
Hair, JF, Black, WC, Babin, BJ, Anderson, RE and Tatham, RL 2006, ‘Multivariate data analysis’, 6th edn, Prentice-Hall, Upper Saddle River, NJ.
Hoogstra, GJ and van Dijk, J 2004, 'Explaining firm employment growth: does location matter?’, Small Business Economics, vol. 22, pp. 179-192.
Jenkins, M and Johnson, G, 'Entrepreneurial intentions and outcomes: a comparative causal mapping study', Journal of Management Studies, vol. 34, no. 6, pp. 895-920.
© 2011 RossiSmith Academic Publishing, JAES, Vol VII, Iss 2, December 2011, Refereed Edition, Page:
89
Jennings, P and Beaver, G 1997, 'The Performance and Competitive Advantage of Small Firms: A Management Perspective', International Small Business Journal, vol. 15, no. 2, pp. 63-75.
Kaplan, D 2009. ‘Structural equation modeling – foundations and extensions’, 2nd edn., Sage Publications, Inc. Thousand Oaks, California.
Kaufman, TJ, Weaver, PA and Poynter, J 1996, 'Success Attributes of BandB Operators', Cornell Hotel and Restaurant Administration Quarterly, vol. 37, no. 4, pp. 29-33.
King, S 2002, 'Entrepreneurs' Measure of Success: Is it More Than Profits?', Proceedings of the 47th World Conference of the International Council for Small Business (ICSB), SBANC University of Central Arkansas, 16 -19 June,San Juan, Puerto Rico.
Kuratko, DF, Hornsby, JS and Naffgizer, DW 1997, 'An Examination of Owner's Goals in Sustaining Entrepreneurship', Journal of Small Business Management, vol. 35, no. 1, pp. 24-33.
LeCornu, MR, McMahon, RGP, Forsaith, DM and Stanger, A, M.J. 1996, 'The Small Enterprise Financial Objective Function', Journal of Small Business Management, vol. 34, no. 3, pp. 1-14.
McQuitty, S 2004, 'Statistical power and structural equation models in business research', Journal of Business Research, vol. 57, pp. 175-183.
Murphy, G, Trailer, JW and Hill, RC 1996, 'Measuring performance in entrepreneurship research', Journal of Business Research, vol. 36, pp. 15-23.
Robichaud, Y, McGraw, E and Roger, A 2001, 'Toward the Development of a Measuring Instrument for Entrepreneurial Motivation', Journal of Developmental Entrepreneurship, vol. 6, no. 2, pp. 189-201.
Runyan, R, Droge, C and Swinney, J 2008, 'Entrepreneurial orientation versus small business orientation: what are their relationships to firm performance? Journal of Small Business Management, vol. 46, no. 4, pp. 567-588.
Schutjens, VAJM and Wever, E 2000, 'Determinants of new firm success', Papers in Regional Science, vol. 79, pp. 135-159.
Still, LV and Soutar, GN 2001, Start-Up Goals and Later Satisfaction of Small Business Proprietors: Report No. 2001-03, Centre for Women and Business, University of Western Australia, Perth.
Still, LV, Soutar, GN and Walker, E 2005, 'The Impact of Gender and Generation On the Start-up Goals and Satisfaction Of Home-Based and Commercial Enterprises', Small Enterprise Research, vol. 13, no. 1, pp. 72-9.
Trott, P 2008, Innovation management and new product development, 4th edn, Pearson Education Limited, Essex.
Walker, E and Brown, A 2004, 'What success factors are important to small business owners?', International Small Business Journal, vol. 22, no. 6, pp. 577-594.
Weber, P and Schaper, M 2007, 'Are Mature (Grey) Entrepreneurs More Successful Than Their Younger Counterparts?: A Study of Australian Tourism Hosted Accommodation Owners', Proceedings of the Small Enterprise Conference: Building Sustainable Growth in SMEs, Manakau City, Auckland.
Weber, P 2006, Understanding mature small business owners: success and age-related correlates of success within the Western Australian Tourism Industry, Doctoral Dissertation Thesis, Curtin University of Technology.
© 2011 RossiSmith Academic Publishing, JAES, Vol VII, Iss 2, December 2011, Refereed Edition, Page:
90
Weber, P 2008. 'Reporting the relatively lower success of women in hosted accommodation in rural Western Australia,' Tourism Recreation Research, vol. 33, no. 3, pp. 327-332.
Weber, P, Geneste, L, Schaper, M and Soontiens, W 2009, Western Australian Small Business Benchmarks 2008: An initiative of Curtin Business School to inform small business, Curtin University of Technology, Perth, ISBN: 1 74067599 1. www.business.curtin.edu.au/business/teaching-areas/management/research/western-australian-small-business-benchmarks
Wiklund, J, Davidsson, P and Delmar, F 2003, 'What do they think and feel about growth? An expectancy-value approach to small business managers’ attitudes toward growth', Entrepreneurship Theory and Practice, vol. 27, no. 3, pp. 247-70.
Wiklund, J and Shepherd, D 2003, 'Knowledge-based resources, entrepreneurial orientation, and the performance of small and medium-sized businesses', Strategic Management Journal, vol. 24, pp. 1307-14.
© 2011 RossiSmith Academic Publishing, JAES, Vol VII, Iss 2, December 2011, Refereed Edition, Page:
91
THE PARADOXICAL NATURE OF VENTURE FAILURE
Noga Gulst and Alex Maritz Swinburne University Of Technology, Hawthorn, Australia
ABSTRACT
New Venture Failure (NVF) is a well researched field, placing emphasis on the
importance of learning and recovering from. However, studies about what it is that one
can learn from NVF are scant. This exploratory, qualitative study explores how 27
experienced Australian entrepreneurs and intrapreneurs perceive new venture failure, and
what they have learned from it. The research used practice-based theories to convert the
participants’ experiences into academic theories. The data was analysed using cognitive
maps for categorising and sorting the data, and classic content and word count techniques
for the analyses. We conclude with a conceptual list of advice to help novice and nascent
entrepreneurs and intrapreneurs succeed in their first venture/s, as suggested by the
participants. A significant addition to the body of knowledge in this domain is depicted.
Since this study is a first of its kind to integrate entrepreneurial learning and new venture
failure, the following finding is highlighted: Venture failure is not perceived in a negative
context by entrepreneurs, as long as they learn from the experience/s. As such, it is
identified that ventures fail, not entrepreneurs! This finding would, however, provide a
base for further empirical research into the psychological aspects of entrepreneurs’
perceptions to new venture failure.
© 2011 RossiSmith Academic Publishing, JAES, Vol VII, Iss 2, December 2011, Refereed Edition, Page:
92
INTRODUCTION
This study explores the relationship between two fields: new venture failure and
entrepreneurial learning.
The nature of the “failure paradox” is composed from three parts:
1. Lack of a common definition for business and new venture failure - Watson and
Everett (1993) summarised the definition of business failure into four main
definitions: business closure for any reason, business disposed to prevent further
losses, bankruptcy and failing to “make a go of it”. This research approach to venture
failure is based on the entrepreneurs’ decision only, regardless of the objective state of
the venture. Therefore, the definition of new venture failure is a nuance of “make a go
of it” that is, described as “the entrepreneurs’ dissatisfaction of the venture’s
progression”.
2. Cultural base attitude toward business and new venture failure - The attitude towards
failure is culturally based (Cave, Eccles, & Rundle, 2001). In the US, the attitude
towards failure is mainly positive, whilst in other countries, such as the UK and Japan,
it is negative.
3. Confusion between entrepreneurs who closed their business and ‘unsuccessful’
entrepreneurs - or in other words, between venture failure and failed entrepreneurs
(Sarasvathy & Menon, 2003; Stokes & Blackburn, 2002).
In this research, entrepreneur is defined as “an individual who applies innovative
solutions to opportunities in new or existing organisations”, emphasising that
entrepreneurs are found in established businesses as in new ventures. This definition is
based on McKenzie and Sud (2008: 127), who stressed that entrepreneurs are individuals
who can “see what is not there”.
The second field this study explores is entrepreneurial learning, including learning by
entrepreneurs and organisations. The research accepts that learning is a combination of
cognitive and behavioural learning approaches (Corbett, 2005), stating that learning is a
creation of knowledge that leads to a behavioural change.
© 2011 RossiSmith Academic Publishing, JAES, Vol VII, Iss 2, December 2011, Refereed Edition, Page:
93
It is suggested that entrepreneurs prefer to learn from experience rather than from theories
(Rae, 2004b). This type of learning is described as action learning. Action learning
concepts were originally developed as a method for combining theory and practice in the
entrepreneurial learning style(Harrison & Leitch, 2005). Entrepreneurs learn from every
action they perform, gaining experience from both successful and failed procedures,
however they will learn more from critical events (Deakins & Freel, 1998). Furthermore,
Sitkin (1992) suggest that entrepreneurs’ and organisations’ learning from successful
procedures may result in a repetition of the same procedures that may be performed better,
but they do not add to learning as they do not produce cognitive thinking on the
procedures and as a result the influence is only on the short term performance. Therefore,
the outcomes of failure should be a cognitive reflection on the
organisational/entrepreneurial behaviour and performance, using the failure as a learning
stage for better performance in the future (Sitkin, 1992).
The aim is to find how entrepreneurs and intrapreneurs define new venture failure and
what they learn from it.
Most of the academic literature enforces the importance of learning from new venture
failure, however the research on what is it that can be learned from it is scant. Therefore,
this study adds to the growing body of entrepreneurial research by combining
entrepreneurial learning and new venture failures, Figure 1 demonstrate the research place
in the knowledge base.
The article will commence in classifying entrepreneurship typology and new venture
failure emphasising on its paradoxical nature. Research questions and proposition are then
stated. The article will continue with methodology, findings and discussion and will
conclude with conclusions, limitations and suggestions for future research.
© 2011 RossiSmith Academic Publishing, JAES, Vol VII, Iss 2, December 2011, Refereed Edition, Page:
94
LITERATURE REVIEW
Entrepreneurship Typology
We acknowledge Bolton and Thompson’s (2004) definition that entrepreneurship is not
only about generating revenue or the creation of new organisations. However, we notice
the significance of adding the opportunity recognition to the definition, as suggested by
Drucker (1993), McKenzie & Sud (2008) and Wooldridge (2009), emphasising that
entrepreneurs are individuals and not a group of people. An organisation may employ
more than one entrepreneur, but each entrepreneur is an individual, that may start a new
venture or exploit a new opportunity. Furthermore, we recognize Sharma and Chrisman
(2007) addition of corporate entrepreneurs (intrapreneurs) to the general definition of
entrepreneurs. Therefore, we define entrepreneur as “an individual who applies
innovative solutions to opportunities in new or existing organisations”.
Entrepreneurship is frequently related to the start-up of new organizations, though
entrepreneurship can happen in any organisation regardless of its size, maturity or type
(Morris, Kuratko, & Covin, 2008). This type of entrepreneurship is called
intrapreneurship, corporate entrepreneurship or corporate venturing, and is mostly defined
as entrepreneurship within an existing corporate structure (Bager, Ottosson, & Schott,
2010; Burns, 2008; Fitzsimmons, Douglas, Antoncic, & Hisrich, 2005; Menzel, Aaltio, &
Ulijn, 2007; Shepherd & Katz, 2004) (or entrepreneurial behaviour in an established,
larger organisation (Burns, 2008; Morris et al., 2008). The level of entrepreneurship
varies between the different organisations, with 3-M and Microsoft on the high side of the
continuum and big bureaucratic firms on the low end (Morris et al., 2008).
Entrepreneurs and intrapreneurs are similar in many respects but, at the same time, their
working in different environments means that an emphasis must be placed on the
differences between them as well. As do intrapreneurs and entrepreneurs,
intrapreneurship and entrepreneurship have both similarities and differences (Hisrich,
1990; Morris et al., 2008). Table 1 summarise the similarities and differences between
intrapreneurs and entrepreneurs.
© 2011 RossiSmith Academic Publishing, JAES, Vol VII, Iss 2, December 2011, Refereed Edition, Page:
95
Regardless of the entrepreneur’s definition, entrepreneurship literature mentions six types
of entrepreneurs: nascent, novice, one time, serial, portfolio and habitual entrepreneurs.
This section will define each entrepreneur type as found in the relevant literature and
show the connection between the entrepreneur’s type and organisation / entrepreneurial
failure.
1. Nascent Entrepreneurs – Nascent entrepreneurs are individuals who have made their
first steps towards starting their first new venture (Bosma & Harding, 2006; Gulst &
Maritz, 2009). The venture may be a new business (start-up) or embedded in a mature
business. These nascent entrepreneurs may become managers of a start-up, or lead the
new venture in the business that employs them. For these people, as they are not yet
entrepreneurs, failure is just a risk they take into consideration when deciding to
become entrepreneurs. Whether they will become successful or failed entrepreneurs in
the future, only their actions will tell.
2. Novice Entrepreneurs – Novice entrepreneurs are entrepreneurs that started their first
venture (Amaral & Baptista, 2006; Gulst & Maritz, 2009), regardless if it is a new
business or a new venture. They are less experienced and will either stay one-time
entrepreneurs or become habitual entrepreneurs. Failure in this case will be
determined by their future activities and depend on their reaction if their first venture
will fail.
3. One-Time Entrepreneurs – One-time entrepreneurs are entrepreneurs that started their
first venture, and did not start other ventures (Gulst & Maritz, 2009; Sarasvathy &
Menon, 2003). The entrepreneur of this type will continue to develop and grow this
venture if it succeeds or return to employment if it failed. This is the only group of
entrepreneurs that this research regards as failure, as they ceased their entrepreneurial
activities, and by doing so conform to Saravasthy and Menon’s (2003) definition.
4. Habitual Entrepreneurs –Habitual entrepreneurs are entrepreneurs that start new
ventures consistently (Gulst & Maritz, 2009; Westhead & Wright, 1998), one at a
time or simultaneously. The important concept here is that, regardless of the result of
their venture (failure or success), they will start a new one. The failures and successes
of this group are always considered in retrospect, at the end of their entire
© 2011 RossiSmith Academic Publishing, JAES, Vol VII, Iss 2, December 2011, Refereed Edition, Page:
96
entrepreneurial careers. In this research, this group will be addressed as successful
entrepreneurs, accepting the claims of Sarasvathy and Menon (2003) and Timmons
and Spinelli (2009) that there are no failed habitual entrepreneurs, just failed ventures
a. Serial Entrepreneurs – Serial entrepreneurs are habitual entrepreneurs who
create new ventures, one at a time (Gulst & Maritz, 2009). The ventures can be
a new business (Bosma & Harding, 2006; Florin, 2005) or embedded in a
mature business (Morris et al., 2008; Sharma & Chrisman, 2007). This
research adds the intrapreneurs to the category of serial entrepreneurs.
Although they do not open new businesses, or may even not run the business
in which they are employed, they habitually create new ventures in their
business (or in the business in which they work). Disregarding these
entrepreneurs would suggest that entrepreneurs like Bill Gates are one-time
entrepreneurs and not serial entrepreneurs, as suggested above. As mentioned
earlier, as the serial entrepreneurs are a sub-group of the habitual
entrepreneurs, they will always be considered as successful entrepreneurs.
b. Portfolio Entrepreneurs – Portfolio entrepreneurs are habitual entrepreneurs
who create, manage and/or lead new ventures, simultaneously (Gulst &
Maritz, 2009; Ucbasaran, Westhead, & Wright, 2008). They are involved in
multiple new businesses and/or multiple new ventures embedded in mature
business at the same time. The primary characteristic of this type of
entrepreneur is that they divide their attention between a number of ventures
instead of focusing on one. As with the serial entrepreneurs, these
entrepreneurs are treated as successful, regardless of the success or failure of a
specific venture
New Venture and Business Failure
The attitude towards failure is culturally based. While the attitude in the USA towards
failure is mainly positive, the attitude towards failure in other countries, such as the UK
and Japan is negative. This is the nature of the “failure paradox” (Cope, Cave, & Eccles,
2008; Landier, 2005; Lee & Peterson, 2000).
© 2011 RossiSmith Academic Publishing, JAES, Vol VII, Iss 2, December 2011, Refereed Edition, Page:
97
However, before trying to understand this paradox, one should understand the
phenomenon of business and new venture failure. The academic literature does not agree
on a common definition for business failure (Watson & Everett, 1993). Researchers
define failure as it fits their research question and the failure ratio they wish to indicate.
Therefore, Pretorius (2009) suggests that there is a lack of comparability in research
outcomes.
Watson and Everett (1993) summarised four main definitions for business failure;
discontinuance for any reason, disposed to prevent further losses, bankruptcy and falling
short of goals. They argued that the failure rates changes according to the failure
definition between the two extremes – discontinues for any reason (highest failure rate)
and bankruptcy (lowest failure rate), where disposal to prevent further losses is between
them. However, falling short of goals is outside of this continuum, as it is defined by the
entrepreneurs themselves and not by the authorities or any other outside observer.
Hence, this research approach to venture failure is based on the entrepreneurs’ decision
only, regardless of the objective state of the venture / business. Therefore, the definition
of new venture failure is a nuance of “falling short of goals” and is described as “the
entrepreneurs’ dissatisfaction of the venture’s progression” (Gulst & Maritz, 2010).
We differentiate between a new venture and an organisation. A new venture is any
creation of a new product or service while an organisation is a legal entity. The new
venture can be the whole organisation (as in a start-up) or embedded in a mature
organisation.
This is the most appropriate failure definition for this research as the unit of measure in
the research are the entrepreneurs and intrapreneurs rather than their businesses.
Furthermore, this definition is appropriate to business failure as well as new venture
failure.
© 2011 RossiSmith Academic Publishing, JAES, Vol VII, Iss 2, December 2011, Refereed Edition, Page:
98
The Paradoxical Nature of New Venture Failure
The attitude towards failure is ambivalent. The first intuitive feeling about business
failure is that it is something to avoid. Utterance as the next citation is a common attitude
towards business failure:
“In our culture, failure is anathema. We rarely hear about it, we never dwell on it and
most of us do our best never to admit to it. Especially in organizations, failure is often
simply not tolerated and people avoid being associated with failure of any kind” (Berg &
Mirvis, 1977).
On the other hand, failure is thought to be a good teacher, as is understood from the next
citations:
“The process of learning from business failure also benefits society, through the
application of that knowledge to subsequent businesses.” (Shepherd, 2003: 318)
Therefore, entrepreneurs will not want their names connected to a failed venture, as there
is a tendency to confuse between failed ventures and failed entrepreneurs (Politis &
Gabrielsson, 2009; Sarasvathy & Menon, 2003; Stokes & Blackburn, 2002). Some of the
researchers see it from a positive point of view as long as it is used as a learning stage for
better future performance (Connell et al., 2001; Knott & Posen, 2005; Sitkin, 1992).
Others argue that although the failure is a learning stage, organisations and entrepreneurs
may find it a difficult way to learn (Cannon & Edmondson, 2005), and therefore may
discard it.
Furthermore, as mentioned earlier, the attitude toward business failure has a geographical
perspective. While in the US, failure is taken as part of the entrepreneurs’ learning curve,
in Europe and Japan, failure is seen as a negative outcome, and entrepreneurs will find it
difficult to fund their next venture if they failed in the first one (Cope et al., 2008; Landier,
2005; Lee & Peterson, 2000).
Cave, Eccles and Rundle (2001) researched the different attitudes between entrepreneurs
that experienced failed ventures in the UK and in the USA. They found that in the UK,
© 2011 RossiSmith Academic Publishing, JAES, Vol VII, Iss 2, December 2011, Refereed Edition, Page:
99
entrepreneurs admitted that the fear of failure had hindered their growth rate and they
took fewer risks, as it was difficult to remove the failed entrepreneurs’ stigma that was
associated with the venture’s failure. Once more, the entrepreneurs felt that their venture
failure was attached to them personally. While in the US the entrepreneurs saw the failure
as a learning process that helps them to become more resilient. The main difference
between entrepreneurs from both countries lays in the culture of the countries (Lee &
Peterson, 2000). Furthermore, as the attitude towards the failure is negative, entrepreneurs
will spend resources on avoiding failure instead of learning from the failure (McGrath,
1999).
New Venture Failure as Opposed to Entrepreneur’s Failure
“Failure doesn’t mean you are a failure it just means you haven’t succeeded yet”
(Schuller, 2006)
The third part of the paradoxical nature of new venture failure is the confusion between
entrepreneurs that closed their business versus “unsuccessful” entrepreneurs. In other
words, between venture failure and failed entrepreneurs (Sarasvathy & Menon, 2003;
Stokes & Blackburn, 2002). When a venture fails, in any definition of failure, the
entrepreneurs must decide on their future: are they coping with the venture failure,
learning from it and starting their next venture (McGrath, 1999; Shepherd, 2003; Singh,
Corner, & Pavlovich, 2007) or do they exit entrepreneurial activities and return to
employment. Sarasvathy and Menon (2003) argue that the entrepreneurs that go back to
employment are the only entrepreneurs that are considered as failed entrepreneurs.
Furthermore Bolton and Thompson (2004) definition of entrepreneurs does not consider
these people as entrepreneurs at all. Sarasvathy and Menon (2003) argue that habitual
entrepreneurs should never be considered as failed entrepreneurs, as they learn from their
mistakes, and start a new and hopefully more successful venture.
The attitude of a country towards business failure can be seen through its bankruptcy laws
(Cave et al., 2001). In Australia, bankruptcy is a stage that last between 3 to 8 years
(AussieLegal, 2009). During this time the entrepreneurs are not allowed to open any other
business, however entrepreneurs may pay their debts from money they receive from
© 2011 RossiSmith Academic Publishing, JAES, Vol VII, Iss 2, December 2011, Refereed Edition, Page:
100
relatives, and by that shorten the insolvent period. Furthermore, after the bankruptcy
period is over, the name of the entrepreneur stays in the National Personal Insolvency
Index (NPII) database. A different approach is the American approach towards
bankruptcy. After declaring bankruptcy, the entrepreneurs may open their next venture
and with the money they earn in it, pay their debts for the bankrupt venture (Legal-
Information-Institute, 2009). The differences between these two laws suggest a political
and cultural attitude towards business failure.
This research accepts Sarasvathy and Menon’s (2003) attitude, and refers to all habitual
entrepreneurs, regardless the country they create in, as successful entrepreneurs, that may
have in their history failed ventures, but coped with them and opened new ventures.
Furthermore, as these entrepreneurs experienced failed venture, their experience may
benefit nascent and novice entrepreneurs.
Entrepreneurial Learning
Skinner (1953) defined learning as a change of behaviour, emphasising that improvement
in performance may be regarded as training and not regarded as learning. This definition
was broadened by Huber (1991: 89), emphasising that learning is seen when there is a
potential for behavioural change: “an entity learns if, through its processing of
information, the range of its potential behaviours is changed” . Therefore, it is the process
the entrepreneurs go through and not its outcome that is important.
A very different approach of defining learning comes from the cognitive and experiential
learning theories where learning is defined as knowledge creation (Gibb, 1997; Harrison
& Leitch, 2005; Kolb, 1984). This definition is based on the works of John Dewey, Kurt
Lewin and Jean Piaget from the beginning of the 20th century (Kolb, 1984).
Entrepreneurial learning can be understood in two ways, learning to behave as an
entrepreneur, entrepreneurs’ learning during their entrepreneurial career or a combination
of both (Rae & Carswell, 2001). However, as we are exploring what entrepreneurs and
intrapreneurs learned from their failed ventures, we focus on entrepreneurs and
intrapreneurs’ learning during their career.
© 2011 RossiSmith Academic Publishing, JAES, Vol VII, Iss 2, December 2011, Refereed Edition, Page:
101
Cope (2005: 374) describes entrepreneurs’ learning as “learning experienced by
entrepreneurs during the creation and development of a small enterprise, rather than a
particular style or form of learning that could be described as ‘entrepreneurial’ ”. While
accepting this definition, this research argues that experience can come from any venture
creation, and not only ventures that create new enterprises.
Most researchers agree that entrepreneurs’ learning is a process of changing experience
into knowledge, or just gaining knowledge, as depicted in Table 1. We accept the general
definition that entrepreneurs’ learning is a process of changing experience into knowledge.
Entrepreneurs prefer practice to theory, a phenomenon that influences their learning styles
(Rae, 2004a). Learning is achieved while creating and managing new ventures rather than
in formal classes. It does not follow a planned structure, being done in real-time through
the experiences acquired and reactions to changes, incidents and problems that are
encounter (Deakins & Freel, 1998; Rae, 2004a, 2005). It is suggested that entrepreneurs
learn by exploiting and exploring their experience and knowledge. They may exploit their
experience by replicating more or less successful actions or exploring new actions when
their action failed or when they do not have former experience in the subject (Minniti &
Bygrave, 2001; Politis & Gabrielsson, 2009).
In addition to learning from their own experience, entrepreneurs learn by observing
others’ actions, retaining the information, assimilating it in their memory and relating it to
their own situations. This type of knowledge can act as a template for evaluating their
own actions (Holcomb, Ireland, Holmes Jr, & Hitt, 2009). Therefore, entrepreneurs’
learning is defined as the creation of knowledge that leads to behavioural change.
Learning from Failure
“Firms go out of existence, but entrepreneurs survive and learn” (Timmons & Spinelli,
2009: 107)
As stated previously, venture failure can occur in new ventures embedded in a mature
organisation (intrapreneurship) or in stand-alone new ventures (entrepreneurship). This
section will broaden the area of learning from intrapreneurial and/or entrepreneurial new
© 2011 RossiSmith Academic Publishing, JAES, Vol VII, Iss 2, December 2011, Refereed Edition, Page:
102
ventures’ failure. For reading clarity, this section will address entrepreneurship and
intrapreneurship as entrepreneurship or new ventures. Likewise, this section will address
intrapreneurs and entrepreneurs as entrepreneurs.
Venture failure is probably the one thing that almost all entrepreneurs face somewhere in
their endeavours. At the same time, failure is probably the last thing on the mind of an
entrepreneur starting out on the entrepreneurial process (Pretorius, 2008).
Venture failure can be addressed in negatively or positively. While the negative outcomes
of failure are monetary and emotional cost, the positive effects are associated with
learning, gaining experience and other cognitive constructs (Mitchell, Mitchel, & Smith,
2004). Furthermore, many researchers emphasise that failure represents an essential
requirement for learning. Therefore, failure is an experience entrepreneurs gained as part
of their learning curve (Cave et al., 2001; Cope et al., 2008; Shepherd, 2003; Sitkin, 1992;
Stokes & Blackburn, 2002).
Shepherd (2003) emphasise that learning from venture failure occurs when entrepreneurs
are able to use the experience and the information, gathered in the failed venture, for
revising their knowledge and beliefs. Therefore, entrepreneurs must reflect on their
actions, understand what went wrong and use the new knowledge in their next venture
(Shepherd, 2003). However, McKenzie and Sud (2008) demonstrate that although it is
important to learn from failure, there are cases in which nothing is to be learned from the
failure. They give an example of failure caused by exogenous forces. However, the belief
expressed in this study is that even from such failure entrepreneurs can learn, if they
reflect on their actions, to avoid those forces in their next venture (for example, choose a
different environment in which to start that venture).
Although entrepreneurs learn from every action they perform, gaining experience from
both successful and failed procedures, they will learn more from critical events (Deakins
& Freel, 1998). Therefore, the outcome of failure should be a cognitive reflection on the
organisational (or the entrepreneurial) behaviour and performance, using the failure as a
learning stage for better performance in the future. Successful procedures may result in
the repetition of the same procedures that may be performed more effectively, but they do
© 2011 RossiSmith Academic Publishing, JAES, Vol VII, Iss 2, December 2011, Refereed Edition, Page:
103
not enhance learning as they do not produce cognitive thinking on the procedures and, as
a result, the influence is only on short term performance (Politis & Gabrielsson, 2009;
Sitkin, 1992). Moreover, repeating successful routines may have an opposite outcome, as
entrepreneurs become over-confident in their actions and repeat the same routine even if
the situation has changed. In this case, their chance of failing the next time increases as it
prevents them from adapting to change (Baumard & Starbuck, 2005). Therefore, the
failure should be seen as a “learning journey” (Cardon & McGrath, 1999; Cope, Cave, &
Eccles, 2004). In addition, the time and resources that entrepreneurs might use for
avoiding the failures may become more costly than failing and learning from it (Huber,
1991; McGrath, 1999).
The research aims to fill the gap that exists in the academic literature by combining two
research fields: entrepreneurial learning and new venture failure. Figure 2 represents the
preliminary conceptual model that describes the combination of new venture failure and
entrepreneurial learning. The gap that this research aims to fill is marked with a bold
arrow and the ambit of this research is shaded.
Research Questions and propositions
This study targets two groups, entrepreneurs and intrapreneurs. Both start new ventures,
which may succeed or fail. When a venture succeeds the entrepreneurs and intrapreneurs
may choose one of two options, start another new venture or continue running the venture.
Although an interesting phenomenon, it is out of the ambit of this research. Likewise,
when a venture fails, the entrepreneurs and intrapreneurs will choose one of two options;
leave the entrepreneurial or intrapreneurial way of life, or learn from the failure and start
a new venture, Figure 1 shows the route entrepreneurs / intrapreneurs may choose.
As explained above, learning can occur both from successful and failed ventures. In this
schema, the learning is defined as “gain experience”, which is the result of the learning
process. The arrow between the “fail” box and the “gain experience” box is the gap that
this study aims to fill (marked with a bold arrow).
© 2011 RossiSmith Academic Publishing, JAES, Vol VII, Iss 2, December 2011, Refereed Edition, Page:
104
This thesis will ask entrepreneurs and intrapreneurs to reflect on their former actions
when their ventures failed and find out what they have learned from it. The questions are
retrospective as it takes time for the entrepreneurs / intrapreneurs to reflect on their
actions without their responses being coloured by the grief that may be connected to the
failure (Shepherd, 2003).
Therefore, the research questions for this research are:
1. How do entrepreneurs and intrapreneurs perceive venture failure?
2. What is it that entrepreneurs and intrapreneurs learn from new venture failure?
3. What is the difference, if any, between what entrepreneurs and intrapreneurs learn
from venture failure?
Qualitative research answers questions related to “how”, “why” and “what”, and not those
to do with relationships between different variables. Therefore, it uses propositions
instead of hypotheses. Stating the propositions are the rationalisation and direction the
research takes. Furthermore, it creates criteria for judging whether or not the research was
successful (Yin, 2003).
The propositions in this study are based on premises that arose from the literature review
chapters and supports the rigour and depth of the study (Eisenhardt & Graebner, 2007).
Therefore, the propositions and premises of this research are:
Premise 1: Entrepreneurs start new ventures as stand-alone enterprises;
therefore, the venture is the business (Timmons & Spinelli, 2009).
Premise 2: Intrapreneurs start new ventures in an established organisation
(Morris et al., 2008).
Proposition 1: Entrepreneurs perceive business success and failure as equivalent
to new venture success and failure.
Proposition 2: Intrapreneurs perceive business success and failure as equivalent to
new venture success and failure.
© 2011 RossiSmith Academic Publishing, JAES, Vol VII, Iss 2, December 2011, Refereed Edition, Page:
105
Premise 3: There is something to be learned from new venture failure (Politis,
2005; Politis & Gabrielsson, 2009; Sitkin, 1992).
Premise 4: Entrepreneurs who have failed have more experience than
entrepreneurs who did not fail (Mitchell et al., 2004).
Proposition 3: New venture failure can be identified as part of the entrepreneurs’
learning curve.
Premise 5: By learning from failures, entrepreneurs have better chances of
succeeding in their next ventures (Cope et al., 2004; Deakins &
Freel, 1998).
Premise 6: Experienced entrepreneurs have a constructive and retrospective
view of their failed ventures.
Proposition 4: Experienced entrepreneurs can suggest ways in which they could
have overcome the failures.
Proposition 5: Entrepreneurs and intrapreneurs will learn similar things from new
venture failure.
METHODOLOGY
This research explores what entrepreneurs and intrapreneurs learned from the failure of
their ventures. The study suggests that, although failure is not a desired outcome of a
venture, there are worse case scenarios and good things can come out of it.
As the academic literature regarding what it is that can be learned from new venture and
business failure is scant, this study is an exploratory qualitative project.
© 2011 RossiSmith Academic Publishing, JAES, Vol VII, Iss 2, December 2011, Refereed Edition, Page:
106
To understand the phenomenon of new venture failure and what entrepreneurs and
intrapreneurs can learn from it, this study uses practice-based theory that explores what
and how entrepreneurs and intrapreneurs suggest they have learned from their failed new
venture. Practice-based theories are entrepreneurs’ narratives for making sense of what
works and what does not, based on their own experiences in retrospective. Therefore, the
researcher’s task is to create academic theory from the participants’ narratives (Rae,
2004b).
This research uses an innovative research methodology that does not follow one specific
qualitative methodology technique (as case study or grounded theory research), but is
rather a combination of qualitative and quantitative techniques that are used to strengthen
the results of the research.
This research used multiple types of data; (1) primary data being collected by online
survey and structured interviews, and (2) data from previous relevant research was used
as a basis for validity of the primary data.
Cooper and Schilder (2003) have stated that, in qualitative research, questionnaires are
self-administrated interviews and can, therefore, replace face-to-face structured
interviews as a way of allowing a broader sample. Therefore, the analysis of the data
treated the entire data set as data that came from structured interviews.
The chosen sampling method is purposive sampling using opportunity and snowball
techniques (Tashakkori & Teddlie, 2002).
While searching for entrepreneurs and intrapreneurs to participate, an opportunity to
target two entrepreneurial databases arose. Included in the databases are the last three
years’ winners of Deloitte’s “Technology Fast 50” and WiT (Women in Technology)
from Queensland. Both organisations agreed to send the questionnaire to their members.
The instrument was used as a structured interview with a control group of 4 entrepreneurs.
An online mixed methods survey, using the same questionnaire, was distributed. 23
intrapreneurs and entrepreneurs answered the online mixed methods survey. Of the 23
participants (intrapreneurs and entrepreneurs), 19 provided their details for further
© 2011 RossiSmith Academic Publishing, JAES, Vol VII, Iss 2, December 2011, Refereed Edition, Page:
107
interviews. Of the contacted respondents, after further contact, only 12 were available for
face-to-face structured interviews. All structured interviews used the Stocks and
Blackburn’s (2002) questionnaire. The responses from the control group integrated well
with that of the other face-to-face interview respondents, adding to validity and reliability.
The data from the mixed methods survey and the face-to-face structured interviews were
combined, accepting Cooper and Schilder’s (2003) clarification that in qualitative
research, questionnaires are self-administrated interviews and can, therefore, replace face-
to-face structured interviews.
Data analysis used cognitive maps to categorise the data. The cognitive map technique
was developed by cognitive psychologists as a means of modelling causal relationships
between variables within belief systems as reported by individual respondents. However
the use of this technique was extended to describe the characteristics of social systems
(Russell, 1999). Cognitive maps are identified as a viable way of both examining the
cognitive structures of entrepreneurs and undertaking the differences between
entrepreneurs and corporate entrepreneurs in their cognitive structures (Brännback &
Carsrud, 2009).
The cognitive maps were transformed into tables for appropriate use in the analysis and
discussion chapters. The analysis used classic content analysis and word count techniques
(Ryan & Bernard, 2000).
The discussion compared the results and findings from the data analysis with the relevant
academic literature, using practice-based theory. Practice-based theory converts the
participants’ narratives into academic theories (Rae, 2004b).
This innovative research methodology does not follow one specific qualitative
methodology technique (as case study or grounded theory research). Rather, it is a
combination of qualitative and quantitative techniques that are used to strengthen the
results of the research. As this is an exploratory research project, this methodology
seemed most appropriate, even though it is not common.
© 2011 RossiSmith Academic Publishing, JAES, Vol VII, Iss 2, December 2011, Refereed Edition, Page:
108
This technique spreads the main themes on paper as a base for the map (Buzan & Abbott,
2005). To simplify use in the analysis, the cognitive maps were converted to tables.
After categorising the data, the analysis used classic content and word count techniques
(Ryan & Bernard, 2000).
FINDINGS AND DISCUSSION
The questionnaire was sent to 300 entrepreneurs and intrapreneurs in Australia, with a
participant rate of 9%. Of the 23 participants that answered the online survey, 19 provided
their details for further interviews. Of the contacted respondents, 12 were available for
interviews. A control group of 4 habitual entrepreneurs, which experienced failed
ventures, were identified and the same structured interviews were conducted. The
responses from the control group integrated well with that of the other face-to-face
interview respondents, adding to validity and reliability. Eighteen males and six females,
aged between 25 and 64, answered the questionnaire, three of the participants failed to
identify their gender and age.
The majority of the entrepreneurs and intrapreneurs who participated in the study are
habitual entrepreneurs (22 of 24). Of the four inexperienced entrepreneurs and
intrapreneurs, one is a novice entrepreneur in his first year as a business owner / manager,
one has had his business for five years and two have been managing their business for
nine years. Only one of these more experienced entrepreneurs stated that he purchased
seven businesses prior to owning his current business, though this is the first business that
he had started from scratch. As this is their first venture / business, these novice
entrepreneurs have not experienced venture failure.
Two questions define if the participant is an entrepreneur or an intrapreneur. Question
number 7 asks about the current business and question 31 asks regarding their entire
endeavour. This study defined entrepreneurs and intrapreneurs regarding their entire
endeavour. Therefore, we had 17 entrepreneurs and 7 intrapreneurs (3 participants did not
answer these questions).
© 2011 RossiSmith Academic Publishing, JAES, Vol VII, Iss 2, December 2011, Refereed Edition, Page:
109
New Venture and Business Failure Definition, as Perceived by the Participants
There is no consensus in the academic on one common definition for business failure
(Pretorius, 2009; Watson & Everett, 1993). Likewise, the participants in this study
addressed business and new venture failure from different perspective. In addition to
common definitions of business failure, the participants in this research used definitions
that were identified as causes of failure in the academic literature. Furthermore, the
academic literature does not differ between business failure and new venture failure,
suggesting that new venture is equal to a business (as in the case of start-ups). However,
as the current research targeted entrepreneurs and intrapreneurs and distinguished
between new ventures embedded in a mature business and new ventures that are the
business (start up), it seeks to observe if there is a difference in their failure definitions.
Most of the entrepreneurs that participated in this study did not distinguish between
business failure and new venture failure. They have defined failure through financial
reasons, as bankruptcy, closure for financial reasons, profitability or cash flow. This
seems reasonable as in their case the venture is the business, therefore when the venture
fails financially the entire business fails financially.
However, the intrapreneurs that participated in this study differentiate more clearly than
the participating entrepreneurs between new venture failure and business failure. They
defined business failure as a business that is not managed properly while new venture
failure was defined as a venture that does not grow.
It is interesting to see that entrepreneurs defined success and failure as opposites. They
defined a successful business or new venture as a business or new venture that make a
sustainable profit, and a failed business or new venture as a business or new venture that
did not make a profit.
Intrapreneurs, on the other hand, defined business success and failure as two different
things, as if not on the same continuum, while defining new venture failure and success as
opposites. They have defined a successful business as a business that achieved its goals,
© 2011 RossiSmith Academic Publishing, JAES, Vol VII, Iss 2, December 2011, Refereed Edition, Page:
110
whereas a failed business is a business that was not managed properly. New venture
success and failure are defined by meanings of growth.
This confirms proposition 1 that suggested that entrepreneurs perceive business and new
venture success and failure as identical, while intrapreneurs differ between them.
Entrepreneurial Learning
In the literature review, we defined learning as “the creation of knowledge that leads to
behavioural change”. The creation of knowledge is based on the experience that
entrepreneurs and intrapreneurs gain in their ventures, regardless if it is a venture in an
existing business or a stand-alone new venture.
Entrepreneurial learning was confirmed by three indicators. The first is the participants'
self-assessment of their change in knowledge, which is in agreement with Mumford’s
(2002) learning definition. Therefore, the participants in this study were asked to rate their
success as managers while managing their failed venture, between one (unsuccessful) and
five (successful). In addition, they have self evaluated the change in their skills as result
of their experience in the failed new venture and or business. Therefore, the participants
were asked to rate the change of their skills as result of the failing new venture.
Most of the entrepreneurs and intrapreneurs stated that their skills have improved, as
shown in Table 3. The change in skills confirms that the participants learned from the
failed new venture. The participants that rated themselves as unsuccessful managers
(rated 1 or 2), rated their managerial skill as much better, all rates were 4 or 5, these
entrepreneurs show the highest level of learning.
When asked to rate their managerial skills during the time they have managed the failing
venture, half of the participants rated their skills as 3. None of the participants rated their
managerial skills as 5. This can result from the entrepreneurs and intrapreneurs feeling
that if their venture has failed, they cannot be good managers.
The second indicator that demonstrates learning was based on Cannon and Edmondson’s
(2005) learning cycle, which is established in this study by the combination of decisions
© 2011 RossiSmith Academic Publishing, JAES, Vol VII, Iss 2, December 2011, Refereed Edition, Page:
111
regarding failure (identify failure), decision reasoning (analyse failure) and experiences
that the participant sees as useful for, or will avoid, in their next venture (as a result their
next venture will become a deliberate experimentation by this learning definition).
The third indicator of learning was reinforced using experiential learning (Mainemelis,
Boyatzis, & Kolb, 2002). Experiential learning was demonstrated here by verifying the
connections between the experiences that the participants found either useful for, or
detrimental to, their next venture (the experience in the experimental learning) and the
suggestions they gave to nascent and novice entrepreneurs and intrapreneurs
(transforming experience into knowledge)
Participants in this study agreed that they learn from every experience in a new venture,
whether it be a good or a bad experience, and this learning helps prepare for their next
venture. This type of statement confirms proposition 1 as it observes new venture failure
as a learning experience, and therefore it can be identified as part of their learning curve.
Furthermore, one participant wrote “The experience (good and bad) from the previous
venture is the most important aspect when going into a new venture. Each venture tends
to be more successful. There is always wholesale knowledge acquired from 3rd parties,
but this is probably only 10% of the benefit of my own lessons learned.” Suggesting that
learning from experience is the most important type of learning that he had.
Suggestion to Novice Entrepreneurs and Intrapreneurs
Based on their experience from failed and successful ventures, participants were asked to
share their experience by suggesting what they would take with them to their next venture
and what they would avoid. In addition, they were requested to share an experience that
would help novice entrepreneurs and intrapreneurs avoiding new venture failure.
Two participants answered that they do not take any useful experience from one venture
to the next, as each ventures is different. However, they did have experiences they would
avoid in their next venture and suggestions to novice entrepreneurs and intrapreneurs.
Therefore, although they may not be aware of it they did learn from their failed ventures.
© 2011 RossiSmith Academic Publishing, JAES, Vol VII, Iss 2, December 2011, Refereed Edition, Page:
112
Learning from failed ventures will usually be formulated in a negative way. For example,
if someone had a successful experience with his or her partners and team members, they
will see it as a good experience to take with them to their next venture. However, they
feel that the partners were the reason for their venture failure; they will describe it as an
experience to avoid in their next venture. Either way, the learning that occurred from both
experiences is the importance of finding suitable partners and recruiting member teams
smartly. Therefore, the following list is a combination of all suggestions given by the
participants in the study:
1. Be prepared –
1.1. The entrepreneurs and intrapreneurs should be prepared to the reality that some
ventures fail. They should detach themselves from the venture and search for
fatal flaws in the planned venture before starting it. When finding the fatal flaws,
the entrepreneurs and intrapreneurs should prepare a plan which contains details
of how to avoid them.
1.2. The entrepreneurs and intrapreneurs should not spend too much on building the
venture before they have tested their idea and ensured that there is a real
opportunity in it.
1.3. The entrepreneurs and intrapreneurs should invest time in setting up the new
venture and developing their product or service, as being first in the market is not
always worthwhile. They should spend enough time and money on due diligence,
and remember that bugs in the products can create bad impression.
1.4. The entrepreneurs and intrapreneurs should conduct adequate market research,
making sure that they know who their customers are and that their product or
service solves the client’s pain point.
1.5. The entrepreneurs and intrapreneurs should assume that everything takes longer,
costs more and is not always applicable.

© 2011 RossiSmith Academic Publishing, JAES, Vol VII, Iss 2, December 2011, Refereed Edition, Page:
113
1.6. The entrepreneurs and intrapreneurs should have a good financial plan and ensure
that they have sufficient funding to survive until sales produce a profit.
2. Personal
2.1. The entrepreneurs and intrapreneurs should believe in their venture, as others
may try to discourage them. However, they should not let others influence them
and should trust their own instincts.
2.2. The entrepreneurs and intrapreneurs should be persistent and not give up easily.
2.3. The entrepreneurs and intrapreneurs should not be over-optimistic and over-
confident. They should be prepared to walk away, sooner rather than later, if they
feel that the venture is not reaching its goals.
2.4. The entrepreneurs and intrapreneurs should focus only on those aspects that drive
the business forward and avoid timewasters.
3. Management
3.1. The entrepreneurs and intrapreneurs should have clear goals, and write their
business plan accordingly.
3.2. The entrepreneurs and intrapreneurs should not start too small, but with caution.
4. Team / Partnership
4.1. The entrepreneurs and intrapreneurs should avoid bringing in the wrong people.
Hire quality staff and do not be afraid to hire smart people. Make sure they hire
only staff they trust and do not worry about the costs.
4.2. The entrepreneurs and intrapreneurs should choose their partners carefully. They
need to be able to complement each other and be able to work together in
stressful times.
© 2011 RossiSmith Academic Publishing, JAES, Vol VII, Iss 2, December 2011, Refereed Edition, Page:
114
5. Financial
5.1. The entrepreneurs and intrapreneurs should be good at raising finance and avoid
unnecessary costs.
5.2. The entrepreneurs and intrapreneurs should know their break-even point and the
profit margins they can allow themselves in order to stay in the business.
5.3. The entrepreneurs and intrapreneurs should invest back in the business before
giving dividends to stakeholders.
6. Learning
6.1. The entrepreneurs and intrapreneurs should develop the required skills to manage
a new venture.
6.2. The entrepreneurs and intrapreneurs should not rely too much on professional
staff. They should be able to understand basic financial statements, market
research results and so on. They do not need to know how to write such
documents but they need to know how to read them.
The entrepreneurs and intrapreneurs should perceive each venture as part of a learning
journey. Therefore, they should accept any failure or success as a learning experience that
will help them in their next venture. This list of suggestions demonstrates that
experienced entrepreneurs and intrapreneurs can offer ways that will help novice and
nascent entrepreneurs and intrapreneurs succeed in their first venture. These findings
confirm propositions 3 and 4.
CONCLUSION
This study explored how entrepreneurs and intrapreneurs perceive new venture and
business failure, suggesting that they observe it differently. While entrepreneurs did not
distinguish between business and new venture failure and defined both through financial
reasons, as bankruptcy, closure for financial reasons, profitability or cash flow.
© 2011 RossiSmith Academic Publishing, JAES, Vol VII, Iss 2, December 2011, Refereed Edition, Page:
115
Intrapreneurs defined business failure as a business that is not managed properly while
new venture failure was defined as a venture that does not grow.
Entrepreneurial learning can be understood in two ways, learning to behave as an
entrepreneur and entrepreneurs’ learning during their entrepreneurial career (Rae &
Carswell, 2001). Understanding what can be learned from new venture and business
failure can influence both types of learning.
Learning to behave as entrepreneurs – the experiences gained by practiced entrepreneurs
and intrapreneurs from their failed ventures can be added to entrepreneurship courses in
universities and colleges. The framework that was created here will help these nascent
entrepreneurs and intrapreneurs to understand better the issues they will confront on their
entrepreneurial journey.
Entrepreneurs and intrapreneurs’ learning during their entrepreneurial career – by
learning from another’s failure, novice entrepreneurs and intrapreneurs may increase
chances of succeeding in their first venture.
The study did not find significant difference between entrepreneurs and intrapreneurs’
learning from new venture and business failure. Therefore, the previous list of
suggestions is suitable for novice and nascent entrepreneurs and intrapreneurs.
Limitations and Future Research
There are several limitations to this study, which need to be taken into account. The first
limitation of this study is not being able to generalise the results. The study included only
Australian entrepreneurs and intrapreneurs. As the attitude towards new venture failure is
cultural based (Cave et al., 2001; Landier, 2005; Lee & Peterson, 2000), the results are
specific to technology-based entrepreneurs and intrapreneurs from Australia.
The second limitation is that this study relies on the entrepreneurs and intrapreneurs’
perspective and self-assessment. This study asked the participants’ estimation of how
their skills improved, though this was not checked in an objective way that can confirm
the change in their skills.
© 2011 RossiSmith Academic Publishing, JAES, Vol VII, Iss 2, December 2011, Refereed Edition, Page:
116
The third limitation is the sample size. This study’s data set came from only 19
entrepreneurs and 8 intrapreneurs. As this is an exploratory qualitative research project,
this sample was sufficiently large to establish the importance of the study and to show
that there is a gap to be filled in the entrepreneurial academic knowledge base.
This research established what 27 Australian entrepreneurs and intrapreneurs learned
from their failed ventures. This is an exploratory qualitative research project. A future
study should expand the research into a quantitative study and ensure that the findings can
be generalised.
While analysing and discussing the results of this research, further questions arose:
• Whether the respondents thought that the learning they specified can be used in
future ventures by them and by others
• Is the entrepreneurial leap a myth and if attempted, would lead to failure?
• What, then, is the environmental isotropy?
• Can "be prepared” and "have clear goals” then mean the learning that the
‘effectual’ control of means along the start-up road would reduce chances of
failure as claimed by the effectuation literature and counter to Stevenson's
‘essence’ of entrepreneurship “as the willingness to pursue opportunity regardless
of the resources under control” (Stevenson & Jarillo, 2007)?
• Would accepting the suggestions, given by experienced entrepreneurs and
intrapreneurs, reduce chances of failure?
• What are the "managerial required skills" the entrepreneurs and intrapreneurs
should develop before managing a new venture?
These questions are important and should be addressed in future research.
As the attitude towards business and new venture failure is culturally-based (Cave et al.,
2001; Landier, 2005; Lee & Peterson, 2000), it is important that future research includes
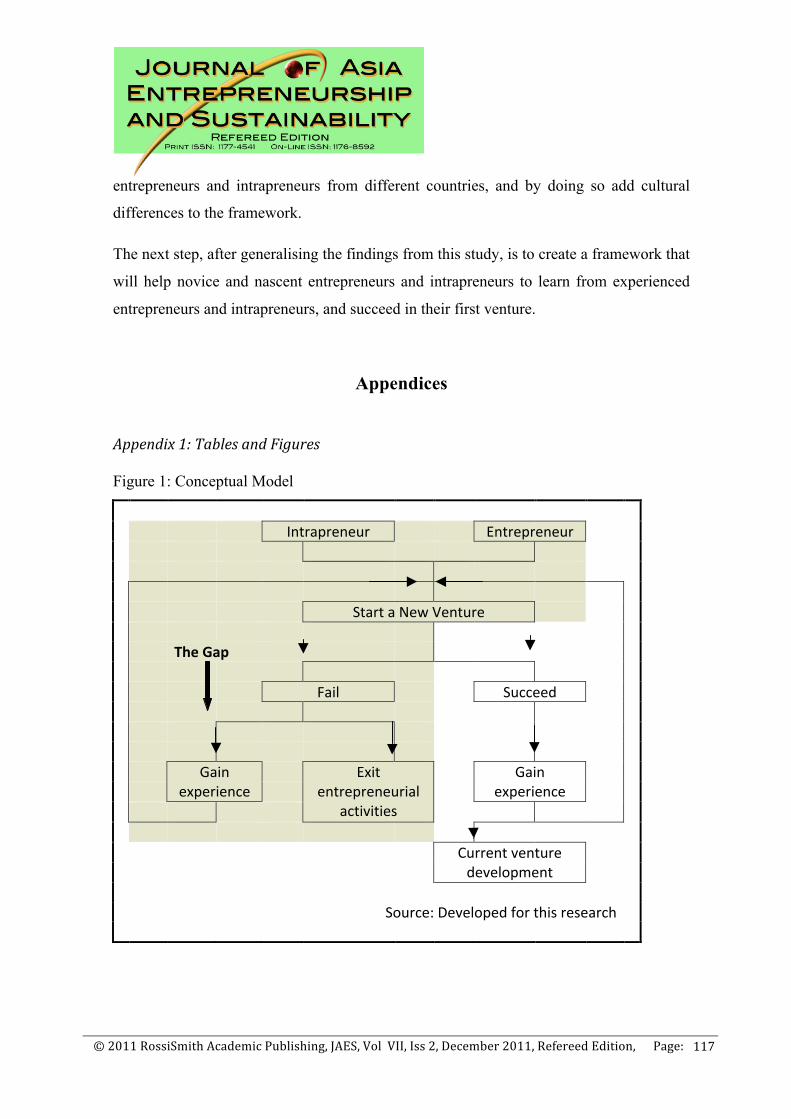
© 2011 RossiSmith Academic Publishing, JAES, Vol VII, Iss 2, December 2011, Refereed Edition, Page:
117
entrepreneurs and intrapreneurs from different countries, and by doing so add cultural
differences to the framework.
The next step, after generalising the findings from this study, is to create a framework that
will help novice and nascent entrepreneurs and intrapreneurs to learn from experienced
entrepreneurs and intrapreneurs, and succeed in their first venture.
Appendices Appendix 1: Tables and Figures Figure 1: Conceptual Model
Intrapreneur Entrepreneur Start a New Venture The Gap Fail Succeed Gain
experience Exit
entrepreneurial activities
Gain experience
Current venture
development
Source: Developed for this research
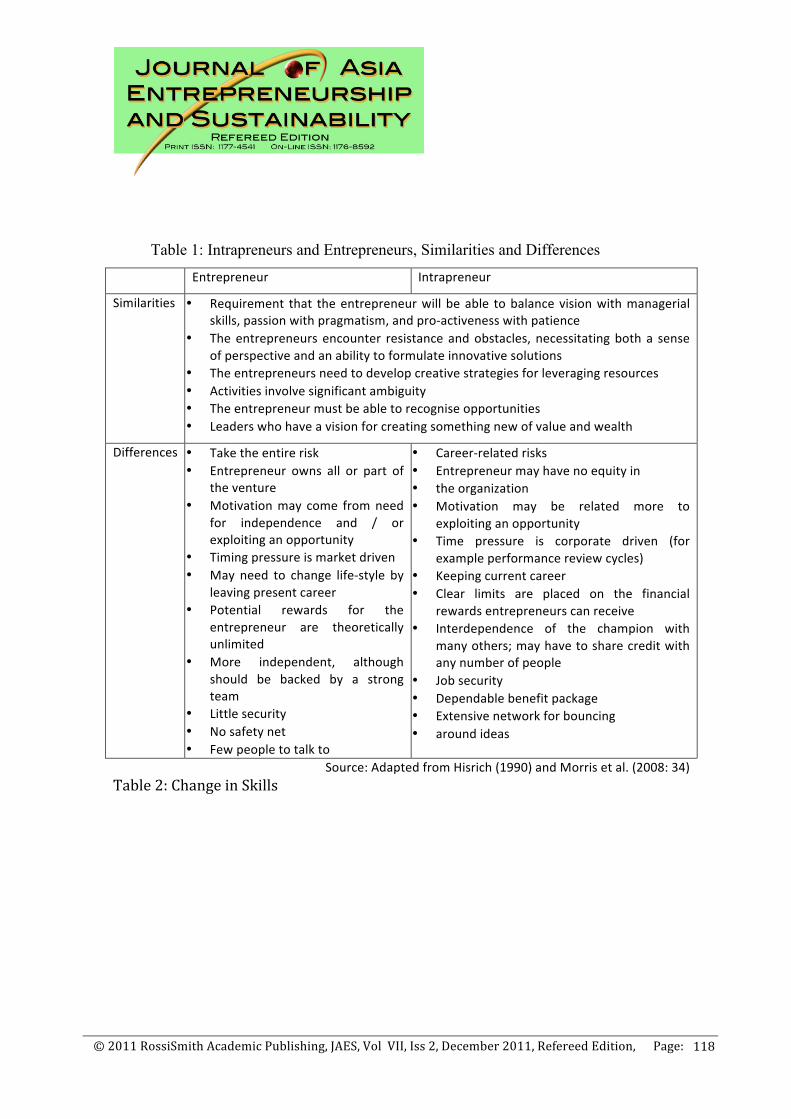
© 2011 RossiSmith Academic Publishing, JAES, Vol VII, Iss 2, December 2011, Refereed Edition, Page:
118
Table 1: Intrapreneurs and Entrepreneurs, Similarities and Differences
Entrepreneur Intrapreneur
Similarities • Requirement that the entrepreneur will be able to balance vision with managerial skills, passion with pragmatism, and pro-‐activeness with patience
• The entrepreneurs encounter resistance and obstacles, necessitating both a sense of perspective and an ability to formulate innovative solutions
• The entrepreneurs need to develop creative strategies for leveraging resources • Activities involve significant ambiguity • The entrepreneur must be able to recognise opportunities • Leaders who have a vision for creating something new of value and wealth
Differences • Take the entire risk • Entrepreneur owns all or part of
the venture • Motivation may come from need
for independence and / or exploiting an opportunity
• Timing pressure is market driven • May need to change life-‐style by
leaving present career • Potential rewards for the
entrepreneur are theoretically unlimited
• More independent, although should be backed by a strong team
• Little security • No safety net • Few people to talk to
• Career-‐related risks • Entrepreneur may have no equity in • the organization • Motivation may be related more to
exploiting an opportunity • Time pressure is corporate driven (for
example performance review cycles) • Keeping current career • Clear limits are placed on the financial
rewards entrepreneurs can receive • Interdependence of the champion with
many others; may have to share credit with any number of people
• Job security • Dependable benefit package • Extensive network for bouncing • around ideas
Source: Adapted from Hisrich (1990) and Morris et al. (2008: 34) Table 2: Change in Skills
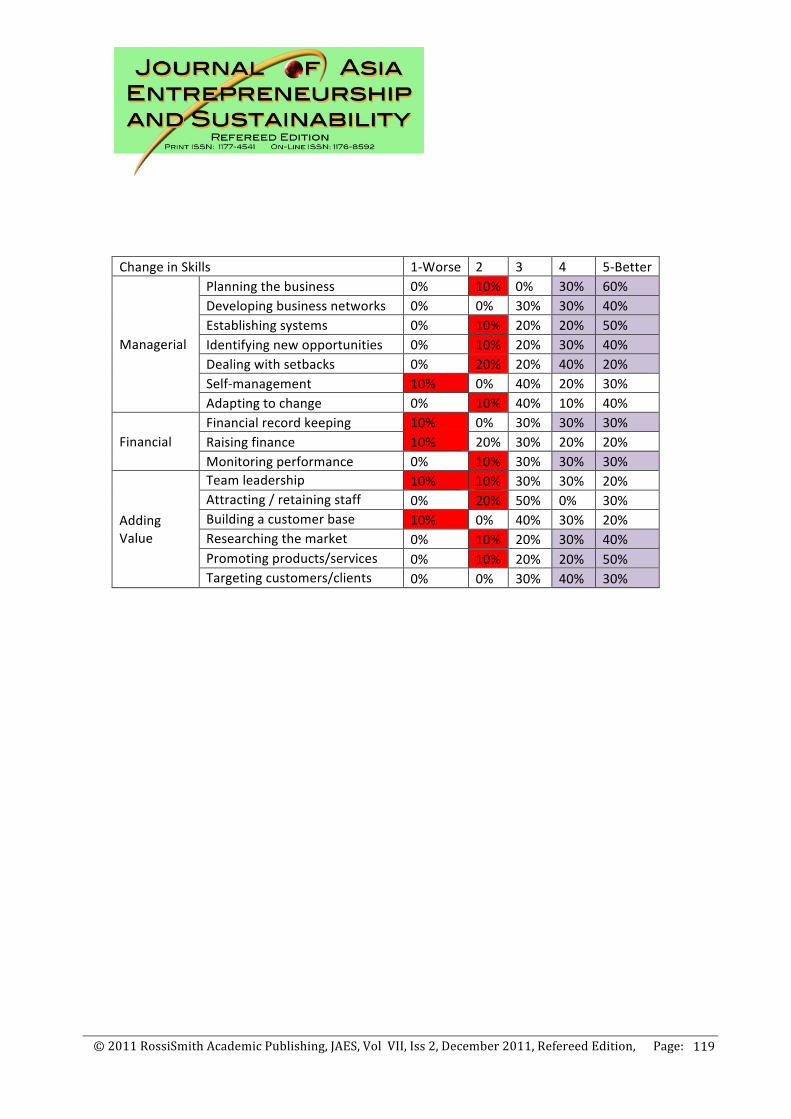
© 2011 RossiSmith Academic Publishing, JAES, Vol VII, Iss 2, December 2011, Refereed Edition, Page:
119
Change in Skills 1-‐Worse 2 3 4 5-‐Better
Managerial
Planning the business 0% 10% 0% 30% 60% Developing business networks 0% 0% 30% 30% 40% Establishing systems 0% 10% 20% 20% 50% Identifying new opportunities 0% 10% 20% 30% 40% Dealing with setbacks 0% 20% 20% 40% 20% Self-‐management 10% 0% 40% 20% 30% Adapting to change 0% 10% 40% 10% 40%
Financial Financial record keeping 10% 0% 30% 30% 30% Raising finance 10% 20% 30% 20% 20% Monitoring performance 0% 10% 30% 30% 30%
Adding Value
Team leadership 10% 10% 30% 30% 20% Attracting / retaining staff 0% 20% 50% 0% 30% Building a customer base 10% 0% 40% 30% 20% Researching the market 0% 10% 20% 30% 40% Promoting products/services 0% 10% 20% 20% 50% Targeting customers/clients 0% 0% 30% 40% 30%
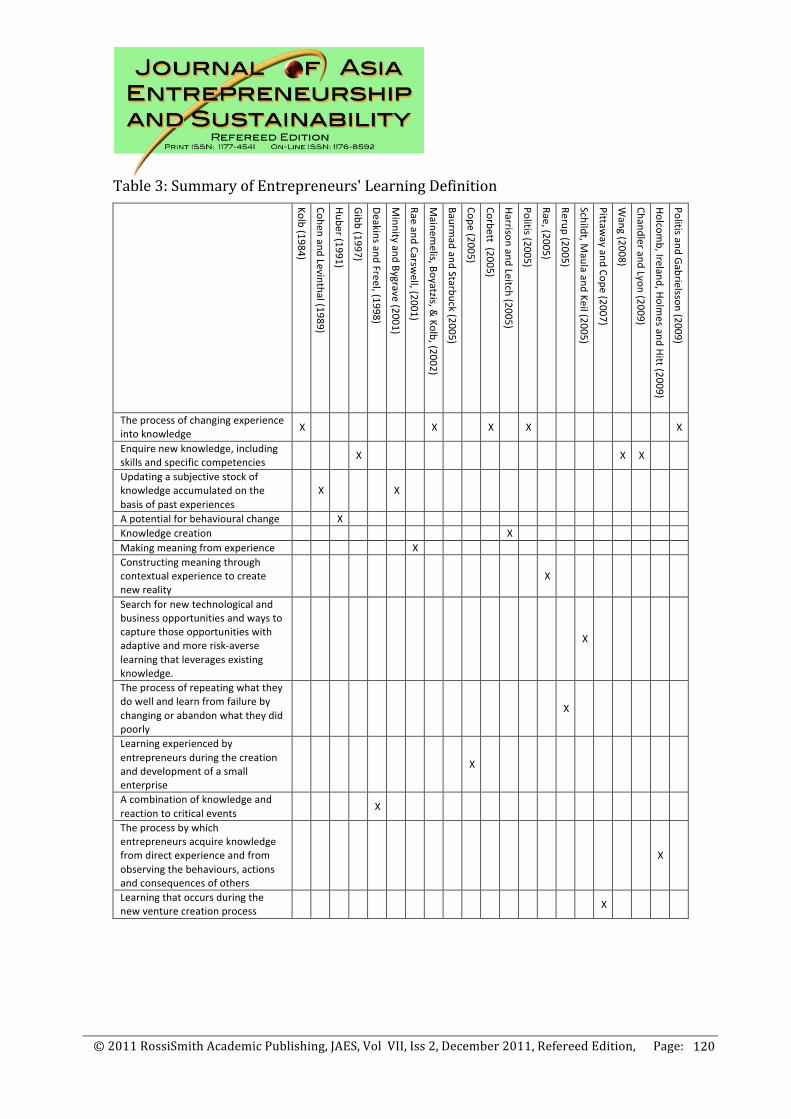
© 2011 RossiSmith Academic Publishing, JAES, Vol VII, Iss 2, December 2011, Refereed Edition, Page:
120
Table 3: Summary of Entrepreneurs' Learning Definition
Kolb (1984)
Cohen and Levinthal (1989)
Huber (1991)
Gibb (1997)
Deakins and Freel, (1998)
Minnity and Bygrave (2001)
Rae and Carswell, (2001)
Mainem
elis, Boyatzis, & Kolb, (2002)
Baurmad and Starbuck (2005)
Cope (2005)
Corbett (2005)
Harrison and Leitch (2005)
Politis (2005)
Rae, (2005)
Rerup (2005)
Schildt, Maula and Keil (2005)
Pittaway and Cope (2007)
Wang (2008)
Chandler and Lyon (2009)
Holcomb, Ireland, Holm
es and Hitt (2009)
Politis and Gabrielsson (2009)
The process of changing experience into knowledge X X X X X
Enquire new knowledge, including skills and specific competencies X X X
Updating a subjective stock of knowledge accumulated on the basis of past experiences
X X
A potential for behavioural change X Knowledge creation X Making meaning from experience X Constructing meaning through contextual experience to create new reality
X
Search for new technological and business opportunities and ways to capture those opportunities with adaptive and more risk-‐averse learning that leverages existing knowledge.
X
The process of repeating what they do well and learn from failure by changing or abandon what they did poorly
X
Learning experienced by entrepreneurs during the creation and development of a small enterprise
X
A combination of knowledge and reaction to critical events X
The process by which entrepreneurs acquire knowledge from direct experience and from observing the behaviours, actions and consequences of others
X
Learning that occurs during the new venture creation process X
© 2011 RossiSmith Academic Publishing, JAES, Vol VII, Iss 2, December 2011, Refereed Edition, Page:
121
REFERENCES Amaral, A. M., & Baptista, R. (2006). Serial vs. One-Business Entrepreneurs: A
Longitudinal Investigation of Entry into Serial Entrepreneurship: SSRN. AussieLegal. (2009). AussieLegal - Free Australian legal information, useful DIY legal
kits and recommended law firm referral. Retrieved 10/04/2009, from http://www.aussielegal.com.au/TopicList~TopicId~111.htm
Bager, T., Ottosson, H., & Schott, T. (2010). Intrapreneurs, entrepreneurs and spin-off entrepreneurs: similarities and differences. International Journal of Entrepreneurship and Small Business, 10(3), 339-358.
Baumard, P., & Starbuck, W. H. (2005). Learning from failures: Why it May Not Happen. Long Range Planning, 38(3), 281-298.
Berg, D. N., & Mirvis, P. H. (1977). Failures in Organization Development and Change New York: Wiley.
Bolton, B., & Thompson, J. L. (2004). Entrepreneurs : talent, temperament, technique (2nd ed.). Boston: Elsevier Butterworth-Heinemann.
Bosma, N., & Harding, R. (2006). Global Entrepreneurship Monitor - GEM 2006 results. (Babson o. Document Number)
Brännback, M., & Carsrud, A. L. (2009). Cognitive Maps in Entrepreneurship: Researching, Sense Making and Action. In A. L. Carsrud & M. Brännback (Eds.), Understanding the Entrepreneurial Mind (pp. 75-96). London: Springer
Burns, P. (2008). Corporate Entrepreneurship (2nd ed.). New York: Palgrave Macmillan. Buzan, T., & Abbott, S. (2005). The ultimate book pf Mind Maps. London: Thorsons. Cannon, M. D., & Edmondson, A. C. (2005). Failing to Learn and Learning to Fail
(Intelligently): How Great Organizations Put Failure to Work to Innovate and Improve. Long Range Planning, 38(3), 299-319.
Cardon, M. S., & McGrath, R. G. (1999). When the going gets tough... Toward a psychology of entrepreneurial failure and re-motivation. Frontiers of Entrepreneurship Research 58-72
Cave, F., Eccles, S., & Rundle, M. (2001). An Exploration of Attitudes to Entrepreneurial Failure: a Learning Experience or an Indelible Stigma? Paper presented at the Babson College-Kauffman Foundation Entrepreneurship Conference, Jonkoping International Business School, Sweden.
Chandler, G. N., & Lyon, D. W. (2009). Involvement in Knowledge-Acquisition Activities by Venture Team Members and Venture Performance. Entrepreneurship: Theory & Practice, 33(3), 571-592.
Cohen, W. M., & Levinthal, D. A. (1989). Innovation and Learning: The Two Faces of R & D. Economic Journal, 99(397), 569-596.
Connell, J., Edgar, G. C., Olex, B., Scholl, R., Shulman, T., & Tietjen, R. (2001). Troubling successes and good failures: Successful New Product Development Requires Five Critical Factors. Engineering Management Journal, 13(4), 35.
Cooper, D. R., & Schindler, P. S. (2003). Business research methods (8th ed.). New York: McGraw-Hill/Irwin.
Cope, J. (2005). Toward a dynamic learning perspective of entrepreneurship. Entrepreneurship: Theory and Practice, 29(4), 373-378.

© 2011 RossiSmith Academic Publishing, JAES, Vol VII, Iss 2, December 2011, Refereed Edition, Page:
122
Cope, J., Cave, F., & Eccles, S. (2004). Attitudes of venture capital investors towards entrepreneurs with previous business failure. Venture Capital: An International Journal of Entrepreneurial Finance, 6(2), 147 - 172.
Cope, J., Cave, F., & Eccles, S. (2008). The impact and outcomes of venture failure: an entrepreneurial learning perspective. Paper presented at the 2008 Babson college entrepreneurship research conference, The University of North Carolina at Chapel Hill.
Corbett, A. C. (2005). Experiential learning within the process of opportunity identification and exploitation. Entrepreneurship: Theory and Practice, 29(4), 473(419).
Deakins, D., & Freel, M. (1998). Entrepreneurial learning and the growth process in SMEs. The Learning Organization, 5(3), 144 - 155.
Drucker, P. F. (1993). Innovation and entrepreneurship : practice and principles. New York: HarperCollins.
Eisenhardt, K. M., & Graebner, M. E. (2007). Theory Building from Cases: Opportunities and Challenges. Academy of Management Journal, 50(1), 25-32.
Fitzsimmons, J. R., Douglas, E. J., Antoncic, B., & Hisrich, R. D. (2005). Intrapreneurship in Australian Firms. Journal of the Australian and New Zealand Academy of Management, 11(1), 17-27.
Florin, J. (2005). Is venture capital worth it? Effects on firm performance and founder returns. Journal of Business Venturing, 20(1), 113-135.
Gibb, A. A. (1997). Small firms' training and competitiveness. Building upon the small business as a learning organisation. International Small Business Journal, v15(n3), p13(17).
Gulst, N., & Maritz, A. (2009, September). Why is it that entrepreneurs fail? or do they? Paper presented at the Start Small Think Big, 22nd SEAANZ 2009, Wellington, New Zealand.
Gulst, N., & Maritz, A. (2010, February). The Paradoxical Nature of Venture Failure: The Australian Case, First Findings. Paper presented at the 7th AGSE International Entrepreneurship Research Exchange, Sunshine Coast, Queensland AU.
Harrison, R. T., & Leitch, C. M. (2005). Entrepreneurial learning: researching the interface between learning and the entrepreneurial context. Entrepreneurship: Theory and Practice, 29(4), 351(321).
Hisrich, R. D. (1990). Entrepreneurship/intrapreneurship. American Psychologist, 45(2), 209-222.
Holcomb, T. R., Ireland, R. D., Holmes Jr, R. M., & Hitt, M. A. (2009). Architecture of Entrepreneurial Learning: Exploring the Link Among Heuristics, Knowledge, and Action. Entrepreneurship: Theory & Practice, 33(1), 167-192.
Huber, G. P. (1991). Organizational Learning: The Contributing Processes and the Literatures. Organization Science, 2(1), 88-115.
Knott, A. M., & Posen, H. E. (2005). Is failure good? Strategic Management Journal, 26(7), 617-641.
Kolb, D. A. (1984). Experiential learning: experience as the source of learning and development. In. Englewood Cliffs, N.J: Prentice-Hall.
Landier, A. (2005). Entrepreneurship and the Stigma of Failure. SSRN eLibrary. Lee, S. M., & Peterson, S. J. (2000). Culture, entrepreneurial orientation, and global
competitiveness. Journal of World Business, 35(4), 401-416.
© 2011 RossiSmith Academic Publishing, JAES, Vol VII, Iss 2, December 2011, Refereed Edition, Page:
123
Legal-Information-Institute. (2009). Bankruptcy | LII / Legal Information Institute. Retrieved 10/04/2009, from http://topics.law.cornell.edu/wex/Bankruptcy
Mainemelis, C., Boyatzis, R. E., & Kolb, D. A. (2002). Learning Styles and Adaptive Flexibility: Testing Experiential Learning Theory. Management Learning, 33(1), 5-33.
McGrath, R. G. (1999). Falling forward: Real options reasoning and entrepreneurial failure. Academy of Management Review, 24(1), 13-30.
McKenzie, B., & Sud, M. (2008). A Hermeneutical Approach to Understanding Entrepreneurial Failure. Academy of Entrepreneurship Journal, 14(1/2), 123-148.
Menzel, H. C., Aaltio, I., & Ulijn, J. M. (2007). On the way to creativity: Engineers as intrapreneurs in organizations. Technovation, 27(12), 732-743.
Minniti, M., & Bygrave, W. (2001). A Dynamic Model of Entrepreneurial Learning. Entrepreneurship: Theory & Practice, 25(3), 5.
Mitchell, R. K., Mitchel, J. R., & Smith, J. B. (2004, 11/04/08). Failing to succeed: New venture failure as a moderator of startup experience and startup experties. Paper presented at the Frontiers of Entrepreneurship Research 2004.
Morris, M. H., Kuratko, D. F., & Covin, J. G. (2008). Corporate Entrepreneurship and Innovation (2nd ed.). West Egan, MN: Thomson South Western.
Mumford, A. (2002). Effective Learning. London: CIPD. Pittaway, L., & Cope, J. (2007). Simulating Entrepreneurial Learning: Integrating
Experiential and Collaborative Approaches to Learning. Management Learning, 38(2), 211-233.
Politis, D. (2005). The Process of Entrepreneurial Learning: A Conceptual Framework. Entrepreneurship theory and practice, 29(4), 399.
Politis, D., & Gabrielsson, J. (2009). Entrepreneurs' attitudes towards failure: An experiential learning approach. International Journal of Entrepreneurial Behaviour & Research, 15(4), 364-484.
Pretorius, M. (2008). Critical variables of business failure : a review and classification framework. African Journal of Economic and Management Sciences, 11(4), 408-430.
Pretorius, M. (2009). Defining business decline, failure and turnaround: a content analysis. Southern African Journal of Entrepreneurship and Small Business Management, 2(1), 1-16.
Rae, D. (2004a). Entrepreneurial learning: a practical model from the creative industries. Education & Training, 46(8/9), 492-500.
Rae, D. (2004b). Practical theories from entrepreneurs' stories: discursive approaches to entrepreneurial learning. Journal of Small Business and Enterprise Development, 11(2), 195 - 202.
Rae, D. (2005). Entrepreneurial learning: a narrative-based conceptual model. Journal of Small Business and Enterprise Development, 12(3), 323 - 335.
Rae, D., & Carswell, M. (2001). Towards a conceptual understanding of entrepreneurial learning. Journal of Small Business and Enterprise Development, 8(2), 150-158.
Rerup, C. (2005). Learning from past experience: Footnotes on mindfulness and habitual entrepreneurship. Scandinavian Journal of Management, 21(4), 451-472.
Russell, R. D. (1999). Developing a Process Model of Intrapreneurial Systems: A Cognitive Mapping Approach. Entrepreneurship: Theory and Practice, 23(3), 65.
© 2011 RossiSmith Academic Publishing, JAES, Vol VII, Iss 2, December 2011, Refereed Edition, Page:
124
Ryan, G. W., & Bernard, H. R. (2000). Data management and analysis methods. In N. K. Denzin & Y. S. Livccoln (Eds.), Handbook of Qualitative Research (2nd ed., pp. 769-802). Thousand Oaks: Sage Publications Inc.
Sarasvathy, S. D., & Menon, A. R. (2003). Failing Firms and Successful Entrepreneurs: Serial Entrepreneurship as a Temporal Portfolio. SSRN eLibrary.
Schildt, H. A., Maula, M. V. J., & Keil, T. (2005). Explorative and Exploitative Learning from External Corporate Ventures. Entrepreneurship: Theory & Practice, 29(4), 493-5.
Schuller, R. H. (2006). Failure Qoutes. In M. P. Singh (Ed.), Quote Unqoute: A Handbook of Famous Quotations (pp. 134). New Delhi: Lotus Press.
Sharma, P., & Chrisman, S. J. J. (2007). Toward a Reconciliation of the Definitional Issues in the Field of Corporate Entrepreneurship. In A. Cuervo, D. Ribeiro & S. Roig (Eds.), Entrepreneurship : Concepts, Theory and Perspective. (pp. 83-103). Dordrecht Springer-Verlag Berlin and Heidelberg GmbH & Co. KG.
Shepherd, D. A. (2003). Learning from business failure: Propositions of grief recovery for the self-employed. Academy of Management Review, 28(2), 318-328.
Shepherd, D. A., & Katz, J. A. (2004). Innovation and Corporate Entrepreneurship. In J. A. Katz & D. Shepherd (Eds.), Corporate Entrepreneurship (pp. 1-6). Oxford: Elsevier.
Singh, S., Corner, P., & Pavlovich, K. (2007). Coping with entrepreneurial failure. Journal of Management & Organization, 13(4), 331-344.
Sitkin, S. B. (1992). Learning Through Failure: The Strategy of Small Losses. Resaerch in Organizational Behavior, 14, 231-266.
Skinner, B. F. (1953). Science and Human Behavior. New York: Free Press, Lond., Collier-macmillan.
Stevenson, H. H., & Jarillo, J. C. (2007). A Paradigm of Entrepreneurship: Entrepreneurial Management. In A. Cuervo, D. Ribeiro & S. Roig (Eds.), Entrepreneurship : Concepts, Theory and Perspective. (pp. 155-170). Dordrecht: Springer-Verlag Berlin and Heidelberg GmbH & Co. KG.
Stokes, D., & Blackburn, R. (2002). Learning the hard way: the lessons of owner-managers who have closed their businesses. Journal of Small Business and Enterprise Development, 9, 17-27.
Tashakkori, A., & Teddlie, C. (Eds.). (2002). Handbook of Mixed methods in social & behavioral research. Thousand Oaks: Sage Pablications Inc.
Timmons, J. A., & Spinelli, S. (2009). New venture creation : entrepreneurship for the 21st century (8th ed.). Boston, Mass.: McGraw-Hill/Irwin.
Ucbasaran, D., Westhead, P., & Wright, M. (2008). Opportunity Identification and Pursuit: Does an Entrepreneur’s Human Capital Matter? Small Business Economics, 30(2), 153-173.
Wang, C. L. (2008). Entrepreneurial orientation, learning orientation, and firm performance. Entrepreneurship: Theory and Practice, 26(3), 635(623).
Watson, J., & Everett, E. J. (1993). Defining Small Business Failure. International Small Business Journal, 11(3), 35-48.
Westhead, P., & Wright, M. (1998). Novice, portfolio, and serial founders: are they different? Journal of Business Venturing, 13(3), 173-204.
Wooldridge, A. (2009). A special report on entrepreneurship. The Economist. Yin, R. K. (2003). Case Study Research, Design and methods (3rd ed. Vol. 5). Thousand
oaks: Sage publications Inc.
© 2011 RossiSmith Academic Publishing, JAES, Vol VII, Iss 2, December 2011, Refereed Edition, Page:
125
IS THE WORLD OF VENTURE CAPITAL INVESTORS TURNING FLAT?
PERSPECTIVES OF RADICAL STRATEGIC CHANGES IN HIGH-TECHNOLOGY NEW VENTURE
Eyal Benjamina, Eli Gimmonb and Liora Katzensteina
aSwinburne University of Technology, Melbourne, Australia bTel-Hai College, Upper Galilee, Israel
ABSTRACT
High-technology new ventures (HTNVs) usually operate in a dynamic environment, with
high levels of uncertainty; therefore they often require radical changes in strategy. The
perspective of venture capital investors (VCs) – the main source of funding for HTNVs –
towards radical changes in strategy (RSC) is therefore crucial to the understanding causes
of radical strategic change in these new ventures. This paper examines the effect of
cultural differences on the approach of VCs to RSC. A mixed-method methodology of
semi-structured interviews was employed to compare Israeli with non-Israeli investor
groups. Most of the investors agreed that radical strategic changes are likely to occur in
new ventures, but they did not consider them to be favourable events. While previous
research suggested that cultural differences should be expected, our findings surprisingly
indicated limited cross-cultural differences among the VCs. Unlike the non-Israeli
investors, the Israeli investors deemed RSC events to be influenced significantly more by
internal causes than by external ones. Based on the findings, we conclude that VCs from
different developed countries share fairly similar views of RSC in HTNVs. A possible
explanation of this lack of difference might be the comparatively small VC community
and globalization of the high-technology venture markets.
Keywords: Venture capital • High-technology new ventures • Strategic change • Cultural
differences • Israel
© 2011 RossiSmith Academic Publishing, JAES, Vol VII, Iss 2, December 2011, Refereed Edition, Page:
126
INTRODUCTION
In recent years the high-technology industry has adopted a global orientation, with
technologies designed in one country made to fit users in many others. The venture
capital finance industry, traditionally dominated by US firms, appears to be following the
globalization trend, with European and Asian VC firms joining the industry (MacMillan
et al. 2008). However, the 2008 Global Entrepreneurship Monitor (GEM) report asserted
that early-stage entrepreneurial activities vary across countries (Bosma et al. 2009), with
the highest adult-population prevalence rates of high-growth expectation entrepreneurs
found in high-income countries such as the US, Israel, Iceland, and Canada. The findings
of Lee et al. (2011) also demonstrated the role of culture in entrepreneurial orientation,
indicating significant differences among the countries in most entrepreneurial orientation
dimensions. The identification of country-specific entrepreneurial concepts can be useful
for researchers of international entrepreneurship, as well as practitioners operating in
different countries (Gupta and Fernandez 2009).
High-technology new ventures (HTNVs) are unique within the world of entrepreneurial
ventures. They usually operate in a dynamic environment, characterized by high levels of
uncertainty due to the newness of the technology, markets, and products involved.
HTNVs are commonly expected to have high growth rates which are associated with
various crises (Hanks et al. 1993). Following the resource based view of the firm,
sometimes changes are to a level that “it is difficult to know how to organize a firm”
(Alvarez and Barney 2005: 777). Due to the rapid change in emergent industries, and
especially high-technology, new venture strategies must change in order to survive
(Shepherd, Douglas and Shanley 2000). Radical strategic change (RSC) is a common
event in HTNVs, marked by a conflict between a proposed new opportunity and the risk
of departing from the planned and approved strategy (Farjoun 2007). The successful
execution of strategic change is a rare achievement, and such change may have a crucial
impact on organizations (Beaver 2003). Since venture capitalists are an important funding
source for HTNVs, and are therefore involved in the strategy process of their portfolio
companies (Sapienza and De Clercq 2000), their perspective along with their changed
perspectives are crucial to understanding the causes of RSC in HTNVs.
© 2011 RossiSmith Academic Publishing, JAES, Vol VII, Iss 2, December 2011, Refereed Edition, Page:
127
The effect of culture on the decision patterns and organizational behavior of VCs has
been explored in different countries (Bruton and Ahlstrom 2003; Manigart et al. 2002;
Morris et al. 2000; Sapienza et al. 1996; Wright et al. 2004). Most of the studies have
examined the cultural aspects of venture capital by focusing on each specific country and
outlining significant differences in investment activity between countries and between
local and foreign VCs. However, cross-cultural research in the field of entrepreneurship is
still in its infancy and underexplored (Engelen et al. 2009; Wright et al. 2005). In light of
the tension between globalization pressures and the inherent localization of VCs (Iriyama
et al. 2010) further research of the globalization of the venture capital industry is required.
Radical changes in strategy involve increased risk and are a common source of friction
between investors and company management. The question arises of whether cross-
country cultural differences are reflected in the attitudes of venture capital investors
towards RSC. Israel is well known for its HTNV industry, as well as high
entrepreneurship levels (Senor and Singer 2009). However, it is relatively small,
homogeneous, and culturally distinct in comparison with other developed countries.
Drawing from previous research on the subject, this study compares the perspectives of
private investors in Israel with those of non-Israeli investors regarding RSC.
We examine the cultural perspectives of high-technology investors by looking at their
perceptions of the causes of RSC in their portfolio companies. This will contribute to the
underexplored field of the attitudes of VCs from different cultures towards strategic
changes (Pettigrew et.al. 2001; Alvesson and Sveningsson. 2007).
LITERATURE REVIEW
Venture capital investors
The foundations of the venture capital industry in its current format are often traced to
1946, when United States Brigadier General Georges Doriot, recognizing the need for
risk capital, created ARD (American Research and Development Corporation) to supply it.
The development of the venture capital industry in the United States was encouraged by
legislation of the Small Business Investment Act of 1958, which allowed the US Small
© 2011 RossiSmith Academic Publishing, JAES, Vol VII, Iss 2, December 2011, Refereed Edition, Page:
128
Business Administration (SBA) to license private “small business investment companies”
(SBICs) to help finance and manage small enterprises in the United States. The public
success of the venture capital industry in the 1970s encouraged the proliferation of
venture capital investment firms. During the 1980s, due to factors such as changes in
finical regulations, the number of VCs operating in the United States surged to over 650
(Florida and Kenny 1988; Gompers and Lerner 2004; Kenny, 2000).
American firms have traditionally been the largest participants in venture deals. In 1996
the United States venture capital pool was about three times larger than the total venture
capital pool in the 21 other countries where it existed. Moreover, about 70% of the
venture capital in the rest of the world was concentrated in three countries with strong ties
to the United States economy: Israel, Canada, and the Netherlands (Jeng and Wells, 2000).
Some may argue that countries with strong bank financing systems, like Germany and
Japan, have less need for venture capital, but research has demonstrated the inherent
differences between venture capital investments and bank finance (Mason and Stark
2004). In recent years non-United States venture investment has been increasing steadily,
as has the number and size of non-United States venture capitalists. The European venture
capital industry seems to be following the pattern of its US counterpart (Morris et al.
2000), with rapidly increasing awareness, size of investments, and number of exits
(European Private Equity and Venture Capital Association website; MacMillan et al.
2008). A similar phenomenon is also indicated in Asian countries such as Singapore,
Taiwan, and China (Bruton and Ahlstrom 2003). In light of the United States’ example,
policy makers believe that venture capital should be encouraged, because of its
association with the development of high-technology industries and national economic
growth (Timmons and Spinelli 2009).
Cultural aspects of new ventures
Following Hofstede’s (1991) comprehensive examination of the effect of culture on
organizational behavior, numerous researchers have explored the patterns of VC decision
making in different countries. However, in contrast with Hofstede (1991), the studies that
focus specifically on the cultural aspects of venture capital have generally been limited to
© 2011 RossiSmith Academic Publishing, JAES, Vol VII, Iss 2, December 2011, Refereed Edition, Page:
129
consideration of specific countries without comparisons between cultures. Paruthi et al.
(2003) compared India-based VCs with foreign VCs, outlining major differences in
investment activity between the two groups. Their findings corroborated those of Lockett
et al. (2002), who compared investment approaches of VCs in the United States, Hong
Kong, India, and Singapore, and those indicated by Morris et al.’s (2000) investigation of
the South African VC community. Mayer et al. (2005) concluded that neither financial
systems nor sources of finance adequately explain the pronounced variation among
different VC activities. However, Baughen and Neupert (2003) showed that cultural
aspects are dominant in the entrepreneurial process, and the Global Entrepreneurship
Monitor indicated that early-stage entrepreneurial activity varies across countries (Bosma
et al. 2008). In a general business context, organizational behavior is expected to vary
among countries due to different national cultures (Hofstede 1991; Ronen 2007). Based
on their previous research, it seems reasonable to expect a difference in the attitudes of
private investors to strategic events in their portfolio companies, corresponding to the
VC’s country of operation. Culture has a major impact on the executive mindset, as
demonstrated by the findings that executives from different cultural backgrounds vary in
their attitudes to change in organizational strategy, leadership profiles, and perceptions of
strategic issues (Barr and Glynn 2004; Geletkanycz 1997).
The avoidance of uncertainty is one of the cultural attributes measured by Hofstede
(1991) and House et al. (2004) as an indicator of managerial resistance to change.
Members of high uncertainty avoidance cultures tend to prefer a more solid structure,
together with clear rules and standardized operating procedures (Hofstede, 1991; House et
al. 2004). In comparison, executives with a cultural background characterized by low
uncertainty avoidance values are more comfortable with instability (de Vries and Miller
1986; Hambrick and Brandon 1988).
Strategy in HTNVs
Business strategy is one of the major factors affecting new venture performance (Baum et
al. 2001; Chrisman et al. 1998; Gartner et al. 1999; Vesper 1990). Business strategy could
be described by numerous definitions while Andrews (1971) is credited for being first to
© 2011 RossiSmith Academic Publishing, JAES, Vol VII, Iss 2, December 2011, Refereed Edition, Page:
130
define strategy formulation as a process of aligning firm capabilities and constrains with
environmental opportunities and threats. Mintzberg et al. (2003) focused on firm
dynamics which aligns the organization resources and capabilities with the environment,
aiming at sustainable competitive advantage. High-technology new ventures face a broad
range of strategic technological alternatives. Since technology markets play a role in
strategy formation, this process appears to be particularly complex (Arora et al. 2001;
Mathewes 2003). Venture capitalists (VCs) have also been found to consider strategy as a
major investment criterion. Focusing on strategy aspects, Shepherd et al. (2000) found
that the most important strategy-related criterion as considered by VCs in their
assessment of new venture profitability is founders’ industry-related competence,
followed by educational capability (resources and skills available to overcome market
ignorance by means of education), competitive rivalry, and timing.
While at a given time some factors such as market regulation and industry structure are
fixed, the strategy of a new venture is constantly subject to change. The founders of a new
venture present an initial strategic direction, which puts a constraint on subsequent
changes in strategy (Boeker 1989). Therefore the entrepreneurial-strategy formation
process can be regarded as either a "planned strategy" or an "emergent strategy" (Harries
et al. 2000).
In cases where small incremental changes are insufficient, the top management team may
decide on RSC and re-establishment of the new venture’s business strategy. Changes in
business orientation are generally classified by magnitude, that is, incremental vs.
dramatic (Miller et al. 1984: 203), or incremental vs. radical (Ginsberg and Abrahamson
1991), where radical changes involve business state and pattern. Rajagopalan and
Spreitzer (1996: 49) defined strategic change as “a difference in the form, quality, or state
over time in an organization’s alignment with its external environment, the fundamental
pattern of present and planned resource deployments and environmental interactions that
indicates how the organization will achieve its objectives.” Hopkins (1987) described
strategic change as “radical” rather than “ordinary” if it combined three distinct factors:
(1) a significant departure from the organization's former way of doing business; (2) far-
reaching effects; and (3) the generation of uncertainty and insecurity among
© 2011 RossiSmith Academic Publishing, JAES, Vol VII, Iss 2, December 2011, Refereed Edition, Page:
131
organizational members. Despite the differences, researchers agree that a radical change
in strategy is an outstanding event in a venture, worthy of scholarly attention in its own
right.
Substantial theoretical and empirical work has been conducted regarding strategy changes
in mature organizations (e.g. Gioia and Chittipeddi 1991; Rajagopalan and Spreitzer
1996; Stacey, 1995). In addition, cultural aspects such as uncertainty avoidance have been
found to influence strategic decision made by top management teams (TMT) and strategy
change factors (Corley 2004; Papadakis and Barwise 2002; Schwartz and Davis 1981).
However, the research of strategy change in new ventures still leaves an area uncovered
(Nicholls-Nixon et al. 2000).
Venture capitalists and RSC
The procedures by which VCs assess the survival and competitive advantage of new
ventures are largely consistent with those arising from the strategy literature (Shepherd
1999). Investors in new ventures are highly involved in business strategy formulation
(Ehrlich et al. 1994), and may consider increasing their involvement and leading radical
changes in strategy as an alternative to venture shutdown (DeTienne 2010; Wennberg et
al. 2010). Nevertheless, VCs are generally expected to dislike RSC; they may deem
changes to be potentially risky for organizations (Beaver 2003; Hannan and Freeman
1984; Hopkins 1987), or feel attrition of the initial appeal of the organization due to such
changes, causing them to leave (Schneider 1987).
Due to the fast pace of change in emergent industries, and especially in high tech, new
venture strategies require changes in order to survive:
Venture capitalists can assess a venture’s strategy and projected environment via a
business plan, but this only provides the strategic intentions behind the venture. Plans
almost certainly will not turn out as predicted, and the environment faced by a venture
will not be as anticipated and may change frequently. Performance will deteriorate if
changes in the environment are not detected by the entrepreneur(s), if strategies are not
© 2011 RossiSmith Academic Publishing, JAES, Vol VII, Iss 2, December 2011, Refereed Edition, Page:
132
reassessed, and if new strategies are not formulated and implemented. (Shepherd,
Douglas, and Shanley 2000: 399)
Research has shown that better understanding is needed about how investors assess a new
venture’s strategy (Shepherd, Ettenson, and Crouch 2000). Thus, the post-investment
activity of VCs in their portfolio companies is a fertile area for research (Tyebjee and
Bruno 1984: 1054). Investors’ attitude towards RSC can be explored based on decisions
made prior to or during execution of the RSC. Following Rajagopalan and Spreitzer
(1996), the focus of this study is on the content of strategic change rather than on the
process of its implementation.
Causes of strategic changes
Environmental changes may require changes in strategy, but the firm’s resources affect
the likelihood and the magnitude of these changes. Ecology and strategy researchers have
traditionally differed in their respective emphases regarding the phenomenon of strategic
change: ecologists have stressed that change should be rare, because organizations find
change very difficult and undesirable, but strategists have argued that change should be
more common because organizations can and should adapt (notwithstanding the
difficulties) to their changing organizational and environmental conditions (Zajac et al.
2000: 450). One way to estimate the frequency of RSC in high tech industries is to ask
VCs whether they find RSC to be a rare event in their portfolio companies.
Events causing RSC are commonly referred to as "environmental changes" (e.g. Bhide
1994; Kraatz and Zajac 2001; Rajagopalan and Spreitzer 1996). They are also viewed as
“changes in the strategic ‘recipes’ or ‘formulae’ that managers use to construe their
environment,” which are advocated internally by new members of the top management
team or externally by management consultants (Ginsberg and Abrahamson 1991: 174).
Zajac et al. (2000) found that the timing, direction, and magnitude of successful strategic
changes can be logically predicted on the basis of environmental forces and
organizational resources.

© 2011 RossiSmith Academic Publishing, JAES, Vol VII, Iss 2, December 2011, Refereed Edition, Page:
133
Miller and Friesen (1984: 28) asserted that organizations "reinforce or extend their past
structures and strategy-making practices, adhering to previous directions of evolution."
Such momentum also applies to recurrent changes that have been experienced in the past.
In other words, while faced with environmental changes, organizations continue to
extrapolate past trends. Furthermore, according to Papadakis (2002: 90), in addition to the
effect of the external environment, top management teams influence the strategic
decision-making process. Presenting a different angle, Nicholls-Nixon et al. (2000)
proposed that the level of perceived environmental hostility affects the level of strategic
change undertaken in new ventures. Still, the causes for these changes might be internal
(the company) or external (the environment), a factor that may also influence the
investor’s attitude towards RSC.
This study explores the views of investors in HTNVs in different countries regarding the
causes of RSC in their portfolio companies. House et al. (2004: 622) and Hofstede (1991:
151) ranked Israel as low on the uncertainty avoidance index. Such a cultural perspective
that allows high levels of uncertainty may indicate a relatively high propensity for change.
Hypothesis 1: RSC events are more likely to occur in Israeli HTNVs than in non-Israeli
HTNVs.
The high-technology industry is considered to be a highly turbulent environment where
RSCs are likely to be driven more by environmental (i.e. external) causes than by internal
ones (Farjoun 2007). Furthermore, in light of the “culture-free” structural characteristics
of HTNVs (Engelen et al. 2009), environmental conditions may have the same effect in
countries characterized by different cultures.
Hypothesis 2:
(a) RSCs in HTNVs will be initiated more by external rather than internal causes.
(b) Israeli HTNVs will not differ from non-Israeli HTNVs in terms of the division
between internal and external causes of RSC.
© 2011 RossiSmith Academic Publishing, JAES, Vol VII, Iss 2, December 2011, Refereed Edition, Page:
134
METHODOLOGY
The issue of strategic change can be explored at the micro and macro levels. Based on
Meyer et al. (1990) and Scott (2000: 7), we shifted away from the individual organization
level to the industry level and focused on the portfolios of VCs. The top-level view of the
HTNV industry is that of the venture capital investors that are involved in firms of this
type. The investors’ view of strategy changes in new ventures was obtained by means of a
mixed-method survey (Johnson and Onwuegbuzie 2004), to enable understanding and
representation of the experiences and actions of people as they encounter, engage, and
live through situations (Elliott et al. 1999: 216). This view of RSC was explored by
qualitative analysis of textual data, as well as attitudes and views expressed by the
interviewees. The research procedure, based on mixed-method methodology (Morgan
1998: 370) consisted of two main stages: we first conducted an exploratory qualitative
study of 16 investors, and then performed quantitative analysis of the 59 reports of RSC
events. This approach is especially recommended for research in the field of
entrepreneurship when seeking “concepts that enhance the understanding of social
phenomena in a natural setting, with the emphasis on the meanings, experiences and
views of all participants” (Neergaard and Ulhoi 2006: 4).
Following Wright et al. (2004), we selected a multi-country sample of HTNV investors in
order to compare cultural attributes. The study focuses on the venture capital industry in
Israel, which currently includes 42 venture capital funds (High-Tech Industry Association
2008). It is relatively small and homogenous, but is considered significant in the global
context (Senor and Singer 2009). According to the Globe survey, Israel is classified in the
Latin Europe cluster, together with Italy, Portugal, Spain, France, and Switzerland (House
et al. 2004: 32), and rated in band C in terms of uncertainty avoidance (House et al. 2004:
622). We compared Israel with other developed countries that belong to different clusters
and are rated with higher levels of uncertainty avoidance (bands A or B).
The sample was comprised of 8 investors of different venture funds that operate in Israel
and 8 investors that operate in 6 other countries: USA, UK, Norway, Singapore, Korea,
and Taiwan. The latter (foreign) 8 investors were somewhat familiar with the Israeli
© 2011 RossiSmith Academic Publishing, JAES, Vol VII, Iss 2, December 2011, Refereed Edition, Page:
135
venture industry, although they operated in their home countries. In order to control for
national growth (following the GEM report; Bosma et al. 2008) and create a homogenous
cohort, all 7 countries of operation chosen were developed economies. The selected
investors operated in different high-technology sectors such as software, medical devices,
and digital signal processing. Out of the 16 interviewees, 5 were business angels and 11
were VCs, since these two types of investors represent similar attitudes (Mason and Stark
2004). All the selected investors had been engaged in early-stage high-technology
investments for at least two years prior to the interview, reporting an aggregate of 82
early-stage investments out of 89 investments made during the last two years.
Data were collected from the investors by means of semi-structured interviews, conducted
in Hebrew or English. The interviews were taped and later transcribed and tabulated, in
order to compare the responses of all interviewees, as recommended by Myles and
Huberman (1994). Patterns were sought in the data by looking for consistencies and
inconsistencies in the attitudes the VCs espoused before and after the presentation of
results from previous research. The interviews were analyzed using NVivo software
(Richards 1999), marking and cross-referencing statements made throughout the
interviews. Two independent coders classified the phrases describing the causes of RSC
into either internal or external factors. The Cohen Kappa test on levels of disagreement
indicated very good agreement between the coders (Kappa value 0.828). The coders then
discussed the differences and created an agreed classified list of causes, except for one
phrase, which was therefore excluded from the sample analysis.
The questions were designed to reveal the attitudes of investors to RSC, including the
importance they ascribed to strategy as an investment criterion (Fried and Hisrich 1994;
Sandberg et al. 1988; Shepherd 1999; Tyebjee and Bruno 1984). The interviewees were
also asked about their perception of the causes of RSC and the frequency (or rarity) of
their occurrence in their portfolio companies. At first, the interviewers asked the investors
open-ended questions about the reasons for strategic change and their attitudes toward
this phenomenon. Later, the findings of previous research were presented, and the VCs
were asked for their views again.
© 2011 RossiSmith Academic Publishing, JAES, Vol VII, Iss 2, December 2011, Refereed Edition, Page:
136
RESULTS
The data analysis began with determination of whether the investors considered RSC to
be a rare event. In the 16 conducted interviews, the respondents classified 32 of the 82
early-stage investment cases as RSC events such as change in the business model or
shifting to a different market. Only one of the respondents indicated that she/he had not
encountered even one RSC in his portfolio companies. The findings also indicated that
the number of RSCs encountered in early-stage investments ranged from 0% (1
respondent) to 100% (2 respondents) of all cases, with an average of about 40% of
investments and a mode of 50% of investments having experienced an RSC (see Table 1).
Next, a comparison was made between the Israeli and non-Israeli investors, in order to
examine the possibility of cultural perspective. The overall percentage of RSCs relative to
the total early-stage investments was in the range of 40%. The figure for the non-Israeli
investors was approximately 45%, while the Israeli investors reported an average of 35%
RSCs in their portfolio companies. A two-tailed t-test was used to compare the two
independent sample means, producing a t-test critical value of 2.144 (p = 0.05). The t-test
yielded a t value of -1.068 with a degree of freedom of 14. This confirms that there is no
statistically significant difference between the mean number of RSCs of non-Israeli
investors and that of Israeli investors, since the test statistic |-1.068| does not meet or
exceed the critical value of 2.144 for a two-tailed t-test.
A chi-square analysis, including Yates’ correction for a single degree of freedom (Yates
1934), yielded a significant chi-square statistic: χ²(0.05) = 0.561, (p > 0.05). This
indicates that the subsamples of investors by country and number of radical strategic
changes by country were statistically independent.

© 2011 RossiSmith Academic Publishing, JAES, Vol VII, Iss 2, December 2011, Refereed Edition, Page:
137
Table 1: Characteristics of interviewees
Code Typea Country Number of early-‐stage investments
Number of RSC events
Investment field
A1 BA UK 3 2 Optical A2 BA USA Israel 4 2 Diverse portfolio A3 BA Singapore 1 1 Industrial high tech
A4 BA USA 10 5 Medical devices, medical services
A5 BA Israel 1 1 Biotechnology, digital signal processing
VC1 VC Israel 6 3 Industrial high tech VC2 VC Israel 2 3 Software
VC3 VC Europe USA 5 1 Biotechnology, clean technology
VC4 VC Korea 2 0 Information technology, biotechnology
VC5 VC Israel 4 3 Information and communication technology
VC6 VC Israel 10 1 Diverse portfolio
VC7 VC Israel Taiwan 5 3
Software, semiconductors, medical devices
VC8 VC Israel 5 1 Information technology, software
VC9 VC Israel 7 2 Internet, new media VC10 VC Israel 11 3 ICT, clean tech VC11 VC Norway 3 1 Diverse portfolio Total 82 32 a BA = business angel; VC = venture capital firm
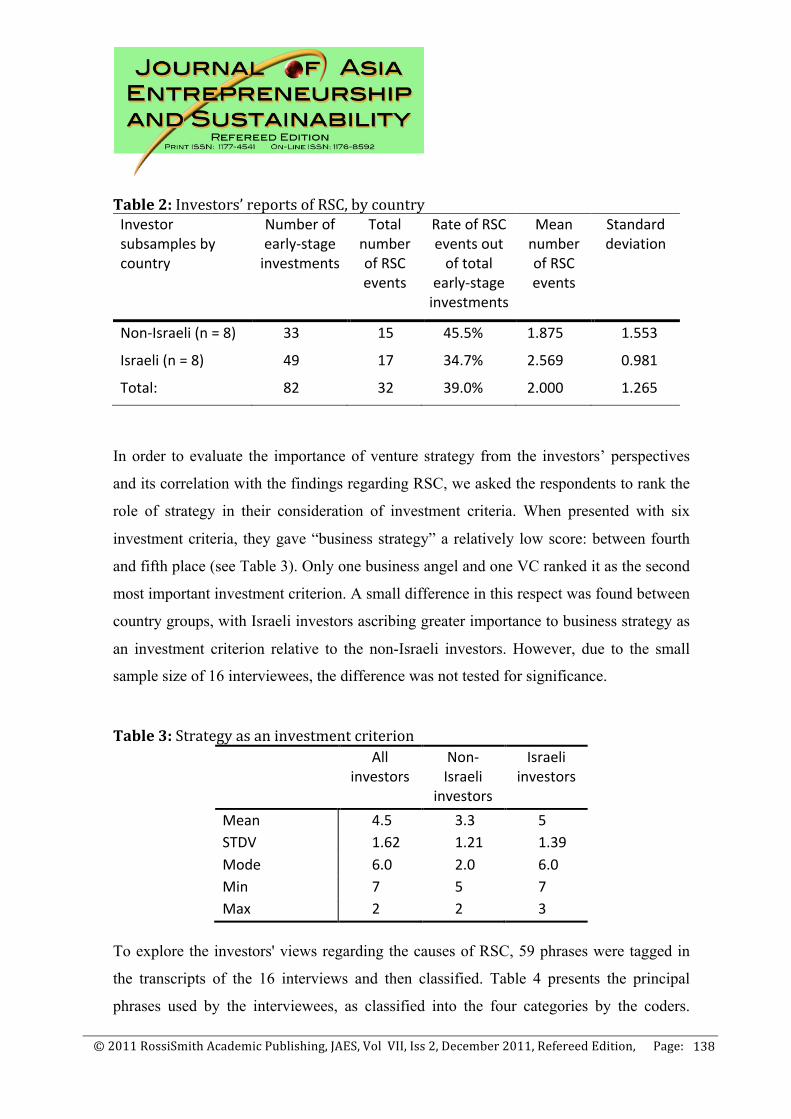
© 2011 RossiSmith Academic Publishing, JAES, Vol VII, Iss 2, December 2011, Refereed Edition, Page:
138
Table 2: Investors’ reports of RSC, by country Investor subsamples by country
Number of early-‐stage investments
Total number of RSC events
Rate of RSC events out of total
early-‐stage investments
Mean number of RSC events
Standard deviation
Non-‐Israeli (n = 8) 33 15 45.5% 1.875 1.553
Israeli (n = 8) 49 17 34.7% 2.569 0.981
Total: 82 32 39.0% 2.000 1.265
In order to evaluate the importance of venture strategy from the investors’ perspectives
and its correlation with the findings regarding RSC, we asked the respondents to rank the
role of strategy in their consideration of investment criteria. When presented with six
investment criteria, they gave “business strategy” a relatively low score: between fourth
and fifth place (see Table 3). Only one business angel and one VC ranked it as the second
most important investment criterion. A small difference in this respect was found between
country groups, with Israeli investors ascribing greater importance to business strategy as
an investment criterion relative to the non-Israeli investors. However, due to the small
sample size of 16 interviewees, the difference was not tested for significance.
Table 3: Strategy as an investment criterion
All investors
Non-‐Israeli
investors
Israeli investors
Mean 4.5 3.3 5 STDV 1.62 1.21 1.39 Mode 6.0 2.0 6.0 Min 7 5 7 Max 2 2 3
To explore the investors' views regarding the causes of RSC, 59 phrases were tagged in
the transcripts of the 16 interviews and then classified. Table 4 presents the principal
phrases used by the interviewees, as classified into the four categories by the coders.
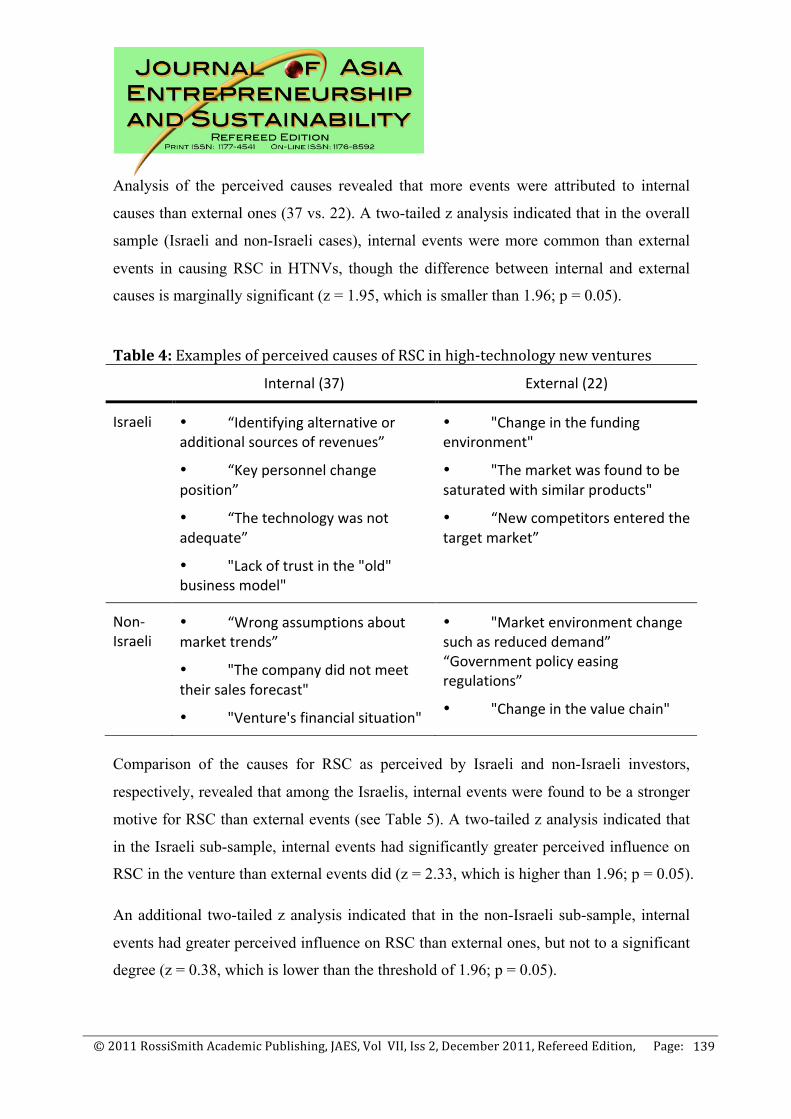
© 2011 RossiSmith Academic Publishing, JAES, Vol VII, Iss 2, December 2011, Refereed Edition, Page:
139
Analysis of the perceived causes revealed that more events were attributed to internal
causes than external ones (37 vs. 22). A two-tailed z analysis indicated that in the overall
sample (Israeli and non-Israeli cases), internal events were more common than external
events in causing RSC in HTNVs, though the difference between internal and external
causes is marginally significant (z = 1.95, which is smaller than 1.96; p = 0.05).
Table 4: Examples of perceived causes of RSC in high-‐technology new ventures
Internal (37) External (22)
Israeli • “Identifying alternative or additional sources of revenues”
• “Key personnel change position”
• “The technology was not adequate”
• "Lack of trust in the "old" business model"
• "Change in the funding environment"
• "The market was found to be saturated with similar products"
• “New competitors entered the target market”
Non-‐Israeli
• “Wrong assumptions about market trends”
• "The company did not meet their sales forecast"
• "Venture's financial situation"
• "Market environment change such as reduced demand” “Government policy easing regulations”
• "Change in the value chain"
Comparison of the causes for RSC as perceived by Israeli and non-Israeli investors,
respectively, revealed that among the Israelis, internal events were found to be a stronger
motive for RSC than external events (see Table 5). A two-tailed z analysis indicated that
in the Israeli sub-sample, internal events had significantly greater perceived influence on
RSC in the venture than external events did (z = 2.33, which is higher than 1.96; p = 0.05).
An additional two-tailed z analysis indicated that in the non-Israeli sub-sample, internal
events had greater perceived influence on RSC than external ones, but not to a significant
degree (z = 0.38, which is lower than the threshold of 1.96; p = 0.05).
© 2011 RossiSmith Academic Publishing, JAES, Vol VII, Iss 2, December 2011, Refereed Edition, Page:
140
Table 5: Perceived causes of RSC: Israeli vs. non-‐Israeli investors Internal External Total
All 37 22 59
Israeli 22 9 31
Non-‐Israeli 15 13 28
DISCUSSION
The findings of this study do not support most of the hypotheses that were formulated on
the basis of previous research.
Hypothesis 1 – RSC events are more likely to occur in Israeli HTNVs than in non-Israeli
HTNVs – was not supported. Actually, the non-Israelis reported higher percentage of
RSC events relative to the number of investments in their portfolio companies than the
Israeli investors did. However, the difference between the mean number of RSCs in the
portfolios of non-Israeli and Israeli investors, respectively, was not statistically significant.
Hypothesis 2 (a) – RSCs in HTNVs will be initiated more by external rather than
internal causes – was not supported. In fact, the opposite was found: according to the
overall sample, internal events were more often (although with only marginal
significance) the cause of RSC in HTNVs, compared with external events.
Hypothesis 2 (b) – Israeli HTNVs will not differ from non-Israeli HTNVs in terms of the
division between internal and external causes of RSC – was not supported. The Israeli
investors indicated significantly more internal versus external causes for RSC in
comparison with the non-Israeli investors.
In summary, cultural differences between Israeli and non-Israeli investors were found to
be significant with regard to only one of the three tested hypotheses: the Israeli investors
perceived internal events as the cause of RSC significantly more than the non-Israeli
investors, who showed no statistical bias towards internal or external causes. Contrary to
expectations, no significant differences were found with regard to the other tested issue:
the non-Israelis reported more (about 45%) RSC events in their portfolio companies than
© 2011 RossiSmith Academic Publishing, JAES, Vol VII, Iss 2, December 2011, Refereed Edition, Page:
141
the Israeli group (which reported about 35% RSCs), but the difference between the two
groups was not statistically significant. The Israeli investors ascribed greater importance
to business strategy as an investment criterion compared with the non-Israeli investors;
however this finding should be verified in a larger sample.
Based on these findings, we argue that attitudes of VCs towards changes in their ventures
are quite similar across different cultures of developed economies. This conclusion
supports Morris et al. (2000), who attributed the common views to the firm establishment
of the roots of the VC community in the United States, and the fact that most global
industry professionals continue to model themselves on the US community. Moreover,
the prominent global characteristics of technological ventures may explain the apparently
limited sensitivity to culture in the perceptions of these investors regarding RSC.
However, there is no consensus in previous research regarding the globalized trend of the
VC industry. Meta-analysis of previous studies have demonstrated more cultural
differences than similarities in the international VC industry (Wright et al. 2005).
Similarly, Iriyama et al. (2010) found that cross-border VC flows have a subtly regional
character, contrary to the implications of nation-level globalization. They further argued
that the ongoing globalization of VC flows does not signify a flattening of the competitive
landscape, and the locally bounded nature of venture capitalists’ competitive advantage
may still be operative. Based on our findings, we assert that the patterns characterizing
the VC industry, as perceived by VCs in regard to HTNV strategy, is becoming flat,
demonstrating less variation among different cultures or country-specific patterns.
However, there are still some cultural differences, indicating that the world of venture
capital investors is not yet completely flat.
The finding that Israeli VCs encountered fewer RSC events (though not to a significant
extent) compared with their counterparts in the US, Europe, Singapore, Korea, and
Taiwan, may be due to the Israeli investors' attitude toward radical changes. Although the
interviewers defined “radical strategic change” as a major change, some Israeli VCs were
more tolerant regarding changes made in their portfolio ventures, which they considered
“normal” events. This explanation fits the expected national cultural differences
© 2011 RossiSmith Academic Publishing, JAES, Vol VII, Iss 2, December 2011, Refereed Edition, Page:
142
(Hofstede 1991; House et al. 2004; Ronen 2007) between Israeli and non-Israeli
management people. The reason for this may be the Israelis’ expectation of higher
uncertainty, since their start-ups are located at a distance from their target markets in the
US, Europe, and the Far East. Furthermore, the large overall number of RSC events might
be due to prior experience in performing RSCs. Aldrich (2006: 138) has shown that the
likelihood of transformations increases with the number of prior changes. Since VCs are
involved in the TMT of several startups, they are exposed to a larger number of RSCs, a
situation that increases their propensity for future RSCs.
For practitioners, these findings mean that all investors, regardless of cultural
background, should be ready for an RSC in their high-technology new ventures. Our
findings support recent research indicating that RSC is not a rare event in new ventures.
Furthermore, the current result that early-stage high-technology investors find RSC to be
a highly common event contradicts the claim by Hannan and Freeman (1984) that such
events are expected to be rare. Moreover, they also indicate that RSC is not as risky or
costly as claimed by Hannan and Freeman (1984); in this study, only about half of the
cases required additional funding. In light of the wide agreement among interviewees that
RSC had a positive impact on the venture, it seems that the additional investment of funds
would be justified. The awareness of RSC can be explained by the dynamic nature of new
technologies and their impact on high-technology new ventures, features that are well
known to stakeholders in this industry. This is in line with Schneider’s (1987) ASA
(attraction–selection–attrition) framework, which suggested organizations are not capable
of changing unless they contain people with appropriate inclinations.
A common limitation of the mixed-method methodology employed in this study is the
sample size. The qualitative analysis was based on 16 interviews, representing 82 early-
stage investments. In order to expand the macro-level view provided in this study, further
research of the micro view, using a larger sample of early-stage investments and a broader
quantitative analysis, is needed to validate the findings of this study. Another limitation is
the reliance on the investors’ espoused investment criteria as coming out of their
introspection, which may differ from their actual in-use criteria (Shepherd 1999;
Zacharakis and Meyer 1998). Further comparative studies of multi-cultural views might
© 2011 RossiSmith Academic Publishing, JAES, Vol VII, Iss 2, December 2011, Refereed Edition, Page:
143
reveal differences as well as similarities in the perspectives of investors from different
countries and enhance the effectiveness of this global industry.
REFERENCES
Andrews K. (1971) The concept of corporate strategy. Dow Jones: Homewood, IL. Alvarez SA, Barney JB (2005) How do entrepreneurs organize firms under conditions of
uncertainty? Journal of Management 31(5):776-793 Alvesson M, Sveningsson S. (2007) Changing organizational culture: cultural change
work in progress. Taylor & Francis: New York Arora A, Fosfuri A, Gambardella A (2001) Markets for technology and their implications
for corporate strategy. Industrial and Corporate Change 10(2): 419-451 Barr PS, Glynn MA (2004) Cultural variations in strategic issue interpretation: relating
cultural uncertainty avoidance to controllability in discriminating threat and opportunity. Strategic Management Journal 25(1): 59-67
Baughn CC, Neupert KE. (2003) Culture and National Conditions Facilitating Entrepreneurial Start-ups. Journal of International Entrepreneurship 1(3): 313-330
Baum JR, Locke EA, Smith KG (2001) A multidimensional model of venture growth. Academy of Management Journal 44(2): 292-303
Beaver G (2003) Small business: success and failure. Strategic Change 12(3): 115-122 Bhide A (1994) How entrepreneurs craft strategies that work. Harvard Business Review
72(2): 150-161 Boeker W (1989) Strategic change: the effects of founding and history. Academy of
Management Journal 32(3): 489-515 Bosma N, Acs ZJ, Autio E, Coduras A, Levie J (2009) Global entrepreneurship monitor:
2008 executive report. Babson College and London Business School, Babson Park, MA
Bosma N, Jones K, Autio E, Levie J (2008) Global entrepreneurship monitor: 2007 executive report. Babson College and London Business School, Babson Park, MA
Bruton GD, Ahlstrom D (2003) An institutional view of China's venture capital industry: explaining the differences between China and the West. Journal of Business Venturing 18(2): 233-259
Chrisman JJ, Bauerschmidt A, Hofer CW (1998) The determinants of new venture performance: an extended model. Entrepreneurship: Theory and Practice 23(1): 5-7
Corley KG (2004) Defined by our strategy or our culture? Hierarchical differences in perceptions of organizational identity and change. Human Relations 57(9): 1145
de Vries MFRK, Miller D (1986) Personality, culture, and organization. Academy of Management Review 11(2): 266-279
DeTienne DR (2010) Entrepreneurial exit as a critical component of the entrepreneurial process: theoretical development. Journal of Business Venturing 25(2): 203-215
© 2011 RossiSmith Academic Publishing, JAES, Vol VII, Iss 2, December 2011, Refereed Edition, Page:
144
Elliott R, Fischer CT, Rennie DL (1999) Evolving guidelines for publication of qualitative research studies in psychology and related fields. British Journal of Clinical Psychology 38(3): 215-229
Engelen A, Heinemann F, Brettel M (2009) Cross-cultural entrepreneurship research: Current status and framework for future studies. Journal of International Entrepreneurship 7(3): 163–189
European Private Equity and Venture Capital Association, Industry Statistics. http://www.evca.eu/knowledgecenter/statisticsdetail.aspx?id=416
Accessed: 24 August 2011 Farjoun, M (2007) The end of strategy? Strategic Organization 5:198-211 Florida RL, Kenney M (1988) Venture capital-financed innovation and technological
change in the USA. Research Policy 17(3): 119-137 Fried VH, Hisrich RD (1994) Toward a model of venture capital investment decision
making. Financial Management 23(3): 28-37 Gartner WB, Starr JA, Bhat S (1999) Predicting new venture survival: an analysis of
“anatomy of a start-up.” cases from Inc. Magazine. Journal of Business Venturing 14(2): 215-232
Geletkanycz MA. 1997. The salience of ‘culture’s consequences’: The effects of cultural values on top executive commitment to the status quo. Strategic Management Journal 18(8): 615-634
Ginsberg A, Abrahamson E (1991) Champions of change and strategic shifts: the role of internal and external change advocated. Journal of Management Studies 28(2): 173-190
Gioia DA, Chittipeddi K (1991) Sensemaking and sensegiving in strategic change initiation. Strategic Management Journal 12(6): 433-448
Gompers PA, Lerner J (2004) The venture capital cycle. The MIT Press: Cambridge MA Gupta V, Fernandez C (2009) Cross-cultural similarities and differences in characteristics
attributed to entrepreneurs. Journal of Leadership & Organizational Studies 15(3): 304-318
Hambrick, DC and Brandon G (1988) Executive values. The executive effect: Concepts and methods for studying top managers. In: Hambrick DC (ed) The executive effect: concepts and methods for studying top managers. Vol. 2: 3-34. Elsevier Science/JAI Press: US
Hanks SH, Watson CJ, Jansen E, Chandler GN (1993) Tightening the life-cycle construct: a taxonomic study of growth stage configurations in high-technology organizations. Entrepreneurship: Theory and Practice 18(2): 5-30
Hannan MT, Freeman J (1984) Structural inertia and organizational change. American Sociological Review 49(2): 149-164
Harris S, Forbes T, Fletcher M. (2000) Taught and enacted strategic approaches in young enterprises. International Journal of Entrepreneurial Behaviour & Research 6(3): 125-144
© 2011 RossiSmith Academic Publishing, JAES, Vol VII, Iss 2, December 2011, Refereed Edition, Page:
145
High-Tech Industry Association [HTIA], Venture capital in Israel: financial investors, 2008. Retrieved from: http://www.iva.co.il/index.php?option=com_content&view=article&id=50&Itemid=58
Hofstede G (1991) Culture and organizations: software of the mind. McGraw-Hill, London
Hopkins WE. (1987) Impacts of radical strategic change and radical strategic events on corporate culture. American Business Review 5: 42-48
House RJ, J. HP, M. J, W. DP, V. G. 2004. Culture, leadership, and organizations: The GLOBE study of 62 societies. Sage Publications, Inc: London
Iriyama A, Li Y, Madhavan, R (2010) Spiky globalization and venture capital investments: the influence of prior human networks. Strategic Entrepreneurship Journal 4: 128–145
Jeng LA, Wells PC. 2000. The determinants of venture capital funding: evidence across countries. Journal of corporate Finance 6(3): 241-289
Johnson RB, Onwuegbuzie AJ (2004) Mixed methods research: a research paradigm whose time has come. Educational Researcher 33(7): 14-26
Kraatz MS, Zajac EJ (2001) How organizational resources affect strategic change and performance in turbulent environments: theory and evidence. Organization Science 12(5): 632-657
Lee SM, Lim SB, Pathak, RD (2011) Culture and entrepreneurial orientation: a multi-country study. International Entrepreneurship Management Journal 7: 1-15
Lockett A, Wright M, Sapienza H, Pruthi S (2002) Venture capital investors, valuation and information: a comparative study of the US, Hong Kong, India and Singapore. Venture Capital: An International Journal of Entrepreneurial Finance 4(3): 237-252
MacMillan I, Roberts E, Livada V, Wang A (2008) Corporate venture capital (CVC): seeking innovation and strategic growth. National Institute of Standards and Technology, US Department of Commerce Washington
Manigart S, De Waele K, Wright M, Robbie K, Desbrieres P, Sapienza HJ, Beekman A (2002) Determinants of required return in venture capital investments: a five-country study. Journal of Business Venturing 17(4): 291-312
Mason C, Stark M (2004) What do investors look for in a business plan?: a comparison of the investment criteria of bankers, venture capitalists and business angels. International Small Business Journal 22(3): 227
Mathews JA. 2003. Strategizing by firms in the presence of markets for resources. Industrial and Corporate Change 12(6): 1157-1193
Mayer C, Schoors K, Yafeh Y (2005) Sources of funds and investment activities of venture capital funds: evidence from Germany, Israel, Japan and the United Kingdom. Journal of Corporate Finance 11(3): 586-608
Meyer AD, Brooks GR, Goes JB (1990) Environmental jolts and industry revolutions: organizational responses to discontinuous change. Strategic Management Journal 11(5): 93-110
© 2011 RossiSmith Academic Publishing, JAES, Vol VII, Iss 2, December 2011, Refereed Edition, Page:
146
Miller D, Friesen PH, Mintzberg H (1984) Organizations: a quantum view. Prentice-Hall, Englewood Cliffs, N.J.)
Mintzberg H, Lampel JB, Quinn JB, Ghoshal S. (2003) The strategy process concepts, contexts, cases: Concepts, Contexts, Cases. Prentice Hall: New Jersey
Morgan DL (1998) Practical strategies for combining qualitative and quantitative methods: applications to health research. Qualitative Health Research 8(3): 362-376
Morris H M, Watling J W, Schindehutte M (2000) Venture capitalist involvement in portfolio companies: insights from South Africa. Journal of Small Business Management 38(3): 68-77
Myles M, Huberman S (1994) Qualitative data analysis. Sage Publications, Newbury Park, California
Neergaard H, Ulhoi J (2006) Handbook of qualitative research methods in entrepreneurship research. Elgar, Cheltenham, UK
Nicholls-Nixon CL, Cooper AC, Woo CY (2000) Strategic experimentation Understanding change and performance in new ventures. Journal of Business Venturing 15(5-6): 493-521
Papadakis VM, Barwise P (2002) How Much do CEOs and top managers matter in strategic decision making? British Journal of Management 13(1): 83-95
Paruthi S, Wright M, Lockett A (2003) Do foreign and domestic venture capital firms differ in their monitoring of investees? Asia Pacific Journal of Management 20: 175-204
Pettigrew AM, Woodman RW, Cameron KS. 2001. Studying organizational change and development: Challenges for future research. The Academy of Management Journal 44(4): 697-713
Rajagopalan N, Spreitzer GM (1996) Toward a theory of strategic change: a multi-lens perspective and integrative framework. The Academy of Management Review 22(1): 48-79
Richards L (1999) Data alive!: the thinking behind NVivo. Qualitative Health Research 9(3): 412-428
Ronen S (2007) The New cultural geography: clustering cultures on the basis of organizational behavior dimensions – an update. Invited keynote address. Xth European Conference of Psychology, Prague
Sapienza HJ, De Clercq D (2000) Venture capitalist-entrepreneur relationships in technology-based ventures. Enterp & Innovation Mgmt Std 1(1): 57-71
Sapienza HJ, Manigart S, Vermeir W (1996) Venture capitalist governance and value added in four countries* 1. Journal of Business Venturing 11(6):439-469
Schneider B (1987) The people make the place. Personnel Psychology 40(3): 437-453 Schwartz H, Davis SM (1981) Matching corporate culture and business strategy.
Organizational Dynamics 10(1): 30-48 Scott WR (2000) Institutional change and healthcare organizations: From professional
dominance to managed care. University of Chicago Press, London Senor D, Singer S (2009) Start-up nation. Twelve, New York and Boston
© 2011 RossiSmith Academic Publishing, JAES, Vol VII, Iss 2, December 2011, Refereed Edition, Page:
147
Shepherd DA. (1999) Venture capitalists' assessment of new venture survival. Management Science 45(5): 621-632
Shepherd DA, Douglas EJ, Shanley M (2000) New venture survival: Ignorance, external shocks, and risk reduction strategies. Journal of Business Venturing 15(5-6): 393-410
Shepherd DA, Ettenson R, Crouch A (2000) New venture strategy and profitability A venture capitalist's assessment. Journal of Business Venturing 15(5-6):449-467
Stacey RD (1995) The science of complexity: an alternative perspective for strategic change processes. Strategic Management Journal 16(6): 477-495
Timmons J, Spinelli S (2009) New venture strategies: entrepreneurship for the 21st century (8th ed.). Irwin-McGraw-Hill, Burr Ridge, IL
Tyebjee TT, Bruno AV (1984) A model of venture capitalist investment activity. Management Science 30(9): 1051-1066
Vesper KH. (1990) New venture strategies. Prentice Hall: Englewood Cliffs, N.J. Wennberg K, Wiklund J, DeTienne DR, Cardon MS (2010) Reconceptualizing
entrepreneurial exit: Divergent exit routes and their drivers. Journal of Business Venturing 25(4): 361-375
Wright M, Lockett A, Pruthi S, Manigart S, Sapienza H, Desbrieres P, Hommel, U (2004) Venture capital investors, capital markets, valuation and information: US, Europe and Asia. Journal of International Entrepreneurship 2(4):305–326
Wright M, Pruthi S, Lockett A (2005) International venture capital research: From cross-country comparisons to crossing borders. International Journal of Management Reviews 7(3): 135–165
Zacharakis AL, Meyer GD. 1998. Do venture capitalists really understand their own decision process? A social judgment theory perspective. Journal of Business Venturing 13(1): 57-76
Zajac EJ, Kraatz MS, Bresser RKF (2000) Modeling the dynamics of strategic fit: a normative approach to strategic change. Strategic Management Journal 21(4): 429-453
© 2011 RossiSmith Academic Publishing, JAES, Vol VII, Iss 2, December 2011, Refereed Edition, Page:
148
ENTREPRENEURIALISM AND PHILANTHROPY
Christopher Baker1 and Michael Moran Asia-Pacific Centre for Social Investment & Philanthropy,
Faculty of Business and Enterprise, Swinburne University of Technology, Melbourne, Australia Corresponding Author
ABSTRACT
There has been little scholarly investigation into the relative propensity for entrepreneurs
to participate in philanthropic endeavour, and whether entrepreneurs are inclined to adopt
particular forms or approaches to their philanthropy. This article explores the extent to
which extant international literature on giving by the wealthy has acknowledged and
explored entrepreneurialism as influencing the propensity of the wealthy to give, and the
extent to which it impacts on the nature of that giving. The authors conclude that there is
a need for specific research into entrepreneurialism and philanthropy, and that such
research needs to be sensitive to the national peculiarities of political, cultural and
regulatory contexts.
INTRODUCTION
The ability of successful entrepreneurs to generate considerable wealth is manifest. As
such, their capacity to contribute from their resources to projects and organisations with a
specific social enhancement agenda is also apparent. This potential for successful
entrepreneurs to enhance the quality of the society or societies in which they live and to
become role models of philanthropic endeavour is exemplified by the recent
1 Corresponding Author: Dr Christopher Baker, Asia-‐Pacific Centre for Social Investment
& Philanthropy, Faculty of Business and Enterprise, Swinburne University of Technology, PO Box 218, Hawthorn VIC 3122, Australia. (T) +61 3 9214 8088, Email: [email protected]
© 2011 RossiSmith Academic Publishing, JAES, Vol VII, Iss 2, December 2011, Refereed Edition, Page:
149
commitments of two of the most high profile and successful entrepreneurs in the United
States, Bill Gates and Warren Buffet. There has however been little scholarly
investigation into the relative propensity for entrepreneurs to participate in philanthropic
endeavour, and whether entrepreneurs are inclined to adopt particular forms or
approaches to their philanthropy. This article explores the extent to which extant
international literature on giving by the wealthy has acknowledged and explored
entrepreneurialism as influencing the propensity of the wealthy to give, and the extent to
which it impacts on the nature of that giving, what Frumkin (2006) has termed “giving
styles”.
Given the paucity of literature directly addressing entrepreneurialism and philanthropy,
this article begins with an exploration of key contextual issues. It first addresses wealth
and the place of entrepreneurs in order to provide a foundation for understanding some of
the particular attitudinal influences on entrepreneurs to the wealth they generate. It then
examines the literature on characteristics of risk, attitudes to saving, and perceptions of
financial security that influence entrepreneurial behaviours. This article then looks at
aspects of the history of entrepreneurial philanthropy, particularly in the United States
(US), and at emerging forms of giving which are associated with entrepreneurial skills
and approaches such as the strategic and venture paradigms. The authors note that the
majority of the literature on entrepreneurs and giving is generated in the US where the
history, culture and taxation of giving by the wealthy in particular are specific to that
nation and therefore US related research findings may not be directly transferable to other
nations. The authors conclude that in order to inform public policy settings in relation to
charitable giving there is a need for specific research into entrepreneurialism and
philanthropy, and that such research needs to be sensitive to the national peculiarities of
political, cultural and regulatory contexts.
WEALTH AND ENTREPRENEURS
While giving by entrepreneurs in particular has not received a great deal of scholarly
attention to date, giving by the wealthy more broadly has been the subject of analysis.
© 2011 RossiSmith Academic Publishing, JAES, Vol VII, Iss 2, December 2011, Refereed Edition, Page:
150
Paul Schervish, a leading theorist in the field of philanthropy studies, pays little regard to
the source of wealth where he argues (2003) that while people are generous across the
economic spectrum, because a disproportionately large share of assets is held by the
wealthy few, in practice the greatest volume and value of charitable gifts will inevitably
come from high net worth individuals. Entrepreneurs do constitute a significant
proportion of the wealthy. On a global level, the 2006 World Wealth Report (Cap
Gemini Merrill Lynch 2006: 19) estimated the top three sources of wealth for the world’s
high net worth individuals to be: i) business ownership or the sale of a business
(entrepreneurs) 37%; ii) income 24%; and iii) inheritance 18%. Earned wealth was
reported to have grown much faster than inherited wealth, with the percentage of High
Net Worth (HNW) individuals whose wealth was inherited decreasing from 2001 to 2006:
in North America from 21% to 16%; and in Europe from 37% to 19%. The dominance
of earned wealth as the primary wealth source is also apparent at ultra wealthy end of the
spectrum where entrepreneurs are particularly well represented (Quadrini 1999; Cagetti
and De Nardi 2008). In the United Kingdom (UK), the Sunday Times Rich List (2009)
reported that while in 1989 three quarters of the list of the most wealthy 1,000 individuals
or families in the UK had inherited their wealth, by 2009 the tables had been turned with
the proportion that had created their own wealth increasing to three quarters.
It is important to note however that while there is a tendency to think of wealth to be
either inherited or generated by entrepreneurial activity, the very high earnings levels of
senior executives over recent decades produces a share of the very wealthy whose wealth
is derived from those earnings. In the United States and other English speaking countries
the increasing representation of executives amongst top income earners has been a
characteristic of the 20th century which has gained additional momentum in recent
decades (Piketty and Saez 2006). A local illustration of the exponential growth in top
salary-earner income is that from 1992 to 2002 the remuneration of a typical executive in
Australia's top 50 companies increased from 27 times the wage of an average worker to
98 times (Atkinson and Leigh 2006).
Using data from the Panel Study of Income Dynamics and the Survey of Consumer
Finances in the United States, Quadrini (1999; 2000) has identified higher patterns of
© 2011 RossiSmith Academic Publishing, JAES, Vol VII, Iss 2, December 2011, Refereed Edition, Page:
151
wealth generation and accumulation amongst entrepreneurial households. The three
main factors identified as contributing to these heightened wealth accumulation
tendencies amongst entrepreneurs are: i) the incentive to save the funds required to
undertake entrepreneurial activity; ii) the incentive to avoid the costs of financial
intermediation; and iii) “uninsurable entrepreneurial risk” (Quadrini 2000: 34). This risk
factor is identified as a consequence of the high degree of income uncertainty associated
with entrepreneurial choices relative to salaried occupations, and a consequential desire to
save more for precautionary motives. This incentive to save more as a result of what
Cagetti and De Nardi have alternatively described as the “additional risk associated with
being an entrepreneur” (2008: 296), is over and above the earlier finding of Cagetti
(2003) that precaution is the major motivation in general for wealth accumulation early in
life.
The importance of precautionary motivations and higher savings patterns for
entrepreneurial wealth accumulators points to a potential (though untested) correlation
with research which suggests that a sense of financial security is a major influence over
the propensity to gift personal funds for public good. Giving by the wealthy in particular
has been found consistently to be influenced by the individual’s self-perception of
economic and financial security (Lloyd 2004; Rooney, Frederick et al. 2006; 2007). As
Schervish observes, the subjective measurement of personal financial status is assessed by
individuals with reference to both their financial base and their aspirations “relative to
subjective values and norms and in view of comparative assessments with their reference
groups” (Schervish 2003: 10).
In the 2005 Bank of America Study of High Net-Worth Philanthropy more than 50% of
respondents indicated they would give more if they felt “more financially secure”
(Rooney, Frederick et al. 2006: 7). The findings in relation to the entrepreneurs amongst
the respondents (those having fifty percent or more of their net worth in entrepreneurial
assets) include that HNW entrepreneurs have statistically significantly more wealth than
other HNW households and that entrepreneurs have a higher sense of financial security
(Rooney, Frederick et al. 2007: 52). Despite this, the entrepreneurial respondents were
also more likely than others to indicate they would increase their giving if they felt
© 2011 RossiSmith Academic Publishing, JAES, Vol VII, Iss 2, December 2011, Refereed Edition, Page:
152
“more” financially secure. This study is one of very few that does provide a comparison
of giving by entrepreneurial households. It finds that in 2005 Entrepreneurial households
gave on average nearly twice as much to charity as other wealthy households, $232,206 :
$120,651, which was a statistically significant positive difference (p<.001).
A subsequent study also undertaken by Rooney and colleagues (Rooney, Osili et al. 2009)
also finds that the source of wealth has a significant impact on giving. In 2007, on
average those who had generated their wealth through entrepreneurial endeavour gave far
more to charity than those HNW American households which inherited their wealth or
earned it in other ways. Entrepreneurial households (where half or more of their net
worth comes from a family-owned business or a start-up company) gave most on average
($248,871) in contrast to households where half or more of their net worth came form
growth of investment assets, which gave least on average ($35,680), as illustrated in
Figure 1.
Figure 1: Average aggregate giving by primary source of net worth, 2007 ($)
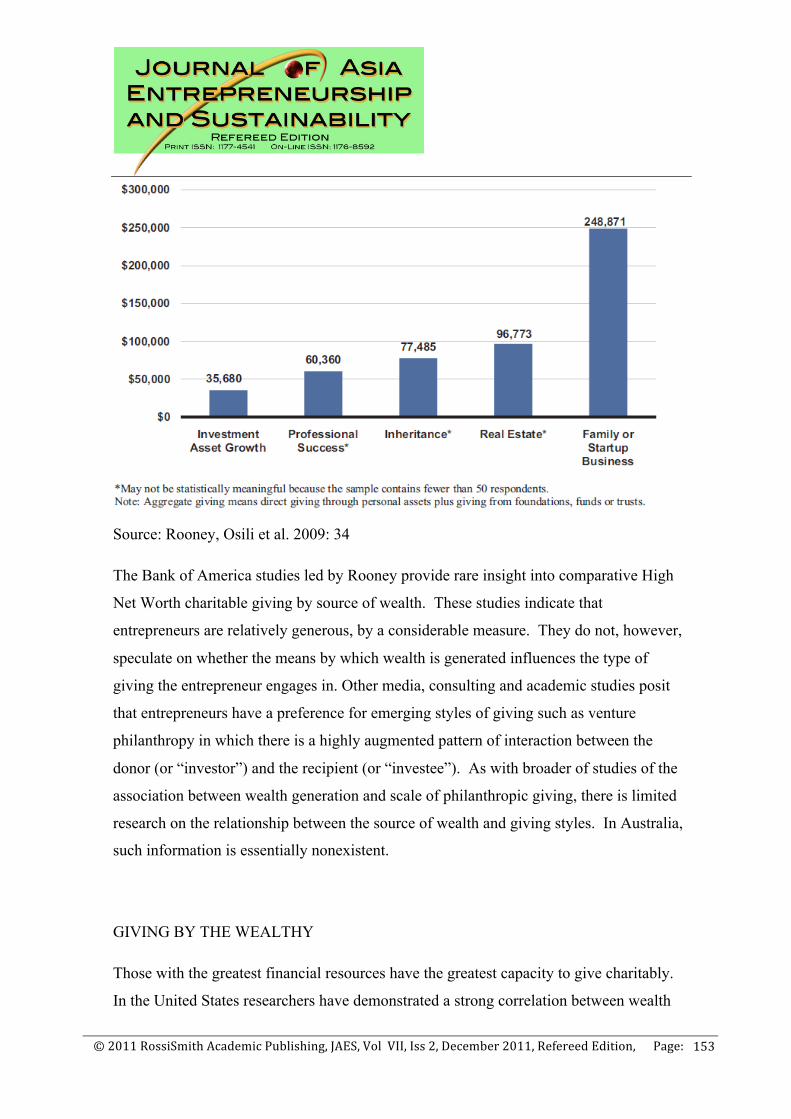
© 2011 RossiSmith Academic Publishing, JAES, Vol VII, Iss 2, December 2011, Refereed Edition, Page:
153
Source: Rooney, Osili et al. 2009: 34
The Bank of America studies led by Rooney provide rare insight into comparative High
Net Worth charitable giving by source of wealth. These studies indicate that
entrepreneurs are relatively generous, by a considerable measure. They do not, however,
speculate on whether the means by which wealth is generated influences the type of
giving the entrepreneur engages in. Other media, consulting and academic studies posit
that entrepreneurs have a preference for emerging styles of giving such as venture
philanthropy in which there is a highly augmented pattern of interaction between the
donor (or “investor”) and the recipient (or “investee”). As with broader of studies of the
association between wealth generation and scale of philanthropic giving, there is limited
research on the relationship between the source of wealth and giving styles. In Australia,
such information is essentially nonexistent.
GIVING BY THE WEALTHY
Those with the greatest financial resources have the greatest capacity to give charitably.
In the United States researchers have demonstrated a strong correlation between wealth
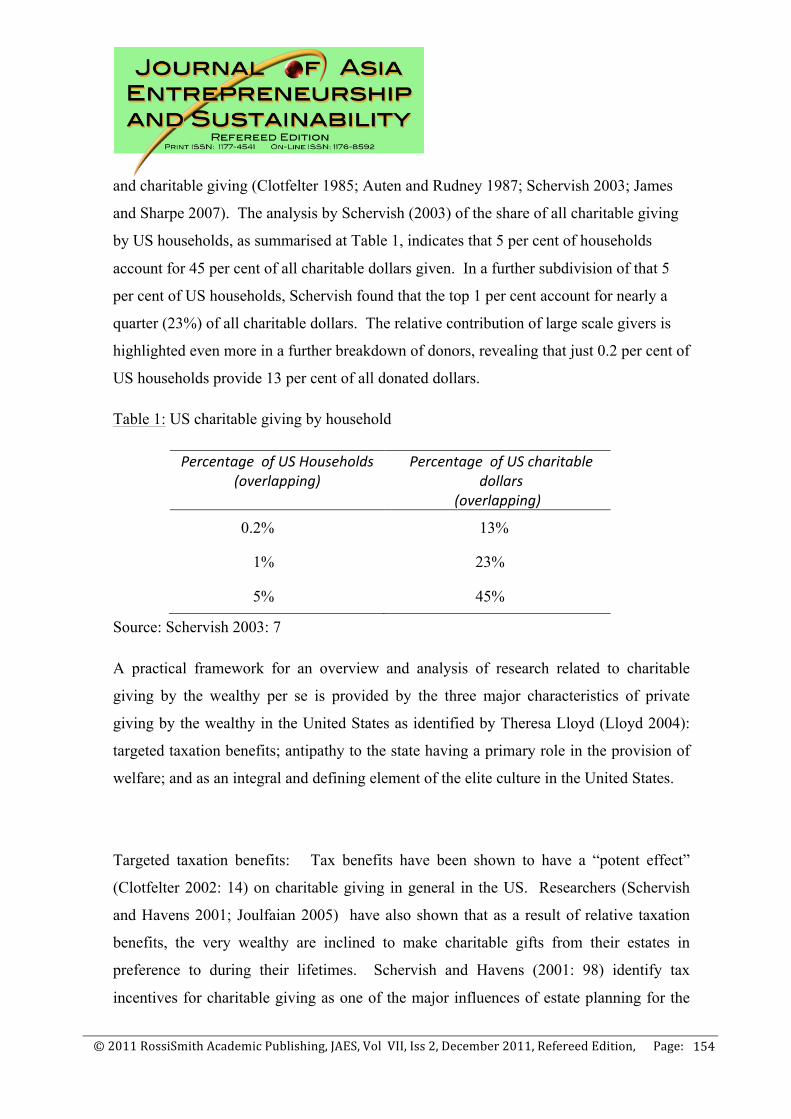
© 2011 RossiSmith Academic Publishing, JAES, Vol VII, Iss 2, December 2011, Refereed Edition, Page:
154
and charitable giving (Clotfelter 1985; Auten and Rudney 1987; Schervish 2003; James
and Sharpe 2007). The analysis by Schervish (2003) of the share of all charitable giving
by US households, as summarised at Table 1, indicates that 5 per cent of households
account for 45 per cent of all charitable dollars given. In a further subdivision of that 5
per cent of US households, Schervish found that the top 1 per cent account for nearly a
quarter (23%) of all charitable dollars. The relative contribution of large scale givers is
highlighted even more in a further breakdown of donors, revealing that just 0.2 per cent of
US households provide 13 per cent of all donated dollars.
Table 1: US charitable giving by household
Percentage of US Households (overlapping)
Percentage of US charitable dollars
(overlapping)
0.2% 13%
1% 23%
5% 45%
Source: Schervish 2003: 7
A practical framework for an overview and analysis of research related to charitable
giving by the wealthy per se is provided by the three major characteristics of private
giving by the wealthy in the United States as identified by Theresa Lloyd (Lloyd 2004):
targeted taxation benefits; antipathy to the state having a primary role in the provision of
welfare; and as an integral and defining element of the elite culture in the United States.
Targeted taxation benefits: Tax benefits have been shown to have a “potent effect”
(Clotfelter 2002: 14) on charitable giving in general in the US. Researchers (Schervish
and Havens 2001; Joulfaian 2005) have also shown that as a result of relative taxation
benefits, the very wealthy are inclined to make charitable gifts from their estates in
preference to during their lifetimes. Schervish and Havens (2001: 98) identify tax
incentives for charitable giving as one of the major influences of estate planning for the
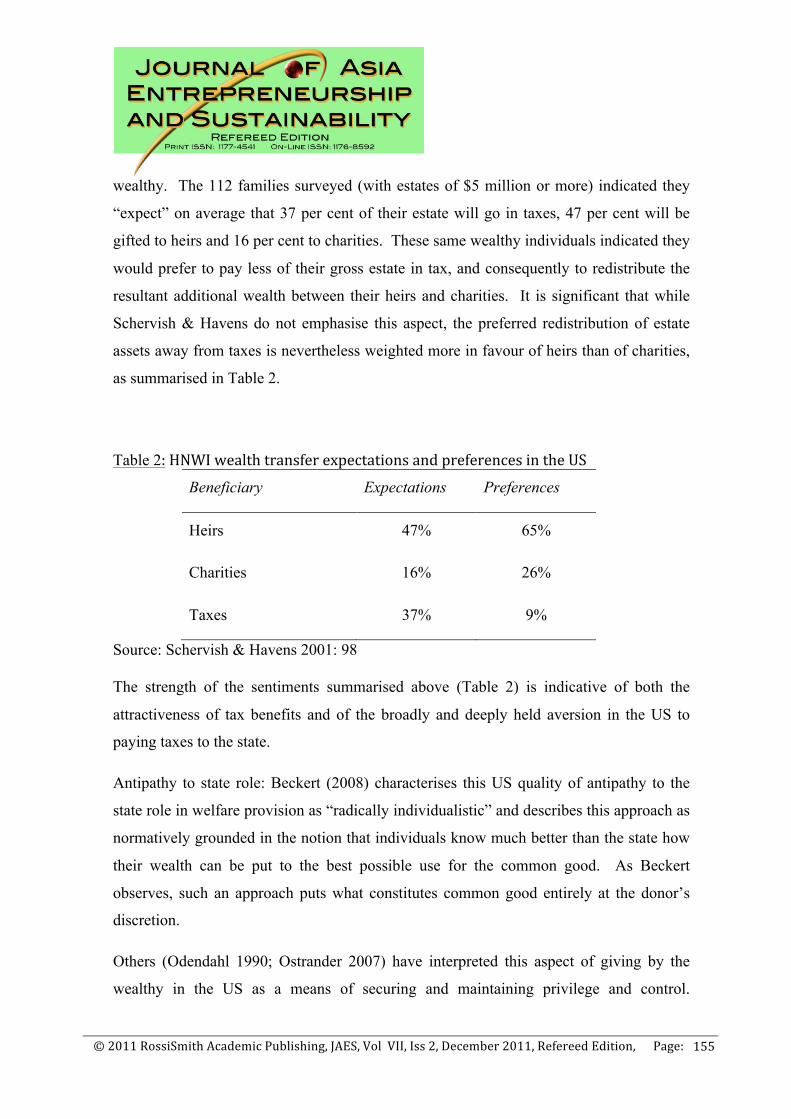
© 2011 RossiSmith Academic Publishing, JAES, Vol VII, Iss 2, December 2011, Refereed Edition, Page:
155
wealthy. The 112 families surveyed (with estates of $5 million or more) indicated they
“expect” on average that 37 per cent of their estate will go in taxes, 47 per cent will be
gifted to heirs and 16 per cent to charities. These same wealthy individuals indicated they
would prefer to pay less of their gross estate in tax, and consequently to redistribute the
resultant additional wealth between their heirs and charities. It is significant that while
Schervish & Havens do not emphasise this aspect, the preferred redistribution of estate
assets away from taxes is nevertheless weighted more in favour of heirs than of charities,
as summarised in Table 2.
Table 2: HNWI wealth transfer expectations and preferences in the US
Beneficiary Expectations Preferences
Heirs 47% 65%
Charities 16% 26%
Taxes 37% 9%
Source: Schervish & Havens 2001: 98 The strength of the sentiments summarised above (Table 2) is indicative of both the
attractiveness of tax benefits and of the broadly and deeply held aversion in the US to
paying taxes to the state.
Antipathy to state role: Beckert (2008) characterises this US quality of antipathy to the
state role in welfare provision as “radically individualistic” and describes this approach as
normatively grounded in the notion that individuals know much better than the state how
their wealth can be put to the best possible use for the common good. As Beckert
observes, such an approach puts what constitutes common good entirely at the donor’s
discretion.
Others (Odendahl 1990; Ostrander 2007) have interpreted this aspect of giving by the
wealthy in the US as a means of securing and maintaining privilege and control.
© 2011 RossiSmith Academic Publishing, JAES, Vol VII, Iss 2, December 2011, Refereed Edition, Page:
156
Odendahl (1990) finds that the US millionaires she interviewed placed a high value on
wanting to maintain control over the disposition of their money rather than providing it
directly to the government. She argues that the philanthropic elite use their giving to
exercise power and to retain control of key social spending initiatives. Her argument
(1990) that contemporary American philanthropy is fundamentally a self-serving and self-
perpetuating system by which the wealthy exercise social control and help themselves
more than others is paralleled by findings in the late 1980s that fewer than 10 per cent of
US philanthropic giving is directed at those with less access to resources than the donor/s
(Ostrander 1989: 221).
Schervish on the other hand identifies this propensity to influence and control as
“hyperagency” (Schervish 1997; Schervish 2008): the combination of psychological and
material capacity to not just contribute to or support causes, but to relatively single-
handedly produce new philanthropic organisations or new direction in existing ones. In
this way, Schervish’s conceptualisation of the “hyperagency” of philanthropists is closely
aligned with Shane’s articulation of entrepreneurship as 'an activity that involves the
discovery, evaluation and exploitation of opportunities to introduce new goods and
services, ways of organizing, markets, processes, and raw materials through organizing
efforts that previously had not existed' (Shane 2003: 4). While entrepreneurship has
tended to be framed as profit seeking, and with a tendency towards cutting corners
(Barendsen and Gardner 2004), this has been challenged by more recent application of the
term to social entrepreneurs (Martin and Osberg 2007; Zahra, Gedajlovic et al. 2009;
Defourny and Nyssens 2010) to those involved with initiatives aimed at generating social
wealth.
Nevertheless differences in language used to characterise HNW giving, highlight how
similar traits can be interpreted and represented in different ways. While to a degree
Odendahl’s interpretation of her interview data serves to validate a class-based
ideological animosity towards the wealthy, her analysis does provide a contrast to many
other studies of philanthropic values and behaviours. Her highly critical perspective is at
odds with Schervish and with much of the commissioned and non-academic literature
associated with fundraising and wealth management, which tends to incorporate a
© 2011 RossiSmith Academic Publishing, JAES, Vol VII, Iss 2, December 2011, Refereed Edition, Page:
157
sympathetic bias reflecting an agenda to encourage more charitable giving by more of the
wealthy.
Elite Culture: The importance of peers is also integral to the findings of the English
sociologist Theresa Lloyd (2004) who identified charitable giving as an integral and
defining element of the elite culture in the US. The importance of charitable giving to
elite culture in the US has also been identified by American researchers (Odendahl 1987;
Ostrower 1995; Schervish and Havens 1997). In her ground breaking study of elite
philanthropy in New York, Ostrower (1995) finds wealthy donors to be generally focused
on their peers as the audience for their philanthropy. The cultural interplay for wealthy
New Yorkers demonstrates the point that obligations are most strongly felt where the ties
are strongest. It is these people who provide the normative framework and the associated
sanctions and rewards that are most powerful. In a network, or a social circle where there
is a strong expectation that those with wealth give, then those who are concerned with
securing and retaining membership of that network participate in (expected) philanthropic
giving. Ostrower observes that “philanthropy is as much about the idea that individuals
should “do their share” to support the organisations from which they benefit as it is about
giving to others” (1995: 8).
More than 80 per cent of Ostrower’s respondents (all active philanthropists) agreed that
for the wealthy, philanthropy is an obligation. Ostrower also notes that specific
interpretations of “obligation” varied among individuals and particular charitable
traditions from tzedaka in the Jewish tradition (a Hebrew term that means justice rather
than charity and is therefore considered an obligation) through to the more secular notion
of “giving back”. Similarly, in interviews with wealthy donors Schervish, O’Herlihy et
al. (2001) find that while these individuals see themselves as in control and as primarily
responsible for their own success, they acknowledge the contribution of others and report
a strong sense of obligation to give back amongst wealthy Americans. This sense of
obligation on the wealthy to give back a share of earned wealth to society holds sway
throughout the US to such an extent that it has been characterised as an implicit social
contract (Acs and Desai 2007).
© 2011 RossiSmith Academic Publishing, JAES, Vol VII, Iss 2, December 2011, Refereed Edition, Page:
158
AUSTRALIA
In Australia, there is no comparable expectation that those with the greatest capacity will
give. Australian-based research indicates that in relative terms the wealthy in Australia
are considerably less generous than their US counterparts (Tracey and Baker 2004;
Tracey 2005). Unlike in the US where many services are provided by way of private
funds, in Australia the provision of most social and community services are regarded
fundamentally as a normal and expected function of government. In addition, the
difference in scale between the economies and the level of wealth in the US and Australia
make it possible for wealthy donors in the US, individually and in aggregate, to allocate
very large sums of money to charitable purposes. The framework identified by Lloyd
(2004) as characteristic of giving by the wealthy in the US (targeted taxation benefits;
antipathy to the state having a primary role in the provision of welfare; and giving as a
defining element of the elite culture) does not have the same relevance in the Australian
context. Of the three, only the attraction of targeted taxation benefits is applicable in the
Australian context, and then only in relation to inter vivos giving.
Targeted taxation benefits do apply in Australia to inter vivos charitable giving, however
in the absence of estate/inheritance taxes in Australia there is also an absence of taxation
incentives for post mortem charitable giving. In relation to inter vivos charitable giving,
only higher deductible amounts tend to be claimed and the wealthy are more likely to
claim eligible donations (Giving Australia 2005). Madden and Scaife (2008) observe that
it is unsurprising that wealthy Australians are more likely to claim their eligible gifts,
given firstly that the wealthy are more likely to use professional support to prepare their
tax returns and secondly that the size of gifts by the wealthy (where made) may often be
larger.
Findings drawing on data from the height of the economic boom in Australia indicate that
inter vivos charitable giving by wealthy Australians did not keep pace with the substantial
increases in personal wealth that had been characteristic of the previous decade (Madden
& Scaife 2008). Australian Taxation Office data shows that in 2005 approximately two
© 2011 RossiSmith Academic Publishing, JAES, Vol VII, Iss 2, December 2011, Refereed Edition, Page:
159
thirds of individual Australians with a taxable income of one million dollars or more were
participating in charitable giving, as measured by tax deductible donations made and
claimed (McGregor-Lowndes & Newton 2007). Madden and Scaife (2008) note the very
high probability that all individuals earning a taxable income of one million dollars or
more will take professional advice on the preparation of their tax returns. In accordance
with their fiduciary duties, the advisers will seek to ensure that any tax deductible
donations made are claimed. The data indicates that approximately one in three
Australians earning a taxable income of one million dollars or more in 2005 did not make
any tax deductible gifts.
The extent to which charitable giving is incorporated into the normative expectations of
Australian society as a whole is indicated by the estimated participation rate of adult
Australians of 87% (Giving Australia 2005: 6) and the 2010 international ranking of
Australasia (Australia and New Zealand) as the region with the highest incidence of
giving money (CAF 2010: 68). In this context, the absence of claimed tax deductible
donations by high income earning Australians is one indication of a relative lack of
expectation that those with the most should give accordingly. Indeed, it may be that in
Australia the norms associated with giving by the wealthy are less like those which
operate in the United States, and more like that those of the United Kingdom where the
prevailing model of charitable giving in the UK has been characterised by Edwards
(2002) as typified by spontaneous, spare change donations regardless of income.
Capacity is a precondition for charitable giving, it is not sufficient condition. In Australia
there is no pervasive antipathy to state involvement in the provision of services;
substantive charitable giving is not a societal expectation of the nation’s wealthy; and
substantive charitable giving is not an integral and defining element of the elite culture.
NEW MODES OF PHILANTHROPY
Contemporary considerations of the entrepreneur invariably incorporate the
conceptualisation of Shcumpeter (1994) that the entrepreneur performs the function of
innovation that is fundamental to the effective operation of market based liberal systems.
© 2011 RossiSmith Academic Publishing, JAES, Vol VII, Iss 2, December 2011, Refereed Edition, Page:
160
This direct association of entrepreneurs and innovation leads to a general assumption that
entrepreneurs per se are attracted by and responsible for new modes of philanthropy. This
assumption is also in part informed by and predicated on the establishment of the US
philanthropic foundations in the late nineteenth and early twentieth centuries by
entrepreneurs of the likes of Carnegie, Rockefeller and Ford (Karl and Katz 1981).
Nevertheless, in recent decades there has been considerable attention paid to what have
been described as “new” styles of philanthropy throughout the western world.
Encouraged by a series of articles in the Harvard Business Review in the late 1990s, Letts,
Ryan et al (1997)introduced the concept of “virtuous capital” as a juxtaposition of venture
capital and philanthropy. With later contributions by management theorists Porter and
Kramer (1999) cumulative interest in alternative styles of giving gave way to a cross-
pollination of philanthropic practices with ideas emanating out of business schools.
Importantly, the rise of Northern California’s “Silicon Valley” as the centre of US
innovation, wealth and increasingly philanthropy has seen a new class of social investor
or ‘investors for good’ take the mantle (Frumkin 2003; Frumkin 2006; Bishop and Green
2008). As one sector-wide analysis observes “wherever emerging industries have
spawned new fortunes, new philanthropic initiatives [are] sure to follow” (Morino and
Shore 2004, 10).
The terminology used to describe this transformation has shifted frequently over the past
decade or so from strategic to effective to tactical to venture philanthropy and more
recently settling on social entrepreneurship. Perhaps the most revealing (and
controversial) label to surface from recent literature, however, is philanthrocapitalism,
originally coined by Bishop in The Economist (2006) but quickly gaining a footing in the
lexicon. Anheier and Leat (2006: 5) call this the “new scientific philanthropy” and
identify this as the third phase in the history of giving in the Western world. Katz (2005:
123) shares this sentiment, but rather than seeing new forms of philanthropy as novel, he
remains instinctively “skeptical about the direction – or directions – of philanthropy in
recent years”. Katz channels his critique at the “abstract” managerial rhetoric which
oftentimes seems to be stating the obvious; e.g. that donors act strategically when they are
unlikely to opt for the counterfactual anyway. He also challenges the way in which this
© 2011 RossiSmith Academic Publishing, JAES, Vol VII, Iss 2, December 2011, Refereed Edition, Page:
161
rhetoric appropriates without acknowledgement, the central mantra of the US founders of
philanthropy; e.g. the “stress on causes rather than symptoms” (Katz 2005: 126).
First and second generation: Resistance, convergence and organisational cultural
change
The arrival of alternative modes of philanthropy is opening up some minor, yet not
insignificant, distinctions between private foundation organisational types, as well as
operational ethos. On the one hand, we have the traditional large-scale grant-making
foundation. This ideal type – labelled here first generation – is modelled on the early and
mid-twentieth century entities established by formidable US entrepreneurs. This type also
includes other large-scale and more recently established liberal foundations such as
Hewlett, MacArthur and Packard, and Gates. Characterised by perpetual endowments, a
large and traditional organisational structure, and an emphasis on diverse programmes,
this type has historically been the dominant force in private philanthropy in international
development.
On the other hand, we have the newer, second generation foundations, many of whom
emerged out of the vestiges of the technology boom of the 1990s (Bul and McNeill 2007:
51). These foundations are perceived to be more reflexive agents, defined by an emphasis
on technology, flexibility, entrepreneurialism, and the flat or horizontal organisational
structures (Desai and Kharas 2008: 158) characteristic of modern managerialism.
Examples include the Skoll Foundation, endowed by the former President of eBay, Jeff
Skoll; the Acumen Fund, a venture fund modelled on venture capitalism; and Google.org,
a for-profit social investment fund which seeks to address a wide range of global
problems from health through to climate change through “investments” as well as
“grants” (Nelson 2008: 5).
Desai and Kharas (2008, 158) have labelled this the ‘California Consensus’. They argue
that these ‘new players’ are ‘blurring the line between “not-for-profit” and “for-profit”
approaches’, a theme that has been taken up by many in the media (cf. Bishop 2006) and
© 2011 RossiSmith Academic Publishing, JAES, Vol VII, Iss 2, December 2011, Refereed Edition, Page:
162
practitioners in the broader sustainability and CSR industry. Elkington and Hartigan
(2008) for example extol the blossoming cosmopolitan ethic evident among some agents
in the private sector. Its implications and importance as a driver of contemporary
philanthropy, while under theorised, nascent and arguably more nebulous than recognised
by some commentators (Solomon 2009), are nonetheless potentially of significance,
particularly as these ideas have begun to diffuse more widely. The extent to which the
new forms are intrinsically attractive to entrepreneurs has, quite simply, been assumed
rather than investigated, particularly in the Australian context.
In many ways, however, the perceived division between traditional and “new” forms of
philanthropy is becoming increasingly less rigid than as it was being drawn at the start of
the twenty-first century. One of the oldest and most enduring US foundations, the
Rockefeller Foundation, has readily adapted to the new climate, instituting an
organisational restructuring that mirrors these managerialist approaches (The Economist
2006c). It has also recently partnered with the Acumen Fund (a recipient of a seed grant)
and the Monitor Institute – founded by management guru Michael Porter – to promote
“impact investing” which aims to free-up foundation endowments for investment in the
social enterprise space and align foundation investment strategies more closely with
mission. Conversely, following a struggle to deliver against its mission by way of its
radical form, Google.org has restructured in a manner that much more closely aligns with
more traditional philanthropic modes (Boss 2010).
The renewed emphasis on “impact”, evaluation and business metrics in traditional and
new foundation forms confirms that “business-like” approaches are spreading across to
established institutions. This is gradually obscuring the division between the first and
second generation foundations, which until more recent times appeared more pronounced.
The essence of these developments as they relate to entrepreneurs is perhaps best captured
by Berman (2007), who on drawing on the extensive experience of Rockefeller
Philanthropy Advisors on working with philanthropists across the spectrum of wealth
sources, observed:
© 2011 RossiSmith Academic Publishing, JAES, Vol VII, Iss 2, December 2011, Refereed Edition, Page:
163
Risk-taking, vision and an entrepreneurial approach to philanthropy are often
found among inheritors – although they may not use the buzzwords of business.
By the same token there are successful entrepreneurs who cannot convert their
drive and talent to effective philanthropy, even using the model of capitalism. As
any venture capitalist will tell you, there are legions of entrepreneurs who cannot
manage, work in partnership, or take their idea to scale (Berman 2007: 33).
Nonetheless, while the terms are (and should be) contested they do provide a neat
delineation of the new philanthropic landscape, particularly as it is portrayed in the
literature.
Entrepreneurialism and entrepreneurial giving styles
A key feature of strategic philanthropy and other new “giving styles”, such as venture
philanthropy, is an emphasis on measurement. Various metrics, loosely modelled on
financial analytics, have been tested over the course of the last decade to quantify a firm
or organisation’s social and environmental, as well as financial, performance. A broad
cross-section of the foundation sector, although particularly those emanating from the US
West Coast, have adopted such metrics. One of the early metrics to gain traction was
Social Return on Investment (SROI) (Frumkin 2003, 13-14) formulated by the Roberts
Enterprise Development, established by George Roberts of private equity firm Kohlberg
Kravis Roberts & Co. Most literature cites REDF (Eikenberry and Kluver 2004: 134) (cf.
Eikenberry and Kluver 2004, 134; Frumkin 2003, 13; Tuan 2008) as a pioneer of
“results” oriented philanthropy and SROI, which attaches a social dimension to the
classical accounting concept, ROI, was utilised by the REDF as a performance
management tool to illustrate the “accrued” societal benefits of each of its investments
(Tuan 2008: 11).
What is important to note here is that there has not just been a shift toward the
introduction of metrics but a fundamental shift in discourse that is reformulating
philanthropic practice along lines that are said to have roots in entrepreneurial behaviour.
© 2011 RossiSmith Academic Publishing, JAES, Vol VII, Iss 2, December 2011, Refereed Edition, Page:
164
Eikenberry and Kluver (2004) see this as a largely donor-driven process and one that is a
direct carryover of the migration of entrepreneurs from the business and technology
sectors. As many supporters of increased measurement are erstwhile venture capitalists
with experience in the business world, where creating (and demonstrating) shareholder or
stakeholder value is an imperative, there is a sense that philanthropists and grantees
should be able to demonstrate outcomes, thus sending a signal that grants have been
distributed with appropriate “accountability” (Stannard-Stockton 2007: 45). Brest (2005,
136) therefore argues that while there is a complexity to monetising social phenomena,
“with or without attempting to quantify social returns, the investment metaphor embodies
an attitude that presses foundation staff to use their donors’ resources as effectively as
possible” (emphasis in original).
Moving beyond measurement, another defining feature of the new philanthropy
implicitly associated with entrepreneurs evident in the literature centres on the issue of
engagement – or what can be characterised as deep rather than shallow patterns of
interaction. Some form of active interface, whether through monitoring, feedback,
evaluation or consultation on programmatic design has been a constant feature of
cooperation. Strategic approaches, as observed above by Katz (2005), have always
constituted the norm in some form or another. Yet in venture philanthropy, as in venture
capital, there is said to be a highly augmented pattern of interaction between the donor (or
‘investor’) and recipient (or ‘investee’) (Frumkin 2003, 11). Most accounts of venture
philanthropy (cf. Brest 2005; Frumkin 2003, 2006; Vurro 2006) cite the manner in which
funders interact with partner agencies as the most conspicuous departure from traditional
approaches. Engagement may take the form of managerial advice, secondment of
employees or access to management or financial consultants, the aim being to facilitate
knowledge transfer and interorganisational learning through sustained cooperation.
Frumkin (2006) does not see this as a one-way process. He notes that “rather than cut a
check and run” the donors do not only advance various forms of material and in-kind
support, but also receive some benefit that ‘satisfies the desires of many wealthy people to
find meaning in their lives outside business’ (Frumkin 2003, 12).
© 2011 RossiSmith Academic Publishing, JAES, Vol VII, Iss 2, December 2011, Refereed Edition, Page:
165
Linked to the notion of augmented engagement is an additional emphasis on the
deployment of continuing resources beyond an initial seed grant, and in keeping with the
venture capital orientation, taking account of long-term investment horizons (Vurro 2006).
Until relatively recently it has been commonplace in the literature to view big
philanthropy as something of an incubator for social innovation, particularly in the period
following the 1970s (Morino and Shore 2004). After a programme had proved a success
and its effectiveness demonstrated to public officials it was expected that the state would
step in and scale the programme up through “expansion…and government replication”
(Frumkin 2003, 9). This dominated philanthropic strategy and according to Prewitt (cited
in Morino and Shore 2004, 79) government was the natural partner in any strategic
alliance that would ensue. However as government has progressively taken a less overtly
interventionist approach philanthropy has been forced to adapt. In the venture and
strategic paradigms therefore “large blocks of capital [are] delivered over an extended
period of time” in an effort to create a self-sustaining sector as government lacks the
resource capacity to engage in large-scale programmatic expansion (Frumkin 2003, 9). As
such there has been a discernable shift away from the grants as scattered among a wide
web of grantees to large investments that seek to build a responsive (or ‘business-like’)
social economy. There is one caveat that many of the new entrepreneurial funders
purportedly attach to an investment: an exit strategy, with ‘support only’ withdrawn
‘when the entity is able to sustain itself’ (Romirowsky 2007: 113). As yet, however, the
extent to which these practices are employed in Australia is not well documented in the
academic literature. Moreover the relationship between more engaged forms of
philanthropy and the influence of entrepreneurs has not been explored.
CONCLUSION
This paper has provided an overview of extant literature relating to entrepreneurialism
and philanthropy. Our review suggests that while there is a relatively limited supply of
research dealing with an array of associated matters, there is even less which deals
directly with the questions of whether entrepreneurs give more and whether they give
© 2011 RossiSmith Academic Publishing, JAES, Vol VII, Iss 2, December 2011, Refereed Edition, Page:
166
differently. What studies are available indicate that entrepreneurs are well represented in
the ranks of the wealthy. A small number of studies in the US have indicated that
amongst the wealthy, entrepreneurs on average give more. It is not clear however
whether the average is distorted by particularly high level gifts by a small number of
individual entrepreneurs, or whether higher level giving is indeed common across
entrepreneurs as a whole.
The majority of the research and literature of relevance to this exploration is derived from
the US. Giving in the US and giving by the wealthy in particular in the US have been
clearly identified in the literature as being significantly influenced by the history, culture
and taxation of giving in that country. What little research has been undertaken in
Australia indicates that what have been identified as key drivers of giving by wealthy in
the US are simply not operative in Australia, to any significant degree.
There is a growing body of literate that addresses new forms of philanthropic giving and
the attractiveness of these forms to entrepreneurs. The association between entrepreneurs
and new forms of giving tends to be based on observations and is rarely supported by data.
Is the proposition that entrepreneurs are attracted to particular forms of giving a
generalisation, a supposition, or will it hold up to closer examination? It is the view of
the authors of this paper that even if such a proposition is sustainable in the US, there is
nothing available in Australia to either support or contradict any assertions about
entrepreneurialism and philanthropy. Given the close association between wealth and
entrepreneurs, and wealth and giving, the lack of any substantive insights into
entrepreneurs and giving in Australia is significant short coming. We believe the time is
right to address to address this knowledge gap.
REFERENCES Acs, Z. J. and S. Desai (2007). "Democratic Capitalism and Philanthropy in a Global
Economy." SSRN eLibrary. Anheier, H. K. and D. Leat (2006). Creative philanthropy. London, Routledge. Atkinson, A. and A. Leigh (2006). The distribution of top incomes in Australia. Centre
for Economic Policy Research. Canberra, Australian National University.
© 2011 RossiSmith Academic Publishing, JAES, Vol VII, Iss 2, December 2011, Refereed Edition, Page:
167
Auten, G. and G. Rudney (1987). "The Variability of the Charitable Giving of the Wealthy." Atlantic Economic Society Conference.
Barendsen, L. and H. Gardner (2004). "Is the social entrepreneur a new type of leader?" Leader to Leader 34: 43–50.
Beckert, J. (2008). Inherited Wealth Princeton, Princeton University Press. Berman, M. (2007). "It's not the donors - it's the world." Alliance 12(1): 33. Bishop, M. (2006). "The business of giving." The Economist. February 25. Bishop, M. and M. Green (2008). Philanthrocapitalism : how the rich can save the world.
New York, Bloomsbury Press. Boss, S. (2010). "Do No Evil." Stanford Social Innovation Review Fall. Bul, B. and D. McNeill (2007). Development Issues in Global Governance: Public-
Private Partnerships and Market Multilateralism New York, Routledge. Cagetti, M. (2003). "Wealth accumulation over the life cycle and precautionary savings."
Journal of Business & Economic Statistics 21(3): 339-353. Cagetti, M. and M. De Nardi (2008). "Wealth Inequality: Data and Models "
Macroeconomic Dynamics 12: 285-313. Cap Gemini Merrill Lynch (2006). World Wealth Report, 10th Anniversary 1997-2006.
New York: 31. Charaties Aid Foundation (2010). The World Giving Index 2010. London. Clotfelter, C. T. (1985). Federal tax policy and charitable giving. Chicago, University of
Chicago Press. Clotfelter, C. T. (2002). The Economics of Giving. Working Papers 97-19, Duke
University. Defourny, J. and M. Nyssens (2010). "Conceptions of Social Enterprise and Social
Entrepreneurship in Europe and the United States: Convergences and Divergences." Journal of Social Entrepreneurship 1(1): 32-53.
Desai, R. M. and H. Kharas (2008). "The California Consensus: Can Private Aid End Global Poverty?" Survival: Global Politics and Strategy 50(4): 155 - 168.
Eikenberry, A. M. and J. D. Kluver (2004). "The Marketization of the Nonprofit Sector: Civil Society at Risk?" Public Administration Review 64(2): 132-140.
Elkington, J. and P. Hartigan (2008). The Power of Unreasonable People: How Social Entrepreneurs Create Markets That Change the World. Cambridge MA, Harvard Business Press.
Frumkin, P. (2003). "Inside venture philanthropy." Society 40(4): 7-15. Frumkin, P. (2006). Strategic Giving: the art and science of philanthropy. Chicago,
University of Chicago Press. Giving Australia (2005). Giving Australia: Research on Philanthropy in Australia.
Canberra, Prime Minister's Community Business Partnership, Department of Family and Community Services, Australian Government.
James, R. N., III and D. L. Sharpe (2007). "The Nature and Causes of the U-Shaped Charitable Giving Profile." Nonprofit and Voluntary Sector Quarterly 36(2): 218-238.
Joulfaian, D. (2005). "Choosing Between Gifts and Bequests: How Taxes Affect the Timing of Wealth Transfers." Journal of Public Economics 89(11-12): 2069-2091.
Karl, B. D. and S. N. Katz (1981). "The American Private Philanthropic Foundation and the public sphere 1890–1930." Minerva 19(2): 236-270.
© 2011 RossiSmith Academic Publishing, JAES, Vol VII, Iss 2, December 2011, Refereed Edition, Page:
168
Katz, S. N. (2005). "What Does It Mean to Say That Philanthropy is “Effective”? The Philanthropists’ New Clothes." Proceedings of the American Philosophical Society 149(2): 123-131.
Letts, C., W. Ryan, et al. (1997). "Virtuous Capital: What Foundations Can Learn from Venture Capitalists." Harvard Business Review March/April: 36-44.
Lloyd, T. (2004). Why Rich People Give. London, Association of Charitable Foundations. Madden, K. and W. Scaife (2008). Good Times and Philanthropy: Giving by Australia's
affluent. Brisbane, Centre for Philanthropy and Nonprofit Studies, Queensland University of Technology.
Martin, R. L. and S. Osberg (2007). "Social entrepreneurship: the case for definition." Stanford Social Innovation Review Spring 2007: 29-39.
Morino, M. and B. Shore (2004). High-Engagement Philanthropy: A Bridge to a More Effective Social Sector - Perspectives from Nonprofit Leaders and High-Engagement Philanthropists Washington DC, Venture Philanthropy Partners.
Nelson, J. (2008). 'Effecting Change through Accountable Channels. Global Development 20: Can Philanthropists the Public, and the Poor Make Poverty History? . L. Brainard and D. Chollet. Washington DC, Brookings Institution Press.
Odendahl, T. (1987). Wealthy Donors and Their Charitable Attitudes. America's Wealthy and the future of foundations. T. Odendahl. New York, Foundation Center.
Odendahl, T. (1990). Charity begins at home: generosity and self-interest among the philanthropic elite. New York, Basic Books.
Ostrander, S. A. (1989). The Problem of Poverty and Why Philanthropy Neglects It. The future of the nonprofit sector: challenges, changes, and policy considerations. V. A. Hodgkinson. San Francisco, Jossey-Bass: 219-236.
Ostrander, S. A. (2007). "The Growth of Donor Control: Revisiting the Social Relations of Philanthropy." Nonprofit and Voluntary Sector Quarterly 36(2): 356-372.
Ostrower, F. (1995). Why the wealthy give: the culture of elite philanthropy. Princeton, N.J., Princeton University Press.
Piketty, T. and E. Saez (2006). The Evolution of Top Incomes: A Historical and International Perspective, National Bureau of Economic Research.
Porter, M. E. and M. R. Kramer (1999). "Philanthropy's New Agenda: Creating Value." Harvard Business Review 77(6): 121-130.
Quadrini, V. (1999). "The importance of entrepreneurship for wealth concentration and mobility." Review of Income and Wealth 45(1): 1-19.
Quadrini, V. (2000). "Entrepreneurship, Saving, and Social Mobility." Review of Economic Dynamics 3(1): 1-40.
Romirowsky, R. (2007). "A Venture Worth Taking? Sustaining 21st-Century Nonprofit Organizations through Social Venture Philanthropy." Journal of Jewish Communal Service 82(1/2): 129-138.
Rooney, P. M., H. K. Frederick, et al. (2006). Bank of America Study of High Net-Worth Philanthropy: Initial Report. Indianapolis, Center on Philanthropy at Indiana University: 24.
Rooney, P. M., H. K. Frederick, et al. (2007). Bank of America Study of High Net Worth Philanthropy: Portraits of Donors. Indianapolis, Center on Philanthropy at Indiana University.
© 2011 RossiSmith Academic Publishing, JAES, Vol VII, Iss 2, December 2011, Refereed Edition, Page:
169
Rooney, P. M., U. Osili, et al. (2009). The 2008 Bank of America Study of High Net Worth Philanthropy. Indianapolis, Center on Philanthropy at Indiana University.
Schervish, P. and J. Havens (1997). "Social participation and charitable giving: A multivariate analysis." Voluntas: International Journal of Voluntary and Nonprofit Organizations 8(3): 235-260.
Schervish, P. G. (1997). Major donors, major motives: The people and purposes behind major gifts. New Directions for Philanthropic Fundraising: Developing Major Gifts. SanFrancisco, Jossey-Bass. 1997: 85-112.
Schervish, P. G. (2003). Better than Gold: The Moral Biography of Charitable Giving. California, ALDE Conference.
Schervish, P. G. (2003). "The Inheritance of Wealth and the Commonwealth: The Ideal of Paideia in an Age of Affluence." New Directions for Philanthropic Fundraising Winter 2003(42).
Schervish, P. G. (2008). Why the wealthy give: Factors Which Mobilize Philanthropy Among High Net-Worth Individuals. The Routledge Companion to Nonprofit Marketing. A. Sargeant and W. Wymer. New York, Routledge: 165-181.
Schervish, P. G. and J. J. Havens (2001). "The Mind of the Millionaire: Findings from a National Survey on Wealth with Responsibility." New Directions in Philanthropic Fundraising 32: 75-107.
Schervish, P. G., M. A. O'Herlihy, et al. (2001). Agent-Animated Wealth and Philanthropy: The Dynamics of Accumulation and Allocation Among (Final report on the 2001 High-Tech Donors Study). Boston, Social Welfare Research Institute.
Schumpeter, J. A. (1994). Capitalism, Socialism and Democracy. London, Routledge. Shane, S. A. (2003). A general theory of entrepreneurship : the individual-opportunity
nexus. Northampton, Mass, Edward Elgar. Solomon, L. (2009). Billionaires: Reshaping Philanthropy in a Quest for a Better World
New Brunswick, Transaction Publishers. Stannard-Stockton, S. (2007). The Evolution of the Tactical Philanthropist. Mapping the
New World of American Philanthropy: Causes and Consequences of the Transfer of Wealth. S. Raymond and M. Martin. Hoboken NJ, John Wiley & Sons, Inc.
Tracey, D. (2005). Encouraging Wealthy Australians to be More Philanthropic. The Petre Foundation. Melbourne, Asia-Pacific Centre for Philanthropy and Social Investment, Swinburne University of Technology.
Tracey, D. and C. Baker (2004). How the wealthy give: comparisons between Australia and comparable countries (USA, Britain and Canada). Melbourne, Asia-Pacific Centre for Philanthropy and Social Investment, Swinburne University of Technology.
Tuan, M. (2008). Measuring and/or Estimating Social Value Creation: Insights into Eight Integrated Cost Approaches Seattle, Bill & Melinda Gates Foundation.
Vurro, C. (2006). Exploring the View: Venture Philanthropy and Models across Practice. The New Social Entrepreneurship: What Awaits Social Entrepreneurial Ventures? F. Perrini. Cheltenham, Edward Elgar.
Zahra, S. A., E. Gedajlovic, et al. (2009). "A typology of social entrepreneurs: Motives, search processes and ethical challenges." Journal of Business Venturing 24(5): 519-532.

© 2011 RossiSmith Academic Publishing, JAES, Vol VII, Iss 2, December 2011, Refereed Edition, Page:
170