2016-17 school year - school district of cadott community · presentation of proposed budget for...
TRANSCRIPT

2016-17 School Year
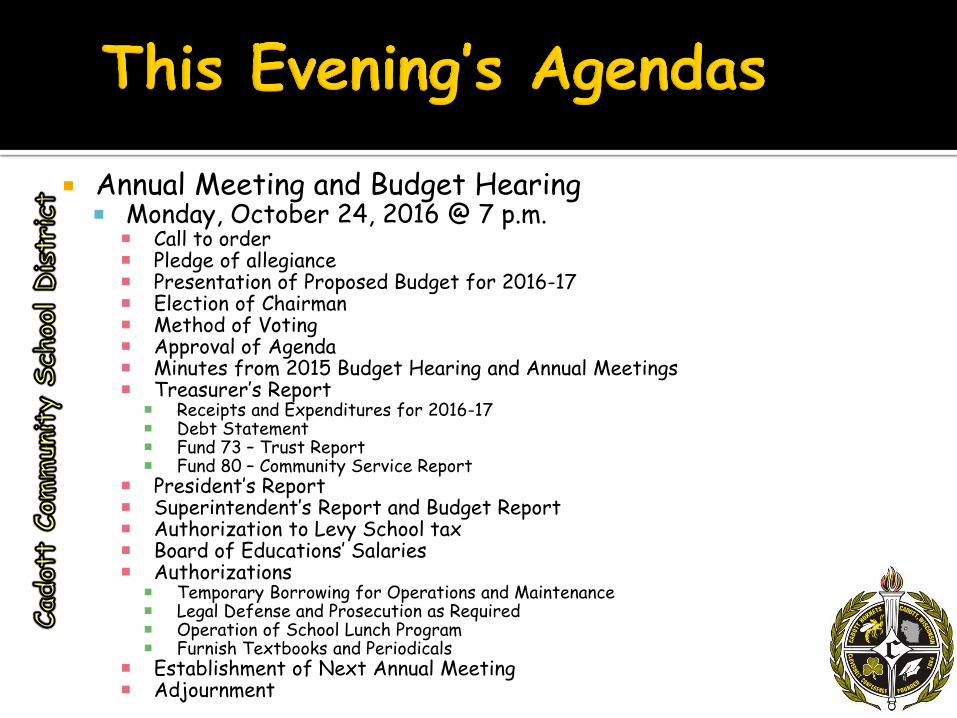
Annual Meeting and Budget Hearing Monday, October 24, 2016 @ 7 p.m.
Call to order Pledge of allegiance Presentation of Proposed Budget for 2016-17 Election of Chairman Method of Voting Approval of Agenda Minutes from 2015 Budget Hearing and Annual Meetings Treasurer’s Report
Receipts and Expenditures for 2016-17 Debt Statement Fund 73 – Trust Report Fund 80 – Community Service Report
President’s Report Superintendent’s Report and Budget Report Authorization to Levy School tax Board of Educations’ Salaries Authorizations
Temporary Borrowing for Operations and Maintenance Legal Defense and Prosecution as Required Operation of School Lunch Program Furnish Textbooks and Periodicals
Establishment of Next Annual Meeting Adjournment

2016-17 Overview

Priority Budget Process Review of 2014-16 State Biennium
Budget Highlights of the 2016-17 Budget
BALANCE

Administration is maintaining a needs based budget process
Collaborative process to identify areas of focus for 2016-17
Align resources to the areas of focus

Academic Growth for All Students
Equip our graduates to meet college and
career readiness standards
Attract and Retain High Quality Staff
Build an efficient sustainable operation
that ensures a healthy, child-centered,
safe, and secure environment.

$0 increase in per pupil Revenue Limit in both years
$0 increase in General Aid in ‘15-16 and 1.2% increase in ‘16-17
$0 increase in Special Education Aid in Biennium $0 increase in High Cost Special Education Aid in
‘15-16 and increases the Aid in ‘16-17 but reduces the proration from 90% reimbursement to 70%
Increases Library Aid (Common School Funds) in ‘15-16 and ‘16-17
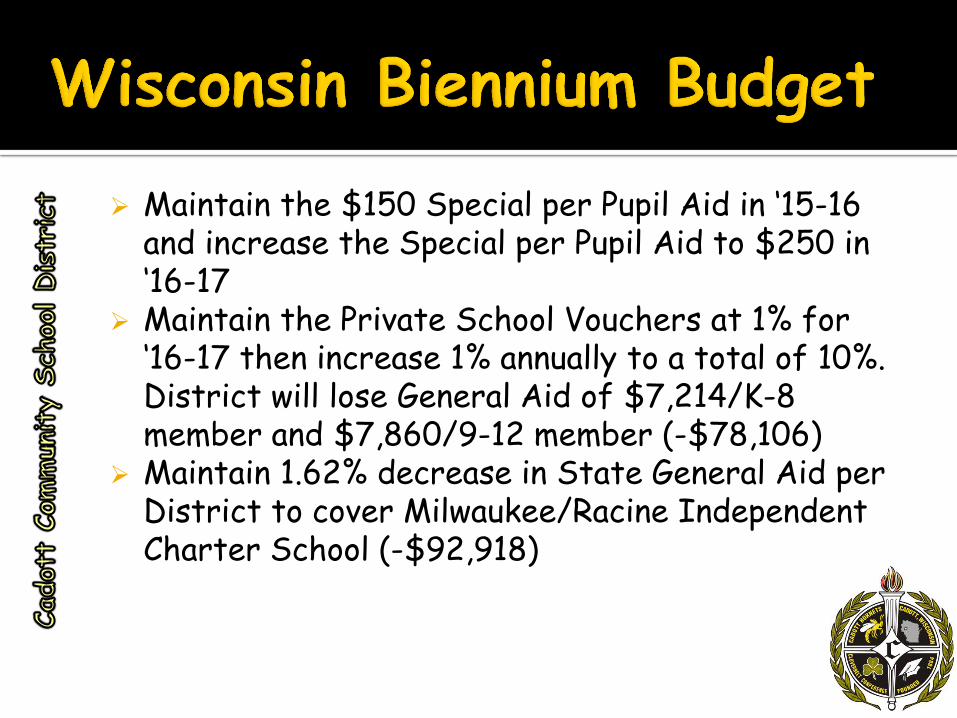
Maintain the $150 Special per Pupil Aid in ‘15-16 and increase the Special per Pupil Aid to $250 in ‘16-17
Maintain the Private School Vouchers at 1% for ‘16-17 then increase 1% annually to a total of 10%. District will lose General Aid of $7,214/K-8 member and $7,860/9-12 member (-$78,106)
Maintain 1.62% decrease in State General Aid per District to cover Milwaukee/Racine Independent Charter School (-$92,918)

Revenue Highlights: .92% proposed revenue growth for all funds
25% proposed decrease in Federal Aid
2.52% proposed increase in State Equalization Aid
150% proposed increase in Other State Categorical
Aid

Local Sources 2,802,178
30%
Interdistrict (Wisconsin) 219,800
2%
Intermediate 91,404
1%
State Sources 6,013,457
64%
Federal Sources 230,735
3%
Non-Revenue Sources 2,000
0%
Other Revenue 30,155
0%
Projected Revenue Budget

0 1,000,000 2,000,000 3,000,000 4,000,000 5,000,000 6,000,000 7,000,000
200
300
500
600
700
800
900
200 300 500 600 700 800 900
2016-17 2,710,909 219,800 92,404 6,247,656 173,051 2,000 30,155
2015-16 2,802,178 219,800 91,404 6,013,457 230,735 2,000 30,155
Projected Revenue 200 Local Sources
300 Interdistrict (Wisconsin)
500 Intermediate
600 State Sources
700 Federal Sources
800 Non-Revenue Sources
900 Other Revenue
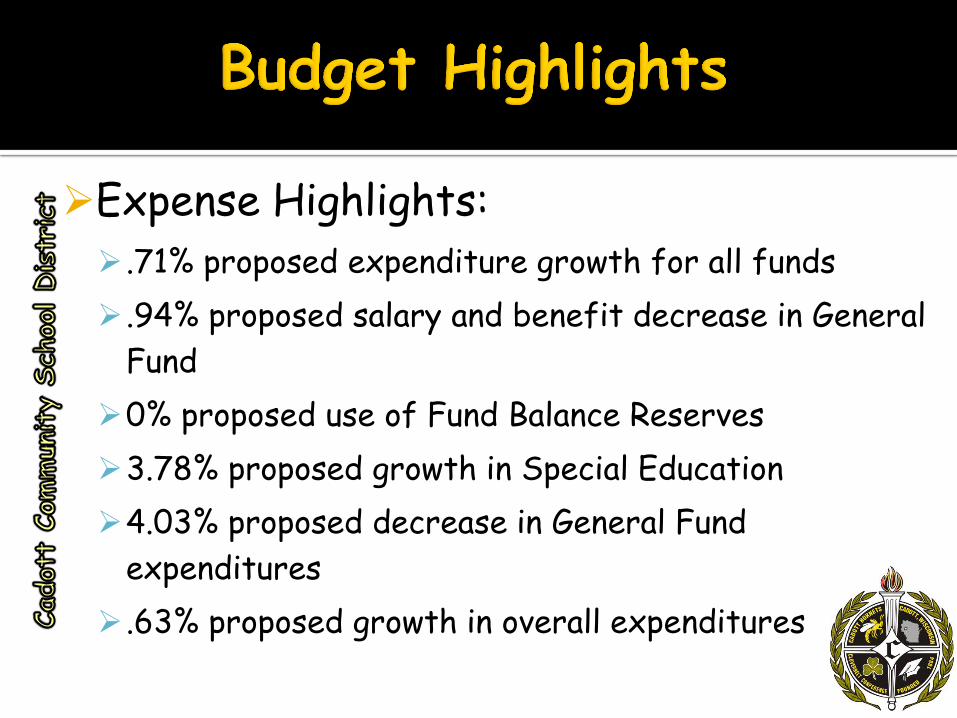
Expense Highlights: .71% proposed expenditure growth for all funds
.94% proposed salary and benefit decrease in General
Fund
0% proposed use of Fund Balance Reserves
3.78% proposed growth in Special Education
4.03% proposed decrease in General Fund
expenditures
.63% proposed growth in overall expenditures

Salaries 4,141,909
44%
Employee Benefits 2,236,617
24%
Purchased Services 1,403,975
15%
Non-Capital Objects 417,365
4%
Capital Objects 194,003
2%
Insurance & Judgements 128,404
1% Interfund Transfers
871,987 9%
Other Expenses 81,715
1%
Fund 10 Expense Budget

$0 $500,000 $1,000,000 $1,500,000 $2,000,000 $2,500,000 $3,000,000 $3,500,000 $4,000,000 $4,500,000
100
200
300
400
500
700
800
900
100 200 300 400 500 700 800 900
2016-17 4,141,909 2,236,617 1,403,975 417,365 194,003 128,404 871,987 81,715
2015-16 $4,170,387 $2,242,513 $1,264,660 $417,075 $219,476 $142,000 $907,164 $59,225
Projected Expense 100 Salaries
200 Employee Benefits
300 Purchased Services
400 Non-Capital Objects
500 Capital Objects
700 Insurance & Judgements
800 Interfund Transfers
900 Other Expenses


843 Total Students
pk-12
Decreasing enrollment Open Enrollment
46 in/65 out 4 Major Buildings
Elementary
Junior/Senior High
Bus Barn
School Forest 129 staff members
60 elementary
54 secondary
15 transportation
School Report Card Data (2013-14)
Elementary Exceed Expectations
Middle Meets Expectations
High School Exceed Expectations Special Education
*23% Special Education rate Daily Attendance
*95.8% attendance rate Graduation Rate
*95% ACT Graduating Senior Composite
20.2
*Higher than State average

Responsibility
Respect
Teamwork
Safety

In the School District of Cadott Community, we engage our community, support our educators, and ensure all students achieve high levels of learning

Student Success GOAL: We quip our graduates to meet college and career readiness standards through a rigorous and engaging academic curriculum and diverse extracurricular options.
Employee Engagement & Culture
GOAL: We are an engaged workforce and our culture is collaborative, builds mutual respect, and promotes individual and collective efforts and achievement.
Family & Community Partnerships
GOAL: We are committed to partnering with our families and the community to support students’ social-emotional wellness and academic success.
Finance, Facilities, & Operations GOAL: We are an efficient operation that ensures a healthy, child-centered, safe, and secure environment.

Student Success Increase percentage of students who
achieve grade level proficiency on the Spring PALS from 89% to 95%.*
Increase the percentage of students grades 3-8 scoring proficient or advanced on the state standardized literacy and Math assessment from 40.5% to 50%.*
Increase the percentage of 11th grade students meeting all four college readiness standards on ACT from 14% to 36% .*
And More
Employee Engagement & Culture Increase employee engagement from 3.00
to 3.80.^ Maintain employee engagement survey
participation at 95% or above.^ Among workforce members leaving
employment in Cadott, decrease the percentage who will leave by choice to seek similar employment elsewhere from 7% to 3% (local data).
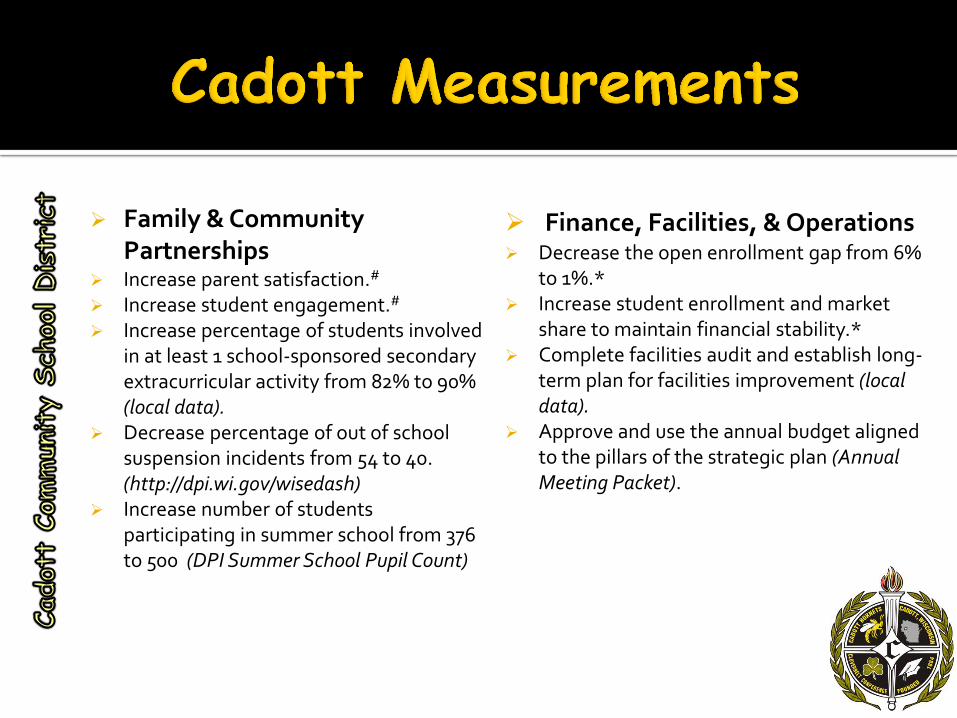
Family & Community Partnerships
Increase parent satisfaction.# Increase student engagement.# Increase percentage of students involved
in at least 1 school-sponsored secondary extracurricular activity from 82% to 90% (local data).
Decrease percentage of out of school suspension incidents from 54 to 40. (http://dpi.wi.gov/wisedash)
Increase number of students participating in summer school from 376 to 500 (DPI Summer School Pupil Count)
Finance, Facilities, & Operations Decrease the open enrollment gap from 6%
to 1%.* Increase student enrollment and market
share to maintain financial stability.* Complete facilities audit and establish long-
term plan for facilities improvement (local data).
Approve and use the annual budget aligned to the pillars of the strategic plan (Annual Meeting Packet).

Student Success Refine a multi-tiered system for
academic development. Build staff capacity to change instruction
based on student data through Professional Learning Committees.
Build staff capacity to ensure best practices and increased rigor.
Align essential learning targets, academic standards, and assessments on PK-12 curriculum.
Increase educational technology to beyond pervasive access and utilization.
Implement Academic/Career Plans. Implement PK-12 inclusive education
practices. And more.
Employee Engagement & Culture Create and implement a comprehensive
retention strategy Reward an recognize individual and
collective effort by implementing strategic compensation.
Define and develop a set of standards of behavior for all stakeholders aligned to our core values.
Develop and implement an employee wellness program.
Develop and implement a system for employee input and communications.
Cultivate employee leadership capacity and effectiveness.
And more.
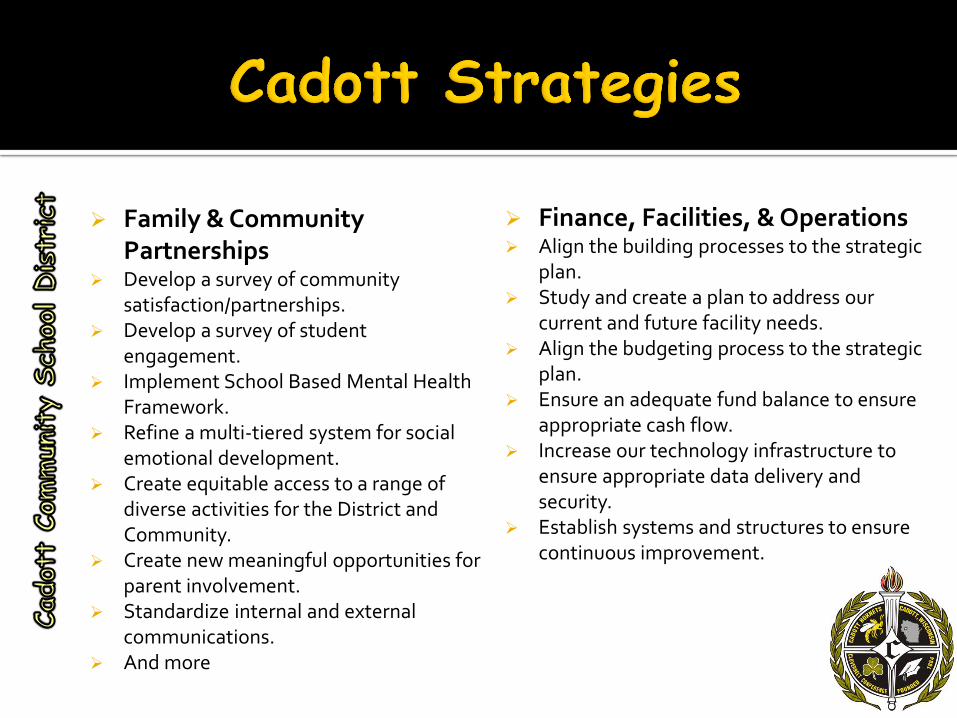
Family & Community Partnerships
Develop a survey of community satisfaction/partnerships.
Develop a survey of student engagement.
Implement School Based Mental Health Framework.
Refine a multi-tiered system for social emotional development.
Create equitable access to a range of diverse activities for the District and Community.
Create new meaningful opportunities for parent involvement.
Standardize internal and external communications.
And more
Finance, Facilities, & Operations Align the building processes to the strategic
plan. Study and create a plan to address our
current and future facility needs. Align the budgeting process to the strategic
plan. Ensure an adequate fund balance to ensure
appropriate cash flow. Increase our technology infrastructure to
ensure appropriate data delivery and security.
Establish systems and structures to ensure continuous improvement.

2016-17 School Tax Levy Information
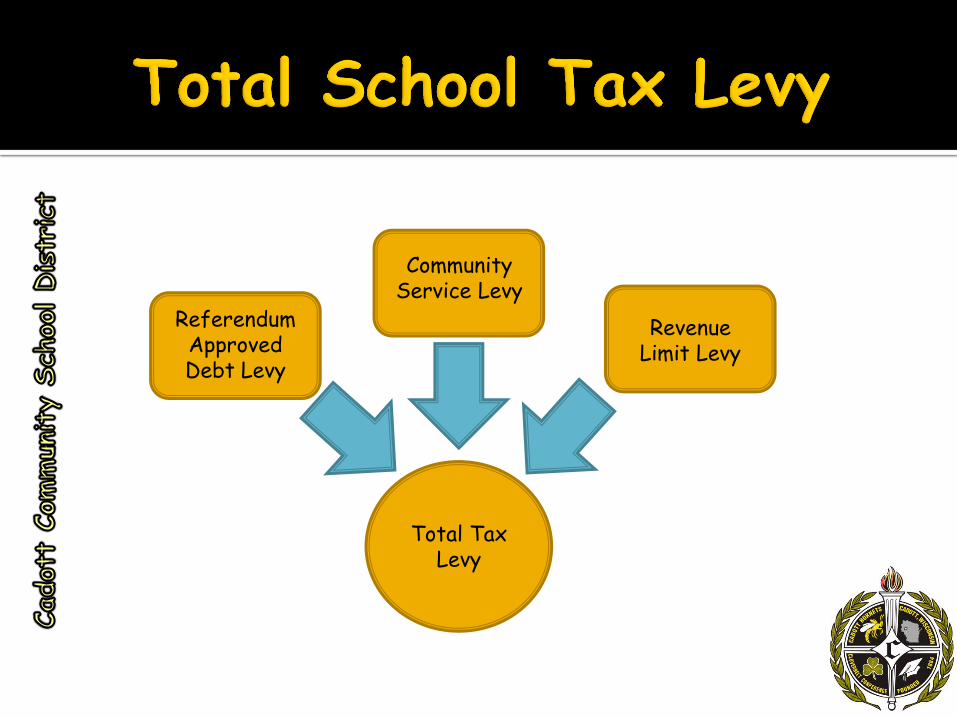
Referendum Approved Debt Levy
Community Service Levy
Total Tax Levy
Revenue Limit Levy

Our Tax Levy is controlled by the Revenue Limits imposed in 1993 Cadott has historically “underlevied” below the limit Limits a District’s Operational Levy
General Fund 10 ($2,644,151)
Non-referendum approved debt Fund 38 ($269,313)
Capital expansion ($0)
Referendum Approved Debt Levy
Community Service Levy
Total Tax Levy
Revenue Limit Levy
$0
$500,000
$1,000,000
$1,500,000
$2,000,000
$2,500,000
$3,000,000
20
04
-05
20
05-
06
20
06
-07
20
07-
08
20
08
-09
20
09
-10
20
10-1
1
20
11-1
2
20
12-1
3
20
13-1
4
20
14-1
5
20
15-1
6
20
16-1
7Underlevy Amount
Underlevy Amount

Referendum Approved Debt Levy Fund 39 ($579,625)
Levy as per amortization schedule
Community Service Levy Fund 80 ($8,290)
Used for community based programs
Levy is determined by needs and was capped until 2015
Not an aid able expenditure
Referendum Approved Debt Levy
Community Service Levy
Total Tax Levy
Revenue Limit Levy

$0
$1,000,000
$2,000,000
$3,000,000
$4,000,000
$5,000,000
$6,000,000
$7,000,000
Ax
is T
itle
Tax Levy by Fund
October 15 General Aid Certification
Referendum Fund 39 Tax Levy
Non-Referendum Fund 38 Tax Levy
Community Service Fund 80 Tax Levy
Total All Fund Tax Levy

Local Sources, 2,710,909, 29%
Interdistrict Payments, $219,800, 2%
intermediated Sources, $92,404, 1%
State Sources, 6,247,656, 66%
Federal Sources, $173,051, 2%
Other Sources, $32,155, 0%
Where the General Fund Money Comes From $9,475,975

$0
$1,000,000
$2,000,000
$3,000,000
$4,000,000
$5,000,000
$6,000,000
$7,000,000
Local Sources Interdistrict Payments intermediated Sources State Sources Federal Sources Other Sources
Ax
is T
itle
Where the General Fund Money Comes From

Revenue Limit Levy
Authority
State General (Equalization)
Aid
Maximum Revenue Limit
Authority
Revenue Limit Levy
Authority
State General (Equalization)
Aid
Maximum Revenue Limit
Authority
2004-05 2005-06 2006-07 2007-08 2008-09 2009-10 2010-11 2011-12 2012-13 2013-14 2014-15 2015-16 2016-17
Series1 84.65% 78.98% 80.83% 84.08% 76.81% 80.96% 75.62% 70.56% 71.88% 66.71% 69.56% 65.25% 66.28%
Base Revenue $6,561,0 $6,865,5 $6,812,4 $6,951,3 $7,410,8 $7,310,0 $7,725,2 $7,727,3 $7,536,1 $8,103,8 $8,012,7 $8,574, $8,653,
65.00%
70.00%
75.00%
80.00%
85.00%
90.00%
Pe
rce
nt
Trend in State Aid

Instruction $4,516,079.00
48%
Support Services $3,602,909.00
38%
Non-Program $1,356,987.00
14%
Where the General Fund Money Is Used
$9,475,975
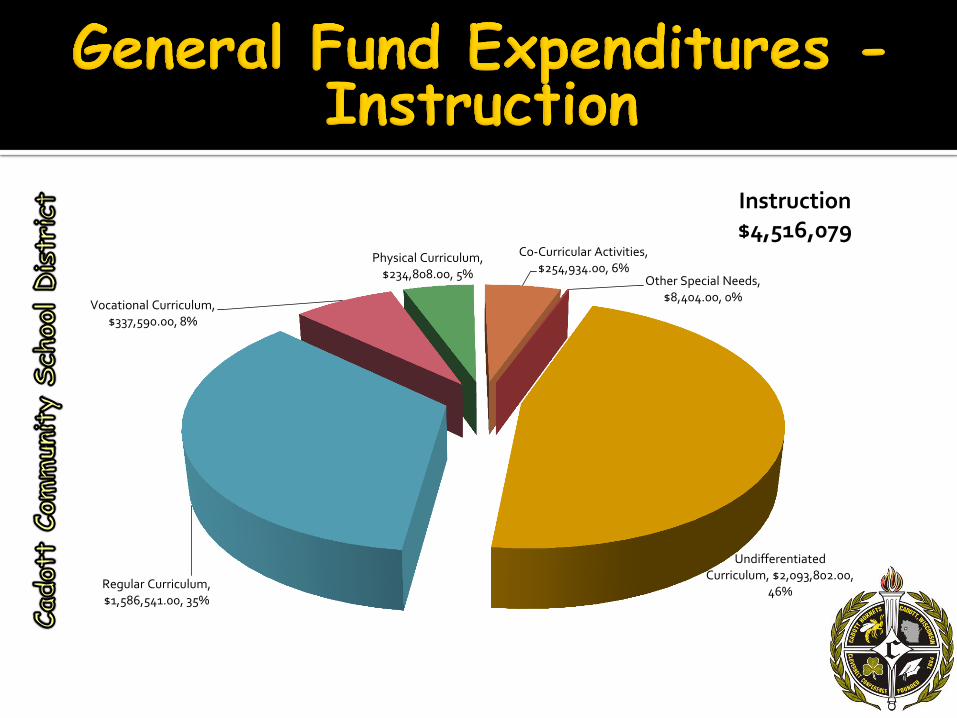
Undifferentiated Curriculum, $2,093,802.00,
46% Regular Curriculum, $1,586,541.00, 35%
Vocational Curriculum, $337,590.00, 8%
Physical Curriculum, $234,808.00, 5%
Co-Curricular Activities, $254,934.00, 6%
Other Special Needs, $8,404.00, 0%
Instruction $4,516,079
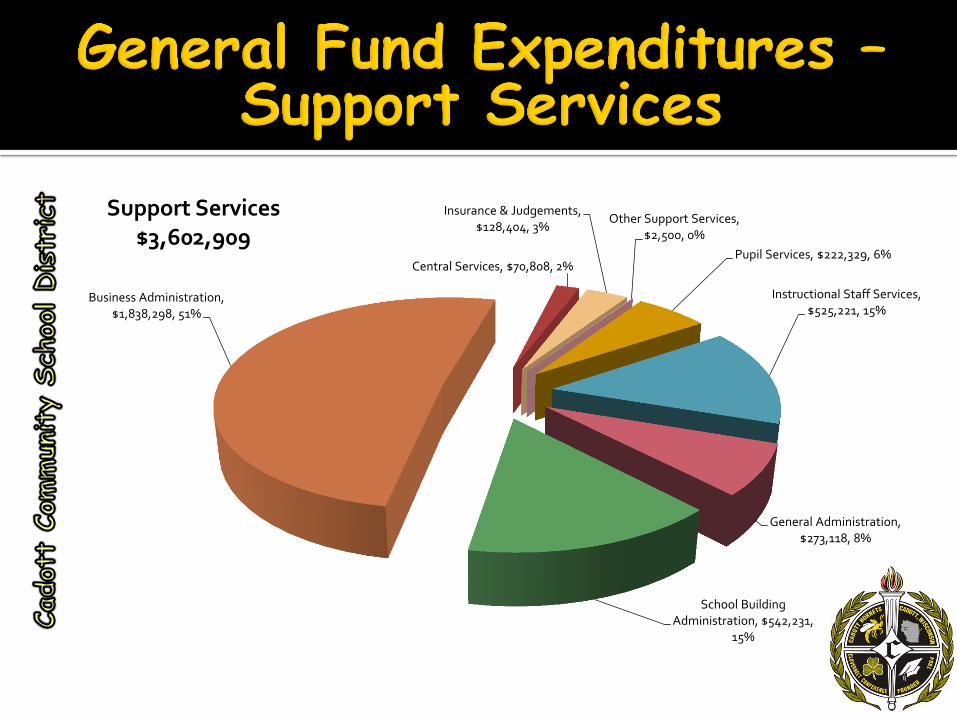
Pupil Services, $222,329, 6%
Instructional Staff Services, $525,221, 15%
General Administration, $273,118, 8%
School Building Administration, $542,231,
15%
Business Administration, $1,838,298, 51%
Central Services, $70,808, 2%
Insurance & Judgements, $128,404, 3%
Other Support Services, $2,500, 0%
Support Services $3,602,909

Inter-fund Transfers $871,987
64%
Instructional Services $462,000
34%
Other Non-Program Transactions
$23,000 2%
Non-Program Expenditures $1,356,987

Fund 73- Post Retirement Benefit Fund Fund 73 was established as an irrevocable trust account for post-employment benefits. Funds are invested with MidAmerica Administrative and Retirement Solutions. Below is an audited accounting of the trust fund:
Beginning Balance 7-1-2015 $ 1,170,141.16
Earnings $ 113,791.60
Disbursements $ (205,569.38)
Ending Balance 6-30-2016 $ 1,078,363.38
Based on an actuarial study completed in June of 2014, the District's post-employment benefit
trust is fully funded based on current retirees and current post-employment benefits offered to staff.

Community Service - Fund 80 Report Fund 80 is used to support the Community Service Activities for the Community through the School District. During the 2015-16 school year, summer recreation activities were taken over by the community and the District made the move to utilize Fund 80 as an adult education fund. Shown below is the audited accounting of Fund 80.
Balance 7/1/2015 $ 13,398.52
Revenue (Tax Levy) $ 8,290
Expenses $ (4,978.81)
Balance 6/30/16 $ 16,709.71

• The fund balance is a culmination of all assets (not a single savings account) that is used to cover expenses when no revenue is coming in. – A healthy fund balance is 15%-20% of total expenditures allowing the
district to cover 2 months of Operating Expenses and/or an emergency.
$0
$500,000
$1,000,000
$1,500,000
$2,000,000
$2,500,000
$3,000,000
2004-05 2005-06 2006-07 2007-08 2008-09 2009-10 2010-11 2011-12 2012-13 2013-14 2014-15 2015-16
Fund Balance Reserve $1,643,025
Fund Balance

-$1,000,000.00
$0.00
$1,000,000.00
$2,000,000.00
$3,000,000.00
$4,000,000.00
$5,000,000.00
$6,000,000.00
Va
lue
General Fund Balance Reserve Utilization Fund 10, 27, 50, & 80
Revenue
Expense
Fund Balance

Total Tax Levy
Equalized Property Value (TIF OUT)
1,000 Mill Rate
$100,000,000
$150,000,000
$200,000,000
$250,000,000
$300,000,000
$350,000,000
$400,000,000
2004-05 2005-06 2006-07 2007-08 2008-09 2009-10 2010-11 2011-12 2012-13 2013-14 2014-15 2015-16 2016-17
TIF Out Tax Apportionment Value $346,877,126
$0
$1,000,000
$2,000,000
$3,000,000
$4,000,000
2004-05 2005-06 2006-07 2007-08 2008-09 2009-10 2010-11 2011-12 2012-13 2013-14 2014-15 2015-16 2016-17
Total All Fund Tax Levy $3,501,379

Fund 38 Levy, $0.78, 8%
Fund 39 Levy, $1.67, 17%
Fund 10 Levy, $7.62, 75%
Fund 80 Levy, $0.02, 0%
All Fund Levy Mill Rate $10.09

Total Tax Levy
Equalized Property Value (TIF OUT)
1,000 Mill Rate
State Average Levy Rate, 10.30
Levy Rate (mils), 10.0940
5
5.5
6
6.5
7
7.5
8
8.5
9
9.5
10
10.5
11
2004-05 2005-06 2006-07 2007-08 2008-09 2009-10 2010-11 2011-12 2012-13 2013-14 2014-15 2015-16 2016-17
Ax
is T
itle
Comparison with State Average

Year Rate 2004 – 05 = $6.99 2005 – 06 = $6.95 2006 – 07 = $6.50 2007 – 08 = $6.57 2008 – 09 = $6.31 2009 – 10 = $6.81 2010 – 11 = $7.13 2011 – 12 = $7.49 2012 – 13 = $8.73 2013 – 14 = $9.02 2014 - 15 = $9.60 2015 - 16 = $9.89 Projected 2016 – 17 = $10.09
5.00%
3.30%
7.21% 4.01%
10.04%
4.00%
9.16%
14.64%
3.00%
9.46% 7.57%
7.17%
2005-06 2006-07 2007-08 2008-09 2009-10 2010-11 2011-12 2012-13 2013-14 2014-15 2015-16 2016-17
Percent Change in Total Fund Levy
-0.65%
-6.48%
1.08%
-3.93%
7.89%
4.73% 5.00%
16.58%
3.30%
6.46%
3.03% 2.06%
2005-06 2006-07 2007-08 2008-09 2009-10 2010-11 2011-12 2012-13 2013-14 2014-15 2015-16 2016-17
Percent Change from Previous Year's Levy Rate

2016-17 Projected Tax Table
Projected Property Tax Impact 2015-16 Equalized Value of the District - $331,148,244
2016-176 Projected Equalized Value of the District - $346,877,126
Property Value 2015-16 Levy 2016-17 Levy Levy $ Increase Per Month Increase Per day increase
$9.89 $10.09 $0.20
$100,000 $989.00 $1,009.00 $20.00 $1.67 $0.05
$125,000 $1,236.25 $1,261.25 $25.00 $2.08 $0.07
$150,000 $1,483.50 $1,513.50 $30.00 $2.50 $0.08
$175,000 $1,730.75 $1,765.75 $35.00 $2.92 $0.10
$200,000 $1,978.00 $2,018.00 $40.00 $3.33 $0.11
$225,000 $2,225.25 $2,270.25 $45.00 $3.75 $0.12
$250,000 $2,472.50 $2,522.50 $50.00 $4.17 $0.14
This information based on the District-wide Levy *Note: Potential Home Owner Property Tax Impact is driven by Overall District Property Valuation.

2016-17 is a Biennium Budget year. According to the Assembly Republican Agenda – FORWARD:
o K-12 Administration Reform: public schools (evaluate school funding formula, provide money-saving flexibilities), reducing administrative overheard, increase cooperation among school districts, zones of innovation, expansive summer school programs
o Continued Support for School Choice: explore education savings accounts.
o Addressing the Skills Gap and Encouraging Technical Education and STEM Careers: support technical training in schools, introduce students to local technical jobs, STEM, computer science and robotics, fab labs
o Preparing Students for the Future: 1:1 learning initiative, financial literacy and life skills courses, civics education
According to Department of Administration K-12 public education is the state’s largest financial investment, totally 32% of the 2015-17 biennium budget. If the Legislative priority is to reduce taxes while improving roads and maintaining Medicare spending; pK-12 public education funding may be where the balance occurs.
Watch for updates and public forums on the biennial budget in March.

Questions?