3 materials and experimental procedures
TRANSCRIPT
3 Materials and Experimental Procedures
This research was developed in the Laboratorio de Ensaios Mecânicos ITUC
PUC – Rio with the objective of determining the values for Et, Gt and τt of six
types of test specimens and bending properties of unidirectional bamboo-
laminated beams.
3.1. Material used
For this dissertation the bamboo species used was Dendrocalamus giganteus
taken from the campus of PUC – Rio. 3 culms were cut in November 2013,
approximately 40 cm above ground level. After curing and drying, bamboo culm
was divided in three parts along its length (Bottom, Middle and Top)
approximately 2.5 to 3.5 m each part. Then transversal sections were split radially
obtaining 5 to 8 strips 3 to 4 cm width and cut longitudinally 120 cm length.
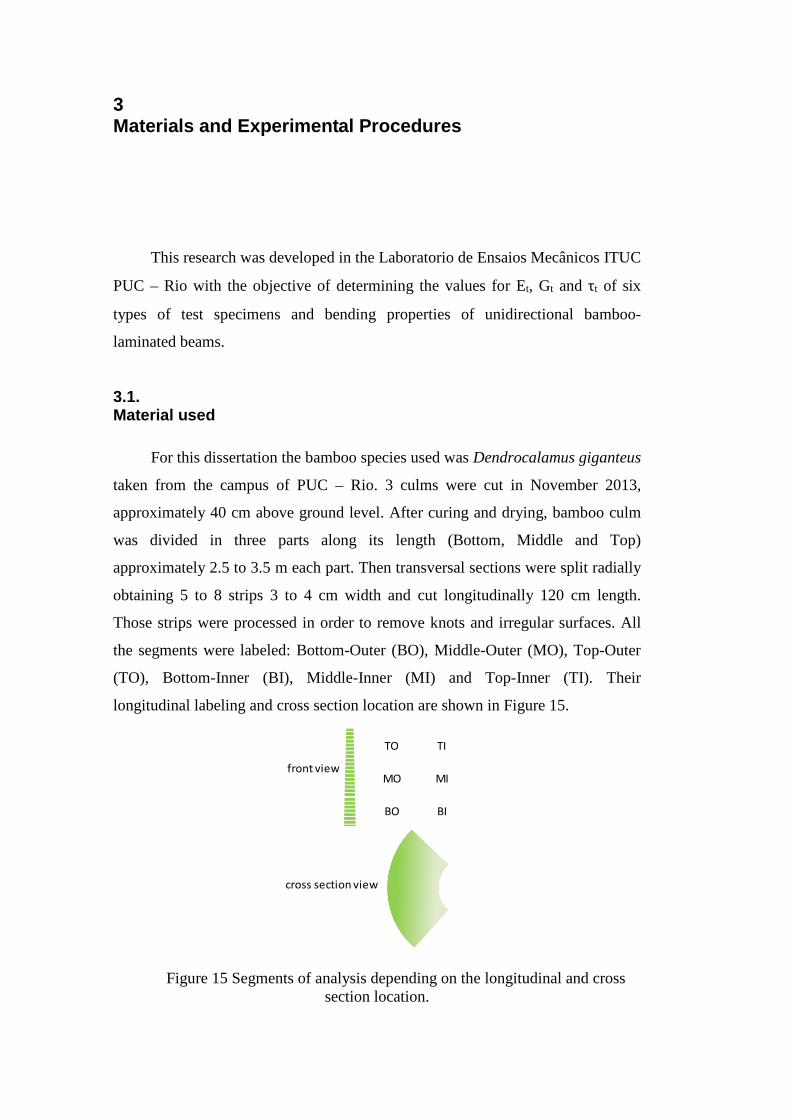
Those strips were processed in order to remove knots and irregular surfaces. All
the segments were labeled: Bottom-Outer (BO), Middle-Outer (MO), Top-Outer
(TO), Bottom-Inner (BI), Middle-Inner (MI) and Top-Inner (TI). Their
longitudinal labeling and cross section location are shown in Figure 15.
TI
MI
BI
TO
MO
BO
front view
cross section view
Figure 15 Segments of analysis depending on the longitudinal and cross section location.

41
3.1.1. Density and specific gravity
For calculating density and specific gravity, 4 internode samples were taken
from different longitudinal and cross section location. The internode was cut into
strips of approximately 22 cm long 3 cm wide and 0.3 cm thick. Mass, dimensions
and label were registered in order to obtain density and subsequently SG.
3.1.2. Humidity
Moisture content determination was made according to the standard
procedure ISO/TC 165 N135 dated: 2001-12-07. Five samples of approximately
25mm wide, 25mm length and height were prepared. Each sample was weighed
and taken to the oven at 110°C to be dried. The drying process took 24 hours and
at the end the weight of samples was read again.
Being m0 initial weight of each sample and m weight after drying, the
moisture M of each sample is calculated with equation:
(3.1)
3.1.3. Roughness
Surface roughness of mats was calculated in order to make sure that there
was an acceptable variation of the surface to allow an optimal performance of
adhesive. This calculation was performed with high accuracy roughness tester
Taylor Hobson 50. However, resulted dispensable essential because planner
thicknesser generated a finish seemed to a sanding process generating layers very
uniforms on thick.
3.2. Equipment
Process to get bamboo layers was carried out with a table saw in order to
divide the culm on strips, and a planner thicknesser was used to get suitable and
thin 3-5 mm thickness samples and laminas to assemble beams. Tests for

42
characterization and bending were carried out in a hydraulic testing machine,
using clip and strain gages for strain measure and load cells for load measures.
3.2.1. Table saw
The saw used was the Makita 2704 table saw 255mm (see Figure 16). The
machine saw table has high rigidity, and delivers accurate cutting work in order to
obtain strips with standard widths. This fact becomes important when optimizing
the material because all strips should have a standard width. Its motor enables
ripping 4"x8" wood with telescopic sub table.
Figure 16 Table saw.
3.2.2. Planner thicknesser
The thicknesser used was a compact thicknesser (see Figure 17) used for
dressing rough sawn of bamboo, it has a double-edged HSS blades and automatic
feed rollers, which push the material through at 8.5m per/min.

43
Figure 17 Planner thicknesser.
The machine allows adjusting thickness. After obtaining strips by sawing,
they were thinned until reaching required segment.
3.2.3. Materials testing machines
The properties of the tensile test segments were obtained by using a
hydraulic testing machine Instron 5500R (see Figure 18). The capacity was
100kN, for tensile, compression and bending tests. The range of velocity was
between 0,01 and 1000 mm/min.
Figure 18 Hydraulic machine testing Instron 5500R.
The machine was equipped with an automatic system reads load values and
vertical displacements, by means of an optical sensor built in. This equipment

44
allows choosing the load application procedure, as a function of load rate or rate
of displacement. For the characterization tests (tensile, shear and adhesive
strength), the test velocity was 1mm/min. The Instron 5500 machine used wedge-
sharped pincer clamps as shown on Figure 18, with a maximum capacity of
5000kgf, tighten by a screw system. Clamps held aluminum plates at ends of
samples to improve grip.
For the bending tests, an Amsler 57/497 was used to bring layered bamboo
beams to failure. Test machines had a load capacity of 20Ton, and are designed
for tensile, compression and bending tests. However, this machine presented a
wider effective span for bending tests since beams were approximately 55 cm
long. Despite test machine measured load, load cell were used in order to
synchronize all sources reads at acquisition system. A Linear Variable differential
transformer (LVDT) sensor located at the bottom of the sample beams was used to
measure vertical displacement in the middle of the sample. Test velocity was
2.4mm/min.
Figure 19 Hydraulic test machine Amsler 57/497.
Gadgets for bending test are shown on Figure 19, they have a maximum
spam length of 100cm. For the four point bending test, a distance of 16,7cm
between restrains was used as it can be seen on test arrangement.
45
3.3. Samples
This research used two types of specimens, test specimens and beam
specimens. Test specimens were thin individual layers 200 mm length to
determine tensile modulus of elasticity Et and shear modulus G for each segment
of analysis (BI, MI, TI, BO, MO and TO). Beams specimens were elements
composited by layers exclusively from a segment of analysis to determine bending
modulus of elasticity Eb.
3.4. Test specimens
There were obtained 18 test specimens for the modulus of elasticity and 18
more for shear modulus tests (3 samples for each segment of analysis), those were
obtained from bamboo culms by a radial-symmetrical cut in the cross section
along the culm. This provided strips with an accurate isosceles trapezium cross-
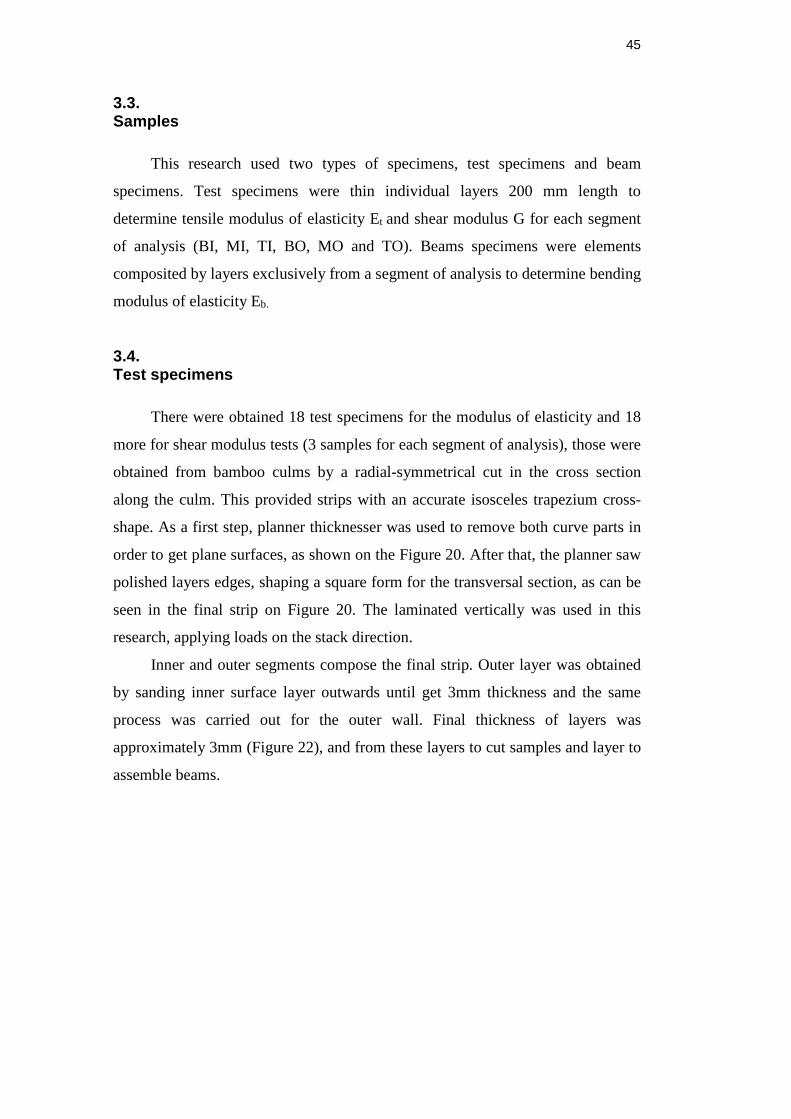
shape. As a first step, planner thicknesser was used to remove both curve parts in
order to get plane surfaces, as shown on the Figure 20. After that, the planner saw
polished layers edges, shaping a square form for the transversal section, as can be
seen in the final strip on Figure 20. The laminated vertically was used in this
research, applying loads on the stack direction.
Inner and outer segments compose the final strip. Outer layer was obtained
by sanding inner surface layer outwards until get 3mm thickness and the same
process was carried out for the outer wall. Final thickness of layers was
approximately 3mm (Figure 22), and from these layers to cut samples and layer to
assemble beams.
46
Figure 20 Strip obtaining process, from bamboo culm to final composite (inner-outer) strip.
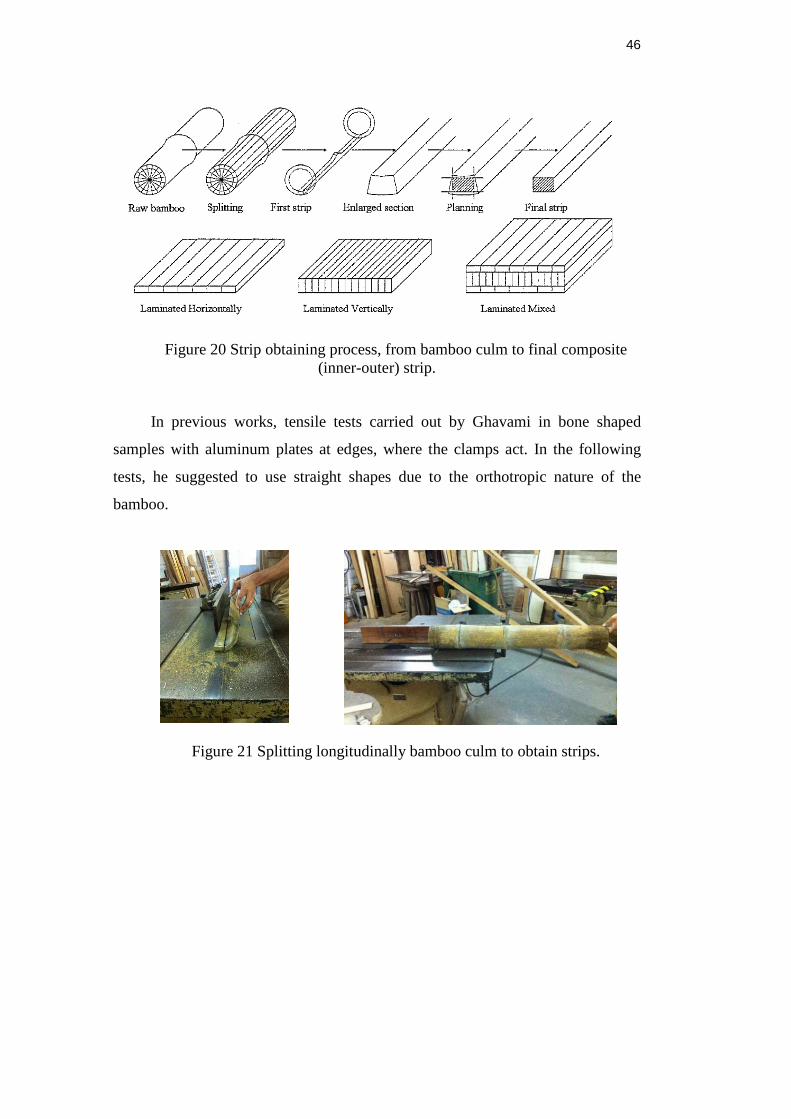
In previous works, tensile tests carried out by Ghavami in bone shaped
samples with aluminum plates at edges, where the clamps act. In the following
tests, he suggested to use straight shapes due to the orthotropic nature of the
bamboo.
Figure 21 Splitting longitudinally bamboo culm to obtain strips.

47
Figure 22 Thicknesser process to reduce and flatten strips into test specimens.
3.5. Determination of tensile modulus of elasticity Et
Tensile modulus of elasticity was determined for each segment of analysis,
although according to standard ISO/DIS 22157, for simple tensile test parallel to
fibers, this should only be done with bottom culms. Deformations were obtained
by using one clip-gage placed at the center of the test specimens, and three of
them using both clip and strain-gages to calibrate readings. Three test specimens
of 200mm long, 100mm width and 3mm thick were obtained for each segment of
analysis. Ghavami suggested straight shape test specimens, as in almost all cases
shapes are narrow in the middle (known as bone shape) to force failing in this
area. However, those assumptions generate stress concentrations in fiber-matrix
composites that could alter the results. Samples were identified as UST
(unnotched simple traction). Sample shape and dimensions are shown below.
10
mm
3 m
m
200 mm
Figure 23 Sample scheme for modulus of elasticity determination tests.

48
Simple tensile test is shown on Figure 24, shows the location of strain-gage
in the middle of the sample. During the tests read load values, vertical
displacement and deformation were measured with the purpose of determining the
stress-deformation curve for each specimen. Rusinque suggested installing
corrugated aluminum plates with epoxy adhesives Sikadur in both sides of
samples, to improve grip with clamps (Rusinque, 2009).
3.6. Determination of shear modulus G
Shear tests were performed to calculate shear corrected modulus of
elasticity, indicated by ASTM D198. It was determined on pieces of
approximately 3 mm thick, 200 mm long and 20 mm width in order to establish
shear resistance and its variation regarding the volume fraction along the thickness
of the culm. The test procedure followed the steps proposed by Ghavami & Suoza,
which modify the sample indicated by standard ISO N134, suggesting a simple
test specimen as shown below in Figure 28 (Ghavami & Souza, 2000) Therefore,
shear test is led to failure as a simple tensile test..
Test specimens were cut with a scalpel and processed on the planner
thicknesser oriented to obtain constant thick. Thickness was measured with
(a) (b)
Figure 24 Tensile test for modulus of elasticity determination (a) detailed strain and clip gage location before rupture in straight shape (b) sample
rupture.

49
pachymeter along the sample in six different points to define an accurate average
thickness to calculate area under shear stresses.
15
mm
3 m
m
200 mm
40mm
Shear line
Shear surface
A
B
Figure 25 Samples dimensions and opposite transverse cuts A and B made on specimen to define shear zone approximately of 40mm long and 3mm width.
For this test, corrugated aluminum plates were attached at sample ends
with epoxy adhesive Sikadur to improve grip on clamps.
3.7. Beam specimens - Laminated Glued Bamboo (LGB)
There were used 18 beam specimens, 3 by each segment of analysis. They
were assembled stacking randomly 10 to 14 layers of 550 mm approximately and
Figure 26 Tensile test for shear modulus determination (a) detailed clip gage location before rupture in straight shape and opposite transversal cuts (b)
sample rupture along the shear line.

50
effective span of 500 mm. Layered bamboo arrangements glued with any kind of
adhesives have been named with many terms, depending on adhesives and the
types of wood arranging them. Layers obtained in previous steps were arranged in
sets with similar conditions, before being stacked using mamona resin as adhesive
laminator.
Strips were divided into groups of the same analysis segments, as seen on
Figure 23 (a). First layers were arranged to spread resin uniformly, then second
layers were placed aligned to the first ones, and this process was until having a
stack of 8 to 12 pieces, as can be seen on Figure Figure 23 (b). As the chemical
reaction involved is exothermic, the drying process does not need heating.
However, a pressure ranging between 15 to 20 kPa was applied during 24 hours
after applying the adhesive. Blocks were polished in order to remove resin
excesses and to shape longitudinal and cross-sections. Final beams ready to test
are shown on Figure 23 (c).
(a) (b) (c)
Figure 27 (a) 3mm thick bamboo mats with a coat of mamona’s resin (b) strips stacked arranged for stick (c) final beams casted after adhesive
drying and polishing edges.

51
3.8. Determination of bending modulus of elasticity Eb
Beams were instrumented with upper and lower strain gages in the
midpoint of the beam to measure strains. A LVDT sensor was located in the
middle to read vertical displacement and loads applied by the load applicator. All
sensors were connected to acquisition system, which recorded values of each one
during the test period. The Figure 24 shows the test arrangement for a 4 points
bend test, which is set up in this way to generate pure bending moment at the
middle-span.
500mm
167mm 166mm 167mm
Load pins
LVDT
Lower and upper strain gages
167mm
Supporting pins
Figure 28 Set up of 4 point bending test.
Figure 29 Picture of a 4 points bending test arrangement showing the load and supporting conditions.
52
Tests were carried out until failure although strain gages and LVDT in
almost all cases were exceeded. However, information recorded was enough to
determine the modulus of elasticity and shear modulus for the LBL casted.
Different methodologies were used to establish bending modulus of
elasticity. In the first place, modulus was established based on elastic curve
equations. Then a methodology based on upper and lower strains on the beams by
using strain gages. Finally, the ASTM provides equations to calculate directly the
apparent modulus of elasticity and shear corrected modulus (ASTM D198, 2014)
on static test for lumber in structural sizes.
3.9. Mamona resin adhesive
The adhesive used was resin of Mamona. This is a mixture composed by
Mamona oil, known as castor oil, extracted from mamona fruit (Ricinus communis
L.) a popular bush mainly grown in tropical regions. It is used for obtaining a
polymer known as Polyurethane, which presents favorable features in terms of
strength and sustainability. Due to this, the resin of mamona emerged as an
optimal adhesive to use on this research, both for its mechanical performance and
biomaterial condition, as it was recognized in (Marques & Rossinoli Martins,
2009).
Mamona’s resin is a bi-component material made of a mixture, in a
proportion 2:1, of a Polyol (alcohol) and a Pre-polymer (Isocyanate) respectively,
as can be seen on Figure 30 Image of mamona components Polyol and Pre-
polymer and its respective proportions. Polymerization reaction occurs between
an isocyanate and an alcohol; it liberates about 24 kcal/mol of Urethane, in an
exothermic reaction. A dense solution was the result, which was applied
uniformly in layers of approximately 1 to 0,7 mm over the entire surface stuck.
The application had to be done immediately after the alcohol and the isocyanate
were mixed, due to its fast drying properties.
The experimental density of the composite was calculated by measuring the
weight of 142 ml of resin. The result was
Therefore, its experimental
specific gravity is 0,92, which conforms the specifications of the supplier

53
(Proquinor Produtos Quimicos do Nordeste Ltda) who states a range of 0,9 – 1,0
g/cm3.
Figure 30 Image of mamona components Polyol and Pre-polymer and its respective proportions.
In preliminary studies about polyurethanes derived from Mamona oil aimed
to obtain mechanical and physical properties as a biomaterial developed for
medicinal elements and prosthesis (Loureiro et al, 1998) obtained the following
values.
max load [N]
tensile rupture [KPa]
elongation [%]
Modulus of Elasticity [MPa]
Mamona's resin 8 335,75 105,27 0,36
Table 5 Mamona’s resin properties.