4540 series rf power meter - コーンズ テクノロジー … effective random sampling the 4540...
TRANSCRIPT

Taking performance to a new peak
Data Sheet
4540 Series RF Power Meter

2
4540 Series RF Power Meter
The Boonton 4540 Series RF Power Meter is the instrument of
choice for capturing, displaying and analyzing RF signals. Ap-
plications include pulsed RF signals like RAdAR or gSM based
technologies, as well as pseudorandom, noise-like signals such
as cdMA, evdo, wlAn, wiMAx, uMTS, hSPA, lTe, oFdM or
hdTv. The 4540 Series offers Pulse, Modulated/cw, and Sta-
tistical operating modes, making it well suited for all require-
ments of R&d, manufacturing and control operations. Single
channel versions (4541) and dual channel versions (4542)
are available.
Features
• 200pstimeresolution
• 7nsrisetime
• Videobandwidthupto70MHz
• 17defaultpresetsplusstoragefor25userdefinedpresets
• FaststatisticalanalysisincludingccdF
• Textviewofupto14outof28parametersperchannel
simultaneously (power / voltage, time, statistics,
channel math)
• Bright,clear4”colorLCDdisplay
• gPiB, lAn, uSB device (B-type connector) interfaces
• Highbandwidth,widedynamicrangesensorsavailable
Both 4541 and 4542 power meters command powerful pulse recogni-tion and analysis systems. Parameters like pulse-width, rise time, fall time, power distribution and many others are automatically detected, measured and presented.

3
Modulated Mode
Modulated Mode measurements are possible with cost effective
cw sensors, or with fast Peak Power sensors. using Peak Power
sensors, the 4540 Series can measure true average power of
modulated waveforms, while providing important information
about the instantaneous peak power value. large digits allow
clear, legible measurement reading.
Pulsed Mode
Analysis of fast single pulses or pulses with high pulse repeti-
tion interval (PRi) requires an instrument with sophisticated
trigger and data acquisition capability. This provides accuracy
andhighdefinitiontracedetailofthemeasuredsignal.A
variety of trigger settings, including pre and post trigger in
combination with a high sampling rate allow the 4540 Series to
capture any pulse. high level of signal detail is essential when
shortpulses,signaledges,signalovershoots,filters,highgain
amplifiers,delaylinesandsuchhavetobeanalyzed.
The falling signal edge shows an unwanted anomaly. The signal bounces back, after an initial decline, and then it settles to the actual off level.
clear and legible numeric display allows quick measurement readings.
noise-like signals are analyzed statistically. The average power in this ccdF representation serves as a reference, while the graph shows the distribution of lower power levels.
Statistical Mode
non-periodic signals, such as hdTv, evdo, uMTS or lTe are
noise-like and consist of varying magnitude peaks randomly
distributed over the channel. These random events do not serve
asatriggerforconsistentmeasurements.Amplifierdesigns
require fast peak measurement capability from a power meter
to detect signal clipping and compression due to overload.
The complementary cumulative distribution Function, or ccdF,
displayed by the 4540 plots the probability that the power will
beatorbelowaspecifiedlevel.Byexaminingtheareasclose
to 100% probability, it is possible to see how often the highest
peaksoccur.Itiseasytoseeamplifiercompressionunderactual
operating conditions, and to predict the effect on error rate
that this may have. up to 4 gSamples of data can be collected,
compiled and analyzed by the 4540 Series.
Modulated, Pulsed and Statistical Measurements

4
Effective Random Sampling
The 4540 Series RF Power Meter offers an impressingly detailed
representation of measured signals. As a result, signals can be
analyzed thoroughly and anomalies can be detected imme-
diately.Highsignaldefinitionisachievedwithtwopowerful
features: a time resolution of 200ps, unprecedented in a power
meter of this class, and a technique called Repetitive Random
Sampling. For repetitive signals, the 4540 Series offers an effec-
tive sampling rate of up to 5 gSamples / second.
Autoset/Preset
For accurate, repeatable measurements, power meters require
diligently chosen trigger and timing settings. Finding the
correcttriggersettingsisoftenmoredifficultthanperform-
ing the actual measurement – not so with the 4540 Series.
Ourinstrumentsareequippedwithan“AutoSet”feature.This
feature analyzes incoming signals and presets the instrument’s
timing and trigger settings in a way that allows for immediate
measurements. Presets are available for many common wireless
formats.
RF-Voltage Measurements
in some cases it is necessary to measure RF voltage without
terminatingorsignificantlyloadingthesource.The4540Series
supports voltage measurements with different Boonton voltage
probes (also known as voltage sensors). Boonton’s high imped-
ance voltage probes are available for frequencies from 10 hz to
1.2 ghz. voltage probes are designed to measure cw voltage
to 10 v, but they can also be used to measure the root mean
square (RMS) value of a fluctuating or modulated signal up to
20 mv (2 v with 1:100 divider). linearity correction factors are
stored in the sensor adapter, so voltage measurements can be
taken immediately.
Firmware Updates
Boonton strives to provide the best products to our customers,
hencethe4540Seriescanbeeasilyfield-updatedwithnew
firmware.Newfirmwareversionsarereleasedperiodicallyand
available at the Boonton website. The download package comes
with a loader that handles the proper update of the 4540 Series
viaaPC.Advantagesoffirmwareupdatesareobvious:features
added – for free.
The graphic header feature of the 4541 / 4542 RF power meters allows displaying up to 10 user selectable parameters. colors refer to the specificchannel:yellow–ch1,bluech-2.
Virtual Front Panel Software
The 4540 virtual Front Panel software (vFP) can be down-
loaded from the Boonton web site. it provides three powerful
features:
• 4540SeriesRemoteKeySimulation
• Screenshots
• FullScreenDisplay
RemoteKeySimulationallowssimulatingallthekeysofthe
4540 Series that is connected to the Pc via lAn. if more than
one 4540 Series is present at the subnet, vFP software will
detect all instruments and show their iP addresses and serial
numbers. The operator can now select which instrument he
wants to control. vFP does not switch the power meters into
remote state; while controlled by vFP they still allow operation
via the actual front panel keys.
Screenshots of traces are often required as records or when
signals need to be analyzed at a later point in time. The 4540
vFP software takes a screenshot with one push of a button and
storestheimagesasbitmapfiles.
The4540Serieshasa4”displayprovidinghighresolutionand
great detail of the signal trace. Menu buttons can be hidden to
increase the usable screen area. if an even larger screen display
is required, the viewer function of the vFP transfers the 4540
Series screen live to a Pc to utilize the full screen size.

5
4540 Series Specifications
Acquisition and Measurement System Measurement Technique
Random repetitive sampling system providing pre and post-trigger data and statistical histogram accumulation
Sampling Rate 50 MSa / second on each channel simultaneously
effective Sampling Rate 5 gSa /second on each channel simultaneously
Memorydepth 262,144samplesatmax sampling rate
VerticalResolution 0.008%,14-bitA/DConverter
dSP 32 bit floating point
Time resolution 200 ps
Sensor InputsRF channels 1 or 2 (4541 / 4542)
RF Frequency Range 10 khz to 40 ghz*
Pulse Meas. Range -50 to +20 dBm*
Modulated Meas. Range -55 to +20 dBm*
CWPwrRange -70to+44dBm*
Relative offset Range ±200.00 dB
VideoBW 70MHz*
Risetime <7ns*
Single Shot Bandwidth 5 Mhz (based on 10 samples/pulse)
* Sensor Dependent, Calibrator Dependent
Vertical Scalelogarithmic
0.1 to 50 dBm/div in 1-2-5 sequence 0.1 to 50 dBv/div in 1-2-5 sequence 0.1 to 50 dBmv/div in 1-2-5 sequence 0.1 to 50 dBuv/div in 1-2-5 sequence
linear1 nw/div to 50 Mw/div in 1-2-5 sequence 1 nv/div to 50 Mv/div in 1-2-5 sequence
Trigger Mode normal, Auto, Auto Pk-to-Pk,
Free Run
Source channel 1 (internal) channel 2 (internal) External
Trigger (continued)internal level Range -40 to +20 dBm
(sensor dependent)
ExternalLevelRange ±5volts(±50voltswith10:1divider probe)
ExternalInputImpedance 1MOhm(13pFDCCoupled)
Slope + or –
hold-off 0.0 - 1.0 sec (10 ns resolution)
Min Trigger Pulse width 15 ns
MaxTriggerRate 30MHz
Time BaseTime Base Resolution 200 ps
Time Base Range 10 ns/div to 1 hr/div
Time Base Accuracy 0.01%
Time Base display Sweeping or Roll Mode
Trigger delay RangeTimebases 10 ns to 500 ns: -4 ms to +100 ms Timebases 1 us to 10 ms: ±4000 divisions Timebases 20 ms to 3600 s: -40 s to +100 s
Trigger delay Resolution 0.02 divisions
Pulse Mode OperationAutomatic Measurements
Pulse width Pulse rise-timePulse fall-time Pulse periodPulse repetition frequency Pulse duty cyclePulse off-time Peak powerPulse“on”power Pulseovershoot(dBor%)waveform Average power Top level power (ieee spec)Bottom level power (ieee spec) edge delayedge skew (2 channel instruments only)
Marker MeasurementsMarkers (vertical cursors) Settable in time relative to the
trigger position
Markers independently Average, minimum, peak power at a single time offset
Pair of Markers Average, minimum, peak power over the interval between mark-ers, power ratio between markers
Acquisition Mode discontinuous triggered sample acquisition
Trace display Power versus time swept trace (rolled trace for slow time bases)
TraceAveraging 1to16384samplespersweepdatapoint,exponential

6
Modulated Mode OperationAutomatic Measurements
Average power Peak power Minimum power Peak to Average ratio dynamic range
SignalFiltering “Slidingwindow”filter;0.002to16.0seconds(fixed)orauto-filter
Acquisition Mode continuous (un-triggered) sample acquisition
Trace display Power versus time rolled trace
channel Math Ratio, sum (power sensors) or difference (voltage sensors) between channels or between a channel and a reference measurement
Statistical Mode OperationAcquisition Mode continuous sample acquisition
SamplingRate Configurationdependent
NumberofHistogramBins 16,384
Bin Power Resolution <0.02 dB (statistical measurements)
limit count Adjustable, 2 – 4096 MSamples
Terminal Action Stop, flush and or decimate
graph Presentation normalized ccdF trace (relativetomaximumpower)
horizontal Scale 0.1 to 5 dB/div
horizontal offset ±50.00 dBr
VerticalAxis 0.0001to100%(Log,6decades)
TextMeasurementsAverage, Peak and Minimum absolute power, Peak-to-Average and dynamic Range ratios ccdF table (Peak/Average ratios at decade-spaced % ccdF intervals)
cursor Measurements Peak-to-Averageratioatspecified%CCDF %CCDFatspecifiedPeak-to-Averageratio
Status display Total acquisition time (MM:SS)Total acquired Samples
Field ParameterMeasurements, settings, parameters & channel math that can be displayed (User selectable)
chan Frequency vertical Scale vertical center dB offset SensorTemp AvgCWPower MaxPower MinPowerPeak/Avg DynamicRange MarkerAvg MarkerMaxMarker Pk/Avg Marker1 level Marker2 level Marker delta MarkerMaxAvg MarkerMinAvg Marker1Min Marker1MaxMarker2Min Marker2Max MarkerRatio MarkRevRatio Mark Rev delta ch1-ch2 ch2-ch1ch1+ch2 ch1/ch2 ch2/ch1 Reference 1Reference 2 ch1/Ref1 ch1-Ref1 ch2+Ref1 ch2/Ref2 ch2-Ref2 ch2+Ref2
Calibration Sourceinternal calibrator
operating Modes off, on cw
Frequency 50.025 Mhz ± 0.1%
level Range -60 to +20 dBm
Resolution 0.1 dB
RF connector Type n
Source vSwR 1.05 (reflectioncoefficient=0.024)
Accuracy, 0c to 20c, niST traceable0dBm ±0.055dB(1.27%) +20to-39dBm ±0.075dB(1.74%) -40 to -60 dBm ±0.105 dB (2.45%)
Auto-calibration Automatically generated linearity calibration data for peak power sensors
Measurement Setup / Storage25completeuserdefinedsettings(save&recall)Presets
default gSM edge nAdcBluetooth cdmaone w-cdMA cdMA2000iDEN RADAR MCPA WiFi802.11a802.11b/g 1xEV-DO 1xEV-DV TD-SCDMA dvB hiperlAn2
External InterfacesRemote control
gPiB ComplieswithIEEE-488.1andSCPIversion1993.ImplementsAH1,Sh1, T6, le0, SR1, Rl1, PP0, dc1, dT1, c0, and e1.
lAn TcP/iP ethernet Programmable interfaces
USB “USBDevice”,Type-Bconnector
Multi i/o Bnc connector
user selectable Status, trigger, alarm or voltage output
Range 0 to 10 v (Analog unipolar) -10 v to +10 v (Analog bipolar) 0 or 5 v (logic)
Accuracy ±200 mv (±100 mv typical)
linearity 0.1% typical
VGAOut/ExtCalHDB-15connector,videooutput(320x240)forVGAcompatibleanalogRGBvideomonitororexternalcalibratorcontrolinterfaceforModel 2530 calibrator

7
Physical And Environmental CharacteristicsCaseDimensions 8.4Wx3.5Hx13.5Dinches
(21.3x8.9x34.3cm), half-rack width, 2u height
Weight 7.7lbs(3.5kg)
PowerRequirements 90to260VAC,47to60Hz 90to135VAC,47to400Hz 50W(70VA)
operating Temperature 0 to 50 deg c (32 F to 122 F)
StorageTemperature -40to+75degC(-40Fto167F)
ventilation Thermostatically controlled fan
Humidity 95%maximum,non-condensing
Altitude operation up to 15,000 feet (4575m)
Shock withstands ±5 g, 11 ms impulse inX,Y,andZaxes,asperEN60068-2-27
vibration withstands 2 g sine, 1.25 g ran-dom,asperEN60068-2-6andEN60068-2-64
Other CharacteristicsDisplay 4.0”DiagonalTFTcolorLCD,
320x240pixels,CCFLbacklight
Keyboard 27Keyconductiverubber
Main computer 32-bit Floating Point embedded processor
dSP 32-bit Floating Point dSP
Battery user-replaceable BR2325 lithium coin cell (alkaline cells optional), typical life: >10 years (lithium)
Regulatory CategoriesFull ce compliance with the following european union directives and standards
low voltage directive 2006/95/ec en 60950-1:2002 for safety
ElectromagneticCompatibilityDirective(EMC)2004/108/EC EN61326:1997+A1:1998+A2:2001+A3:2003
RohS directive 2002/95/ec for material safety
ManufacturedtotheintentofMIL-T28800E,TypeIII,Class5,StyleE
Sensors / Voltage Probes
Peak PowerModel Frequency Range Dynamic Range Rise Time (Bandwidth)
57006 0.05to6.0GHz -50to+20dBm <7ns(70MHz)
59318 0.05to18.0GHz -24to+20dBm <10ns(50MHz)
57518 0.05to18.0GHz -40to+20dBm <100ns(6MHz)
59340 0.05 to 40.0 ghz -24 to +20 dBm <10 ns (50 Mhz)
57540 0.05to40.0GHz -40to+20dBm <100ns(6MHz)
CW PowerWide Dynamic Range
Model Frequency Range Dynamic Range
51071A 10MHzto26.5GHz -70to+20dBm
51072A 30MHzto40GHz -70to+20dBm
51075A 500kHzto18GHz -70to+20dBm
51077A 500kHzto18GHz -60to+30dBm
51079A 500kHzto18GHz -50to+40dBm
ThermocoupleModel Frequency Range Dynamic Range
51100(9E) 10MHzto18GHz -20to+20dBm
51200 10MHzto18GHz 0to+37dBm
Special PurposeModel Frequency Range Dynamic Range
51011(EMC) 10kHzto8GHz -60to+20dBm(DCcoupled)
51011 (4B) 100 khz to 12.4 ghz -60 to +20 dBm
51013(4E) 100kHzto18GHz -60to+20dBm
51015(5E) 100kHzto18GHz -50to+30dBm
51033(6E) 100kHzto18GHz -40to+33dBm
51078 100kHzto18GHz -20to+37dBm
Diode AverageModel Frequency Range Dynamic Range
51085 500kHzto18GHz -30to+20dBm
For51085PeakPower-1kWpeak,5μspulsewidth,0.25%dutycycle
For51085CWPower-5W(+37dBm)averageto25°Cambienttemperature,deratedlinearlyto
2W(+33dBm)at85°C
Voltage Probes95206302A RF-VoltageProbeKit
10 khz - 1.2 ghz
95206402A LowFrequencyVoltageProbeKit10 hz - 100 Mhz
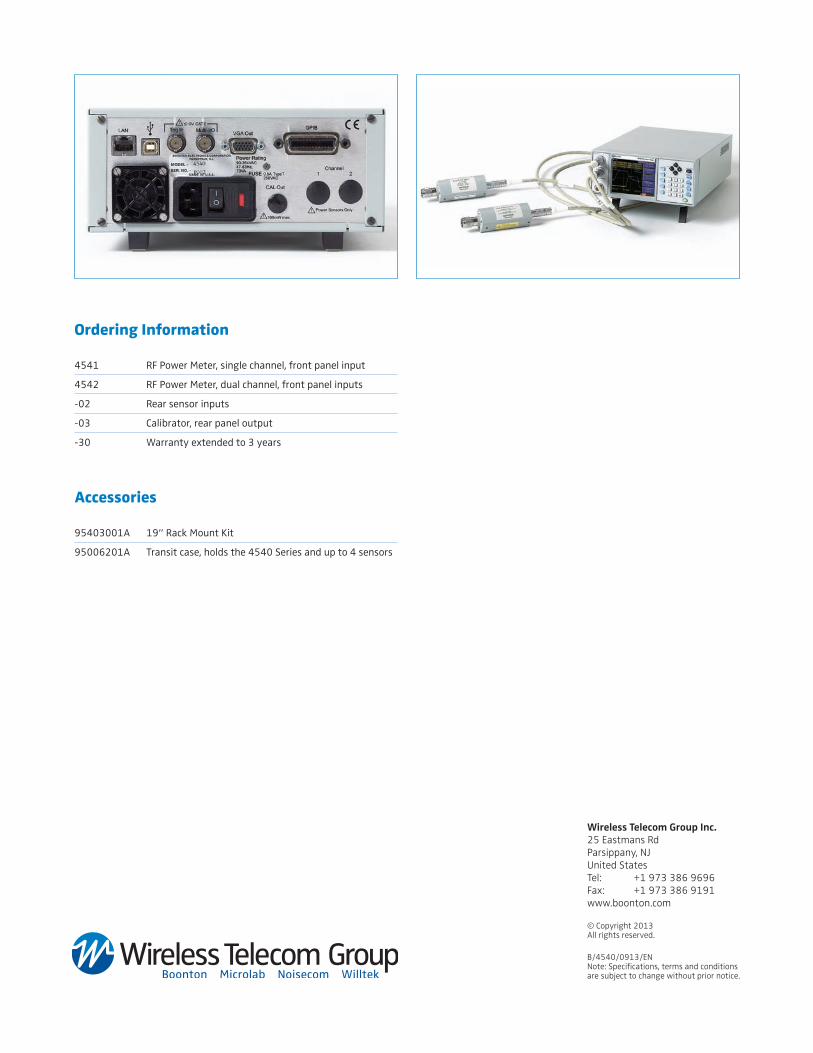
Ordering Information
4541 RF Power Meter, single channel, front panel input
4542 RF Power Meter, dual channel, front panel inputs
-02 Rear sensor inputs
-03 calibrator, rear panel output
-30 Warrantyextendedto3years
Accessories
95403001A 19”RackMountKit
95006201A Transit case, holds the 4540 Series and up to 4 sensors
Wireless Telecom Group Inc. 25 Eastmans Rd Parsippany, NJ United States Tel: +1 973 386 9696 Fax: +1 973 386 9191 www.boonton.com
© Copyright 2013 All rights reserved.
B/4540/0913/EN Note: Specifications, terms and conditions are subject to change without prior notice.