aca unit 1& 2
TRANSCRIPT
8/6/2019 ACA unit 1& 2
http://slidepdf.com/reader/full/aca-unit-1-2 1/30
1
FUNDAMENTALS OF COMPUTER DESIGN
Introduction
Today’s desktop computers (less than $500 cost) are having more performance,larger memory and storage than a computer bought in 1085 for 1 million dollar. Highestperformance microprocessors of today outperform Supercomputers of less than 10 yearsago. The rapid improvement has come both from advances in the technology used tobuild computers and innovations made in the computer design or in other words, theimprovement made in the computers can be attributed to innovations of technology andarchitecture design.
During the first 25 years of electronic computers, both forces made a majorcontribution, delivering performance improvement of about 25% per year.Microprocessors were evolved during late 1970s and their ability along withimprovements made in the Integrated Circuit (IC) technology contributed to 35%
performance growth per year.The virtual elimination of assembly language programming reduced the need for
object-code compatibility. The creation of standardized vendor-independent operatingsystem lowered the cost and risk of bringing out a new architecture.In the yearly 1980s, the Reduced Instruction Set Computer (RISC) based machinesfocused the attention of designers on two critical performance techniques, theexploitation Instruction Level Parallelism (ILP) and the use of caches. The figure 1.1shows the growth in processor performance since the mid 1980s. The graph plotsperformance relative to the VAX-11/780 as measured by the SPECint benchmarks. Fromthe figure it is clear that architectural and organizational enhancements led to 16 years of sustained growth in performance at an annual rate of over 50%.
Since 2002, processor performance improvement has dropped to about 20% per year dueto the following hurdles:
• Maximum power dissipation of air-cooled chips
• Little ILP left to exploit efficiently
• Limitations laid by memory latency
The hurdles signals historic switch from relying solely on ILP to Thread LevelParallelism (TLP) and Data Level Parallelism (DLP).

8/6/2019 ACA unit 1& 2
http://slidepdf.com/reader/full/aca-unit-1-2 2/30
2
Figure 1.1 Growth in processor performance since 1980s
Classes of Computers
The evolution of various classes of computers:1960: Large Main frames (Millions of $ )
(Applications: Business Data processing, large Scientific computing)1970: Minicomputers (Scientific laboratories, Time sharing concepts)1980: Desktop Computers (µPs) in the form of Personal computers and workstations.
(Larger Memory, more computing power, Replaced Time sharing systems)
1990: Emergence of Internet and WWW, PDAs, emergence of high performance digitalconsumer electronics2000: Cell phonesThese changes in computer use have led to three different computing classes each
characterized by different applications, requirements and computing technologies.

8/6/2019 ACA unit 1& 2
http://slidepdf.com/reader/full/aca-unit-1-2 3/30
3
Desktop computing
The first and still the largest market in dollar terms is desktop computing. Desktopcomputing system cost range from $ 500 (low end) to $ 5000 (high-end configuration).Throughout this range in price, the desktop market tends to drive to optimize price-
performance. The performance concerned is compute performance and graphicsperformance. The combination of performance and price are the driving factors to thecustomers and the computer designer. Hence, the newest, high performance and costeffective processor often appears first in desktop computers.
Servers:
Servers provide large-scale and reliable computing and file services and are mainlyused in the large-scale enterprise computing and web based services. The three importantcharacteristics of servers are:
• Dependability: Severs must operate 24x7 hours a week. Failure of server system
is far more catastrophic than a failure of desktop. Enterprise will lose revenue if the server is unavailable.
• Scalability: as the business grows, the server may have to provide morefunctionality/ services. Thus ability to scale up the computing capacity, memory,storage and I/O bandwidth is crucial.
• Throughput: transactions completed per minute or web pages served per secondare crucial for servers.
Embedded Computers
Simple embedded microprocessors are seen in washing machines, printers,
network switches, handheld devices such as cell phones, smart cards video game devicesetc. embedded computers have the widest spread of processing power and cost. Theprimary goal is often meeting the performance need at a minimum price rather thanachieving higher performance at a higher price. The other two characteristic requirementsare to minimize the memory and power.
In many embedded applications, the memory can be substantial portion of thesystems cost and it is very important to optimize the memory size in such cases. Theapplication is expected to fit totally in the memory on the processor chip or off chipmemory. The importance of memory size translates to an emphasis on code size which isdictated by the application. Larger memory consumes more power. All these aspects areconsidered while choosing or designing processor for the embedded applications.
Defining Computer ArchitectureThe computer designer has to ascertain the attributes that are important for a newcomputer and design the system to maximize the performance while staying within cost,power and availability constraints. The task has few important aspects such as InstructionSet design, Functional organization, Logic design and implementation.Instruction Set Architecture (ISA)
ISA refers to the actual programmer visible Instruction set. The ISA serves asboundary between the software and hardware. The seven dimensions of the ISA are:

8/6/2019 ACA unit 1& 2
http://slidepdf.com/reader/full/aca-unit-1-2 4/30
4
i) Class of ISA: Nearly all ISAs today are classified as General-Purpose-Register architectures. The operands are either Registers or Memory locations.The two popular versions of this class are:Register-Memory ISAs : ISA of 80x86, can access memory as part of manyinstructions.
Load-Store ISA Eg. ISA of MIPS, can access memory only with Load orStore instructions.ii) Memory addressing: Byte addressing scheme is most widely used in all
desktop and server computers. Both 80x86 and MIPS use byte addressing.Incase of MIPS the object must be aligned. An access to an object of s byte atbyte address A is aligned if A mod s =0. 80x86 does not require alignment.Accesses are faster if operands are aligned.
iii) Addressing modes:
Specify the address of a M object apart from register and constant operands.
MIPS Addressing modes:
• Register mode addressing
• Immediate mode addressing• Displacement mode addressing
80x86 in addition to the above addressing modes supports the additionalmodes of addressing:
i. Register Indirectii. Indexediii. Based with Scaled index
iv) Types and sizes of operands:
MIPS and x86 support:
• 8 bit (ASCII character), 16 bit(Unicode character)
• 32 bit (Integer/word)• 64 bit (long integer/ Double word)
• 32 bit (IEEE-754 floating point)
• 64 bit (Double precision floating point)
• 80x86 also supports 80 bit floating point operand.(extended doubleprecision)
v) Operations: The general category of operations are:o Data Transfero Arithmetic operationso Logic operationso Control operationso MIPS ISA: simple & easy to implemento x86 ISA: richer & larger set of operations
vi) Control flow instructions:
All ISAs support:Conditional & Unconditional Branches
Procedure Calls & Returns

8/6/2019 ACA unit 1& 2
http://slidepdf.com/reader/full/aca-unit-1-2 5/30
5
MIPS 80x86
• Conditional Branches tests content of Register Condition code bits• Procedure Call JAL CALLF• Return Address in a R Stack in Mvii) Encoding an ISA
Fixed Length ISA Variable Length ISA
MIPS 32 Bit long 80x86 (1-18 bytes)Simplifies decoding Takes less space
Number of Registers and number of Addressing modes have significantimpact on the length of instruction as the register field and addressing modefield can appear many times in a single instruction.
Trends in Technology
The designer must be aware of the following rapid changes in implementationtechnology.
• Integrated Circuit (IC) Logic technology
• Memory technology (semiconductor DRAM technology)
• Storage or magnetic disk technology
• Network technologyIC Logic technology:
Transistor density increases by about 35%per year. Increase in die sizecorresponds to about 10% to 20% per year. The combined effect is a growth rate intransistor count on a chip of about 40% to 55% per year.Semiconductor DRAM technology: capacity increases by about 40% per year.
Storage Technology:
Before 1990: the storage density increased by about 30% per year.After 1990: the storage density increased by about 60% per year.Disks are still 50 to 100 times cheaper per bit than DRAM.
Network Technology: Network performance depends both on the performance of the switches and on
the performance of the transmission system.Although the technology improves continuously, the impact of these improvements canbe in discrete leaps.
Performance trends: Bandwidth or throughput is the total amount of work done in giventime. Latency or response time is the time between the start and the completion of anevent. (for eg. Millisecond for disk access)

8/6/2019 ACA unit 1& 2
http://slidepdf.com/reader/full/aca-unit-1-2 6/30
6
A simple rule of thumb is that bandwidth grows by at least the square of theimprovement in latency. Computer designers should make plans accordingly.
Scaling of Transistor Performance & Wires
• IC Processes are characterizes by the feature sizes.
• Feature sizes decreased from 10 microns(1971) to 0.09 microns(2006)
• Feature sizes shrink, devices shrink quadratically.
• Shrink in vertical direction makes the operating voltage of the transistor to reduce.
• Transistor performance improves linearly with decreasing feature size.
• Transistor count improves quadratically with a linear improvement in Transistorperformance.
• !!! Wire delay scales poorly compared to Transistor performance.
• Feature sizes shrink, wires get shorter.
• Signal delay for a wire increases in proportion to the product of Resistance andCapacitance.
Trends in Power in Integrated Circuits
For CMOS chips, the dominant source of energy consumption is due to switchingtransistor, also called as Dynamic power and is given by the following equation.
1
10
100
1000
10000
1 10 100
Relative Latency Improvement
Relative
BW
Improve
ment
Processor
Memory
Network
Disk
(Latency improvement
= Bandwidth improvement)
CPU high,
Memory low(“Memory Wall”)

8/6/2019 ACA unit 1& 2
http://slidepdf.com/reader/full/aca-unit-1-2 7/30
7
Power dynamic= (1/2)*Capacitive load* Voltage2 * Frequency switched
•For mobile devices, energy is the better metric
Energydynamic = Capacitive load x Voltage2
•For a fixed task, slowing clock rate (frequency switched) reduces power, but not energy•Capacitive load a function of number of transistors connected to output and technology,
which determines capacitance of wires and transistors
•Dropping voltage helps both, so went from 5V down to 1V•To save energy & dynamic power, most CPUs now turn off clock of inactive modules
•Distributing the power, removing the heat and preventing hot spots have becomeincreasingly difficult challenges.
• The leakage current flows even when a transistor is off. Therefore static power isequally important.
Power static= Current static * Voltage
•Leakage current increases in processors with smaller transistor sizes•Increasing the number of transistors increases power even if they are turned off •In 2006, goal for leakage is 25% of total power consumption; high performance designsat 40%•Very low power systems even gate voltage to inactive modules to control loss due toleakage
Trends in Cost
• The underlying principle that drives the cost down is the learning curve-manufacturing costs decrease over time.
• Volume is a second key factor in determining cost. Volume decreases cost since itincreases purchasing manufacturing efficiency. As a rule of thumb, the cost decreasesabout 10% for each doubling of volume.
• Cost of an Integrated Circuit
Although the cost of ICs have dropped exponentially, the basic process of siliconmanufacture is unchanged. A wafer is still tested and chopped into dies that arepackaged.
Cost of IC = Cost of [die+ testing die+ Packaging and final test] / (Final test yoeld)
Cost of die = Cost of wafer/ (Die per wafer x Die yield)

8/6/2019 ACA unit 1& 2
http://slidepdf.com/reader/full/aca-unit-1-2 8/30
8
The number of dies per wafer is approximately the area of the wafer divided by the areaof the die.
Die per wafer = [π * (Wafer Dia/2)2/Die area]-[π* wafer dia/ √(2*Die area)]
The first term is the ratio of wafer area to die area and the second term compensates forthe rectangular dies near the periphery of round wafers(as shown in figure).
Figure 1.2 Close view of 300 mm wafer
Dependability:
The Infrastructure providers offer Service Level Agreement (SLA) or ServiceLevel Objectives (SLO) to guarantee that their networking or power services would bedependable.
• Systems alternate between 2 states of service with respect to an SLA:
1. Service accomplishment, where the service is delivered as specified in SLA
2. Service interruption, where the delivered service is different from the SLA
• Failure = transition from state 1 to state 2
• Restoration = transition from state 2 to state 1

8/6/2019 ACA unit 1& 2
http://slidepdf.com/reader/full/aca-unit-1-2 9/30
9
The two main measures of Dependability are Module Reliability and ModuleAvailability. Module reliability is a measure of continuous service accomplishment (ortime to failure) from a reference initial instant.
1. Mean Time To Failure ( MTTF ) measures Reliability
2. Failures In Time (FIT ) = 1/MTTF, the rate of failures
• Traditionally reported as failures per billion hours of operation
• Mean Time To Repair ( MTTR) measures Service Interruption
– Mean Time Between Failures ( MTBF ) = MTTF+MTTR
• Module availability measures service as alternate between the 2 states of accomplishment and interruption (number between 0 and 1, e.g. 0.9)
• Module availability = MTTF / ( MTTF + MTTR)
Example:
Calculate Failures in Time(FIT) and MTTF for the following system comprising of:
10 disks (1Million hour MTTF per disk), 1 disk controller (0.5Million hour MTTF) and 1power supply (0.2Million hour MTTF).
Performance:
The Execution time or Response time is defined as the time between the start andcompletion of an event. The total amount of work done in a given time is defined as theThroughput .
The Administrator of a data center may be interested in increasing theThroughput . The computer user may be interested in reducing the Response time.
Computer user says that computer is faster when a program runs in less time.
hours
MTTF
FIT
eFailureRat
000,59
000,17 / 000,000,000,1
000,17
000,000,1 / 17
000,000,1 / 5210
000,200 / 1000,500 / 1)000,000,1 / 1(10
≈
=
=
=
++=
++×=

8/6/2019 ACA unit 1& 2
http://slidepdf.com/reader/full/aca-unit-1-2 10/30
10
1
Performance = ----------------------------Execution Time (X)
The phrase “X is faster than Y” is used to mean that the response time or execution time
is lower on X than Y for the given task. “X is n times faster than Y” means
Execution Timey = n* Execution timex
Performancex = n* Perfromancey
The routinely executed programs are the best candidates for evaluating the performanceof the new computers. To evaluate new system the user would simply compare theexecution time of their workloads.
Benchmarks
The real applications are the best choice of benchmarks to evaluate the performance.However, for many of the cases, the workloads will not be known at the time of evaluation. Hence, the benchmark program which resemble the real applications arechosen. The three types of benchmarks are:
• KERNELS, which are small, key pieces of real applications;
• Toy Programs: which are 100 line programs from beginning programmingassignments, such Quicksort etc.,
• Synthetic Benchmarks: Fake programs invented to try to match the profile andbehavior of real applications such as Dhrystone.
To make the process of evaluation a fair justice, the following points are to be followed.
• Source code modifications are not allowed.
• Source code modifications are allowed, but are essentially impossible.
• Source code modifications are allowed, as long as the modified version produces thesame output.
• To increase predictability, collections of benchmark applications, calledbenchmark suites, are popular
•
SPECCPU: popular desktop benchmark suite given by Standard PerformanceEvaluation committee (SPEC)– CPU only, split between integer and floating point programs– SPECint2000 has 12 integer, SPECfp2000 has 14 integer programs– SPECCPU2006 announced in Spring 2006.– SPECSFS (NFS file server) and SPECWeb (WebServer) added as server
benchmarks

8/6/2019 ACA unit 1& 2
http://slidepdf.com/reader/full/aca-unit-1-2 11/30
11
• Transaction Processing Council measures server performance and cost-performance for databases
– TPC-C Complex query for Online Transaction Processing– TPC-H models ad hoc decision support– TPC-W a transactional web benchmark
–
TPC-App application server and web services benchmark
• SPEC Ratio: Normalize execution times to reference computer, yielding a ratioproportional to performance = time on reference computer/time on computerbeing rated
• If program SPECRatio on Computer A is 1.25 times bigger than Computer B,then
• Note : when comparing 2 computers as a ratio, execution times on the referencecomputer drop out, so choice of reference computer is irrelevant.
Quantitative Principles of Computer Design
While designing the computer, the advantage of the following points can beexploited to enhance the performance.* Parallelism: is one of most important methods for improving performance. - One of the simplest ways to do this is through pipelining ie, to over lap theinstruction
Execution to reduce the total time to complete an instruction sequence.
- Parallelism can also be exploited at the level of detailed digital design.- Set- associative caches use multiple banks of memory that are typically searched inparallel. Carry
look ahead which uses parallelism to speed the process of computing.* Principle of locality: program tends to reuse data and instructions they have usedrecently. The rule of thumb is that program spends 90 % of its execution time in only10% of the code. With reasonable good accuracy, prediction can be made to find what
B
A
A
B
B
reference
A
reference
B
A
ePerformanc
ePerformanc
ime ExecutionT
ime ExecutionT
ime ExecutionT
ime ExecutionT
ime ExecutionT
ime ExecutionT
SPECRatio
SPECRatio
==
==
25.1

8/6/2019 ACA unit 1& 2
http://slidepdf.com/reader/full/aca-unit-1-2 12/30
12
instruction and data the program will use in the near future based on its accesses in therecent past.* Focus on the common case while making a design trade off, favor the frequent caseover the infrequent case. This principle applies when determining how to spendresources, since the impact of the improvement is higher if the occurrence is frequent.
Amdahl’s Law: Amdahl’s law is used to find the performance gain that can be obtainedby improving some portion or a functional unit of a computer Amdahl’s law defines thespeedup that can be gained by using a particular feature.Speedup is the ratio of performance for entire task without using the enhancement whenpossible to the performance for entire task without using the enhancement. Executiontime is the reciprocal of performance. Alternatively, speedup is defined as thee ratio of execution time for entire task without using the enhancement to the execution time forentair task using the enhancement when possible.Speedup from some enhancement depends an two factors:
i. The fraction of the computation time in the original computer that can be
converted totake advantage of the enhancement. Fraction enhanced is always less than orequal to
Example: If 15 seconds of the execution time of a program that takes 50seconds in
total can use an enhancement, the fraction is 15/50 or 0.3
ii. The improvement gained by the enhanced execution mode; ie how muchfaster the task
would run if the enhanced mode were used for the entire program. Speedupenhanced
is the time of the original mode over the time of theenhanced
mode and isalways
greater then 1.
Execution time new = Execution time old X[ (1- Fraction enhanced) + Fraction enhanced ] Speed up enhanced
Speedup overall = Execution time old
Execution time new
The Processor performance Equation:
Processor is connected with a clock running at constant rate. These discrete time events
are called clock ticks or clock cycle.
CPU time for a program can be evaluated:

8/6/2019 ACA unit 1& 2
http://slidepdf.com/reader/full/aca-unit-1-2 13/30
13
CPU time = CPU clock cycles for a program X clock cycle time
CPU time = CPU Clock cycles for a programClock rate
Using the number of clock cycle and the Instruction count (IC), it is possible to determine
the average number of clock cycles per instruction (CPI). The reciprocal of CPI gives
Instruction per clock (IPC)
CPI= CPU clock cycle for a programInstruction count
CPU time = IC X CPI X Clock cycle time
CPU time = Secondsprogram
= Instructions X Clock cycles X SecondsProgram Instruction clock cycle
Processor performance depends on IC, CPI and clock rate or clock cycle. There 3
parameters are dependent on the following basic technologies.
Clock Cycle time – H/W technology and organization
CPI- organization and ISA
IC- ISA and compiler – technology
Example:
A System contains Floating point (FP) and Floating Point Square Root (FPSQR) unit.
FPSQR is responsible for 20% of the execution time. One proposal is to enhance the
FPSQR hardware and speedup this operation by a factor of 15 second alternate is just to
try to make all FP instructions run faster by a factor of 1.6 times faster with the same
effort as required for the fast FPSQR, compare the two design alternative

8/6/2019 ACA unit 1& 2
http://slidepdf.com/reader/full/aca-unit-1-2 14/30
14
Option 1
SpeedupFPSQR = 1 = 1.2295
(1-0.2) + (0.2/15)
Option 2
Speedup FP = 1 = 1.2307(1-0.5) + (0.5/1.6)
Option 2 is relatively better.

8/6/2019 ACA unit 1& 2
http://slidepdf.com/reader/full/aca-unit-1-2 15/30
15
Chapter 2 Pipeline
Pipeline is an implementation technique that exploits parallelism among the
instructions in a sequential instruction stream. Pipeline allows to overlapping theexecution of multiple instructions.
A Pipeline is like an assembly line each step or pipeline stage completes a part of
an instructions. Each stage of the pipeline will be operating an a separate instruction.
Instructions enter at one end progress through the stage and exit at the other end. If the
stages are perfectly balance.
(assuming ideal conditions), then the time per instruction on the pipeline processor is
given by the ratio:
Time per instruction on unpipelined machineNumber of Pipeline stages
Under these conditions, the speedup from pipelining is equal to the number of stage
pipeline. In practice, the pipeline stages are not perfectly balanced and pipeline does
involve some overhead. Therefore, the speedup will be always then practically less than
the number of stages of the pipeline.
Pipeline yields a reduction in the average execution time per instruction. If the
processor is assumed to take one (long) clock cycle per instruction, then pipelining
decrease the clock cycle time. If the processor is assumed to take multiple CPI, then
pipelining will aid to reduce the CPI.
A Simple implementation of a RISC instruction set
Instruction set of implementation in RISC takes at most 5 cycles without pipelining.The 5 clock cycles are:
1. Instruction fetch (IF) cycle:
Send the content of program count (PC) to memory and fetch the currentinstruction from memory to update the PC.
New PC [PC] + 4; Since each instruction is 4 bytes

8/6/2019 ACA unit 1& 2
http://slidepdf.com/reader/full/aca-unit-1-2 16/30
16
2. Instruction decode / Register fetch cycle (ID):
Decode the instruction and access the register file. Decoding is done in parallel with
reading registers, which is possible because the register specifies are at a fixed location in
a RISC architecture. This corresponds to fixed field decoding. In addition it involves:- Perform equality test on the register as they are read for a possible branch.
- Sign-extend the offset field of the instruction in case it is needed.
- Compute the possible branch target address.
3. Execution / Effective address Cycle (EXE)
The ALU operates on the operands prepared in the previous cycle and performs
one of the following function defending on the instruction type.* Memory reference: Effective address [Base Register] + offset
* Register- Register ALU instruction: ALU performs the operation specified in
the instruction using the values read from the register file.
* Register- Immediate ALU instruction: ALU performs the operation specified in
the instruction using the first value read from the register file and that sign extended
immediate.
4. Memory access (MEM)
For a load instruction, using effective address the memory is read. For a store
instruction memory writes the data from the 2nd
register read using effective address.
5. Write back cycle (WB)
Write the result in to the register file, whether it comes from memory system (for a
LOAD instruction) or from the ALU.
Five stage Pipeline for a RISC processor
Each instruction taken at most 5 clock cycles for the execution
* Instruction fetch cycle (IF)
* Instruction decode / register fetch cycle (ID)
* Execution / Effective address cycle (EX)
* Memory access (MEM)
* Write back cycle (WB)

8/6/2019 ACA unit 1& 2
http://slidepdf.com/reader/full/aca-unit-1-2 17/30
17
The execution of the instruction comprising of the above subtask can be
pipelined. Each of the clock cycles from the previous section becomes a pipe stage – a
cycle in the pipeline. A new instruction can be started on each clock cycle which results
in the execution pattern shown figure 2.1. Though each instruction takes 5 clock cycles
to complete, during each clock cycle the hardware will initiate a new instruction and will
be executing some part of the five different instructions as illustrated in figure 2.1.
.
Instruction# Clock number1 2 3 4 5 6 7 8 9
Instruction i IF ID EXE MEM WB
Instruction I+1 IF ID EXE MEM WB
Instruction I+2 IF ID EXE MEM WB
Instruction I+3 IF ID EXE MEM WB
Instruction I+4 IF ID EXE MEM WB
Figure 2.1 Simple RISC Pipeline. On each clock cycle another instruction fetched
Each stage of the pipeline must be independent of the other stages. Also, two differentoperations can’t be performed with the same data path resource on the same clock. Forexample, a single ALU cannot be used to compute the effective address and perform asubtract operation during the same clock cycle. An adder is to be provided in the stage 1to compute new PC value and an ALU in the stage 3 to perform the arithmetic indicatedin the instruction (See figure 2.2). Conflict should not arise out of overlap of instructionsusing pipeline. In other words, functional unit of each stage need to be independent of other functional unit. There are three observations due to which the risk of conflict is
reduced.• Separate Instruction and data memories at the level of L1 cache eliminates a
conflict for a single memory that would arise between instruction fetch and dataaccess.
• Register file is accessed during two stages namely ID stage WB. Hardware shouldallow to perform maximum two reads one write every clock cycle.
• To start a new instruction every cycle, it is necessary to increment and store thePC every cycle.

8/6/2019 ACA unit 1& 2
http://slidepdf.com/reader/full/aca-unit-1-2 18/30
18
Figure 2.2 Diagram indicating the cycle and functional unit of each stage.
Buffers or registers are introduced between successive stages of the pipeline sothat at the end of a clock cycle the results from one stage are stored into a register (seefigure 2.3). During the next clock cycle, the next stage will use the content of thesebuffers as input. Figure 2.4 visualizes the pipeline activity.
Figure 2.3 Functional units of 5 stage Pipeline. IF/ID is a buffer between IF and ID stage.
Cycle 1 Cycle 2 Cycle 3 Cycle 4 Cycle 5

8/6/2019 ACA unit 1& 2
http://slidepdf.com/reader/full/aca-unit-1-2 19/30
19
Basic Performance issues in Pipelining
Pipelining increases the CPU instruction throughput but, it does not reduce the executiontime of an individual instruction. In fact, the pipelining increases the execution time of each instruction due to overhead in the control of the pipeline. Pipeline overhead arisesfrom the combination of register delays and clock skew. Imbalance among the pipe stagesreduces the performance since the clock can run no faster than the time needed for theslowest pipeline stage.
Figure 2.4 Pipeline activity
Pipeline Hazards
Hazards may cause the pipeline to stall. When an instruction is stalled, all the instructionsissued later than the stalled instructions are also stalled. Instructions issued earlier thanthe stalled instructions will continue in a normal way. No new instructions are fetchedduring the stall.Hazard is situation that prevents the next instruction in the instruction stream fromk executing during its designated clock cycle. Hazards will reduce the pipelineperformance.

8/6/2019 ACA unit 1& 2
http://slidepdf.com/reader/full/aca-unit-1-2 20/30
20
Performance with Pipeline stall
A stall causes the pipeline performance to degrade from ideal performance. Performanceimprovement from pipelining is obtained from:
Speedup = Average instruction time un-pipelinedAverage instruction time pipelined
Speedup = CPI unpipelined * Clock cycle unpipelinedCPI pipelined * Clock cycle pipelined
CPI pipelined = Ideal CPI + Pipeline stall clock cycles per instruction
CPI pipelined = 1 + Pipeline stall clock cycles per instruction
Assume that,i) cycle time overhead of pipeline is ignoredii) stages are balanced
With theses assumptions,Clock cycle unpipelined = clock cycle pipelinedTherefore, Speedup = CPI unpipelined
CPI pipelined
Speedup = CPI unpipelined a1+Pipeline stall cycles per instruction
If all the instructions take the same number of cycles and is equal to the number of pipeline stages or depth of the pipeline, then,
CPI unpipelined = Pipeline depth
Speedup = Pipeline depth a 1+Pipeline stall cycles per instruction
If there are no pipeline stalls,Pipeline stall cycles per instruction = zeroTherefore,Speedup = Depth of the pipeline.
Types of hazard
Three types hazards are:1. Structural hazard2. Data Hazard3. Control Hazard

8/6/2019 ACA unit 1& 2
http://slidepdf.com/reader/full/aca-unit-1-2 21/30
21
Structural hazard
Structural hazard arise from resource conflicts, when the hardware cannot support all
possible combination of instructions simultaneously in overlapped execution. If somecombination of instructions cannot be accommodated because of resource conflicts, theprocessor is said to have structural hazard.Structural hazard will arise when some functional unit is not fully pipelined or whensome resource has not been duplicated enough to allow all combination of instructions inthe pipeline to execute.For example, if memory is shared for data and instruction as a result, when an instructioncontains data memory reference, it will conflict with the instruction reference for a laterinstruction (as shown in figure 2.5a). This will cause hazard and pipeline stalls for 1clock cycle.
Figure 2.5a Load Instruction and instruction 3 are accessing memory in clock
cycle4
8/6/2019 ACA unit 1& 2
http://slidepdf.com/reader/full/aca-unit-1-2 22/30
22
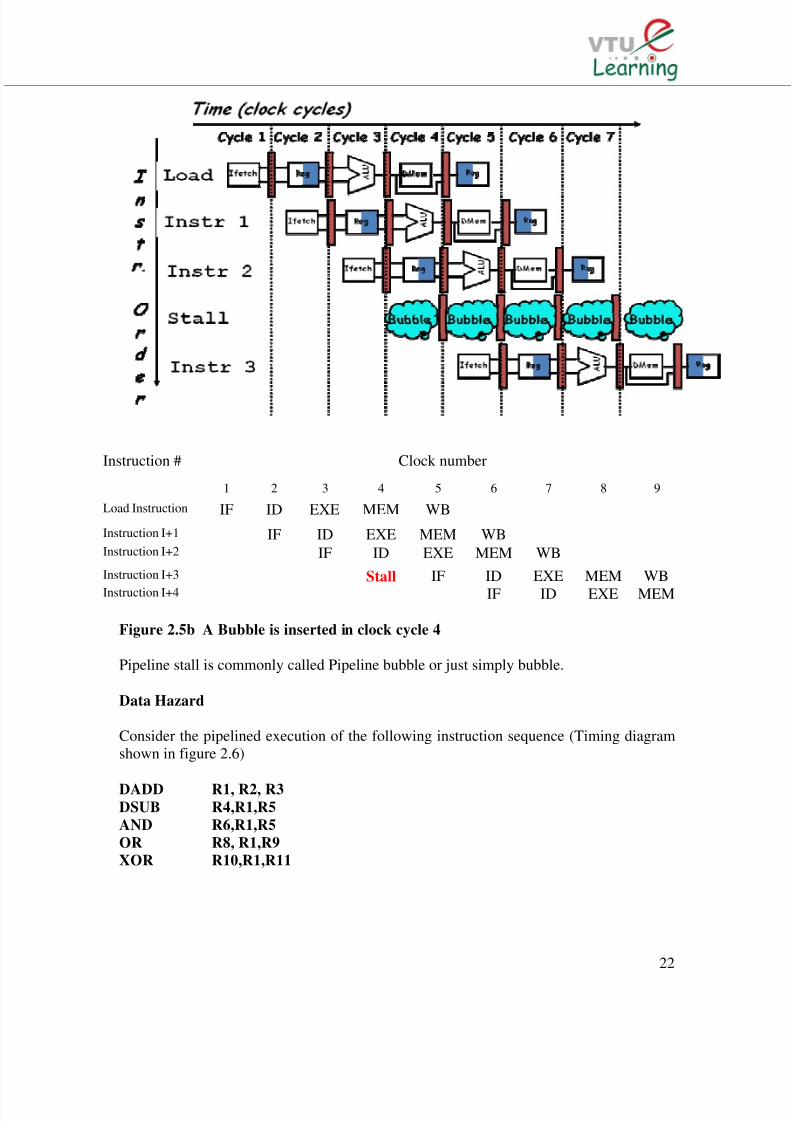
Instruction # Clock number
1 2 3 4 5 6 7 8 9
Load Instruction IF ID EXE MEM WB
Instruction I+1 IF ID EXE MEM WBInstruction I+2 IF ID EXE MEM WB
Instruction I+3 Stall IF ID EXE MEM WBInstruction I+4 IF ID EXE MEM
Figure 2.5b A Bubble is inserted in clock cycle 4
Pipeline stall is commonly called Pipeline bubble or just simply bubble.
Data Hazard
Consider the pipelined execution of the following instruction sequence (Timing diagramshown in figure 2.6)
DADD R1, R2, R3DSUB R4,R1,R5
AND R6,R1,R5
OR R8, R1,R9
XOR R10,R1,R11

8/6/2019 ACA unit 1& 2
http://slidepdf.com/reader/full/aca-unit-1-2 23/30
23
DADD instruction produces the value of R1 in WB stage (Clock cycle 5) but the DSUBinstruction reads the value during its ID stage (clock cycle 3). This problem is called DataHazard.
DSUB may read the wrong value if precautions are not taken. AND instruction will read
the register during clock cycle 4 and will receive the wrong results.
The XOR instruction operates properly, because its register read occurs in clock cycle 6after DADD writes in clock cycle 5. The OR instruction also operates without incurring ahazard because the register file reads are performed in the second half of the cyclewhereas the writes are performed in the first half of the cycle.
Minimizing data hazard by Forwarding
The DADD instruction will produce the value of R! at the end of clock cycle 3. DSUBinstruction requires this value only during the clock cycle 4. If the result can be moved
from the pipeline register where the DADD store it to the point (input of LAU) whereDSUB needs it, then the need for a stall can be avoided. Using a simple hardwaretechnique called Data Forwarding or Bypassing or short circuiting, data can be madeavailable from the output of the ALU to the point where it is required (input of LAU) atthe beginning of immediate next clock cycle.Forwarding works as follows:
i) The output of ALU from EX/MEM and MEM/WB pipeline register is alwaysfeedback to the ALU inputs.
ii) If the Forwarding hardware detects that the previous ALU output serves as thesource for the current ALU operations, control logic selects the forwardedresult as the input rather than the value read from the register file.
Forwarded results are required not only from the immediate previous instruction, but alsofrom an instruction that started 2 cycles earlier. The result of ith instructionIs required to be forwarded to (i+2)
thinstruction also.
Forwarding can be generalized to include passing a result directly to the functional unitthat requires it.
Data Hazard requiring stalls
LD R1, 0(R2)DADD R3, R1, R4AND R5, R1, R6OR R7, R1, R8
The pipelined data path for these instructions is shown in the timing diagram (figure 2.7)
8/6/2019 ACA unit 1& 2
http://slidepdf.com/reader/full/aca-unit-1-2 24/30
24
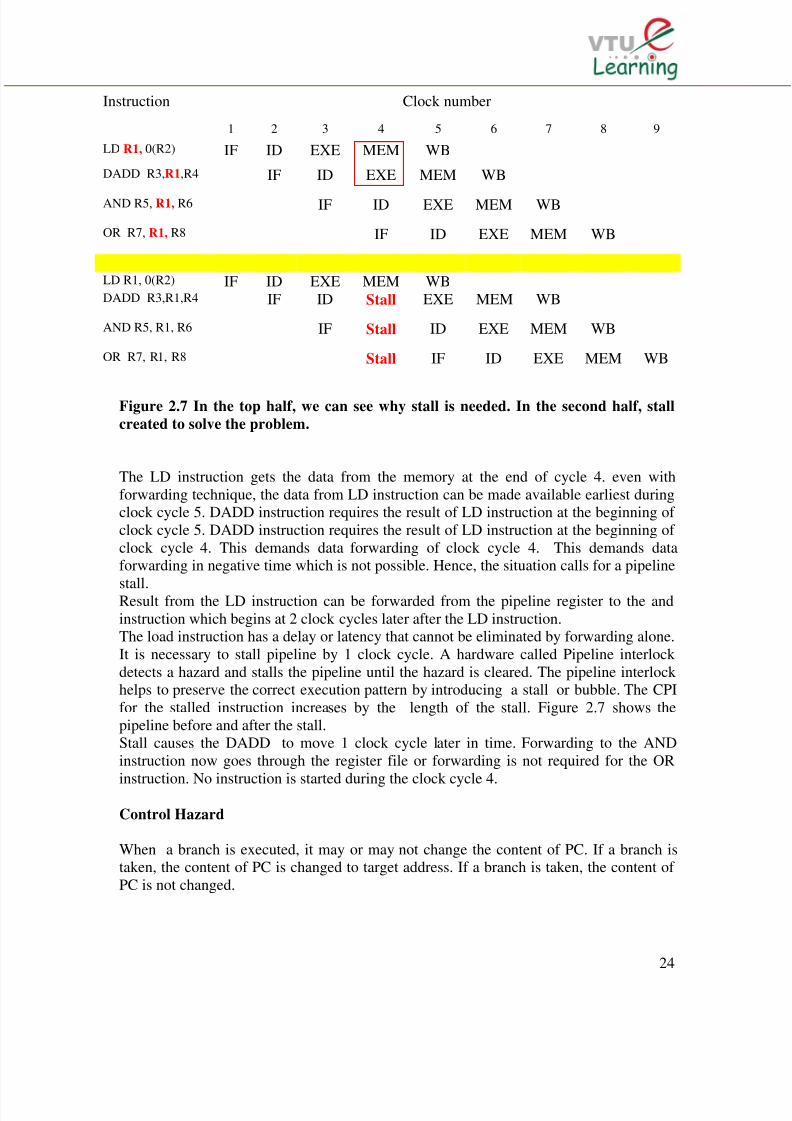
Instruction Clock number
1 2 3 4 5 6 7 8 9
LD R1, 0(R2) IF ID EXE MEM WB
DADD R3,R1,R4 IF ID EXE MEM WB
AND R5, R1, R6 IF ID EXE MEM WB
OR R7, R1, R8 IF ID EXE MEM WB
LD R1, 0(R2) IF ID EXE MEM WBDADD R3,R1,R4 IF ID Stall EXE MEM WB
AND R5, R1, R6 IF Stall ID EXE MEM WB
OR R7, R1, R8 Stall IF ID EXE MEM WB
Figure 2.7 In the top half, we can see why stall is needed. In the second half, stall
created to solve the problem.
The LD instruction gets the data from the memory at the end of cycle 4. even withforwarding technique, the data from LD instruction can be made available earliest duringclock cycle 5. DADD instruction requires the result of LD instruction at the beginning of clock cycle 5. DADD instruction requires the result of LD instruction at the beginning of clock cycle 4. This demands data forwarding of clock cycle 4. This demands dataforwarding in negative time which is not possible. Hence, the situation calls for a pipeline
stall.Result from the LD instruction can be forwarded from the pipeline register to the andinstruction which begins at 2 clock cycles later after the LD instruction.The load instruction has a delay or latency that cannot be eliminated by forwarding alone.It is necessary to stall pipeline by 1 clock cycle. A hardware called Pipeline interlock detects a hazard and stalls the pipeline until the hazard is cleared. The pipeline interlock helps to preserve the correct execution pattern by introducing a stall or bubble. The CPIfor the stalled instruction increases by the length of the stall. Figure 2.7 shows thepipeline before and after the stall.Stall causes the DADD to move 1 clock cycle later in time. Forwarding to the ANDinstruction now goes through the register file or forwarding is not required for the OR
instruction. No instruction is started during the clock cycle 4.
Control Hazard
When a branch is executed, it may or may not change the content of PC. If a branch istaken, the content of PC is changed to target address. If a branch is taken, the content of PC is not changed.

8/6/2019 ACA unit 1& 2
http://slidepdf.com/reader/full/aca-unit-1-2 25/30
25
The simple way of dealing with the branches is to redo the fetch of the instructionfollowing a branch. The first IF cycle is essentially a stall, because, it never performsuseful work.One stall cycle for every branch will yield a performance loss 10% to 30% depending onthe branch frequency.
Reducing the Brach Penalties
There are many methods for dealing with the pipeline stalls caused by branch
delay
1. Freeze or Flush the pipeline, holding or deleting any instructions after the branch
until the branch destination is known. It is a simple scheme and branch penalty is
fixed and cannot be reduced by software
2. Treat every branch as not taken, simply allowing the hardware to continue as if
the branch were not to executed. Care must be taken not to change the processor
state until the branch outcome is known.
Instructions were fetched as if the branch were a normal instruction. If the branch
is taken, it is necessary to turn the fetched instruction in to a no-of instruction and
restart the fetch at the target address. Figure 2.8 shows the timing diagram of both
the situations.
Instruction Clock number
1 2 3 4 5 6 7 8 9
Untaken Branch IF ID EXE MEM WB
Instruction I+1 IF ID EXE MEM WBInstruction I+2 IF ID EXE MEM WB
Instruction I+3 IF ID EXE MEM WBInstruction I+4 IF ID EXE MEM WB
Taken Branch IF ID EXE MEM WBInstruction I+1 IF Idle Idle Idle Idle Idle
Branch Target IF ID EXE MEM WBBranch Target+1 IF ID EXE MEM WBBranch Target+2 IF ID EXE MEM WB
Figure 2.8 The predicted-not-taken scheme and the pipeline sequence when the
branch is untaken (top) and taken (bottom).

8/6/2019 ACA unit 1& 2
http://slidepdf.com/reader/full/aca-unit-1-2 26/30
26
3. Treat every branch as taken: As soon as the branch is decoded and target address
is computed, begin fetching and executing at the target if the branch target is
known before branch outcome, then this scheme gets advantage.
For both predicated taken or predicated not taken scheme, the compiler can
improve performance by organizing the code so that the most frequent path
matches the hardware choice.
4. Delayed branch technique is commonly used in early RISC processors.
In a delayed branch, the execution cycle with a branch delay of one is
Branch instruction
Sequential successor-1
Branch target if taken
The sequential successor is in the branch delay slot and it is executed irrespective of
whether or not the branch is taken. The pipeline behavior with a branch delay is shown in
Figure 2.9. Processor with delayed branch, normally have a single instruction delay.
Compiler has to make the successor instructions valid and useful there are three ways in
which the to delay slot can be filled by the compiler.
Instruction Clock number
1 2 3 4 5 6 7 8 9
Untaken Branch IF ID EXE MEM WB
Branch delayInstruction (i+1)
IF ID EXE MEM WB
Instruction (i+2) IF ID EXE MEM WB
Instruction (i+3) IF ID EXE MEM WBInstruction (i+4) IF ID EXE MEM WB
Taken Branch IF ID EXE MEM WBBranch delayInstruction (i+1) IF ID EXE MEM WBBranch Target IF ID EXE MEM WBBranch Target+1 IF ID EXE MEM WBBranch Target+2 IF ID EXE MEM WB
Figure 2.9 Timing diagram of the pipeline to show the behavior of a delayed branch
is the same whether or not the branch is taken.

8/6/2019 ACA unit 1& 2
http://slidepdf.com/reader/full/aca-unit-1-2 27/30
27
The limitations on delayed branch arise from
i) Restrictions on the instructions that are scheduled in to delay slots.
ii) Ability to predict at compiler time whether a branch is likely to be taken or
not taken.
The delay slot can be filled from choosing an instruction
a) From before the branch instruction
b) From the target address
c) From fall- through path.
The principle of scheduling the branch delay is shown in fig 2.10
Figure 2.10 Scheduling the Branch delay
What makes pipelining hard to implements?Dealing with exceptions: Overlapping of instructions makes it more difficult to know
whether an instruction can safely change the state of the CPU. In a pipelined CPU, an
instruction execution extends over several clock cycles. When this instruction is in
execution, the other instruction may raise exception that may force the CPU to abort the
instruction in the pipeline before they complete.

8/6/2019 ACA unit 1& 2
http://slidepdf.com/reader/full/aca-unit-1-2 28/30
28
Types of exceptions:
The term exception is used to cover the terms interrupt, fault and exception.
I/O device request, page fault, Invoking an OS service from a user program, Integer
arithmetic overflow, memory protection overflow, Hardware malfunctions, Power failure
etc. are the different classes of exception.
Individual events have important characteristics that determine what action is needed
corresponding to that exception.
i) Synchronous versus Asynchronous
If the event occurs at the same place every time the program is executed with the
same data and memory allocation, the event is asynchronous.
Asynchronous events are caused by devices external to the CPU and memory such
events are handled after the completion of the current instruction.
ii) User requested versus coerced: User requested exceptions are predictable
and can always be handled after the current instruction has completed. Coerced
exceptions are caused by some hardware event that is not under the control of the user
program. Coerced exceptions are harder to implement because they are not predictable
iii) User maskable versus user non maskable :
If an event can be masked by a user task, it is user maskable. Otherwise it is user non
maskable.
iv) Within versus between instructions: Exception that occur within
instruction are usually synchronous, since the instruction triggers the
exception. It is harder to implement exceptions that occur within
instructions than those between instructions, since the instruction must be
stopped and restarted. Asynchronous exceptions that occurs within
instructions arise from catastrophic situations and always causes program
termination.
v) Resume versus terminate:
If the program’s execution continues after the interrupt, it is a resuming event otherwise
if is terminating event. It is easier implement exceptions that terminate execution.

8/6/2019 ACA unit 1& 2
http://slidepdf.com/reader/full/aca-unit-1-2 29/30
29
Stopping and restarting execution:
The most difficult exception have 2 properties:
1. Exception that occur within instructions
2. They must be restartable
For example, a page fault must be restartable and requires the intervention of OS.
Thus pipeline must be safely shutdown, so that the instruction can be restarted in
the correct state. If the restarted instruction is not a branch, then we will continue
to fetch the sequential successors and begin their execution in the normal fashion.
11) Restarting is usually implemented by saving the PC of the instruction at which to
restart. Pipeline control can take the following steps to save the pipeline state safely.
i) Force a trap instruction in to the pipeline on the next IF
ii) Until the trap is taken, turn off all writes for the faulting instruction and for all
instructions that follow in pipeline. This prevents any state changes for instructions that
will not be completed before the exception is handled.
iii) After the exception – handling routine receives control, it immediately saves the PC
of the faulting instruction. This value will be used to return from the exception later.
NOTE:
1. with pipelining multiple exceptions may occur in the same clock cycle because
there are multiple instructions in execution.
2 Handling the exception becomes still more complicated when the instructions areallowed to execute in out of order fashion.
Pipeline implementation
Every MIPS instruction can be implemented in 5 clock cycle
1. Instruction fetch cycles.(IF)
IR Mem [PC]
NPC PC+ 4
Operation: send out the [PC] and fetch the instruction from memory in to the Instruction
Register (IR). Increment PC by 4 to address the next sequential instruction.
8/6/2019 ACA unit 1& 2
http://slidepdf.com/reader/full/aca-unit-1-2 30/30
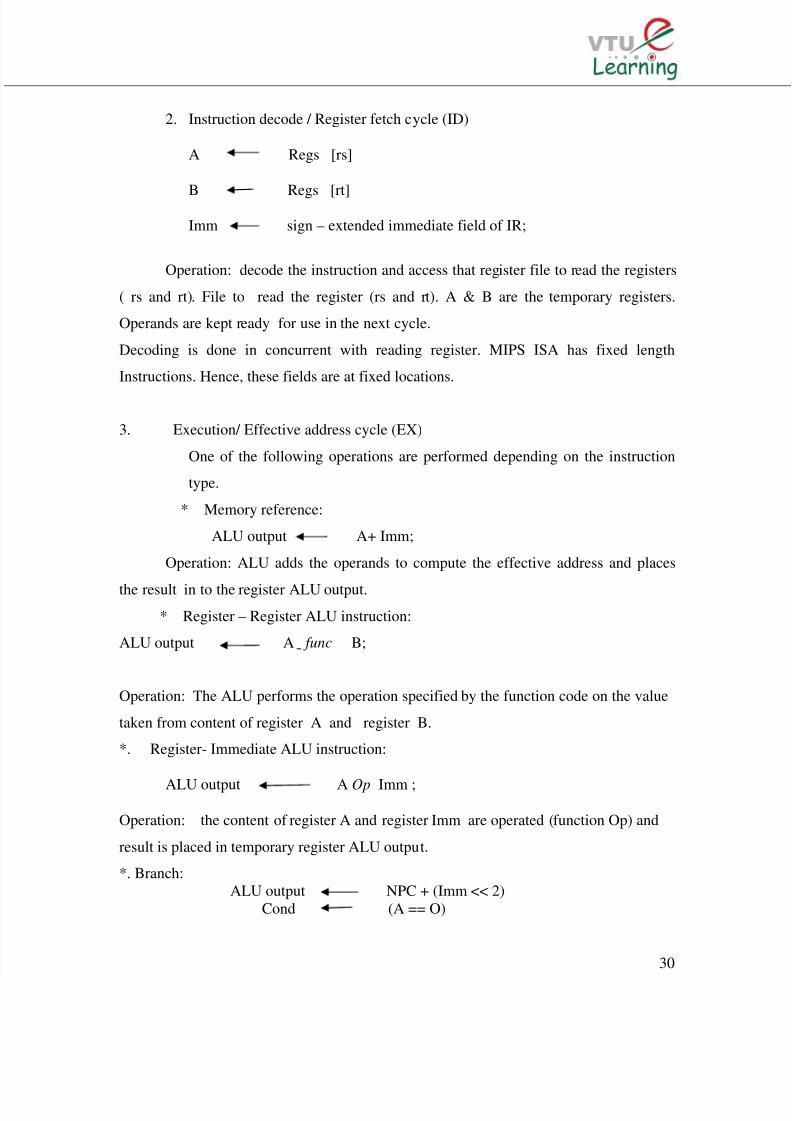
2. Instruction decode / Register fetch cycle (ID)
A Regs [rs]
B Regs [rt]
Imm sign – extended immediate field of IR;
Operation: decode the instruction and access that register file to read the registers
( rs and rt). File to read the register (rs and rt). A & B are the temporary registers.
Operands are kept ready for use in the next cycle.
Decoding is done in concurrent with reading register. MIPS ISA has fixed length
Instructions. Hence, these fields are at fixed locations.
3. Execution/ Effective address cycle (EX)
One of the following operations are performed depending on the instruction
type.
* Memory reference:
ALU output A+ Imm;
Operation: ALU adds the operands to compute the effective address and places
the result in to the register ALU output.
* Register – Register ALU instruction:
ALU output A func B;
Operation: The ALU performs the operation specified by the function code on the value
taken from content of register A and register B.
*. Register- Immediate ALU instruction:
ALU output A Op Imm ;
Operation: the content of register A and register Imm are operated (function Op) and
result is placed in temporary register ALU output.
*. Branch:ALU output NPC + (Imm << 2)
Cond (A == O)