afs presentation125
TRANSCRIPT
8/7/2019 AFS Presentation125
http://slidepdf.com/reader/full/afs-presentation125 1/49
By: Maqbool Ahmed and Yasir Abro
Analysis of Financial statements
8/7/2019 AFS Presentation125
http://slidepdf.com/reader/full/afs-presentation125 2/49
8/7/2019 AFS Presentation125
http://slidepdf.com/reader/full/afs-presentation125 3/49
PROFILE
y Attock Cement Pakistan Limited (ACPL) is a
public limited company, listed on the Karachi Stock
Exchange since June 2002.
y Main business of the company is manufacturing and
sales of cement.
y ACPL is part of the Pharaon Group, which in addition to
investment in cement industry has diversified stakes in
Pakistan mainly in the oil and gas sector, power and realestate sector.
8/7/2019 AFS Presentation125
http://slidepdf.com/reader/full/afs-presentation125 4/49
y Vision:
To be the leading organization continuously providing high
quality cement, excelling in every aspect of its business and to
remain market leader in Cement Industry.
y Mission:
To be a premier and reputable cement manufacturing company
dedicated to become an industry leader by producing quality
products, providing excellent services, enhancing customer
satisfaction and maximizing shareholders' value through
professionalism and dedicated teamwork.
8/7/2019 AFS Presentation125
http://slidepdf.com/reader/full/afs-presentation125 5/49
8/7/2019 AFS Presentation125
http://slidepdf.com/reader/full/afs-presentation125 6/49
8/7/2019 AFS Presentation125
http://slidepdf.com/reader/full/afs-presentation125 7/49
Share Capital and Reserves
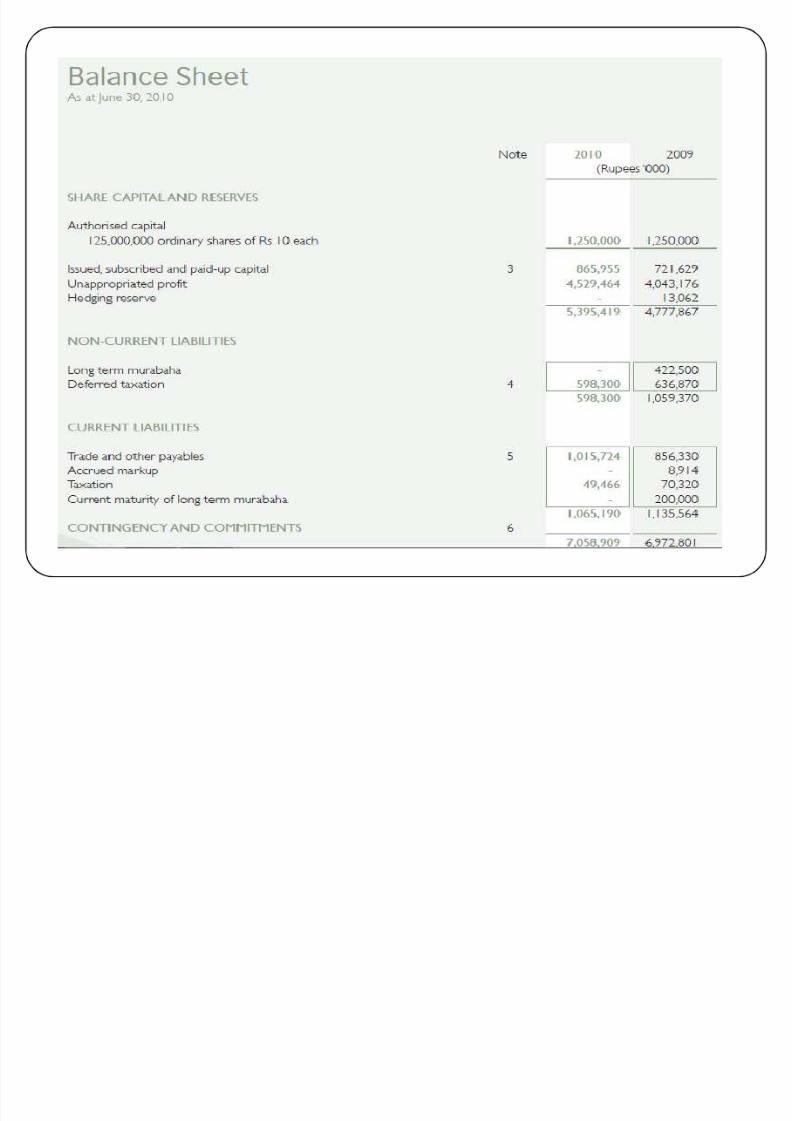
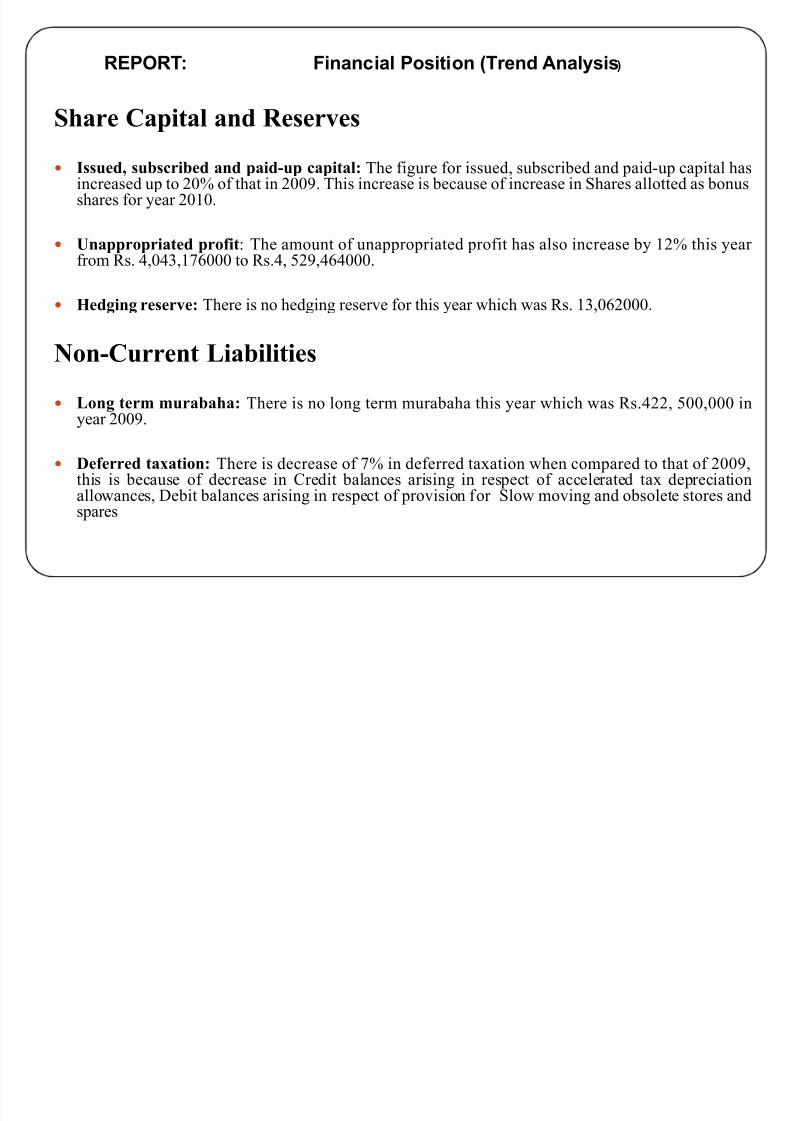
y Issued, subscribed and paid-up capital: The figure for issued, subscribed and paid-up capital hasincreased up to 20% of that in 2009. This increase is because of increase in Shares allotted as bonusshares for year 2010.
y Unappropriated profit: The amount of unappropriated profit has also increase by 12% this year from Rs. 4,043,176000 to Rs.4, 529,464000.
y Hedging reserve: There is no hedging reserve for this year which was Rs. 13,062000.
Non-Current Liabilities
y Long term murabaha: There is no long term murabaha this year which was Rs.422, 500,000 inyear 2009.
y Deferred taxation: There is decrease of 7% in deferred taxation when compared to that of 2009,this is because of decrease in Credit balances arising in respect of accelerated tax depreciationallowances, Debit balances arising in respect of provision for Slow moving and obsolete stores andspares
REPORT: Financial Position (Trend Analysis)
8/7/2019 AFS Presentation125
http://slidepdf.com/reader/full/afs-presentation125 8/49
Current Liabilities
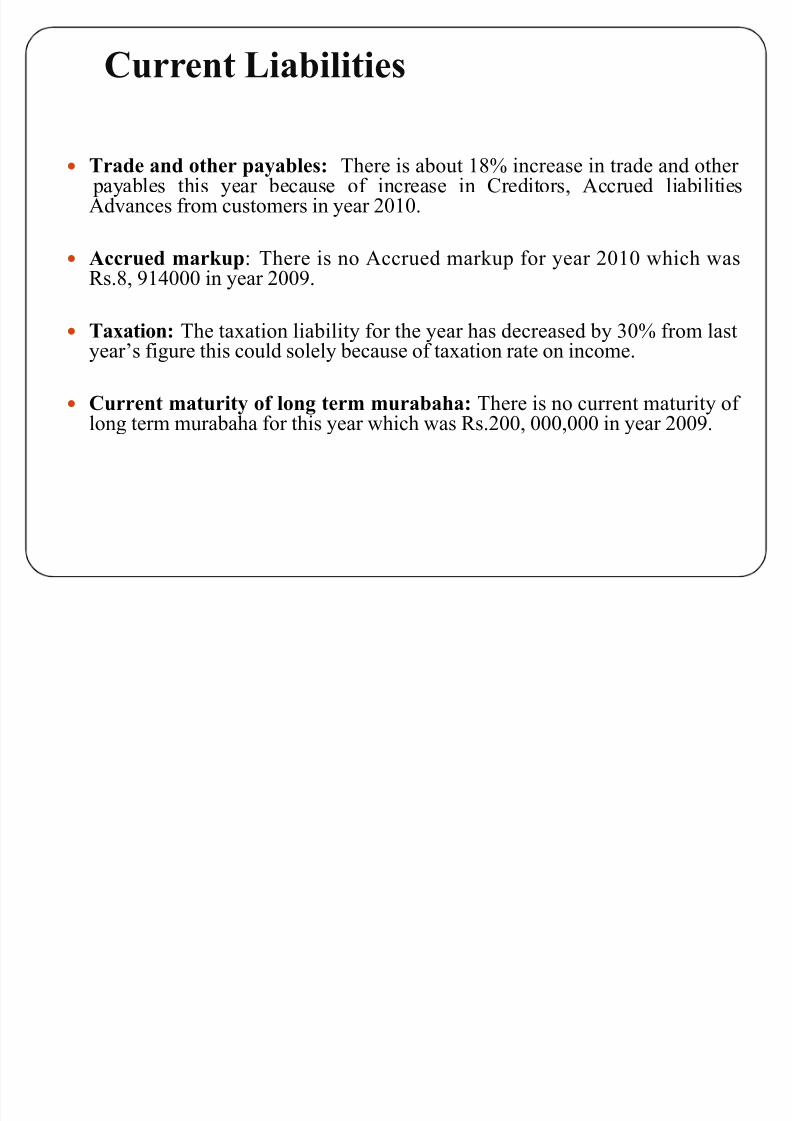
y Trade and other payables: There is about 18% increase in trade and other payables this year because of increase in Creditors, Accrued liabilitiesAdvances from customers in year 2010.
y Accrued markup: There is no Accrued markup for year 2010 which was
Rs.8, 914000 in year 2009.
y Taxation: The taxation liability for the year has decreased by 30% from lastyear¶s figure this could solely because of taxation rate on income.
y Current maturity of long term murabaha: There is no current maturity of long term murabaha for this year which was Rs.200, 000,000 in year 2009.
8/7/2019 AFS Presentation125
http://slidepdf.com/reader/full/afs-presentation125 9/49
Non-CurrentAssets
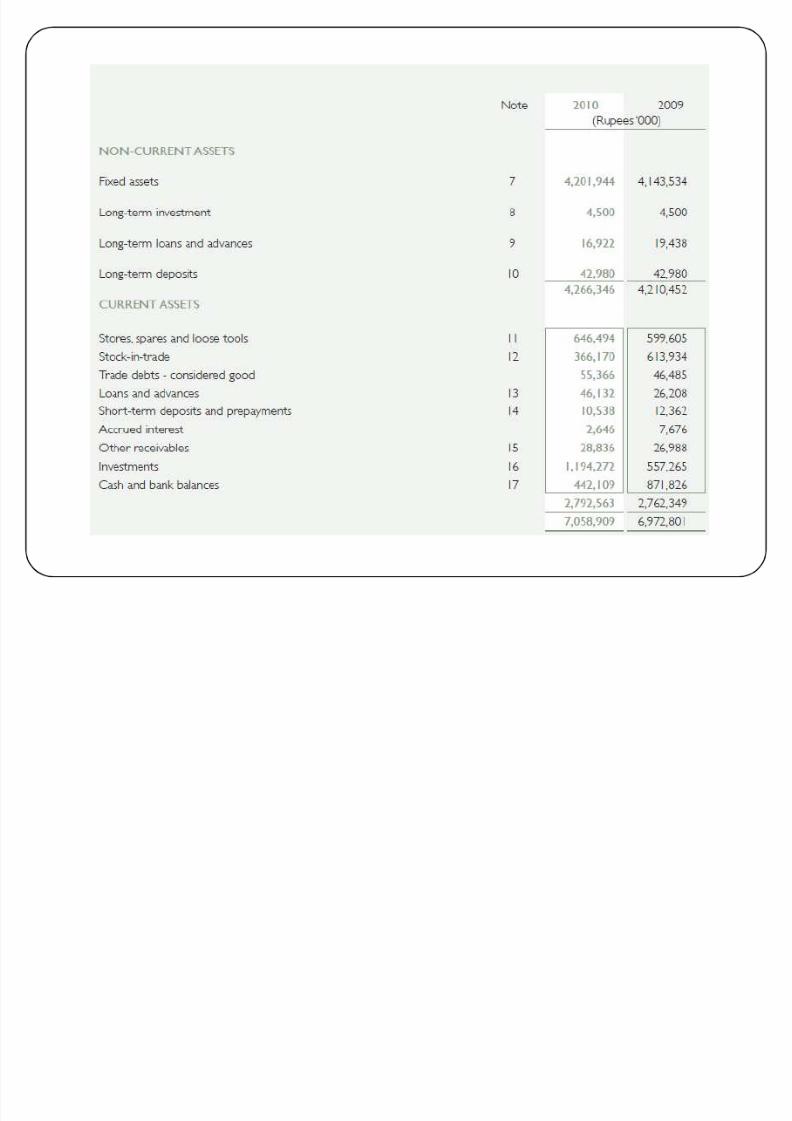
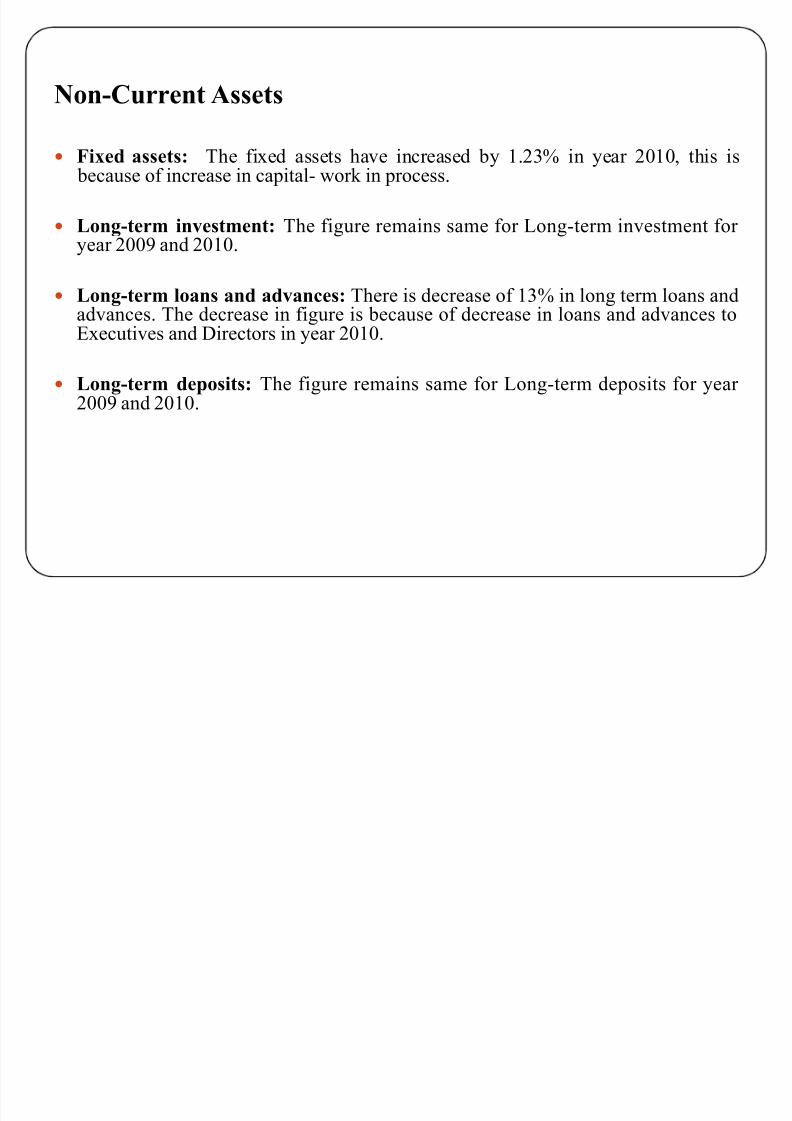
y Fixed assets: The fixed assets have increased by 1.23% in year 2010, this is because of increase in capital- work in process.
y Long-term investment: The figure remains same for Long-term investment for year 2009 and 2010.
y Long-term loans and advances: There is decrease of 13% in long term loans andadvances. The decrease in figure is because of decrease in loans and advances toExecutives and Directors in year 2010.
y Long-term deposits: The figure remains same for Long-term deposits for year 2009 and 2010.
8/7/2019 AFS Presentation125
http://slidepdf.com/reader/full/afs-presentation125 10/49
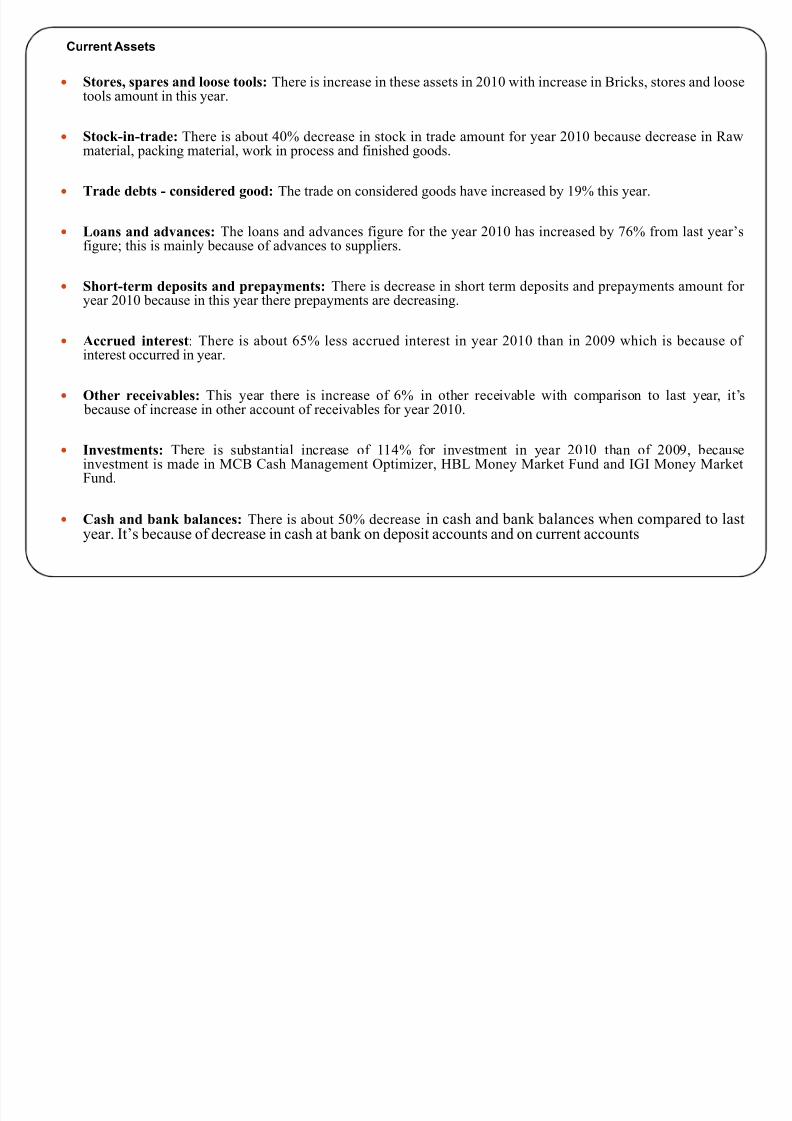
y Stores, spares and loose tools: There is increase in these assets in 2010 with increase in Bricks, stores and loosetools amount in this year.
yStock-in-trade: There is about 40% decrease in stock in trade amount for year 2010 because decrease in Rawmaterial, packing material, work in process and finished goods.
y Trade debts - considered good: The trade on considered goods have increased by 19% this year.
y Loans and advances: The loans and advances figure for the year 2010 has increased by 76% from last year¶sfigure; this is mainly because of advances to suppliers.
y Short-term deposits and prepayments: There is decrease in short term deposits and prepayments amount for year 2010 because in this year there prepayments are decreasing.
y Accrued interest: There is about 65% less accrued interest in year 2010 than in 2009 which is because of interest occurred in year.
y Other receivables: This year there is increase of 6% in other receivable with comparison to last year, it¶s
because of increase in other account of receivables for year 2010.
y Investments: There is substantial increase of 114% for investment in year 2010 than of 2009, becauseinvestment is made in MCB Cash Management Optimizer, HBL Money Market Fund and IGI Money MarketFund.
y Cash and bank balances: There is about 50% decrease in cash and bank balances when compared to lastyear. It¶s because of decrease in cash at bank on deposit accounts and on current accounts
Current Assets
8/7/2019 AFS Presentation125
http://slidepdf.com/reader/full/afs-presentation125 11/49
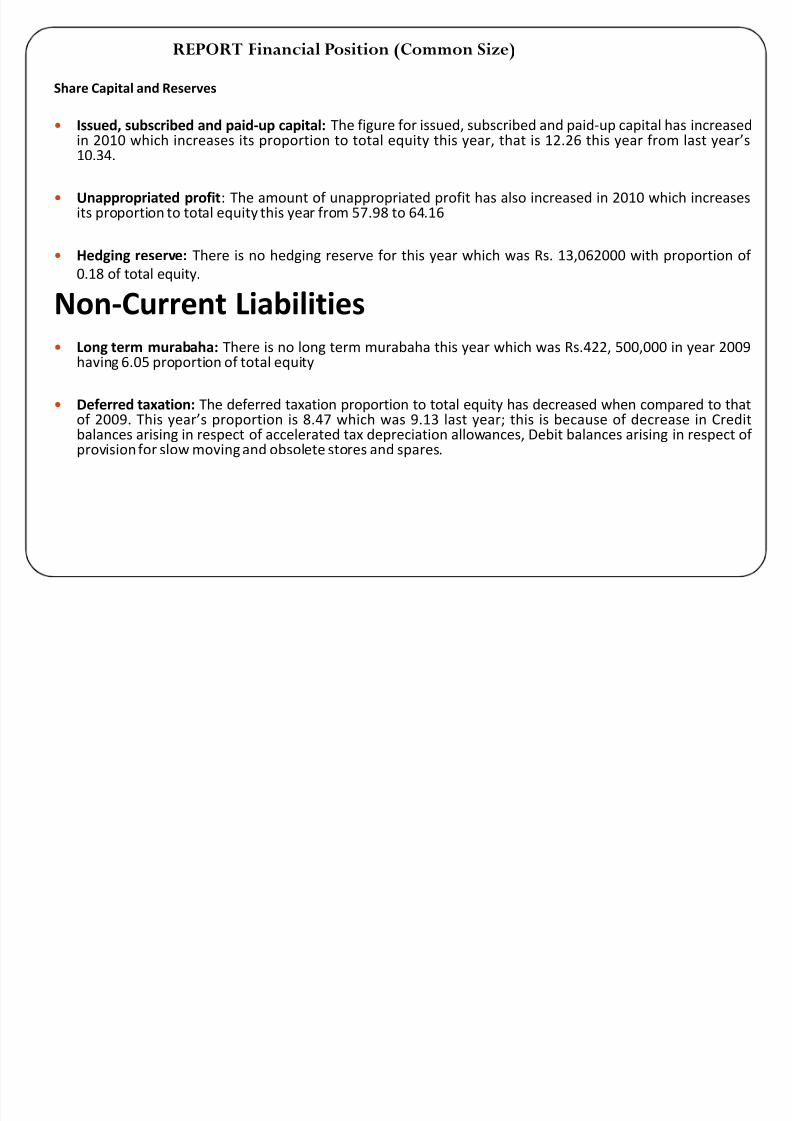
Share Capital and Reserves
y Issued, subscribed and paid-up capital: The figure for issued, subscribed and paid-up capital has increased
in 2010 which increases its proportion to total equity this year, that is 12.26 this year from last years10.34.
y Unappropriated profit: The amount of unappropriated profit has also increased in 2010 which increasesits proportion to total equity this year from 57.98 to 64.16
y Hedging reserve: There is no hedging reserve for this year which was Rs. 13,062000 with proportion of
0.18 of total equity.
Non-Current Liabilitiesy Long term murabaha: There is no long term murabaha this year which was Rs.422, 500,000 in year 2009
having 6.05 proportion of total equity
y Deferred taxation: The deferred taxation proportion to total equity has decreased when compared to thatof 2009. This years proportion is 8.47 which was 9.13 last year; this is because of decrease in Creditbalances arising in respect of accelerated tax depreciation allowances, Debit balances arising in respect of provision for slow moving and obsolete stores and spares.
REPORT Financial Position (Common Size)
8/7/2019 AFS Presentation125
http://slidepdf.com/reader/full/afs-presentation125 12/49
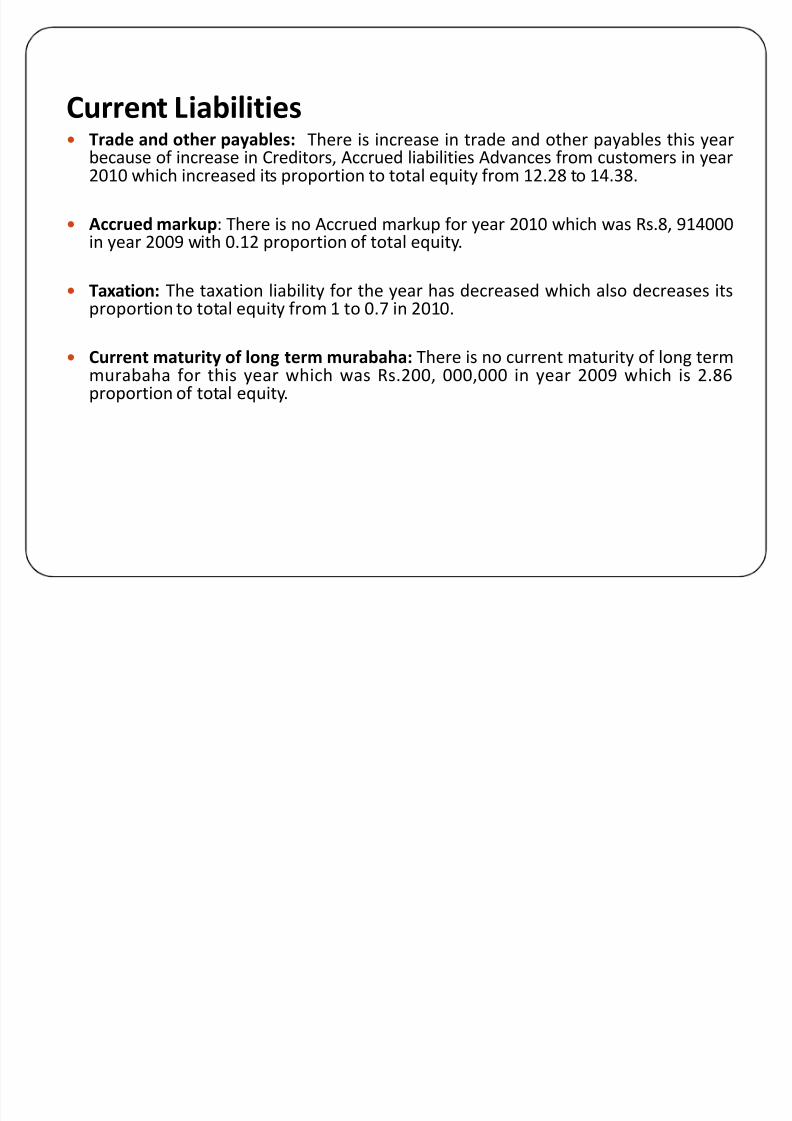
Current Liabilitiesy Trade and other payables: There is increase in trade and other payables this year
because of increase in Creditors, Accrued liabilities Advances from customers in year2010 which increased its proportion to total equity from 12.28 to 14.38.
y Accrued markup: There is no Accrued markup for year 2010 which was Rs.8, 914000in year 2009 with 0.12 proportion of total equity.
y Taxation: The taxation liability for the year has decreased which also decreases itsproportion to total equity from 1 to 0.7 in 2010.
y Current maturity of long term murabaha: There is no current maturity of long termmurabaha for this year which was Rs.200, 000,000 in year 2009 which is 2.86proportion of total equity.
8/7/2019 AFS Presentation125
http://slidepdf.com/reader/full/afs-presentation125 13/49
Non-CurrentAssets
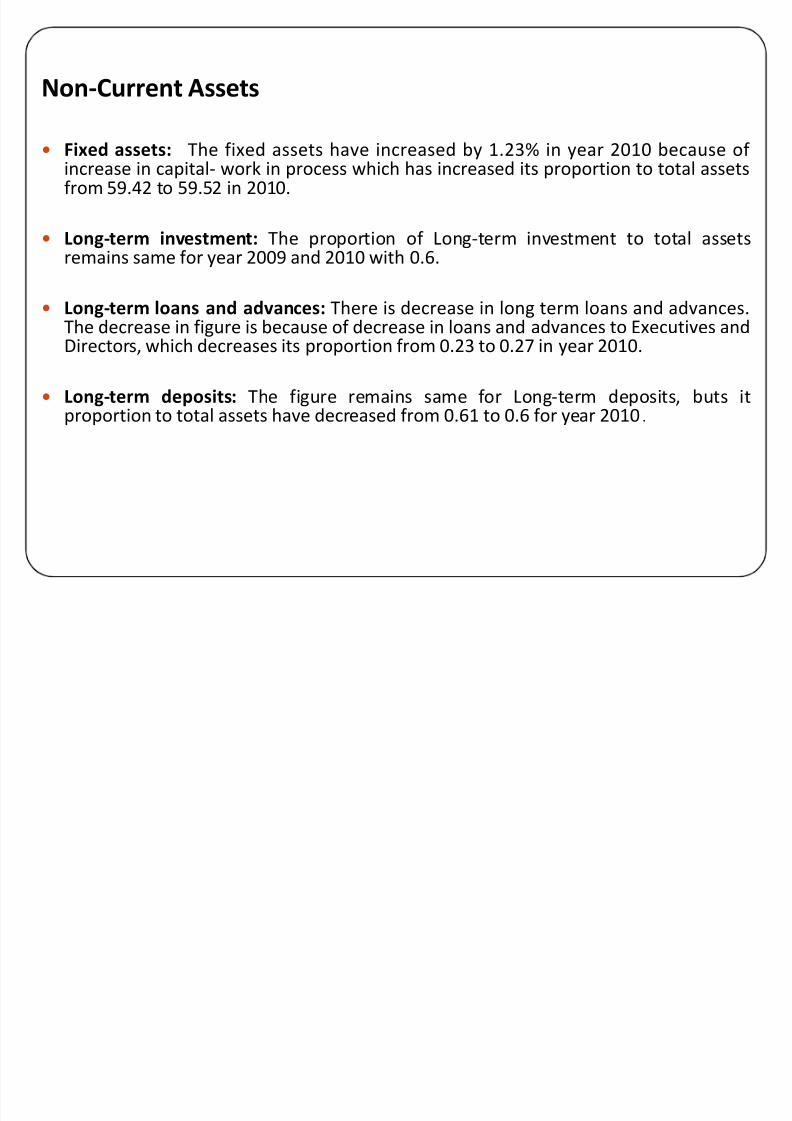
y Fixed assets: The fixed assets have increased by 1.23% in year 2010 because of increase in capital- work in process which has increased its proportion to total assetsfrom 59.42 to 59.52 in 2010.
y Long-term investment: The proportion of Long-term investment to total assetsremains same for year 2009 and 2010 with 0.6.
y Long-term loans and advances: There is decrease in long term loans and advances.The decrease in figure is because of decrease in loans and advances to Executives andDirectors, which decreases its proportion from 0.23 to 0.27 in year 2010.
y Long-term deposits: The figure remains same for Long-term deposits, buts it
proportion to total assets have decreased from 0.61 to 0.6 for year 2010.
8/7/2019 AFS Presentation125
http://slidepdf.com/reader/full/afs-presentation125 14/49
CurrentAssets
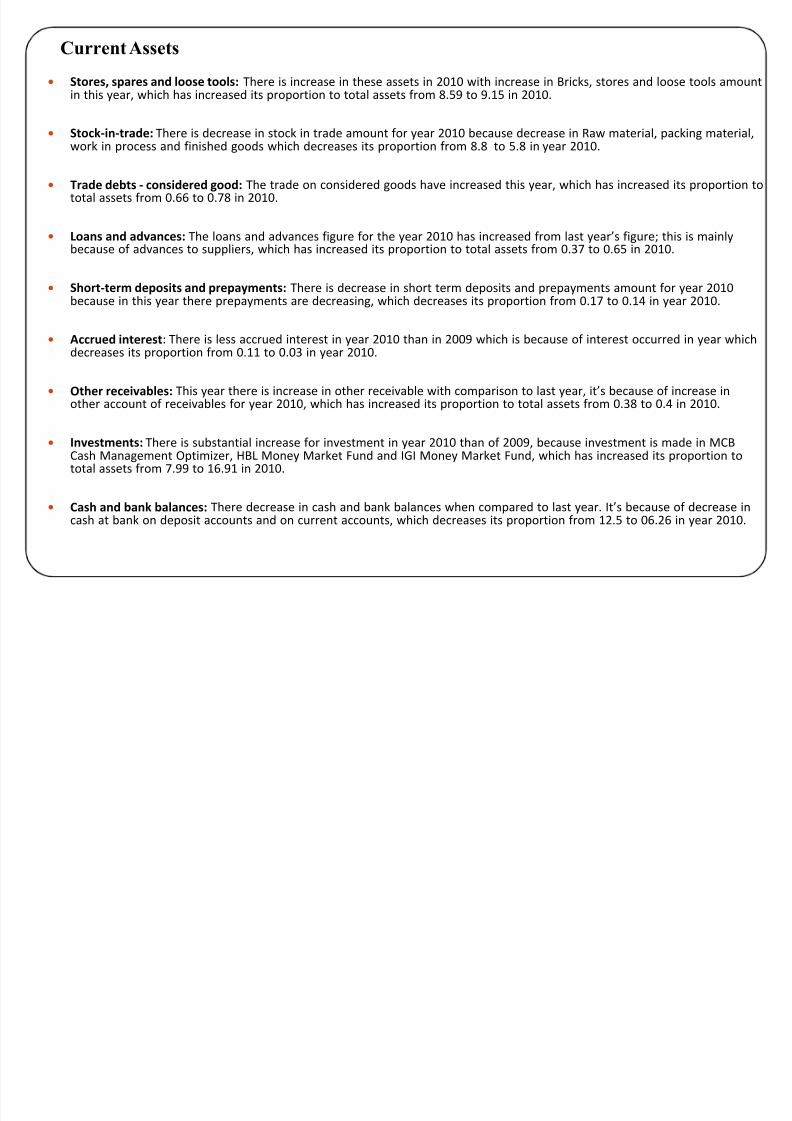
y Stores, spares and loose tools: There is increase in these assets in 2010 with increase in Bricks, stores and loose tools amountin this year, which has increased its proportion to total assets from 8.59 to 9.15 in 2010.
y Stock-in-trade: There is decrease in stock in trade amount for year 2010 because decrease in Raw material, packing material,work in process and finished goods which decreases its proportion from 8.8 to 5.8 in year 2010.
y Trade debts - considered good: The trade on considered goods have increased this year, which has increased its proportion tototal assets from 0.66 to 0.78 in 2010.
y Loans and advances: The loans and advances figure for the year 2010 has increased from last years figure; this is mainlybecause of advances to suppliers, which has increased its proportion to total assets from 0.37 to 0.65 in 2010.
y Short-term deposits and prepayments: There is decrease in short term deposits and prepayments amount for year 2010because in this year there prepayments are decreasing, which decreases its proportion from 0.17 to 0.14 in year 2010.
y Accrued interest: There is less accrued interest in year 2010 than in 2009 which is because of interest occurred in year whichdecreases its proportion from 0.11 to 0.03 in year 2010.
y Other receivables: This year there is increase in other receivable with comparison to last year, its because of increase inother account of receivables for year 2010, which has increased its proportion to total assets from 0.38 to 0.4 in 2010.
y Investments: There is substantial increase for investment in year 2010 than of 2009, because investment is made in MCBCash Management Optimizer, HBL Money Market Fund and IGI Money Market Fund, which has increased its proportion tototal assets from 7.99 to 16.91 in 2010.
y Cash and bank balances: There decrease in cash and bank balances when compared to last year. Its because of decrease incash at bank on deposit accounts and on current accounts, which decreases its proportion from 12.5 to 06.26 in year 2010.
8/7/2019 AFS Presentation125
http://slidepdf.com/reader/full/afs-presentation125 15/49
8/7/2019 AFS Presentation125
http://slidepdf.com/reader/full/afs-presentation125 16/49
8/7/2019 AFS Presentation125
http://slidepdf.com/reader/full/afs-presentation125 17/49
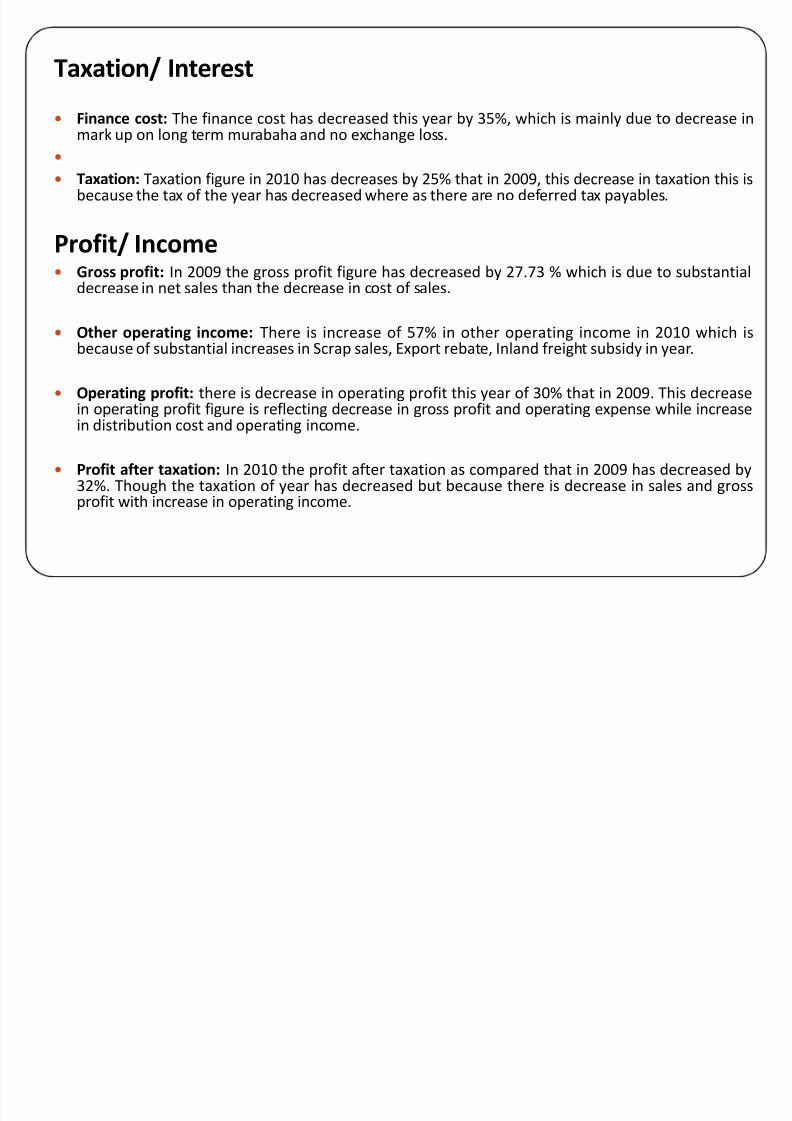
Taxation/ Interest
y Finance cost: The finance cost has decreased this year by 35%, which is mainly due to decrease in
mark up on long term murabaha and no exchange loss.y
y Taxation: Taxation figure in 2010 has decreases by 25% that in 2009, this decrease in taxation this isbecause the tax of the year has decreased where as there are no deferred tax payables.
Profit/ Incomey G
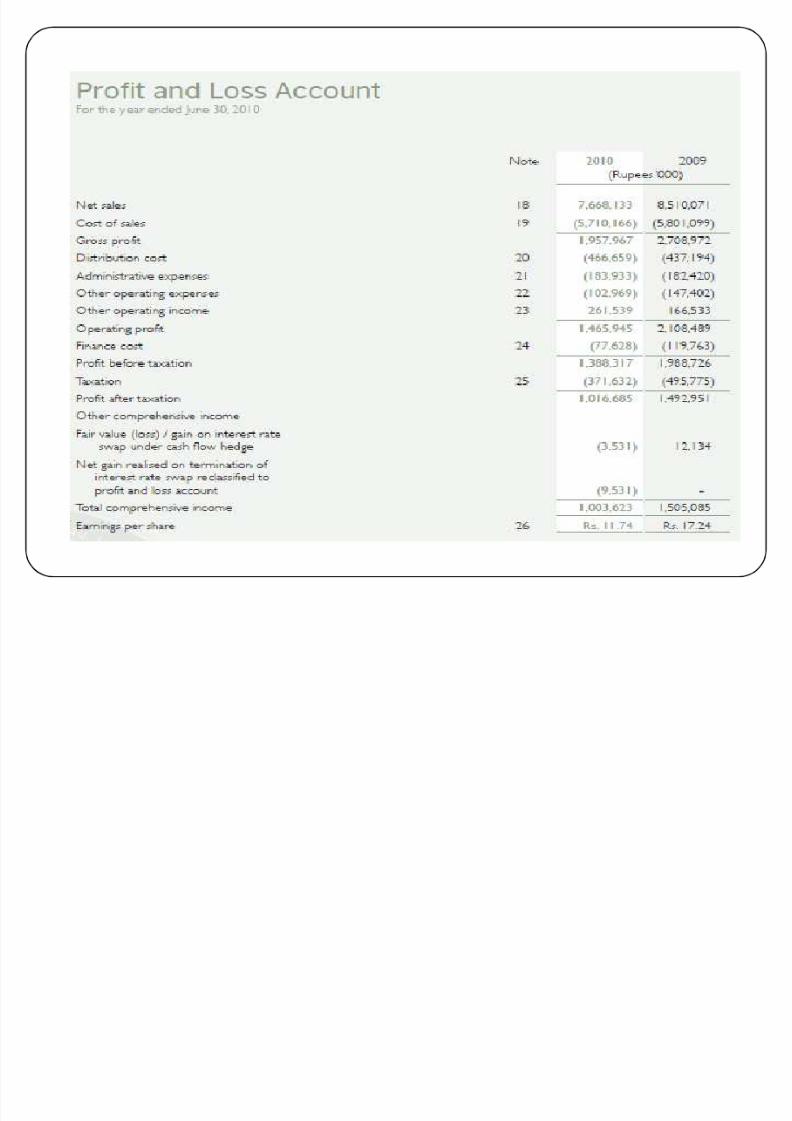
ross profit: In 2009 the gross profit figure has decreased by 27.73 % which is due to substantialdecrease in net sales than the decrease in cost of sales.
y Other operating income: There is increase of 57% in other operating income in 2010 which isbecause of substantial increases in Scrap sales, Export rebate, Inland freight subsidy in year.
y Operating profit: there is decrease in operating profit this year of 30% that in 2009. This decrease
in operating profit figure is reflecting decrease in gross profit and operating expense while increasein distribution cost and operating income.
y Profit after taxation: In 2010 the profit after taxation as compared that in 2009 has decreased by32%. Though the taxation of year has decreased but because there is decrease in sales and grossprofit with increase in operating income.
8/7/2019 AFS Presentation125
http://slidepdf.com/reader/full/afs-presentation125 18/49
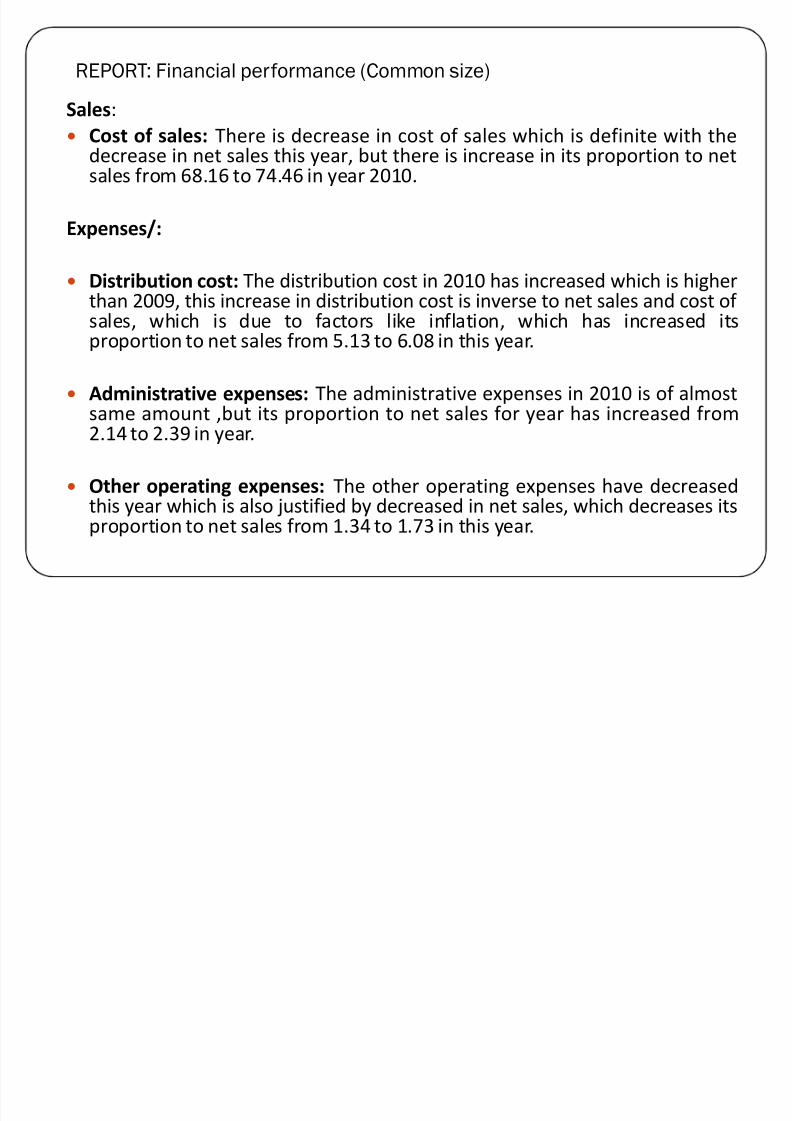
REPORT: Financial performance (Common size)
Sales:
y
Cost of sales: There is decrease in cost of sales which is definite with thedecrease in net sales this year, but there is increase in its proportion to netsales from 68.16 to 74.46 in year 2010.
Expenses/:
y Distribution cost: The distribution cost in 2010 has increased which is higherthan 2009, this increase in distribution cost is inverse to net sales and cost of sales, which is due to factors like inflation, which has increased itsproportion to net sales from 5.13 to 6.08 in this year.
y Administrative expenses: The administrative expenses in 2010 is of almost
same amount ,but its proportion to net sales for year has increased from2.14 to 2.39 in year.
y Other operating expenses: The other operating expenses have decreasedthis year which is also justified by decreased in net sales, which decreases itsproportion to net sales from 1.34 to 1.73 in this year.
8/7/2019 AFS Presentation125
http://slidepdf.com/reader/full/afs-presentation125 19/49
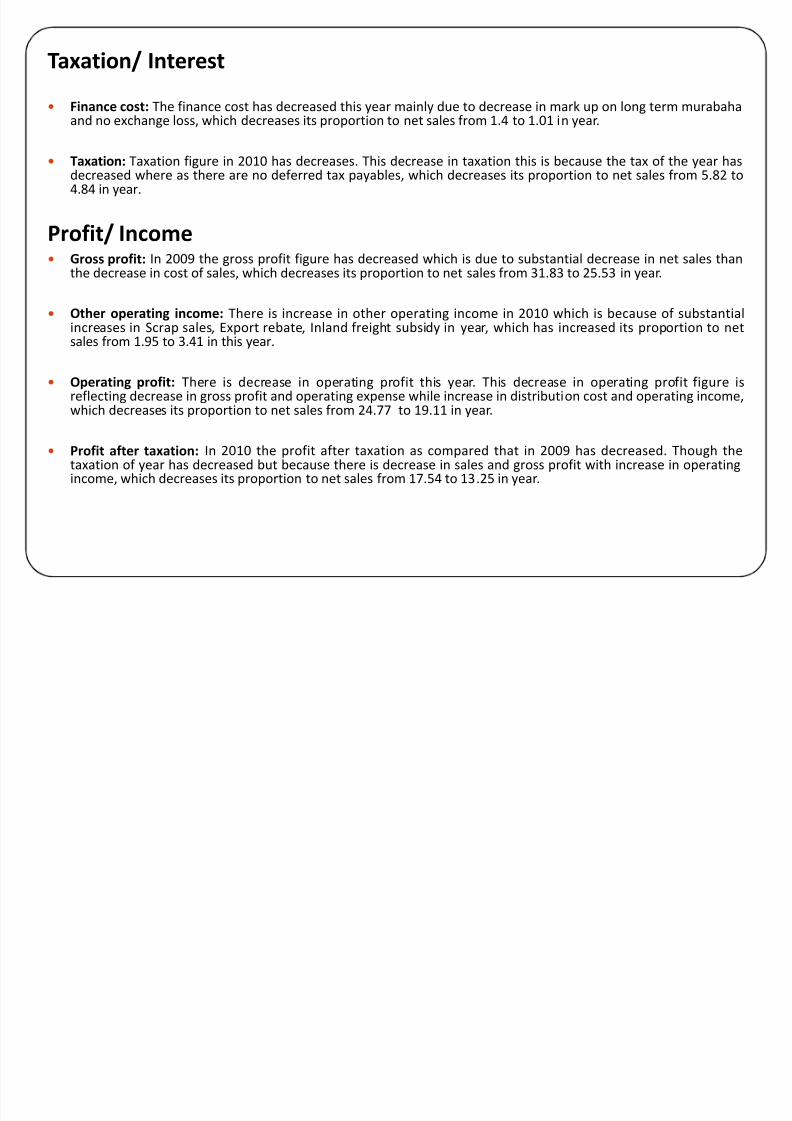
Taxation/ Interest
y Finance cost: The finance cost has decreased this year mainly due to decrease in mark up on long term murabahaand no exchange loss, which decreases its proportion to net sales from 1.4 to 1.01 in year.
y Taxation: Taxation figure in 2010 has decreases. This decrease in taxation this is because the tax of the year hasdecreased where as there are no deferred tax payables, which decreases its proportion to net sales from 5.82 to4.84 in year.
Profit/ Incomey Gross profit: In 2009 the gross profit figure has decreased which is due to substantial decrease in net sales than
the decrease in cost of sales, which decreases its proportion to net sales from 31.83 to 25.53 in year.
y Other operating income: There is increase in other operating income in 2010 which is because of substantialincreases in Scrap sales, Export rebate, Inland freight subsidy in year, which has increased its proportion to netsales from 1.95 to 3.41 in this year.
y Operating profit: There is decrease in operating profit this year. This decrease in operating profit figure isreflecting decrease in gross profit and operating expense while increase in distribution cost and operating income,
which decreases its proportion to net sales from 24.77 to 19.11 in year.
y Profit after taxation: In 2010 the profit after taxation as compared that in 2009 has decreased. Though thetaxation of year has decreased but because there is decrease in sales and gross profit with increase in operatingincome, which decreases its proportion to net sales from 17.54 to 13.25 in year.
8/7/2019 AFS Presentation125
http://slidepdf.com/reader/full/afs-presentation125 20/49
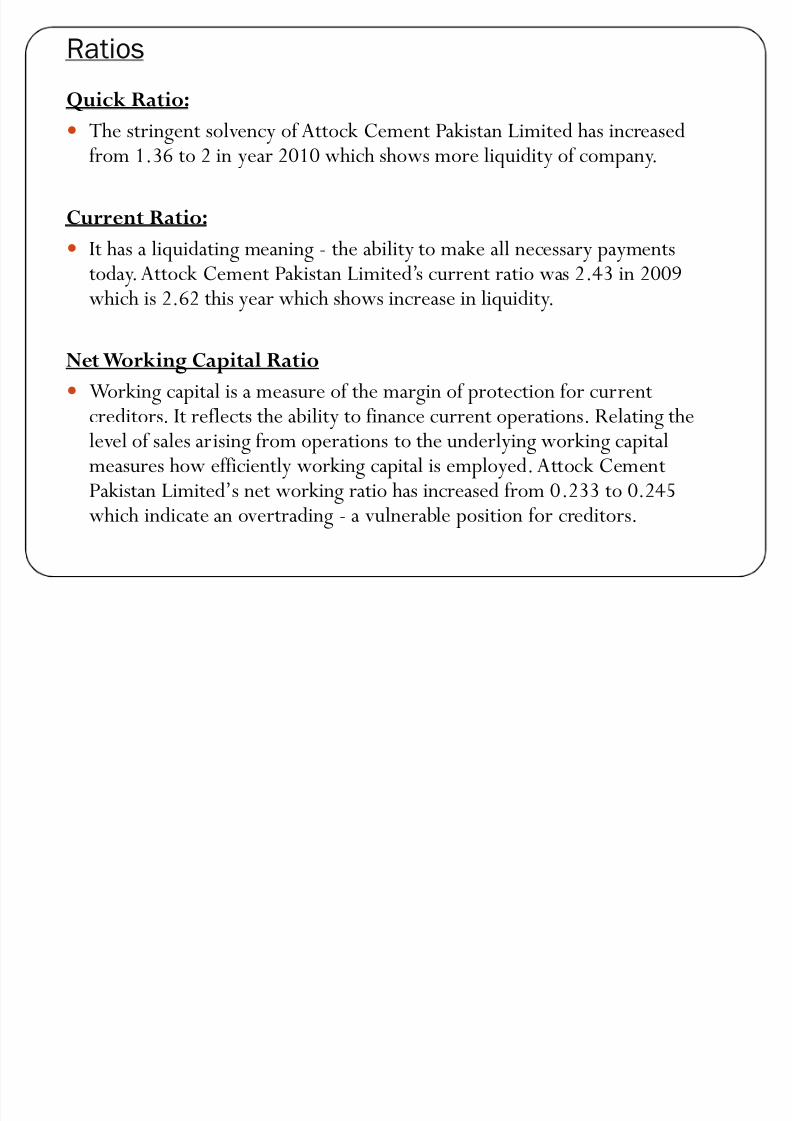
Ratios
Quick Ratio:
y T
he stringent solvency of Attock Cement Pakistan Limited has increasedfrom 1.36 to 2 in year 2010 which shows more liquidity of company.
Current Ratio:
y It has a liquidating meaning - the ability to make all necessary payments
today.Attock Cement Pakistan Limited·s current ratio was 2.43 in 2009which is 2.62 this year which shows increase in liquidity.
Net Working Capital Ratio
y Working capital is a measure of the margin of protection for current
creditors. It reflects the ability to finance current operations. Relating thelevel of sales arising from operations to the underlying working capitalmeasures how efficiently working capital is employed.Attock CementPakistan Limited·s net working ratio has increased from 0.233 to 0.245 which indicate an overtrading - a vulnerable position for creditors.
8/7/2019 AFS Presentation125
http://slidepdf.com/reader/full/afs-presentation125 21/49
8/7/2019 AFS Presentation125
http://slidepdf.com/reader/full/afs-presentation125 22/49
8/7/2019 AFS Presentation125
http://slidepdf.com/reader/full/afs-presentation125 23/49
8/7/2019 AFS Presentation125
http://slidepdf.com/reader/full/afs-presentation125 24/49
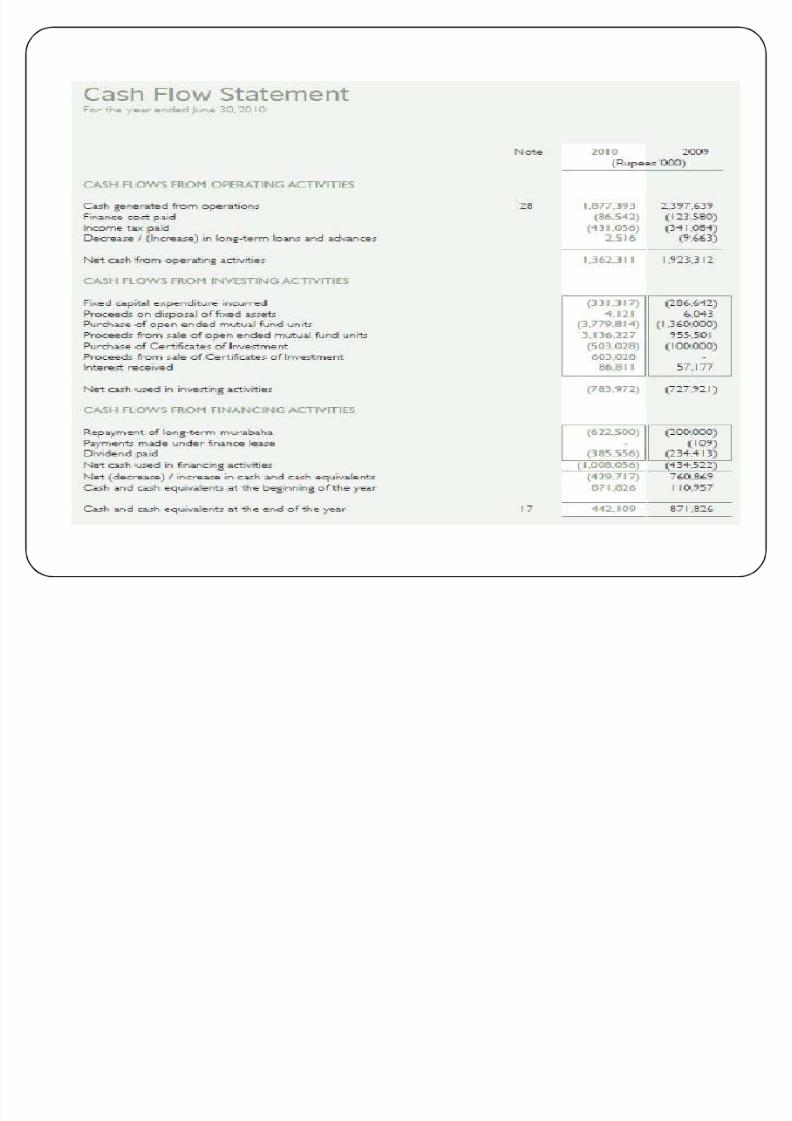
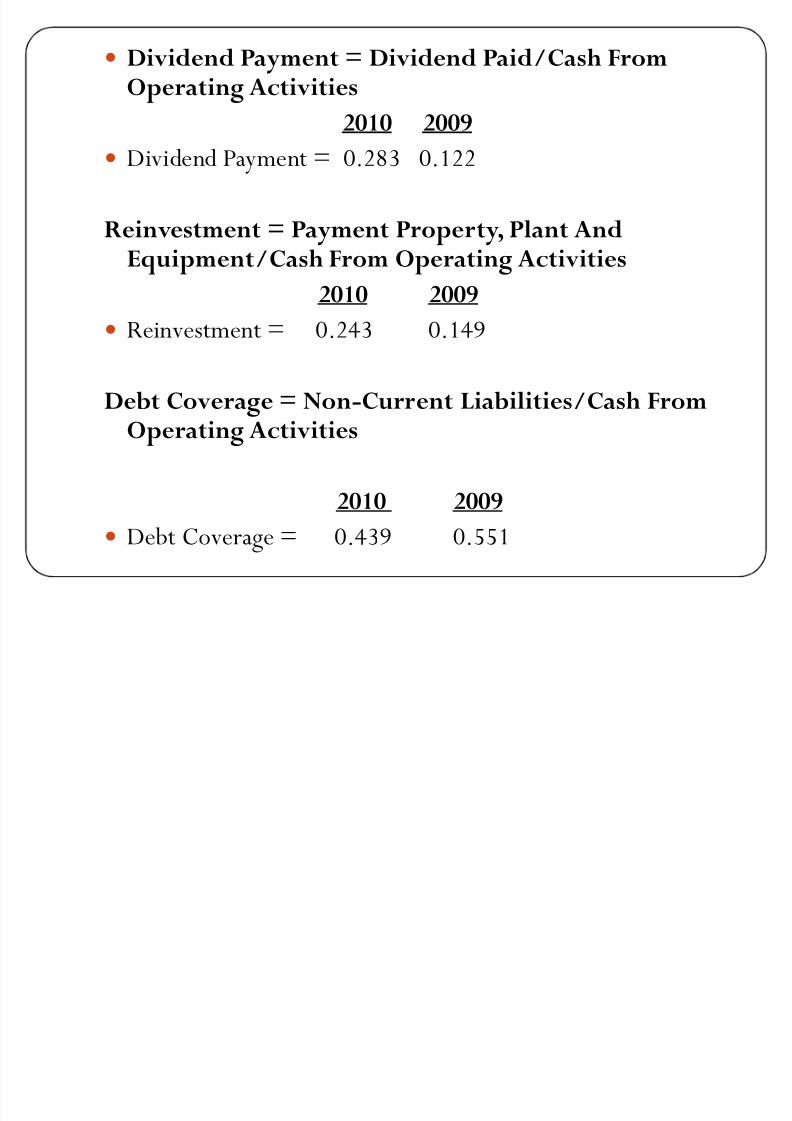
y Dividend Payment = Dividend Paid/Cash FromOperating Activities
2010 2009
y Dividend Payment = 0.283 0.122
Reinvestment = Payment Property, Plant AndEquipment/Cash From Operating Activities
2010 2009
y Reinvestment = 0.243 0.149
Debt Coverage = Non-Current Liabilities/Cash FromOperating Activities
2010 2009
y Debt Coverage = 0.439 0.551
8/7/2019 AFS Presentation125
http://slidepdf.com/reader/full/afs-presentation125 25/49
y Cash Flow Efficiency Ratios
y
y Cash Flow to Revenues = Cash f rom OperatingActivities/Revenues
2010 2009
y Cash Flow to Revenues = 17.76% 22.60%
y Operations Index = Cash f rom Operating Activities/NetProfit
2010 2009
y Operations Index= 1.34 1.29
y Cash Flow Return on Assets = Cash f rom Operating Activities+ Income Tax Paid + Interest Paid/AverageTotal Assets
2010 2009
y Cash Flow Return on Assets = 17.82% 24.10%
8/7/2019 AFS Presentation125
http://slidepdf.com/reader/full/afs-presentation125 26/49
8/7/2019 AFS Presentation125
http://slidepdf.com/reader/full/afs-presentation125 27/49
Company Profile
y
A longtime leader in the cement manufacturing industry,Fauji Cement Company, headquartered in Islamabad,
operates a cement plant at Jhang Bahtar, Tehsil Fateh Jang,
District Attock in the province of Punjab.
y The Company has a strong and longstanding tradition of
service, reliability, and quality that reaches back more than
11 years. Sponsored by Fauji Foundation, the Company was
incorporated in Rawalpindi in 1992.
8/7/2019 AFS Presentation125
http://slidepdf.com/reader/full/afs-presentation125 28/49
Vision:
y To transform FCCL into a role model cement manufacturingCompany fully aware of generally accepted principles of corporatesocial responsibilities engaged in nation building through most
efficient utilization of resources and optimally benefiting all stakeholders while enjoying public respect and goodwill.
Mission:
y FCCL while maintaining its leading position in quality of cementand through greater market outreach will build up and improve itsvalue addition with a view to ensuring optimum returns to theshareholders.
8/7/2019 AFS Presentation125
http://slidepdf.com/reader/full/afs-presentation125 29/49
8/7/2019 AFS Presentation125
http://slidepdf.com/reader/full/afs-presentation125 30/49
8/7/2019 AFS Presentation125
http://slidepdf.com/reader/full/afs-presentation125 31/49
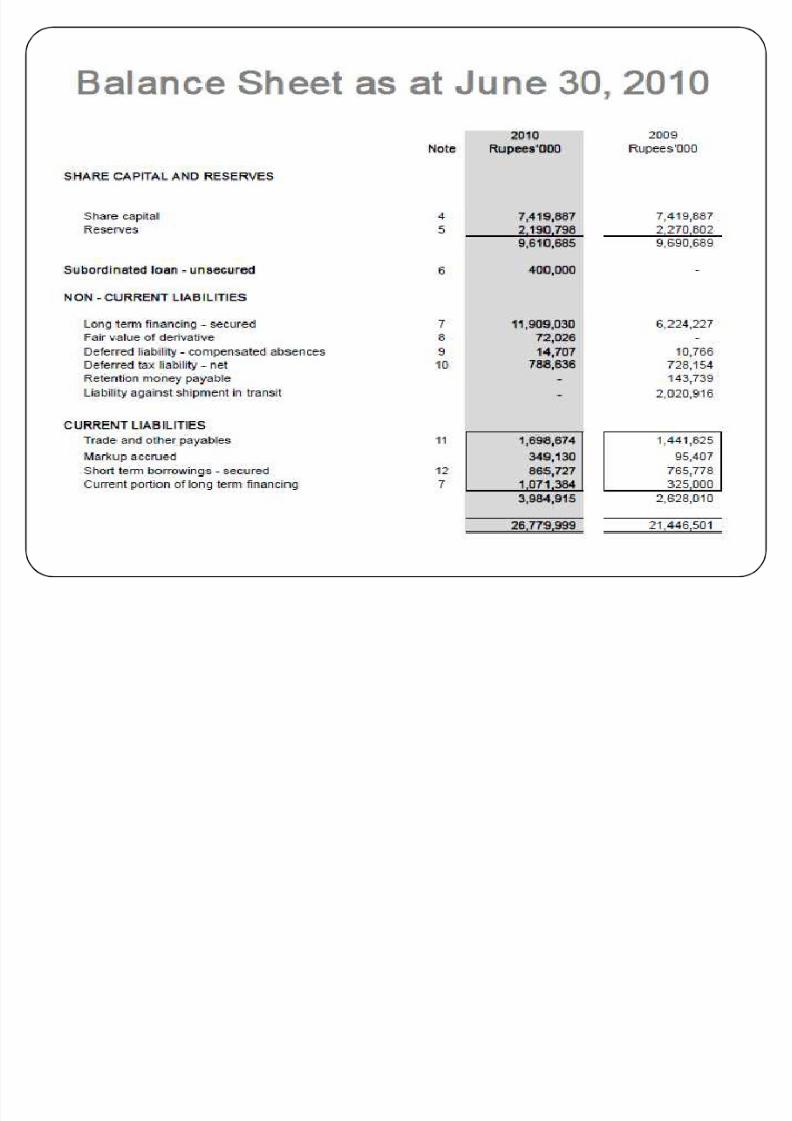
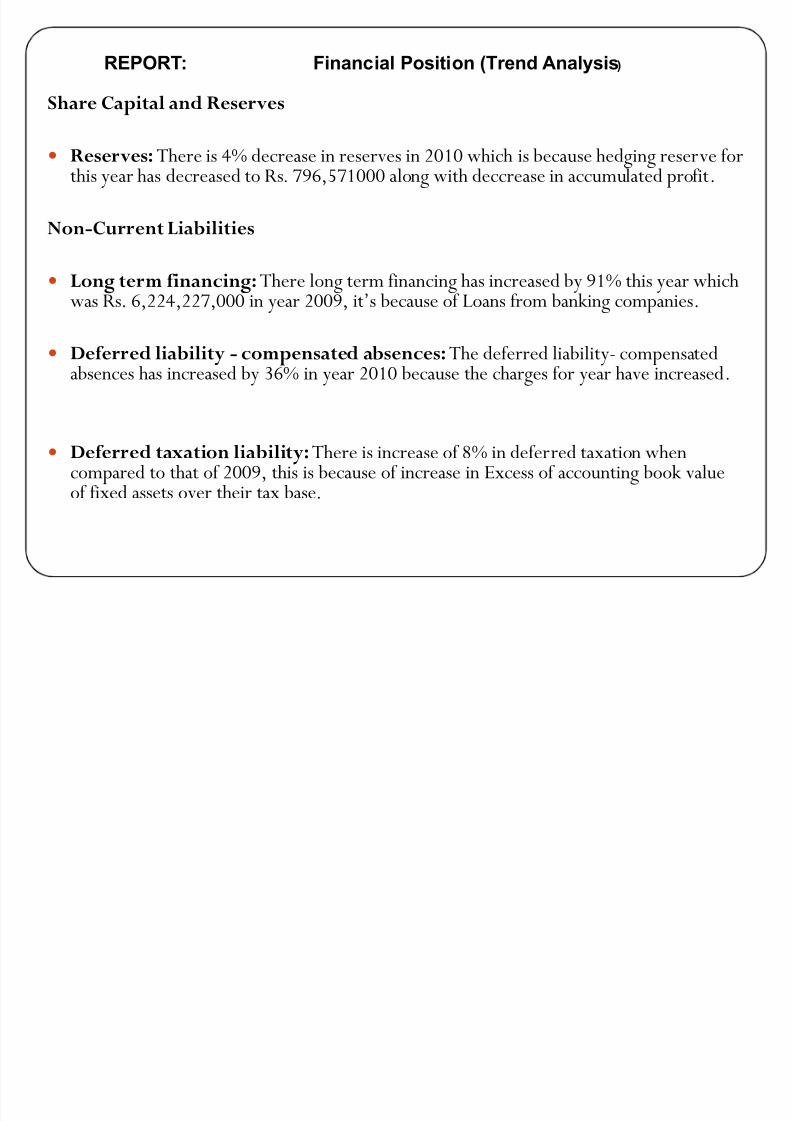
Share Capital and Reserves
y Reserves:There is 4% decrease in reserves in 2010 which is because hedging reserve forthis year has decreased to Rs. 796,571000 along with deccrease in accumulated profit.
Non-Current Liabilities
y Long term financing:There long term financing has increased by 91% this year whichwas Rs. 6,224,227,000 in year 2009, it·s because of Loans from banking companies.
y Deferred liability - compensated absences:The deferred liability- compensatedabsences has increased by 36% in year 2010 because the charges for year have increased.
y Deferred taxation liability:There is increase of 8% in deferred taxation whencompared to that of 2009, this is because of increase in Excess of accounting book valueof fixed assets over their tax base.
REPORT: Financial Position (Trend Analysis)
8/7/2019 AFS Presentation125
http://slidepdf.com/reader/full/afs-presentation125 32/49
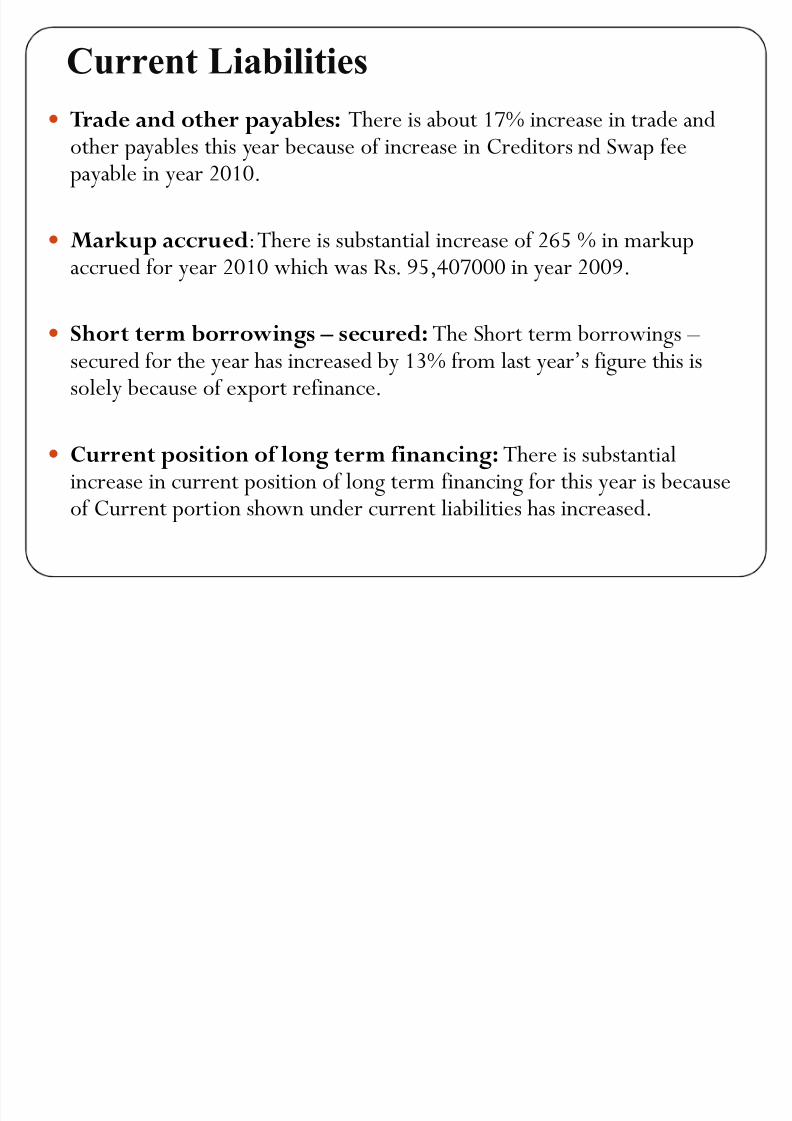
y Trade and other payables: There is about 17% increase in trade and
other payables this year because of increase in Creditors nd Swap feepayable in year 2010.
y Markup accrued:There is substantial increase of 265 % in markup
accrued for year 2010 which was Rs.
95
,4
07
000 in year 2009.
y Short term borrowings ² secured: The Short term borrowings ² secured for the year has increased by 13% from last year·s figure this issolely because of export refinance.
y Current position of long term financing: There is substantialincrease in current position of long term financing for this year is becauseof Current portion shown under current liabilities has increased.
Current Liabilities
8/7/2019 AFS Presentation125
http://slidepdf.com/reader/full/afs-presentation125 33/49
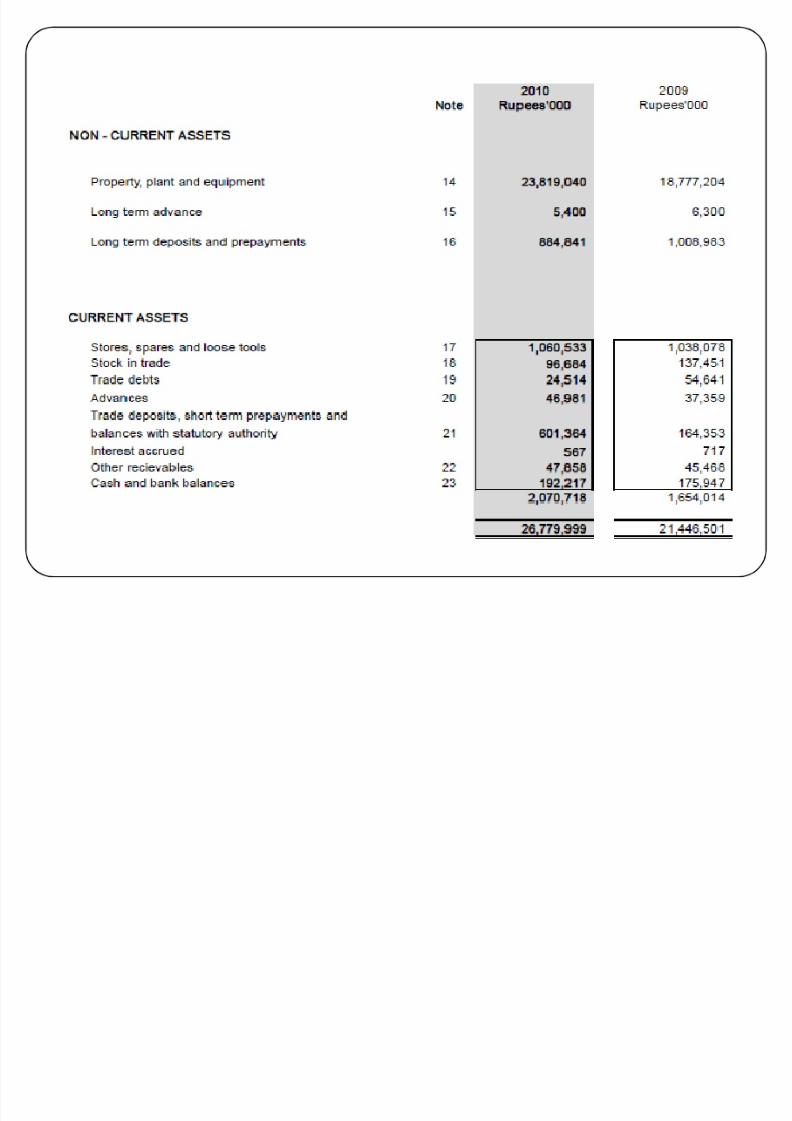
Non-Current Assets
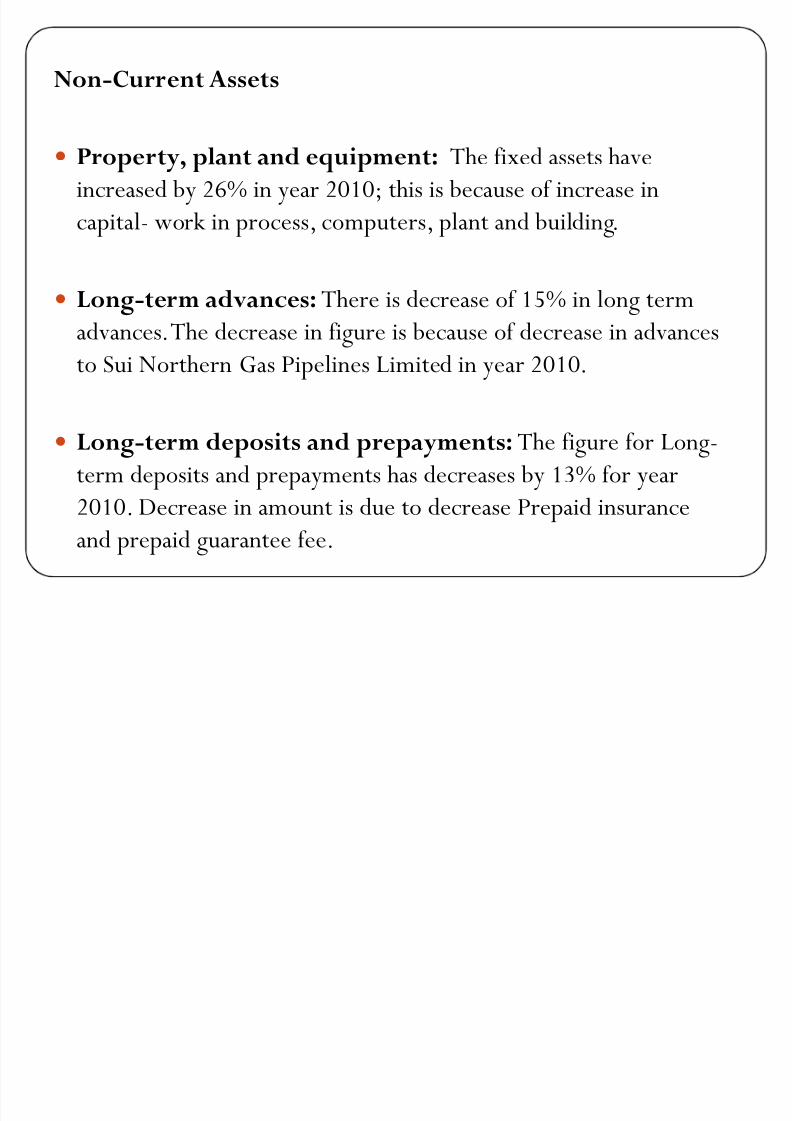
y Property, plant and equipment: The fixed assets have
increased by 26% in year 2010; this is because of increase in
capital- work in process, computers, plant and building.
y Long-term advances:There is decrease of 15% in long term
advances. The decrease in figure is because of decrease in advances
to Sui Northern Gas Pipelines Limited in year 2010.
y Long-term deposits and prepayments: The figure for Long-
term deposits and prepayments has decreases by 13% for year
2010. Decrease in amount is due to decrease Prepaid insurance
and prepaid guarantee fee.
8/7/2019 AFS Presentation125
http://slidepdf.com/reader/full/afs-presentation125 34/49
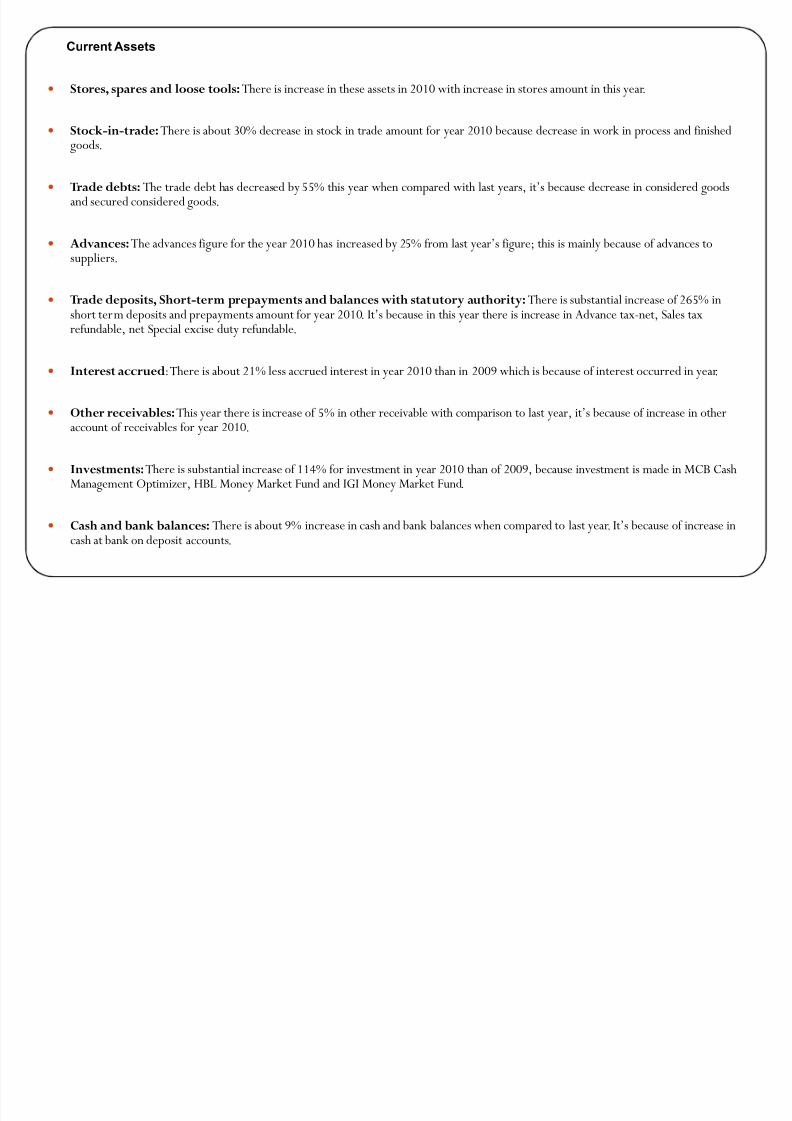
y Stores, spares and loose tools:There is increase in these assets in 2010 with increase in stores amount in this year.
y Stock-in-trade:There is about 30% decrease in stock in trade amount for year 2010 because decrease in work in process and finished
goods.
y Trade debts:The trade debt has decreased by 55% this year when compared with last years, it·s because decrease in considered goodsand secured considered goods.
y Advances:The advances figure for the year 2010 has increased by 25% from last year·s figure; this is mainly because of advances tosuppliers.
y Trade deposits, Short-term prepayments and balances with statutory authority:There is substantial increase of 265% inshort term deposits and prepayments amount for year 2010. It·s because in this year there is increase in Advance tax-net, Sales taxrefundable, net Special excise duty refundable.
y Interest accrued:There is about 21% less accrued interest in year 2010 than in 2009 which is because of interest occurred in year.
y
Other receivables:T
his year there is increase of 5
% in other receivable with comparison to last year, it·s because of increase in otheraccount of receivables for year 2010.
y Investments:There is substantial increase of 114% for investment in year 2010 than of 2009, because investment is made in MCB CashManagement Optimizer, HBL Money Market Fund and IGI Money Market Fund.
y Cash and bank balances: There is about 9% increase in cash and bank balances when compared to last year. It·s because of increase incash at bank on deposit accounts.
Current Assets
8/7/2019 AFS Presentation125
http://slidepdf.com/reader/full/afs-presentation125 35/49
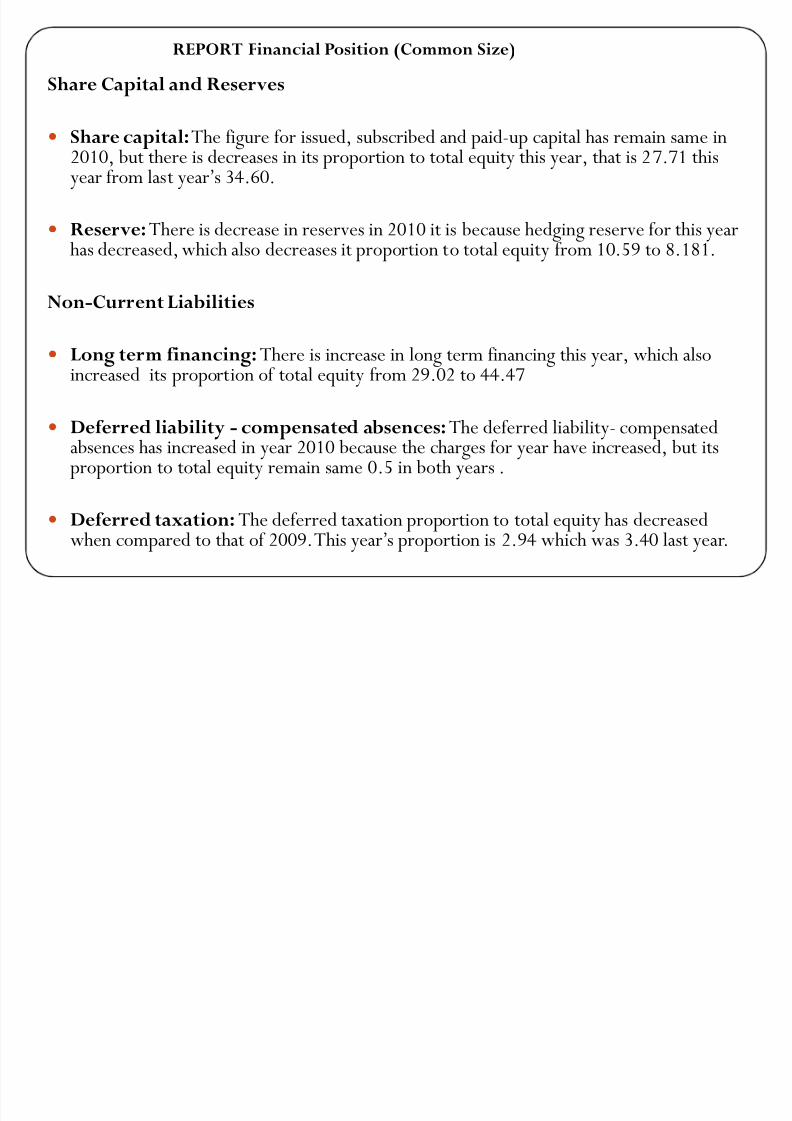
Share Capital and Reserves
y
Share capital:T
he figure for issued, subscribed and paid-up capital has remain same in2010, but there is decreases in its proportion to total equity this year, that is 27.71 thisyear from last year·s 34.60.
y Reserve:There is decrease in reserves in 2010 it is because hedging reserve for this yearhas decreased, which also decreases it proportion to total equity from 10.59 to 8.181.
Non-Current Liabilities
y Long term financing:There is increase in long term financing this year, which alsoincreased its proportion of total equity from 29.02 to 44.47
y Deferred liability - compensated absences:The deferred liability- compensatedabsences has increased in year 2010 because the charges for year have increased, but itsproportion to total equity remain same 0.5 in both years .
y Deferred taxation:The deferred taxation proportion to total equity has decreasedwhen compared to that of 2009. This year·s proportion is 2.94 which was 3.40 last year.
REPORT Financial Position (Common Size)
8/7/2019 AFS Presentation125
http://slidepdf.com/reader/full/afs-presentation125 36/49
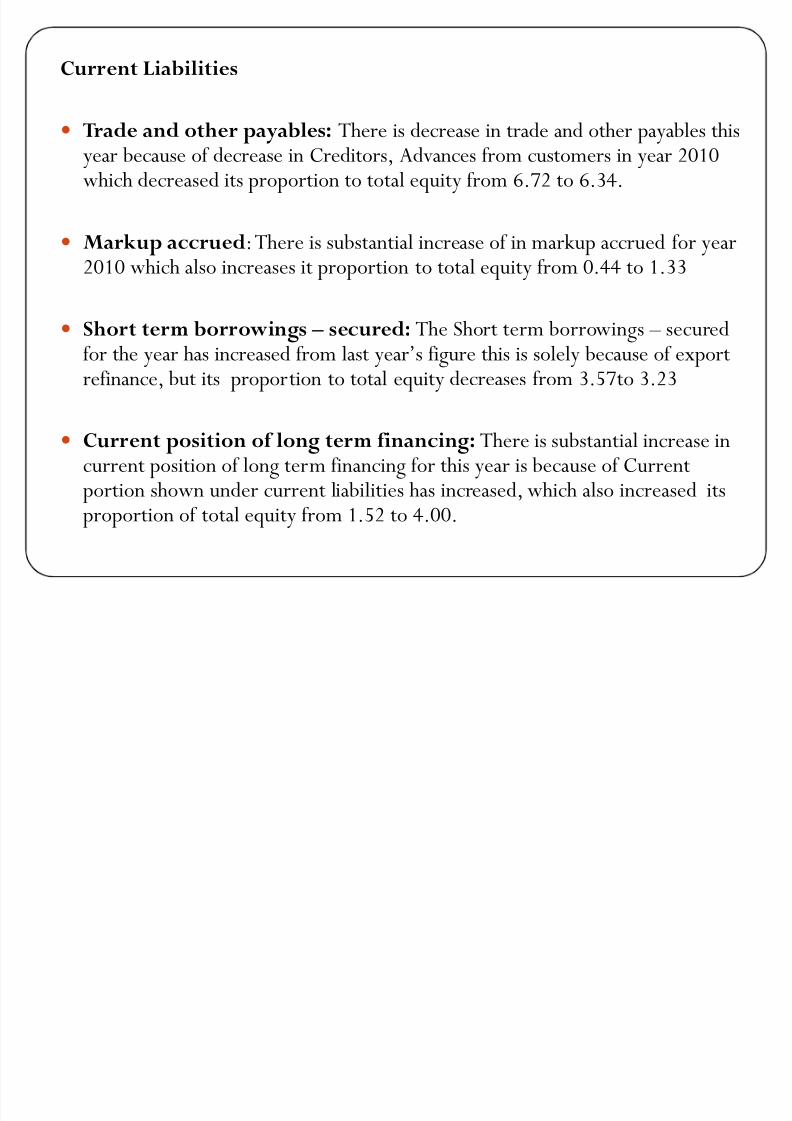
Current Liabilities
y Trade and othe
rpayables:
T
here is decrease in trade and other payables thisyear because of decrease in Creditors, Advances from customers in year 2010which decreased its proportion to total equity from 6.72 to 6.34.
y Markup accrued:There is substantial increase of in markup accrued for year2010 which also increases it proportion to total equity from 0.44 to 1.33
y Short term borrowings ² secured: The Short term borrowings ² securedfor the year has increased from last year·s figure this is solely because of exportrefinance, but its proportion to total equity decreases from 3.57to 3.23
y Current position of long term financing: There is substantial increase incurrent position of long term financing for this year is because of Currentportion shown under current liabilities has increased, which also increased itsproportion of total equity from 1.52 to 4.00.
8/7/2019 AFS Presentation125
http://slidepdf.com/reader/full/afs-presentation125 37/49
Non-Current Assets
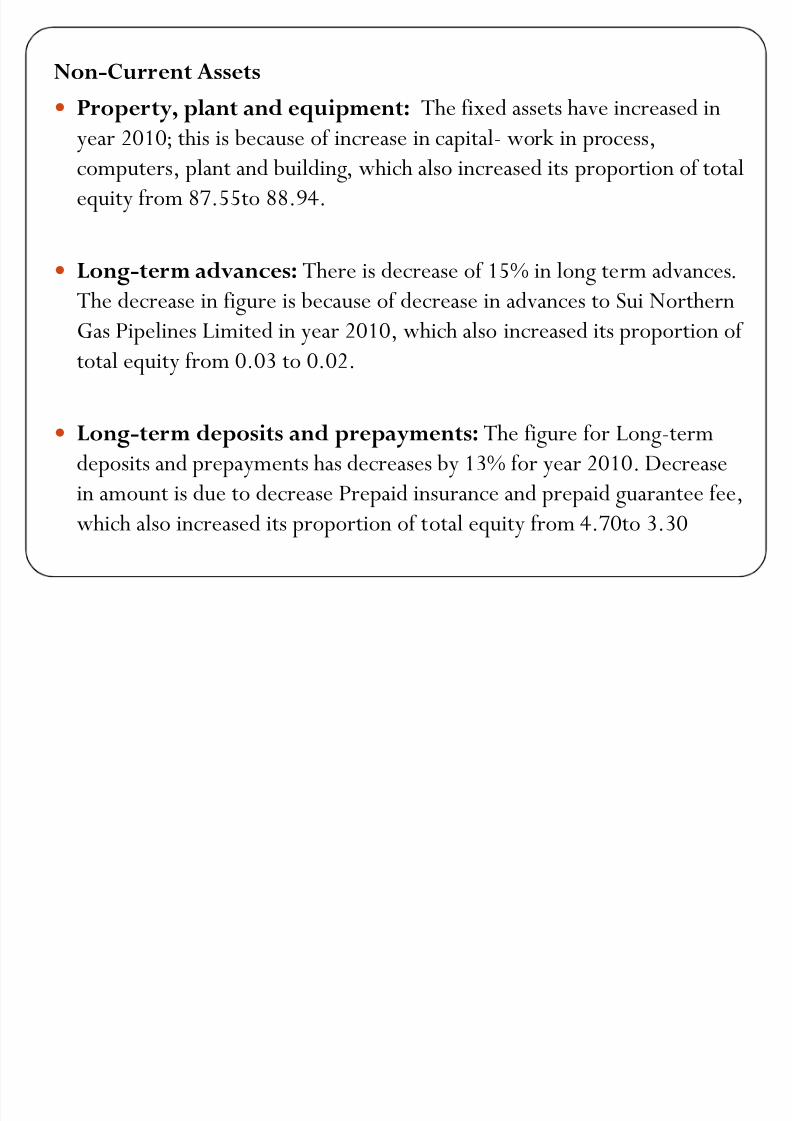
y Property, plant and equipment: The fixed assets have increased in
year 2010; this is because of increase in capital- work in process,computers, plant and building, which also increased its proportion of total
equity from 87.55to 88.94.
y
Long-term advances:T
here is decrease of 15
% in long term advances.
The decrease in figure is because of decrease in advances to Sui Northern
Gas Pipelines Limited in year 2010, which also increased its proportion of
total equity from 0.03 to 0.02.
y Long-term deposits and prepayments: The figure for Long-term
deposits and prepayments has decreases by 13% for year 2010. Decrease
in amount is due to decrease Prepaid insurance and prepaid guarantee fee,
which also increased its proportion of total equity from 4.70to 3.30
8/7/2019 AFS Presentation125
http://slidepdf.com/reader/full/afs-presentation125 38/49
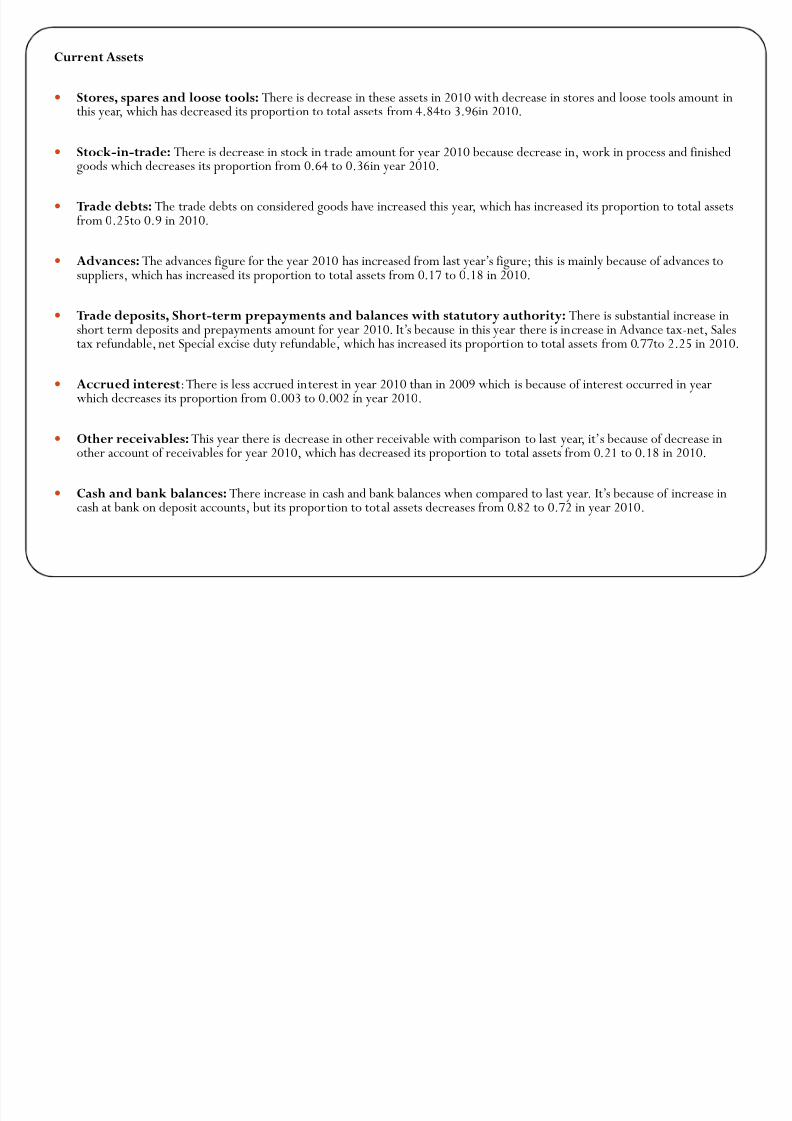
Current Assets
y Stores, spares and loose tools: There is decrease in these assets in 2010 with decrease in stores and loose tools amount inthis year, which has decreased its proportion to total assets from 4.84to 3.96in 2010.
y Stock-in-trade: There is decrease in stock in trade amount for year 2010 because decrease in, work in process and finishedgoods which decreases its proportion from 0.64 to 0.36in year 2010.
y Trade debts: The trade debts on considered goods have increased this year, which has increased its proportion to total assetsfrom 0.25to 0.9 in 2010.
y Advances: The advances figure for the year 2010 has increased from last year·s figure; this is mainly because of advances to
suppliers, which has increased its proportion to total assets from 0.
17
to 0.
18 in 2010.
y Trade deposits, Short-term prepayments and balances with statutory authority: There is substantial increase inshort term deposits and prepayments amount for year 2010. It·s because in this year there is increase in Advance tax-net, Salestax refundable, net Special excise duty refundable, which has increased its proportion to total assets from 0.77to 2.25 in 2010.
y Accrued interest:There is less accrued interest in year 2010 than in 2009 which is because of interest occurred in yearwhich decreases its proportion from 0.003 to 0.002 in year 2010.
y Other receivables: This year there is decrease in other receivable with comparison to last year, it·s because of decrease inother account of receivables for year 2010, which has decreased its proportion to total assets from 0.21 to 0.18 in 2010.
y Cash and bank balances: There increase in cash and bank balances when compared to last year. It·s because of increase incash at bank on deposit accounts, but its proportion to total assets decreases from 0.82 to 0.72 in year 2010.
8/7/2019 AFS Presentation125
http://slidepdf.com/reader/full/afs-presentation125 39/49
8/7/2019 AFS Presentation125
http://slidepdf.com/reader/full/afs-presentation125 40/49
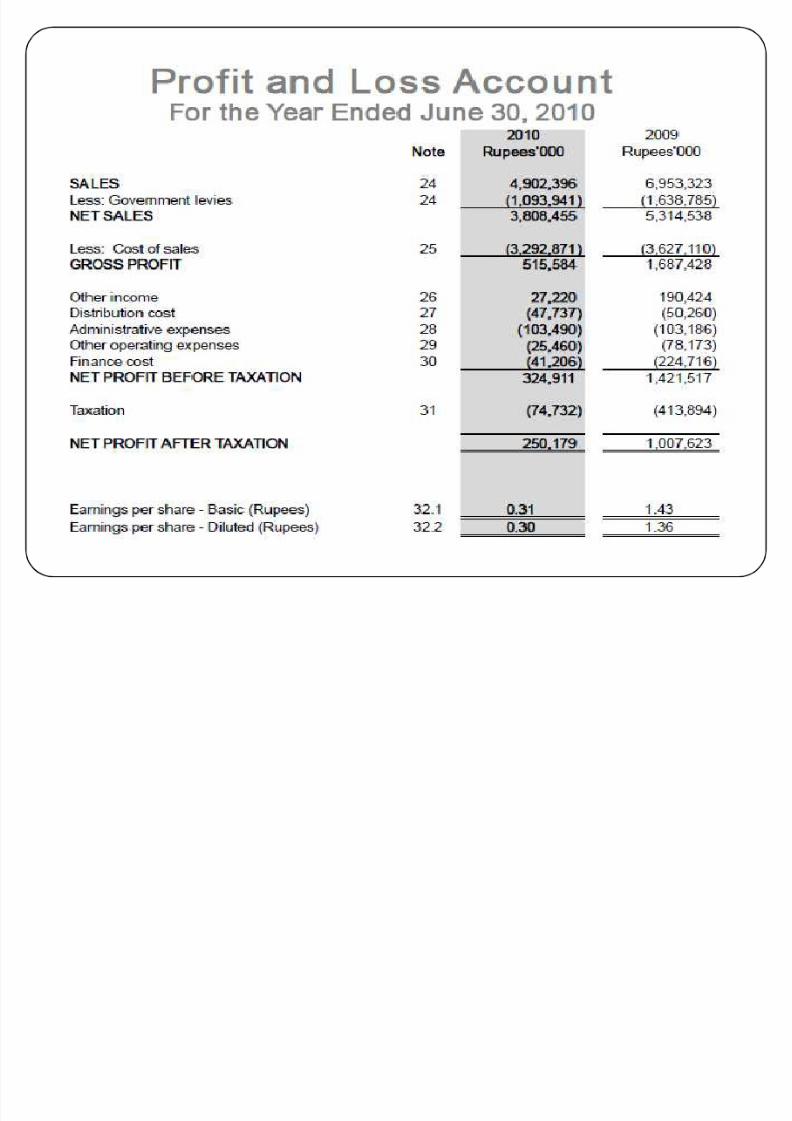
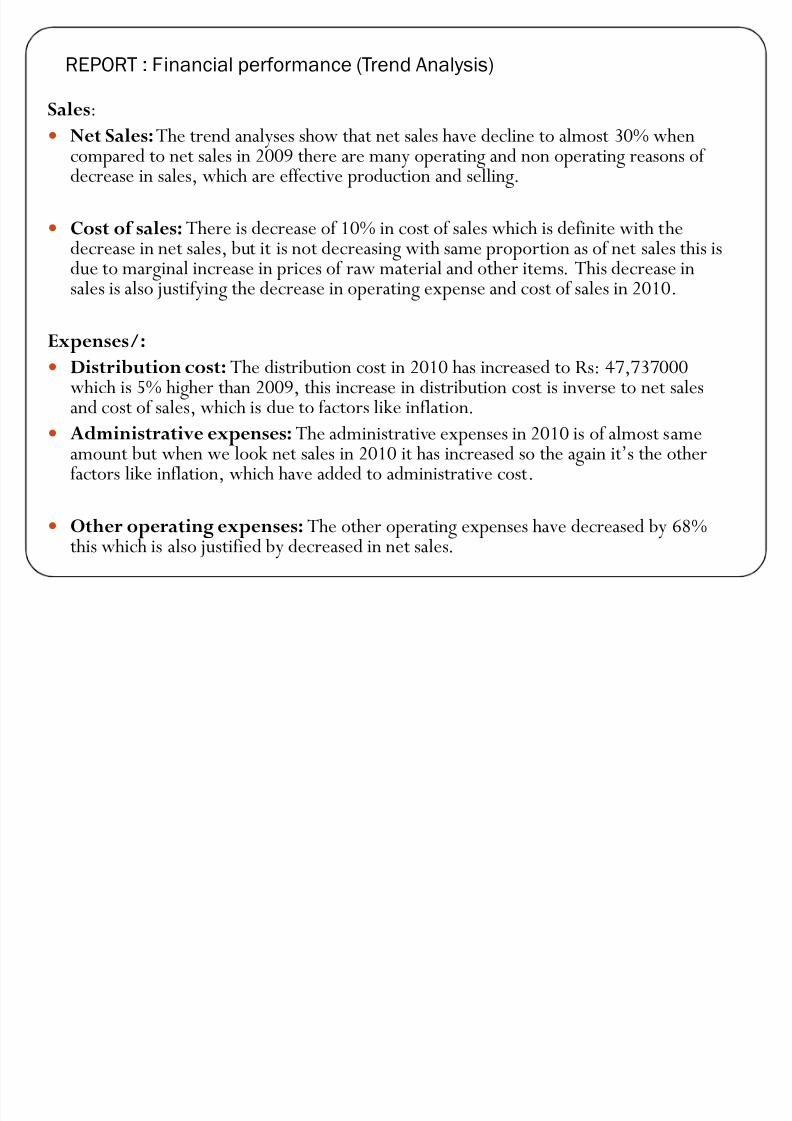
Sales:
y N
et Sales:T
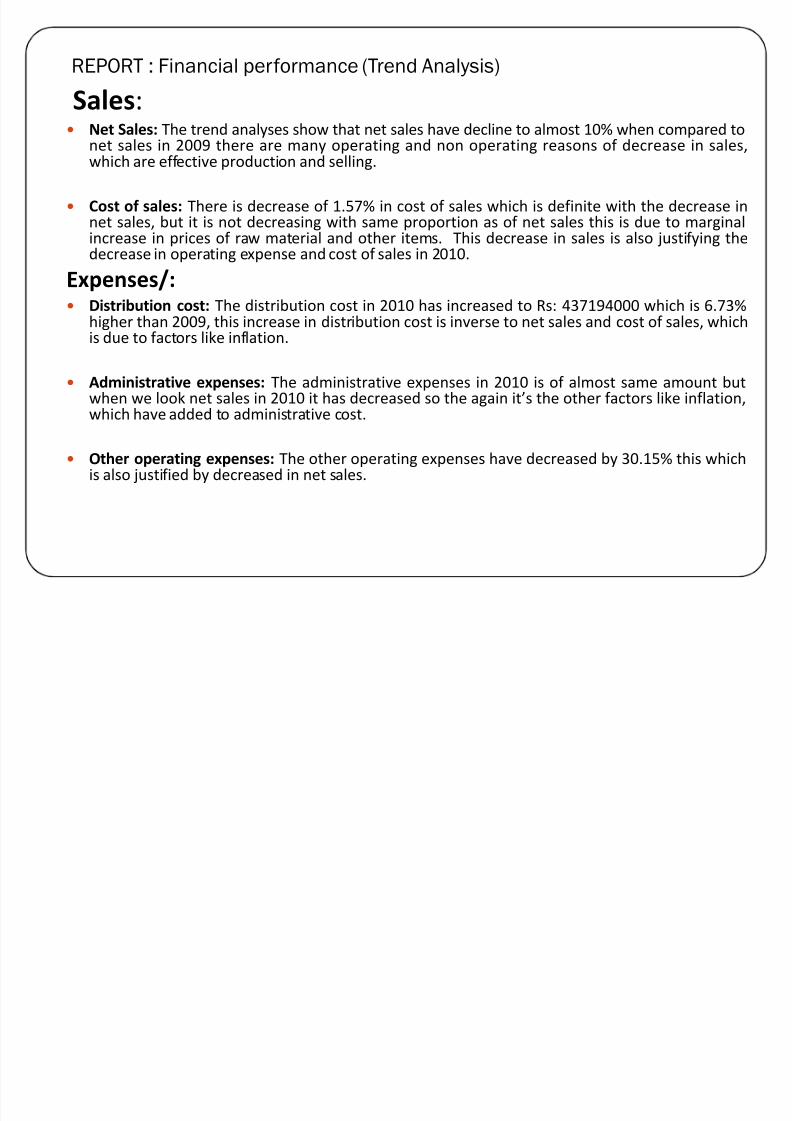
he trend analyses show that net sales have decline to almost30% whencompared to net sales in 2009 there are many operating and non operating reasons of
decrease in sales, which are effective production and selling.
y Cost of sales: There is decrease of 10% in cost of sales which is definite with thedecrease in net sales, but it is not decreasing with same proportion as of net sales this isdue to marginal increase in prices of raw material and other items. This decrease insales is also justifying the decrease in operating expense and cost of sales in 2010.
Expenses/:
y Distribution cost: The distribution cost in 2010 has increased to Rs: 47,737000which is 5% higher than 2009, this increase in distribution cost is inverse to net salesand cost of sales, which is due to factors like inflation.
y Administrative expenses:The administrative expenses in 2010 is of almost sameamount but when we look net sales in 2010 it has increased so the again it·s the otherfactors like inflation, which have added to administrative cost.
y Other operating expenses: The other operating expenses have decreased by 68%this which is also justified by decreased in net sales.
REPORT : Financial performance (Trend Analysis)
8/7/2019 AFS Presentation125
http://slidepdf.com/reader/full/afs-presentation125 41/49
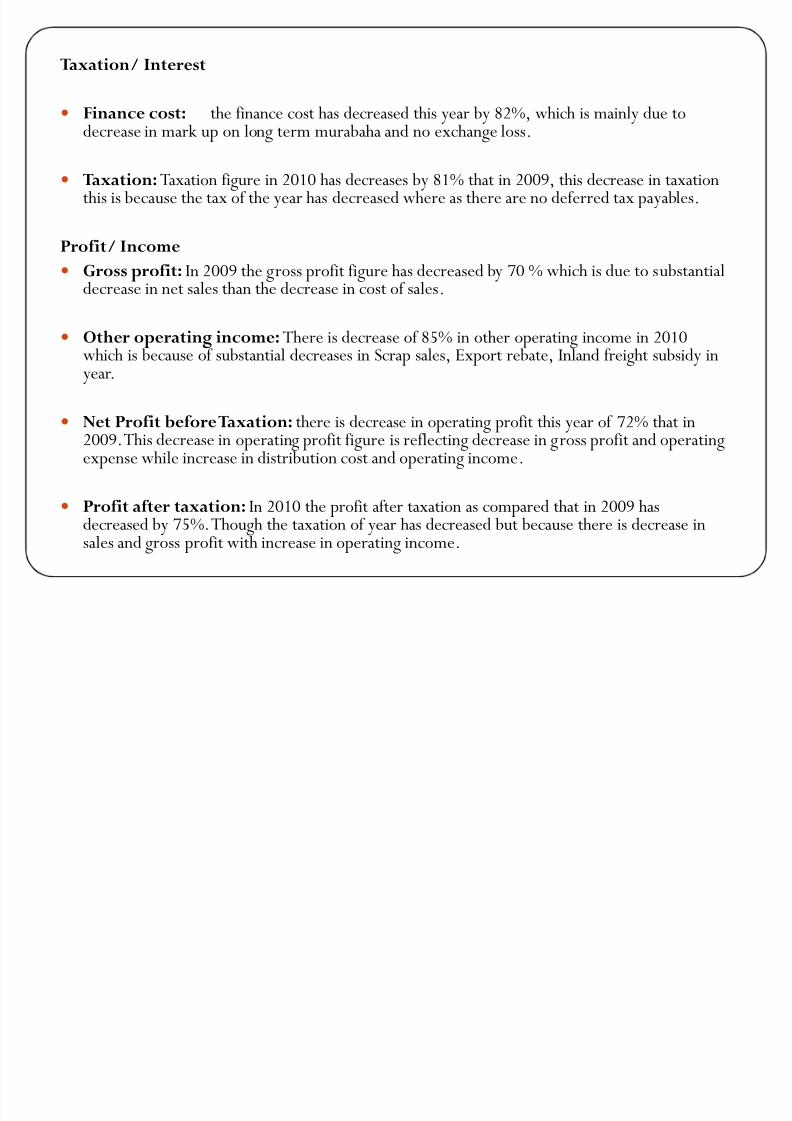
Taxation/ Interest
y Finance cost: the finance cost has decreased this year by 82%, which is mainly due todecrease in mark up on long term murabaha and no exchange loss.
y Taxation:Taxation figure in 2010 has decreases by 81% that in 2009, this decrease in taxationthis is because the tax of the year has decreased where as there are no deferred tax payables.
Profit/ Income
y Gross profit: In 2009 the gross profit figure has decreased by 70 % which is due to substantialdecrease in net sales than the decrease in cost of sales.
y Other operating income:There is decrease of 85% in other operating income in 2010which is because of substantial decreases in Scrap sales, Export rebate, Inland freight subsidy inyear.
y Net Profit beforeTaxation: there is decrease in operating profit this year of 72% that in2009. This decrease in operating profit figure is reflecting decrease in gross profit and operatingexpense while increase in distribution cost and operating income.
y Profit after taxation: In 2010 the profit after taxation as compared that in 2009 hasdecreased by 75%. Though the taxation of year has decreased but because there is decrease insales and gross profit with increase in operating income.
8/7/2019 AFS Presentation125
http://slidepdf.com/reader/full/afs-presentation125 42/49
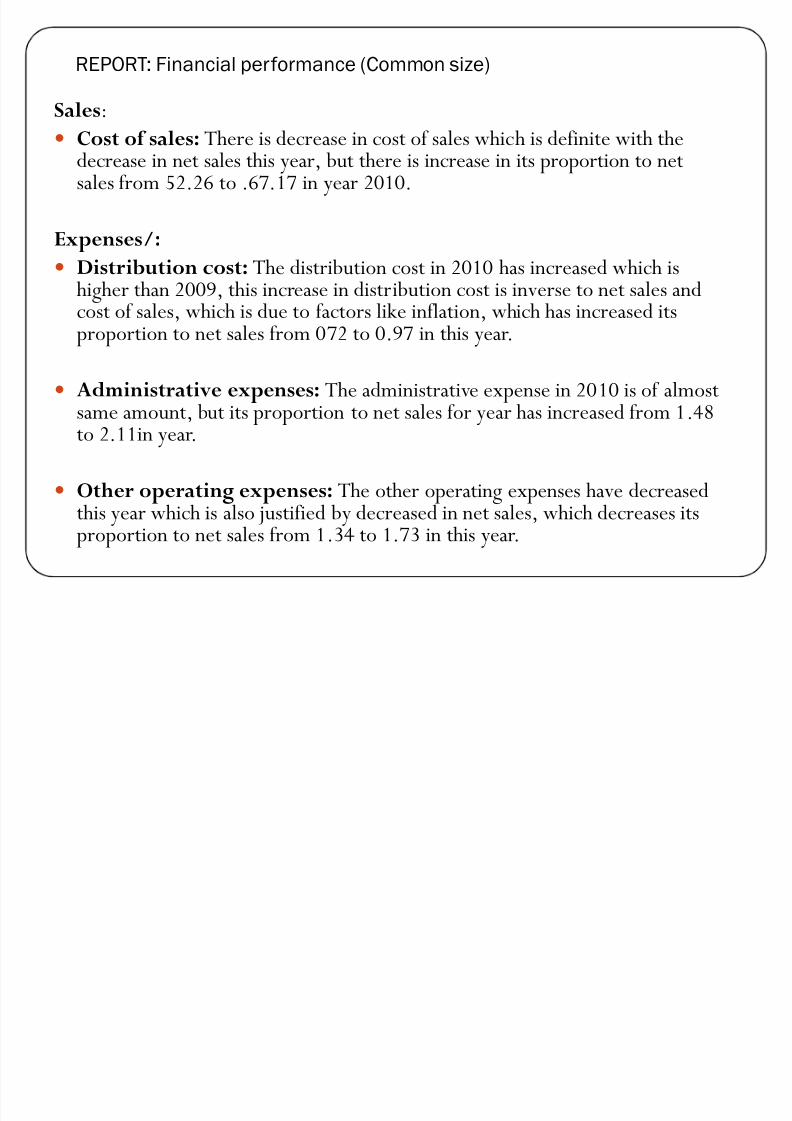
Sales:
y
Cost of sales: There is decrease in cost of sales which is definite with thedecrease in net sales this year, but there is increase in its proportion to netsales from 52.26 to .67.17 in year 2010.
Expenses/:
y Distribution cost: The distribution cost in 2010 has increased which ishigher than 2009, this increase in distribution cost is inverse to net sales andcost of sales, which is due to factors like inflation, which has increased itsproportion to net sales from 072 to 0.97 in this year.
y Administrative expenses: The administrative expense in 2010 is of almost
same amount, but its proportion to net sales for year has increased from 1.4
8to 2.11in year.
y Other operating expenses: The other operating expenses have decreasedthis year which is also justified by decreased in net sales, which decreases itsproportion to net sales from 1.34 to 1.73 in this year.
REPORT: Financial performance (Common size)
8/7/2019 AFS Presentation125
http://slidepdf.com/reader/full/afs-presentation125 43/49
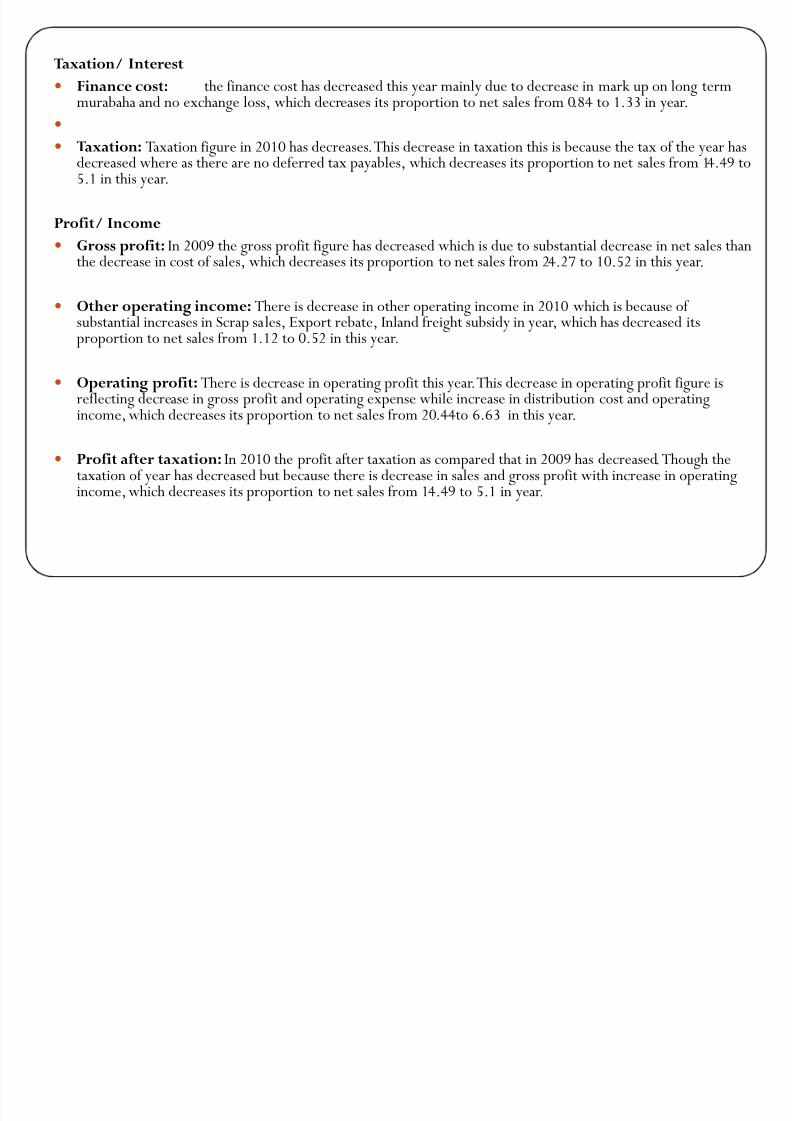
Taxation/ Interest
y Finance cost: the finance cost has decreased this year mainly due to decrease in mark up on long termmurabaha and no exchange loss, which decreases its proportion to net sales from 0.84 to 1.33 in year.
y
y Taxation: Taxation figure in 2010 has decreases. This decrease in taxation this is because the tax of the year hasdecreased where as there are no deferred tax payables, which decreases its proportion to net sales from 14.49 to5.1 in this year.
Profit/ Income
y Gross profit: In 2009 the gross profit figure has decreased which is due to substantial decrease in net sales thanthe decrease in cost of sales, which decreases its proportion to net sales from 24.27 to 10.52 in this year.
y Other operating income: There is decrease in other operating income in 2010 which is because of substantial increases in Scrap sales, Export rebate, Inland freight subsidy in year, which has decreased itsproportion to net sales from 1.12 to 0.52 in this year.
y Operating profit: There is decrease in operating profit this year. This decrease in operating profit figure isreflecting decrease in gross profit and operating expense while increase in distribution cost and operating
income, which decreases its proportion to net sales from 20.44
to6.63
in this year.
y Profit after taxation: In 2010 the profit after taxation as compared that in 2009 has decreased. Though thetaxation of year has decreased but because there is decrease in sales and gross profit with increase in operatingincome, which decreases its proportion to net sales from 14.49 to 5.1 in year.
8/7/2019 AFS Presentation125
http://slidepdf.com/reader/full/afs-presentation125 44/49
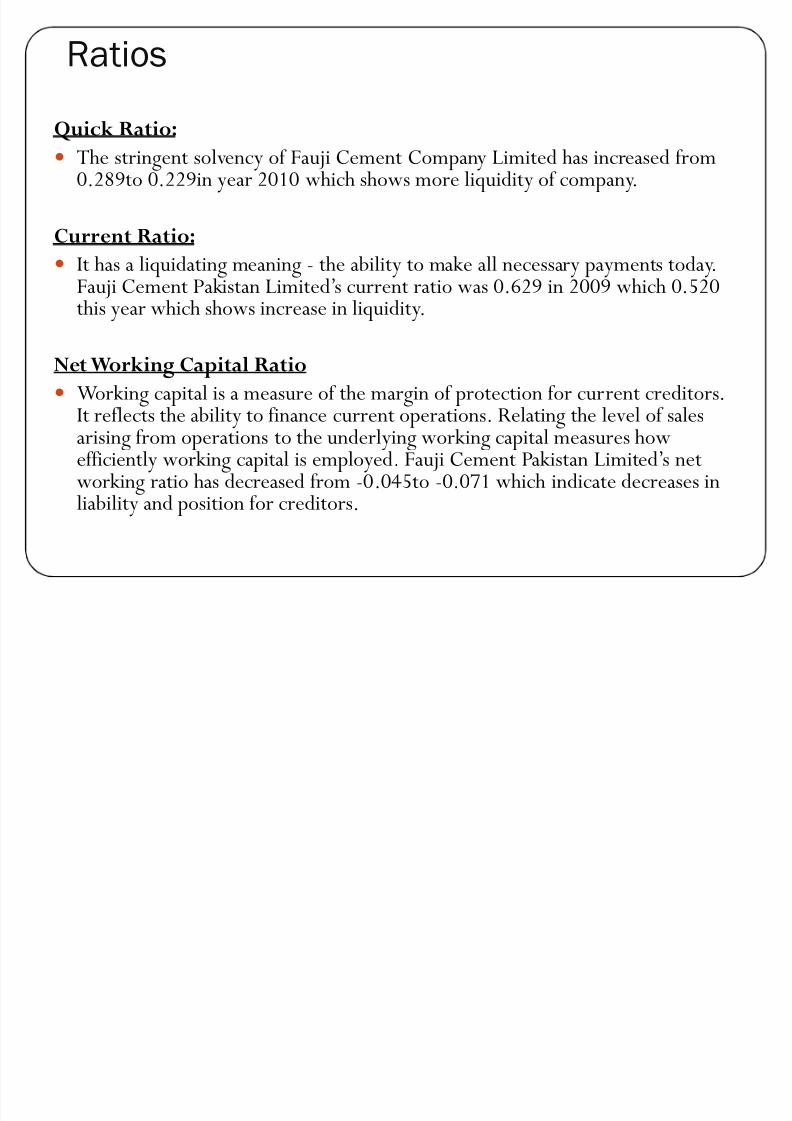
Ratios
Quick Ratio:
y The stringent solvency of Fauji Cement Company Limited has increased from0.289to 0.229in year 2010 which shows more liquidity of company.
Current Ratio:
y It has a liquidating meaning - the ability to make all necessary payments today.
Fauji Cement Pakistan Limited·s current ratio was 0.629 in 2009 which 0.520this year which shows increase in liquidity.
Net Working Capital Ratio
y Working capital is a measure of the margin of protection for current creditors.
It reflects the ability to finance current operations. Relating the level of salesarising from operations to the underlying working capital measures howefficiently working capital is employed. Fauji Cement Pakistan Limited·s networking ratio has decreased from -0.045to -0.071 which indicate decreases inliability and position for creditors.
8/7/2019 AFS Presentation125
http://slidepdf.com/reader/full/afs-presentation125 45/49
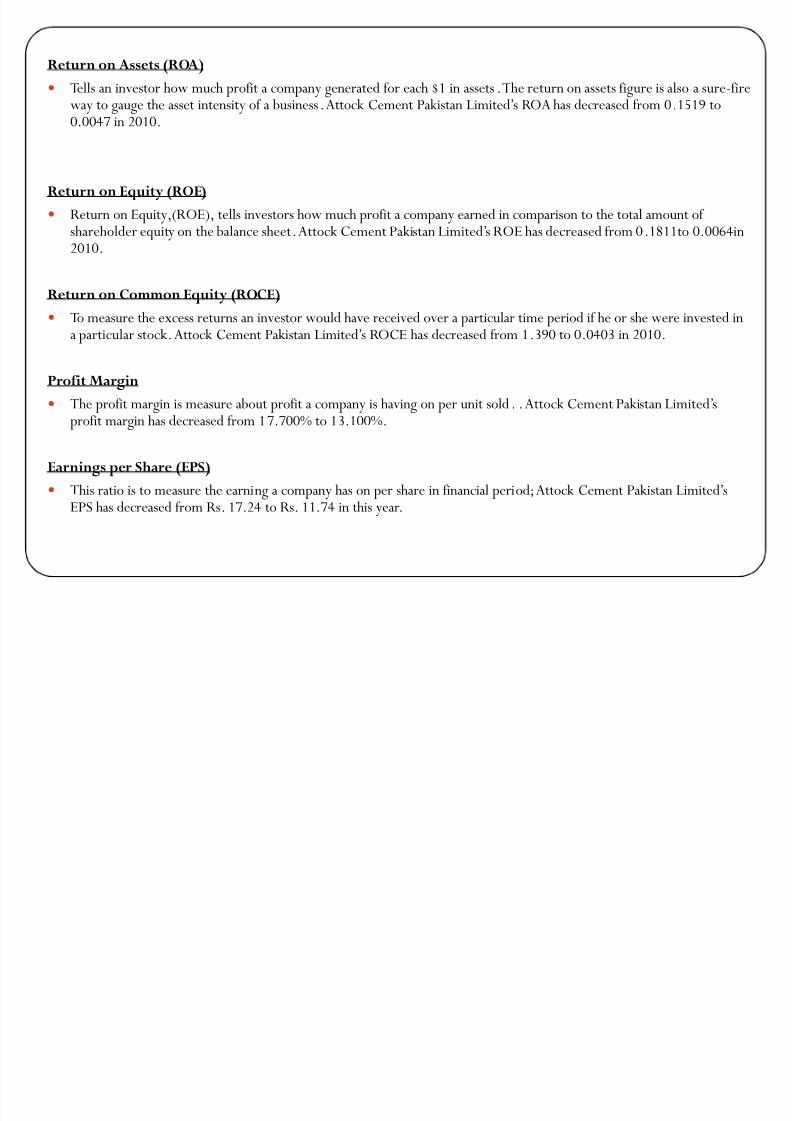
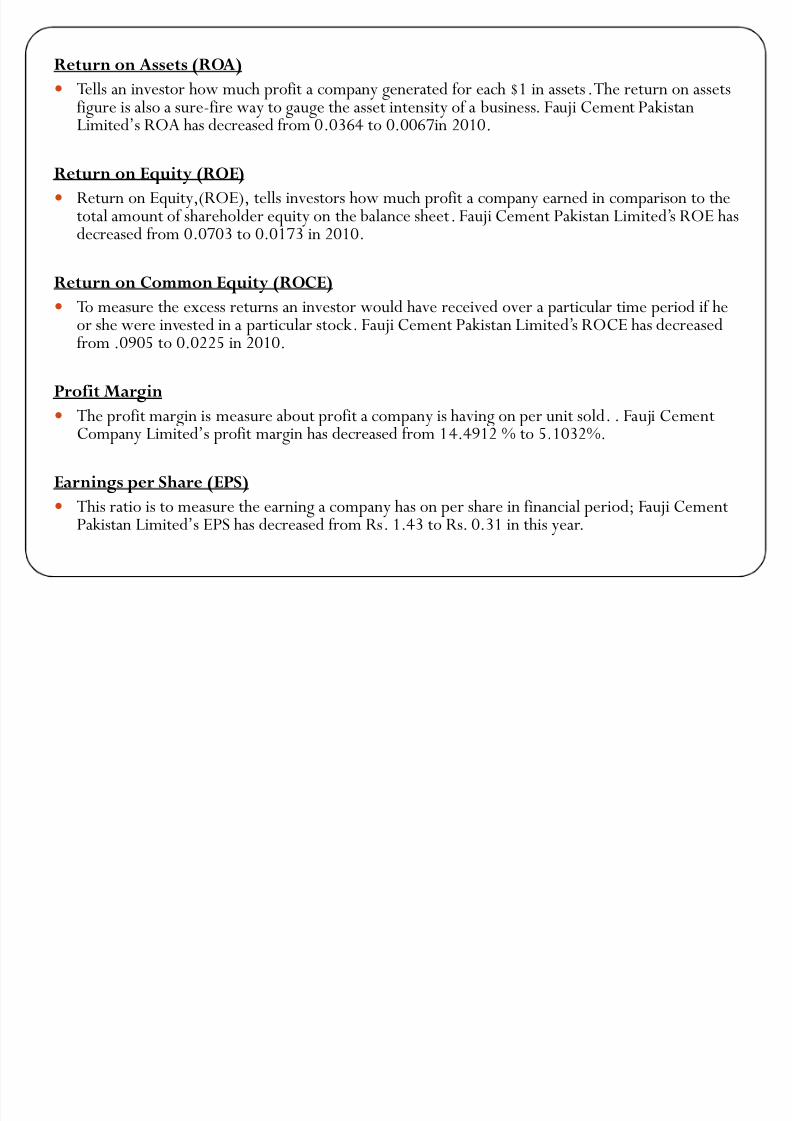
Return on Assets (ROA)
y Tells an investor how much profit a company generated for each $1 in assets. The return on assetsfigure is also a sure-fire way to gauge the asset intensity of a business. Fauji Cement PakistanLimited·s ROA has decreased from 0.0364 to 0.0067in 2010.
Return on Equity (ROE)
y Return on Equity,(ROE), tells investors how much profit a company earned in comparison to thetotal amount of shareholder equity on the balance sheet. Fauji Cement Pakistan Limited·s ROE hasdecreased from 0.0703 to 0.0173 in 2010.
Return on Common Equity (ROCE)y To measure the excess returns an investor would have received over a particular time period if he
or she were invested in a particular stock. Fauji Cement Pakistan Limited·s ROCE has decreasedfrom .0905 to 0.0225 in 2010.
Profit Margin
y The profit margin is measure about profit a company is having on per unit sold
. .
Fauji CementCompany Limited·s profit margin has decreased from 14.4912 % to 5.1032%.
Earnings per Share (EPS)
y This ratio is to measure the earning a company has on per share in financial period; Fauji CementPakistan Limited·s EPS has decreased from Rs. 1.43 to Rs. 0.31 in this year.
8/7/2019 AFS Presentation125
http://slidepdf.com/reader/full/afs-presentation125 46/49
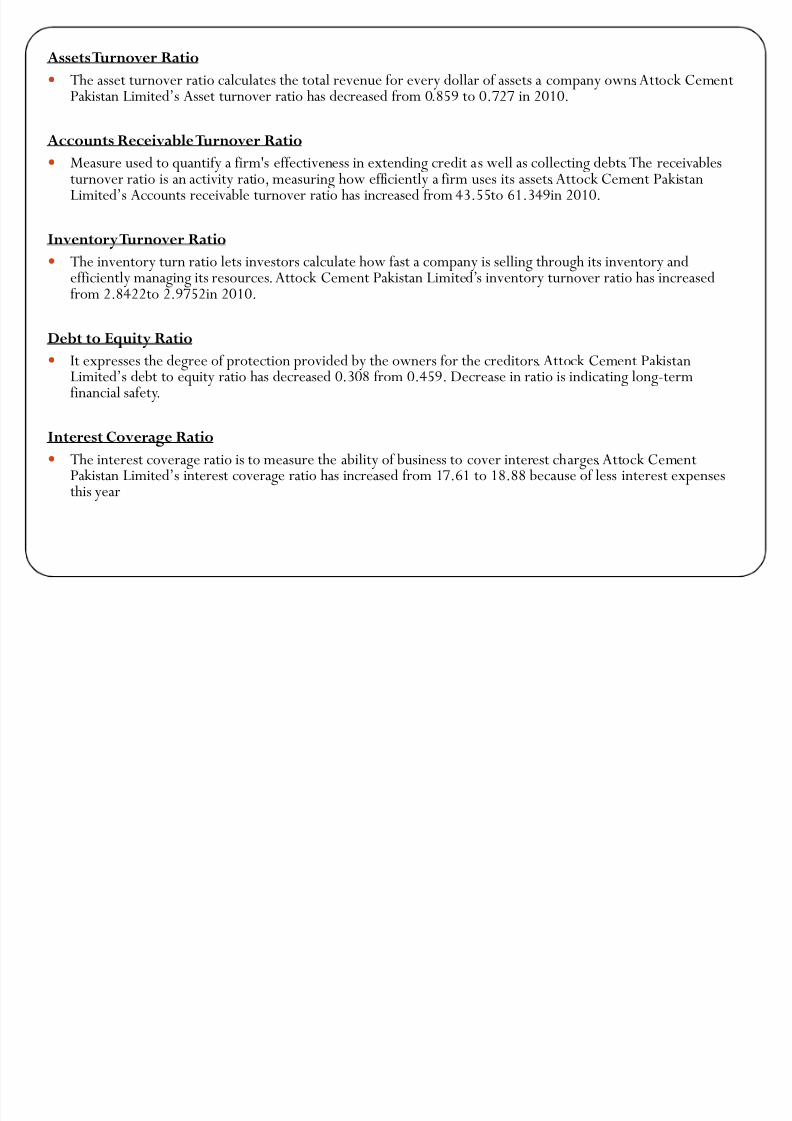
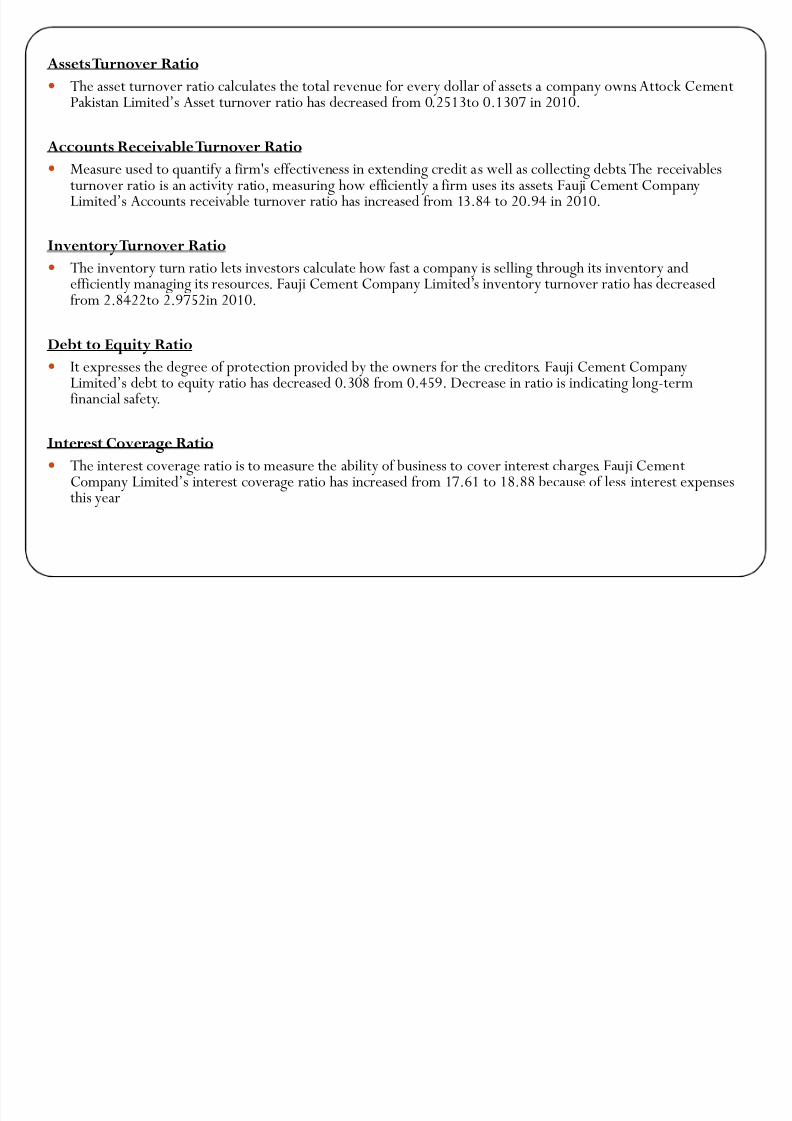
AssetsTurnover Ratio
y The asset turnover ratio calculates the total revenue for every dollar of assets a company owns.Attock CementPakistan Limited·s Asset turnover ratio has decreased from 0.2513to 0.1307 in 2010.
Accounts Receivable Turnover Ratioy Measure used to quantify a firm's effectiveness in extending credit as well as collecting debts.The receivables
turnover ratio is an activity ratio, measuring how efficiently a firm uses its assets. Fauji Cement CompanyLimited·s Accounts receivable turnover ratio has increased from 13.84 to 20.94 in 2010.
InventoryTurnover Ratio
y The inventory turn ratio lets investors calculate how fast a company is selling through its inventory and
efficiently managing its resources. Fauji Cement Company Limited·s inventory turnover ratio has decreasedfrom 2.8422to 2.9752in 2010.
Debt to Equity Ratio
y It expresses the degree of protection provided by the owners for the creditors. Fauji Cement CompanyLimited·s debt to equity ratio has decreased 0.308 from 0.459. Decrease in ratio is indicating long-termfinancial safety.
Interest Coverage Ratio
y The interest coverage ratio is to measure the ability of business to cover interest charges. Fauji CementCompany Limited·s interest coverage ratio has increased from 17.61 to 18.88 because of less interest expensesthis year
8/7/2019 AFS Presentation125
http://slidepdf.com/reader/full/afs-presentation125 47/49
8/7/2019 AFS Presentation125
http://slidepdf.com/reader/full/afs-presentation125 48/49
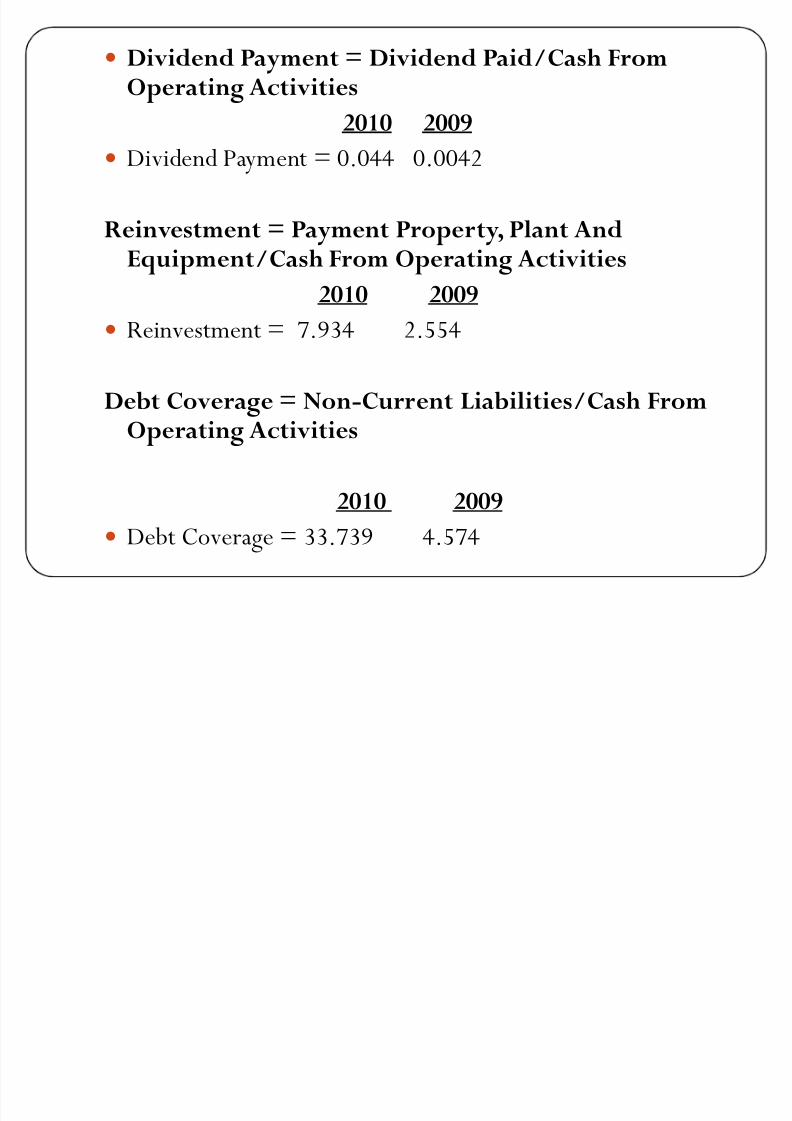
y Dividend Payment = Dividend Paid/Cash FromOperating Activities
2010 2009
y Dividend Payment = 0.044 0.0042
Reinvestment = Payment Property, Plant AndEquipment/Cash From Operating Activities
2010 2009
y Reinvestment = 7.934 2.554
Debt Coverage = Non-Current Liabilities/Cash FromOperating Activities
2010 2009
y Debt Coverage = 33.739 4.574

8/7/2019 AFS Presentation125
http://slidepdf.com/reader/full/afs-presentation125 49/49
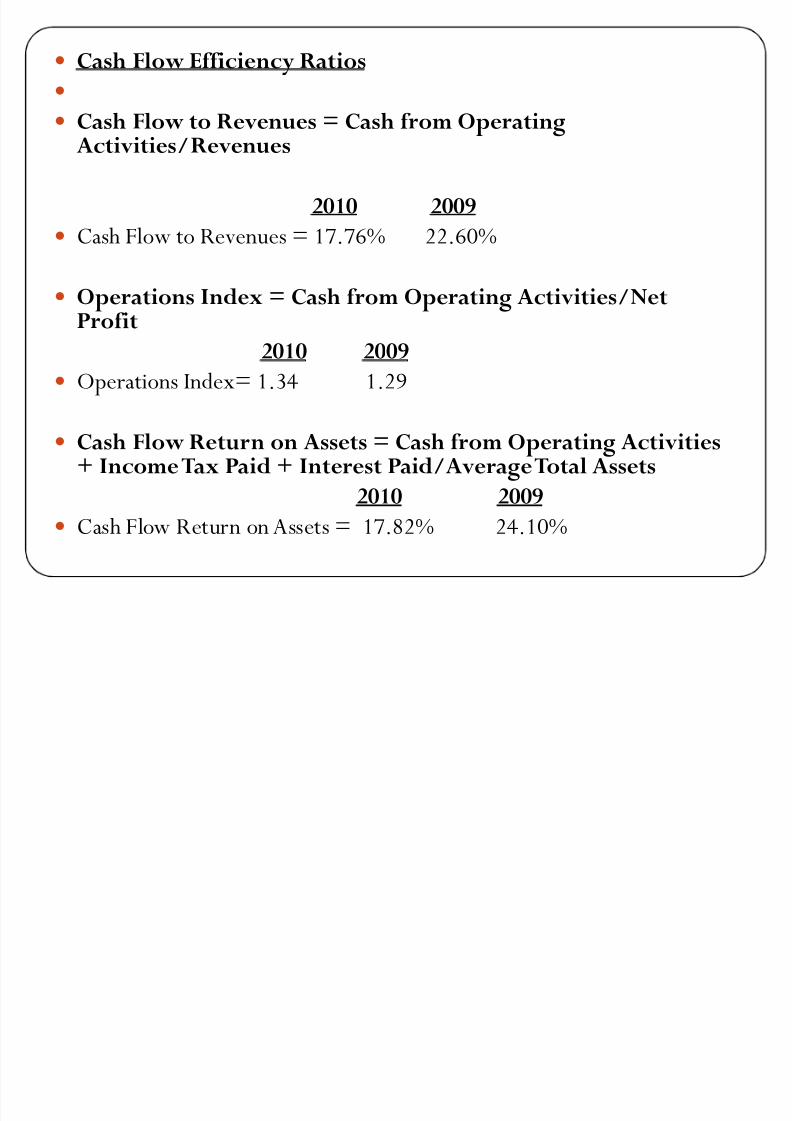
y Cash Flow Efficiency Ratios
y
y Cash Flow to Revenues = Cash f rom Operating
Activities/Revenues
2010 2009
y Cash Flow to Revenues =7.729% 28.702%
y Operations Index = Cash f rom Operating Activities/NetProfit
2010 2009
y Operations Index= 1.515 1.981
y Cash Flow Return on Assets = Cash f rom Operating Activities+ Income Tax Paid + Interest Paid/AverageTotal Assets
2010 2009
y Cash Flow Return on Assets = 1.402% 8.397%