agnes_benassy-quere
DESCRIPTION
AgnèsBénassy-Quéré GIC-Club du CEPII-Barclays, May 13 2008 1 1. Fundamentals 2 2 1, A forward-lookingmodel a ttttt ( ) f E a i i E e E e t t f a e i i e 1111, ++++++ −−−== tttEttttt Ω = 2* ktkttt ttE 11,0 Rational expectations: ω Y P with Monetary policy Long termPortfoliochoices,foreignimbalances tt a tt ∞+ ,0 ,0 33 0 2 0 * * ∞ ∞ Monetarypolicy: euro/dollar 44 Otherfactors: euro/dollar 55 2. Equilibrium exchange rates 6TRANSCRIPT

1
Where are key currencies going?
Agnès Bénassy-QuéréGIC-Club du CEPII-Barclays, May 13 2008

2
1. Fundamentals

33
A forward-looking model
( )ttEa
ttttt faeiie ωσ −−+−= + ,02
1,*
tt
tt YP
Ω=ωwith
Rational expectations:
( ) ( ) ( )11,02*
1111, ++++++ −−−== tttEttttta
tt fEaiiEeEe ωσ
( ) ( ) ∞+
∞
=++
∞
=++ +−−−= ∑∑ tt
kktkttE
kktkttt eEfEaiiEe
0,0
2
0
* ωσ
Monetary policy Long termPortfolio choices, foreign imbalances

44
Monetary policy: euro/dollar
55
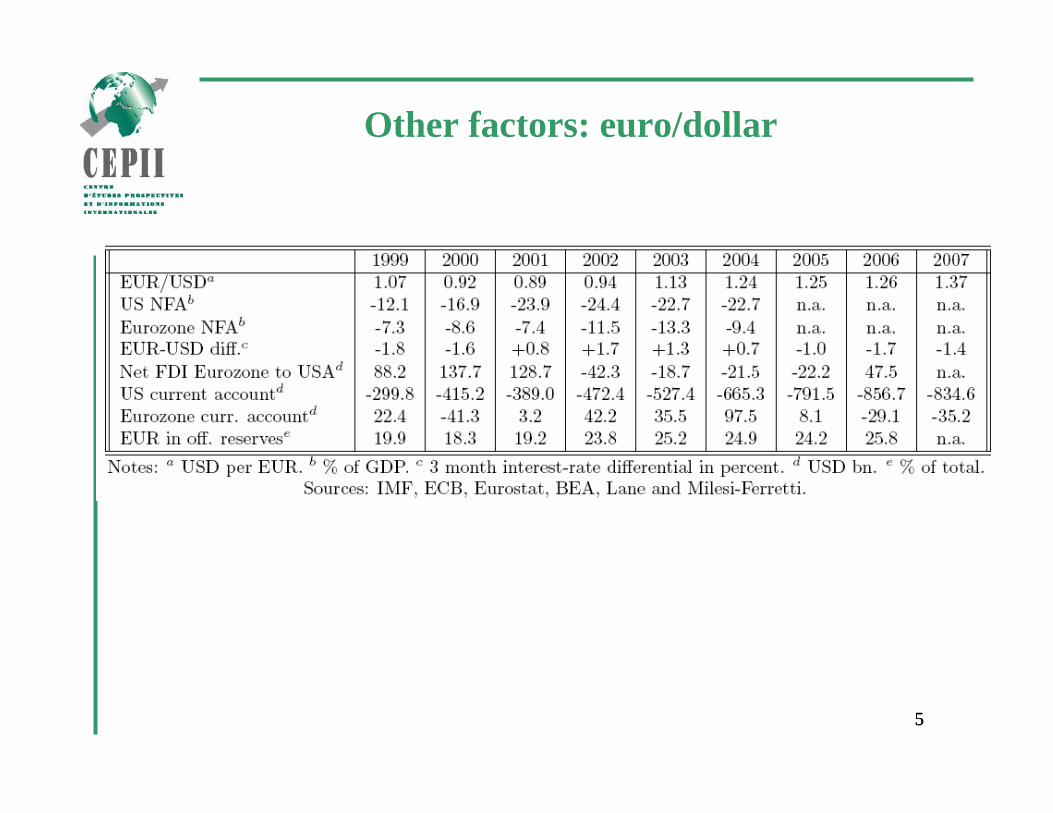
Other factors: euro/dollar

6
2. Equilibrium exchange rates
7
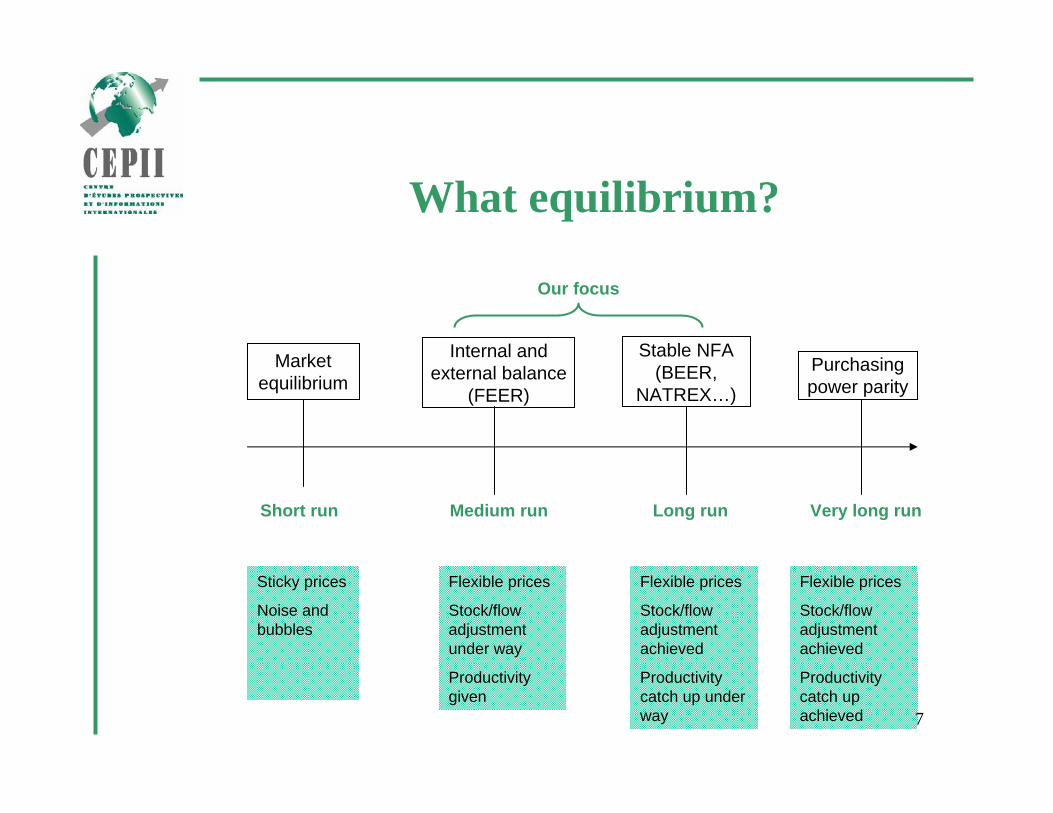
What equilibrium?
Sticky prices
Noise and bubbles
Flexible prices
Stock/flow adjustment under way
Productivity given
Flexible prices
Stock/flow adjustment achieved
Productivity catch up under way
Flexible prices
Stock/flow adjustment achieved
Productivity catch up achieved
Purchasingpower parity
Stable NFA (BEER,
NATREX…)
Internal and external balance
(FEER)
Marketequilibrium
Short run Medium run Long run Very long run
Our focus

8
Equilibrium net foreign asset positions
1980-2005
15 countries or zones (« G20 »):
Euro area, Japan, United States, UK,
Australia, Canada, Korea,
Argentina, Brazil, Mexico
China, India, Indonesia,
Turkey, South Africa
9
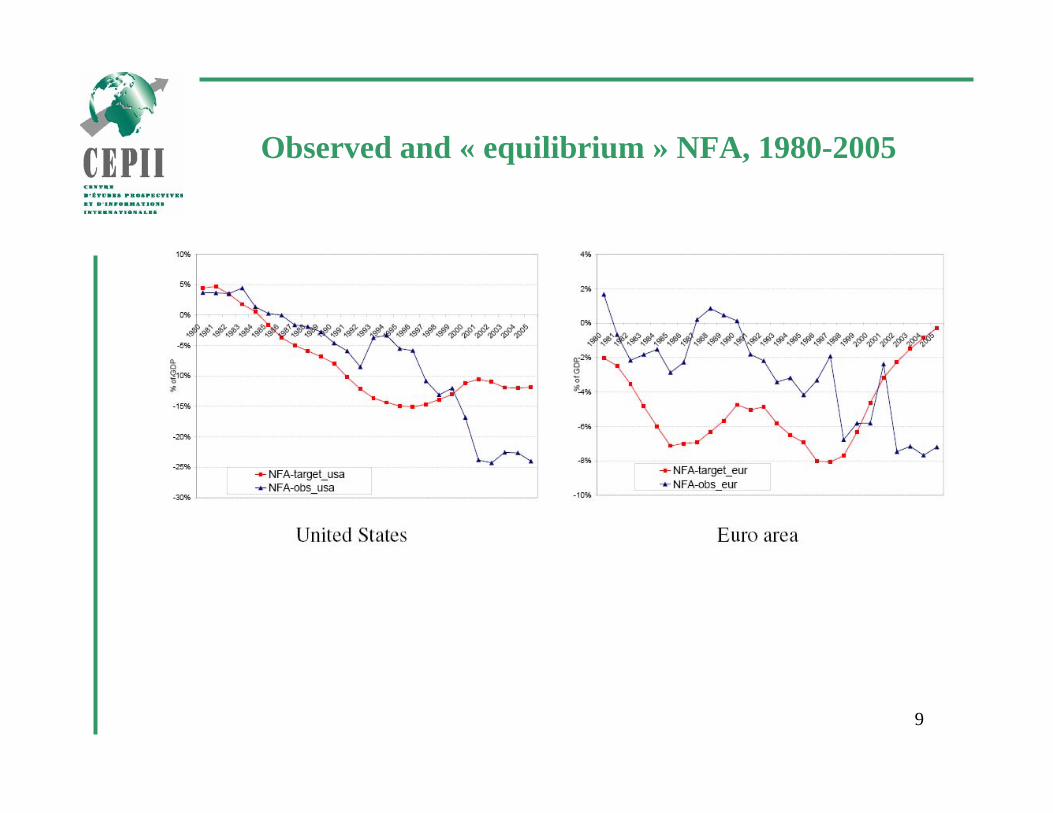
Observed and « equilibrium » NFA, 1980-2005

10
Observed and « equilibrium » NFA, 2005

11
Two concepts of equilibrium
Estimated equation: Q = f(NFA, TOT, PROD)
→ BEER*: predicted Q with equilibrium NFA
→ FEER**: Q consistent with NFA converging to equilibrium in T years
BEER
Status quo
FEER
* BEER for Behavioural Equilibrium Exchange Rate. (MacDonald, 1997; Clark&MacDonald, 1998).
** FEER for Fundamental Equilibrium Exchange Rate (Williamson, 1984).

12
Current account targets, 2005
Underlying Targets*Current account CA 1 CA 2 CA 3
Canada 0.1 1.1 -2.1 -0.8Euro area -1.4 -0.2 1.4 4.5Japan 4.3 1.1 -6.0 -4.3UK -1.6 -2.6 2.6 8 .1USA -5.9 -3.0 2.7 -0.7Argentina 5.3 -1.5 2.4 3.8Australia -6.9 -2.2 2.1 3.1Brazil 0.1 -1.5 1.0 1.4China 10.0 2.6 -6.2 -5.6India -1.3 -0.7 -3.7 -8.8Indonesia 2.0 -0.7 -3.6 1.7Korea -1.0 -0.5 -2.7 -2.1Mexico -1.2 -1.5 0.5 0.8South Africa -3.0 -1.5 -1.7 -0.9Turkey -4.6 -2.2 -1.4 -1.1* CA 1: Williamson (2006) for USA. Canada. Japan. euro area. UK. Korea and China; IMF(2006) for other countries. CA 2: current account that would make the NFA converge to itsequilibrium level in 5 years. CA 3: idem CA 2 with 20% krash in US asset prices.Source: Bénassy-Quéré et al. (2008).

13
Real effective misalignments in 2005(+ = undervalued)
BEER FEER 1 FEER 2 FEER 3 FEER 2’Canada 5.8 -4.1 9.1 3.7 2.7Euro area -4.7 -9.3 -21.8 -46.9 -6.3Japan 2.1 33.4 108.0 89.8 31.7UK -12.1 6.0 -25.2 -58.3 -6.6USA -2.1 -48.5 -142.9 -86.2 -30.6Argentina 63.3 89.7 38.5 19.4 8.5Australia 1.4 -40.1 -76.9 -85.4 -20.5Brazil -27.1 30.6 -18.5 -25.0 -4.2China 22.3 73.9 161.7 156.2 31.1India 5.9 -36.2 152.4 47.3 29.0Indonesia 10.1 30.4 63.3 3.5 11.6Korea -15.9 -5.4 16.7 10.1 2.8Mexico -14.2 -43.9 -27.6 -32.1 -3.8South Africa 2.0 -22.4 -19.9 -31.9 -3.0Turkey 0.5 -52.9 -70.5 -77.2 -7.6Note: a positive sign refers to an under-valued currency compared to equilibrium.
Source: Bénassy-Quéré et al. (2008).

14
Bilateral euro/dollar misalignment at end 2007
Misalignmentin 2005 (%)
RER variation2005-2007(%)
Misalignmentin 2007 (%)
EUR/USDdec. 2007
Equilibriumexchange rate
EUR/USD dec. 2007BEER -5.9 -14.8 -20.7 1 .45 1.15FEER 1 25.0 -14.8 10.2 1 .45 1.60FEER 2 67.9 -14.8 53.1 1 .45 2.22FEER 3 13.3 -14.8 -1.5 1 .45 1.43FEER 2’ 14.8 -14.8 -2.2 1 .45 1.42
Note: a negative sign point to the euro being over-valued against the USD.Source: Bénassy-Quéré et al. (2008).