airy notes: an experiment of microclimate monitoring in ... · the field experiment in shinjuku...
TRANSCRIPT

Airy Notes: An Experiment of Microclimate Monitoring in Shinjuku Gyoen Garden
Masaki Ito1, Yukiko Katagiri1, Mikiko Ishikawa2, Hideyuki Tokuda1,2 1Graduate School of Media and Governance
2Faculty of Environment and Information Studies Keio University
5322 Endo, Fujisawa, Kanagawa, Japan {niya, yukiko77, mikiko, hxt}@sfc.keio.ac.jp
Abstract—This paper demonstrates Airy Notes system, which monitors environmental condition using tiny sensor modules and shows the characteristics of places intuitively on a map and on a cell phone. The system is designed to help the user’s easy understanding of the effect of green by densely placed sensor nodes. We conducted the experiment of the system in Shinjuku Gyoen Garden with 160 sensors. The garden is known for its effect of keeping temperature of nearby area calm with its green. We monitored the distribution of temperature, and observed that the temperature of the inner place was lower than the edge of the garden.
The uPart Wireless Sensor Network; Environmental Monitoring; Field Experiment; Distribution of Temperature
I. INTRODUCTION In the field of ubiquitous computing, utilization of small
computers equipped with sensors and communication functions is an important issue in order to support human activities. For example, technology to observe environment and human behaviors using a lot of cheap sensors and technology of flexible building of wireless sensor network have been discussed [1][2][3][4].
Monitoring of natural environment is one of the important applications of ubiquitous computing technology. Specialists of enviromentology have already started observing environment using a sensor, and succeeded at studying the environmental condition quantitatively. However, these researches usually focus on places that many specialists are interested in. Ubiquitous computing technology can bring environmental monitoring to our daily life.
Today many people consider environmental issues important when constructing buildings, parks, roads, and so on. Anyone who changes the environment needs to obtain consent from local residents about their plan. Participation of citizens, therefore, is recognized to be an important part in urban planning. In this situation, sharing the role and effect of the green and water is important in order to evaluate the impact of the construction. The result of an environmental monitoring will be an important clue when we discuss the environmental situation.
This research aims to develop an infrastructure through which any user can exchange environmental data with wireless sensor network technology. People upload
monitoring data of their own places, and anybody can download and analyze the data anywhere they want to see. The infrastructure makes organization of sensor network by citizens easy, and can be used when citizens discuss the future of their environment.
As the first step of our research, we focused on showing the role of Shinjuku Gyoen garden (Figure 1) in Tokyo. Shinjuku Gyoen garden is a remarkable place for researchers since the garden seems to supply cool and clean air to surrounding urban districts. Shinjuku Gyoen garden is said to be Cool Island, which reduce heat island effect. We scheduled the field experiment in Shinjuku Gyoen garden, and started development of the infrastructure.
Since it was the first experiment, we aimed to clarify the
possibilities and problems of environmental monitoring with the wireless sensor technology. We developed a basic monitoring system, and investigated the distribution of temperature in Shinjuku Gyoen garden. We also aimed to effectively present condition and role of the environment of Shinjuku Gyoen garden to the visitors who were not familiar with heat island effect. We showed a map with the distribution of temperature to visitors, and also provided current temperature of their location on their cell phones.
We named the monitoring system Airy Notes System. We used the uPart wireless sensor module [5] as a sensor technology for monitoring. We demonstrated the Airy Notes
Figure 1. Shinjuku Gyoen Garden

System from May 25, 2005 to June 12 in Shinjuku Gyoen Garden.
In the next section, we discuss the features of the Airy Notes System. We mention the sensor technology and placement in the third section. In the fourth section, we explain the field experiment in Shinjuku Gyoen Garden, and discuss the result in the fifth section. Then we summarize this paper.
II. AIRY NOTES SYSTEM Airy Notes is a monitoring system of environmental
condition that uses tiny sensor nodes. The system measures micro scale environmental conditions with a large number of sensors installed in urban area. The recent progress of sensing technology enables development of such kind of monitoring system.
A. Characteristics The characteristics of Airy Notes are as follows.
1) Real-time Monitoring Usually, a monitoring device has a storage, and
researchers come to collect its data periodically. They investigate the details of environmental condition in data after a few days. However, if we want to expand the user to ordinary people, we need to give its value in real-time so that they can relate its value with what or how he or she is feeling at that moment and understand environmental condition well.
Airy Notes system utilizes wireless sensor modules, and collects their data to a database system in real-time. We also output their data immediately in XML format, therefore we can develop several applications which presents environmental conditions in real-time. Figure 2 is a map-based viewer, on which temperature of each sensor is shown in different colors. We can understand current environmental condition and difference of each place immediately. It also shows the history of temperature by animation. We can easily understand the characteristics of each place on the viewer.
2) On-site Observation
You would understand the characteristics of a certain place much better if you investigate current temperature, wind
and light, and their history while you are there compared to doing the same thing in another place such as a laboratory. You would understand such environmental condition with your body sensation.
Airy Notes provides on site viewing of current temperature and temperature history as a graph through a cell phone. Users can get its URL by taking a picture of QR-Code on a package of a sensor. Figure 3 shows the usage of the system.
3) Easy Installation
Easiness of installation is a significant matter. Since an uPart sensor node is not equipped with GPS and any detection mechanism of location, it is needed to register every location of sensors manually. For data analysis, the visage of the ground, the amount of sunshine, and the vegetation need to be registered in addition to the latitude, longitude and height of the location. Even in case every sensor module has a GPS receiver, these kinds of detailed environmental information have to be registered only manually.
Airy Notes enables easy installation with an assistant
application. They actually allow us to install 160 censors in the experiment. We developed a map-based application running on a tablet PC equipped with GPS. With this system, you can easily register the location of the sensor on a digital map that indicates your present location. Also, you can
Figure 4. Sensor Registration System
Figure 3. Access from a cell phone
Figure 2. Map-based Viewer

register the environmental information selecting the choices on the screen with a pen. Figure 4 is the screenshot of the system.
B. Software Components Figure 5 shows system architecture of Airy Notes system.
Most software components in the system were designed to work independently, and connect roughly using a standard communication protocol such as XML and HTTP. The system is, therefore, extendable and can easily add new visualization application, data source and so on.
We placed a XBrige in every monitoring area, and forwarded data from them to a database server by a Laptop PC in Shinjuku Gyoen. The data is managed by a RDBMS with a GIS extension (PostGIS). Applications to show sensor data can access the database, and acquire data within certain region and term. We implemented the server system by Ruby on Rails, and applications by Java.
III. WIRELESS SENSOR NETWORK This section shows the wireless sensor technology in the
Airy Notes system. Ubiquitous computing researchers often use sensors for understanding human and environment by a computer. The studies are, however, usually done indoors [6][7] and there are only a few examples of outdoor experiments. Following shows the detail of sensor technology.
A. uPart Wireless Sensor System The requirements for sensor system are as follows. First, it
is cheap enough to cover monitoring area with numerous sensors. Secondly, it is maintenance-free with long battery life. Lastly, it covers large area by long-range and multi-hop wireless communication. Whereas, we did not require a location technology of each sensor nodes such as the GPS, since we set sensors manually and did not move them.
We could not find sensor technology which satisfies every requirement. We adopted the uPart wireless sensor system for Airy Notes, which satisfy first two requirements. The uPart sensor system is a low cost tiny sensor system developed by Telecooperation Office(Teco) at Karlsruhe University. Figure 6 shows the uPart sensor module.
One uPart sensor costs about $40, and we prepared more than 200 sensors for our experiment. Every uPart sensor is equipped with temperature, light, and movement sensor, and sends their values every 10 seconds. If we set the sensor to shake in the wind, the value of movement might be strength
of the wind. The interval of monitoring is configurable by giving a certain blinking pattern when we insert a battery. It works more than six months with a button battery, and if its interval is longer than 40 seconds, it can work more than one year.
The uPart wireless sensor system is not suitable for large
area monitoring. To receive signals from uParts, it requires the XBridge receiver shown in Figure 7 within 30m from uParts. It receives signals from multiple uParts, and fowards the data to other computers via the Ethernet. We need to lay an Ethernet cable to every place we put the XBridge receiver. In the experiment in Shinjuku Gyoen, we limited the monitoring area and we covered the area with 10 XBridges.
B. Sensor Package We designed a package for uPart sensor module to protect
it from rain and the sunlight. We bend a waterproof paper reinforced by plastic sheet into a cylinder, and put the sensor module in it. On the package, we printed QR code, which is a popular way to encode URL for cell phones. Users can get current temperature and its graph using their own cell phone via QR code. Figure 8 shows the package.
Figure 8. Sensor Package
Figure 7. XBridge
Figure 6. uPart Sensor Module
Figure 5. System Architecture

uPart sensor module is equipped with sensors of temperature, luminance and shake. Since this was the first prototype of the uPart shade, we focus on measurement of temperature. We designed it considering following requirements: to protect from the sunlight, having a room for wind, to separate from the ground which has heat, and to avoid the heat of the shade transferred to the sensor. Also, since this experiment needed a lot of sensors in a short period, we considered the easiness of procurement and modification of the material and the easiness of installment, maintenance, and to tear down. We set the period of endurance as about a month.
Besides, we designed eye-catching color and the logo for the package from its purpose to tell the effect of green in the city in real time, while we paid enough attention not to spoil the sight of the place.
IV. EXPERIMENT We demonstrated Airy Notes system in June 3, 2006,
when the event of Centennial Anniversary of Shinjuku Gyoen was held. We showed the system to many guests at the event
including the head of Shinjuku Ward. We kept the Airy Notes system working for a week after the event.
A. Shinjuku Gyoen Shinjuku Gyoen National Garden is a large city park of
58.3ha located in Shinjuku ward, the center of Tokyo. About 3,200 people a day and 900,000-1,000,000 people a year visit the park. It is known for the magnificent cherry trees. When the cherry blossoms are full bloom, over 80,000 people visit the park in a day. The district that has Shinjuku Gyoen is the busiest part in Tokyo, where the business district of high-rise office buildings coexists with shopping and entertainment area. Recent research is revealing that Shinjuku Gyoen plays a significant role for the environment of the surrounding area [8]. The report says that the temperature of Shinjuku Gyoen is 2-3C lower than the surrounding area. It also says that holding and soaking out the cool air, the park makes the temperature of the surrounding area lower.
B. Test In the experiment in Shinjuku Gyoen, we tested following
viewpoints.
Figure 9. A map of Shinjuku Gyoen Garden
1) Placing Sensor Nodes Outside There are a few examples that wireless sensor nodes are
tested outside for a long time. In this experiment, we investigated the appropriate setting of sensor nodes including the evaluation of sensor package.
2) Process of Placing Sensors We need to place numerous sensors to monitor fine
difference of the environment, Therefore we need to optimize the process of placing sensors. In this experiment, we will examine the work sequence of placing sensors, and usability of sensor registration system.
3) Ability for Monitoring To clarify the ability of monitoring system, we compare
the data with the data of the past researches.
C. Observation Points To acquire several environmental information under
various conditions, we needed to set the sensor in multiple locations in Shinjuku Gyoen Garden and downtown outside of the garden. Fortunately, we are allowed to utilize existing network facility in the garden, so we chose 10 spots near the buildings in the garden that have network sockets. Some spots were along the promenade, and some were in a forest. One spot was beside a pond, where we expect to investigate the effect of water. We set one XBridge receiver in every point, and set about 15 sensors around the receivers. We set 150 sensors for total in Shinjuku Gyoen Garden. Figure 9 shows the map of Shinjuku Gyoen Garden. On the map, we pointed the places we set sensors.
We also set our system in the rooftop of Shinjuku Ward Office, which was located in downtown of Shinjuku Word, and 700m north from the garden. We placed one XBridge and 10 uParts, and connected to the internet through a laptop PC with a PHS PC card. We expected that we would acquire typical data of downtown outside of the garden in the Ward Office, and they would reveal the characteristics of the environmental condition of Shinjuku Gyoen Garden by comparing those data.
D. Placing Sensors It took 6 days for total to install Airy Notes to Shinjuku
Gyoen Garden with about 3 people a day. We started the installation on May 25, 2006, and finished on May 30. For the first three days, we set up network infrastructure and XBridge receivers. We extended the Ethernet from buildings in the garden where the network had already reached, and set XBridges at the end of the cable. One XBridge was located under the bridge in the garden, so we took a boat to set it. For the latter three days, we set sensors under trees around each XBridge.
In the latter days, we put about 15 sensors around each XBridges. We chose points under the different conditions, and bound its thread to the branch. We registered a location and condition of the senor such as the name of the tree, condition of the ground and the sunshine. During the process, we utilized sensor registration system running on a mobile tablet PC. In addition to registering sensor information, we checked the signal strength of sensors, and adjust their positions.
V. DISCUSSION We found following problems from the experiment.
A. Sensor Modules Almost all sensors worked well during the experiment
except a few sensors that were broken by crows. Sensor packages protected the sensors inside very well.
Some XBridge often dropped signals from the sensors far from 15m even though it worked fine within 30m in our previous study. We supposed it was caused by waterproof tape made of metal which was used to fix the XBridge in a Tupperware. We used different tape in the next experiment, and confirmed its original performance.
In some sensors, the temperature in the morning rose too rapidly. It seemed because of the sunlight from the orifice of the package. The luminance sensor did not work, since the range was too narrow for the sunshine.
We developed a new package based on these examinations. The new one was made with heavier waterproof paper to omit the plastic reinforcement. We painted inside of the package black to soften sunlight, and covered luminance sensor with a dark filter. We are testing the new packages at Shonan Fujisawa Campus (SFC), Keio University from August, 2006.
B. Process of Placing Sensors We tested sensor registration system which record
location and surrounding condition of a sensor. The system works on a mobile tablet PC with GPS and enabled on-site registration of sensors. The system, however, could not support the entire placement process. When placing sensors, we often needed to change its position due to its signal strength. And we often preferred registering conditions of multiple sensors together after placing multiple sensors. However, the application did not assume such flexible placement of the location.
After the experiment, we developed new registration system, where user can plan the location of sensors, and change status of multiple sensors all at once afterward.
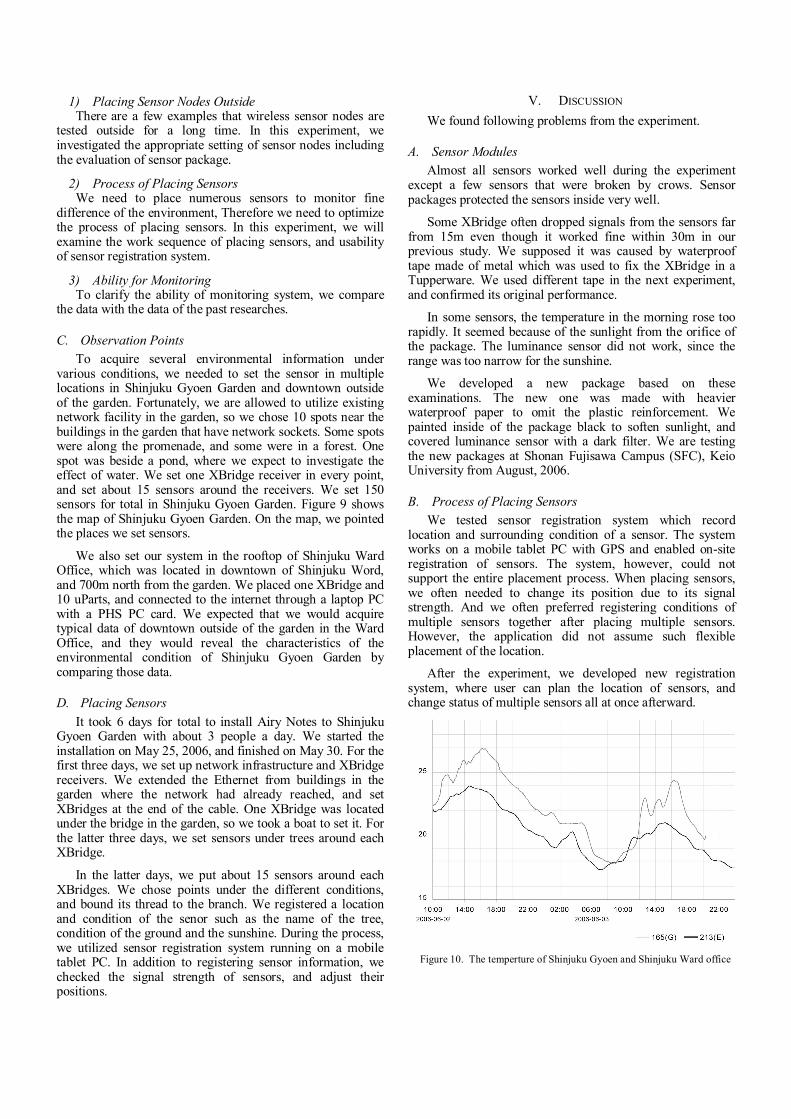
Figure 10. The temperture of Shinjuku Gyoen and Shinjuku Ward office

C. Monitoring Result One of the aims of the experiment was to test whether the
monitoring system could demonstrate fine characteristics of the climate shown in previous researches. Following shows the result of the monitoring.
Figure 10 shows the change of temperature in June 2 to June 3. Upper line shows the temperature in Shinjuku Ward office located in urban district, and lower one shows the temperature in the center of Shinjuku Gyoen. These data are from the typical sensors of each position, and results of moving average. It shows the fact that Shinjuku Gyoen is keeping cool air.
The map-based viewer presented that the temperature became lower in order of business area (G), the border between business area and the Garden (A), the garden field (E, F, D), and the forest in the Garden (A1--C1). The more the observation spot is distant from the business area and has more green, the lower the temperature became. We explained this phenomenon to visitors in front of the viewer in the event, and many visitors were interested in this result.
Figure 11 shows the change of temperature of different five points in June 10, which was a clear day. In the area where the trees particularly grew and made shades in the promenade, the diurnal temperature was lower and changed slowly (B1 C1). In the border between business area and the Garden (A), the temperature became higher and rose rapidly. In the night, there were not so much of differences in the temperature of every point.
The sensors in Shinjuku Gyoen clearly showed the gradual change of temperature, because of the density of the sensors. We could also observe the difference of temperature between Shinjuku Gyoen and Shinjuku urban area. We expect that we could observe remarkable urban climates such as heat island if we monitor the weather of full summer.
D. Utilization of Monitoring Result As we mentioned in the first section, the goal of this
research is to popularize environmental monitoring system to be an infrastructure of ordinary people to evaluate the value and effect of the environment. The result of our first experiment showed the ability of the wireless sensor network system to measure natural condition, which usually monitored by specialists. Now development of software to support placement of sensors is important challenge to create practical application of distributed sensor network.
This system can be an infrastructure to support our daily life in addition to the utilization for the special purpose. If much sensor data of large area can be collected all the time, it will be an important clue of weather forecast of small region and specific time which current weather monitoring cannot cover. For this purpose, the way to normalize sensor data under the different condition will be an important issue. We registered conditions of every sensor. However, we are not using the data for analysis now. We need to develop the method, and grasp actual difference of environment.
Figure 11. The temperature of different five points in June 10

VI. SUMMARY In this paper, we introduced Airy Notes system to monitor
and visualize environmental condition using tiny sensor devices. The system enables easy grasp of the effect of greening in downtown with an intuitive visualization of temperature on digital map. The environmental condition information is accessible on-site via a cell phone. Gaining the information of the present place in real time, users can understand the environmental condition of the place together with their body sensation.
We experimented the system in Shinjuku Gyoen Garden, which is a large park located in the center of Tokyo, for two weeks. Shinjuku Gyoen is known as taking part of keeping urban environmental condition calm with its green. We monitored the change of temperature in 150 spots in the garden, and observed that the temperature of the inner place was lower than the edge of the garden.
We started next experiment in our university campus in August 2006, and are developing applications for the goal of this research. We are also studying the environmental data that was acquired in the experiment in Shinjuku Gyoen, and developing new method to show the change of temperature and other environmental characteristics. While developing applications, we are improving the installation process to be shorter and easier, and creating XML-based API for applications which utilize environmental information.
[1] D. Estrin, R. Govindan, J. Heidemann, and S. Kumar, "Next Century Challenges: Scalable Coordination in Sensor Networks," In Proceedings of the ACM/IEEE International Conference on Mobile Computing and Networking, pp. 263-270, Seattle, Washington, USA, August 1999, ACM.
[2] lan F. Akyildiz, W. Su, Y. Sankarasubramaniam, and E. Cayirci, "A Survey on Sensor Networks. IEEE Communications Magazine," pp. 102-114, August 2002.
[3] M. Beigl, A. Krohn, T. Zimmer, and C. Decker, "Typical Sensors needed in Ubiquitous and Pervasive Computing," In First International Workshop on Networked Sensing Systems (INSS) 2004, pp. 153-158, June 2004.
[4] E. M. Tapia, L. L. Stephen S. Intille, and K. Larson, "The Design of a Portable Kit of Wireless Sensors for Naturalistic Data Collection," In Proceedings of Pervasive2006, pp. 117-134, May 2006.
[5] M. Beigl, A. Krohn, T. Riedel, T. Zimmer, C. Decker, and M. Isomura, "The uPart experience: Building a wireless sensor network," In Proceedings of the ACM/IEEE Fifth International Conference on Information Processing in Sensor Networks, pp. 366-373, Memphis, USA, April 2006.
[6] Kidd, C.D., R.J. Orr, G.D. Abowd, C.G. Atkeson, I.A. Essa, B. MacIntyre, E. Mynatt, T.E. Starner, and W. Newstetter, "The Aware Home: A living laboratory for ubiquitous computing research," in Proceedings of the Second International Workshop on Cooperative Buildings CoBuild'99. 1999.
[7] S. S. Intille, K. Larson, E. Munguia Tapia, J. Beaudin, P. Kaushik, J. Nawyn, and R. Rockinson, "Using a live-in laboratory for ubiquitous computing research," in Proceedings of PERVASIVE 2006, vol. LNCS 3968, Springer-Verlag, pp. 349-365, 2006.
[8] T. Mikami, "A practical Use of Wind and Green Effect for City Planning: Wind System in Tokyo and Its Role for Mitigating Urban Heat Island," Environmental Research Quarterly, vol. 141, pp.29-34, April 2006.