akira yamaguchi professor of health & human habitation harvard school of public health
DESCRIPTION
Indoor Environments. John D. Spengler, Ph.D. Akira Yamaguchi Professor of Health & Human Habitation Harvard School of Public Health. E-119 November 9, 2010. Indoor Environmental Quality in Buildings. Commercial Building Energy Use. LIGHTING 27% Space Heating 15% Space Cooling 14%. - PowerPoint PPT PresentationTRANSCRIPT
Akira Yamaguchi Professor of Health & Human Habitation
Harvard School of Public Health
Indoor Environments
John D. Spengler, Ph.D.
E-119 November 9, 2010E-119 November 9, 2010
Indoor Environmental
Quality in Buildings
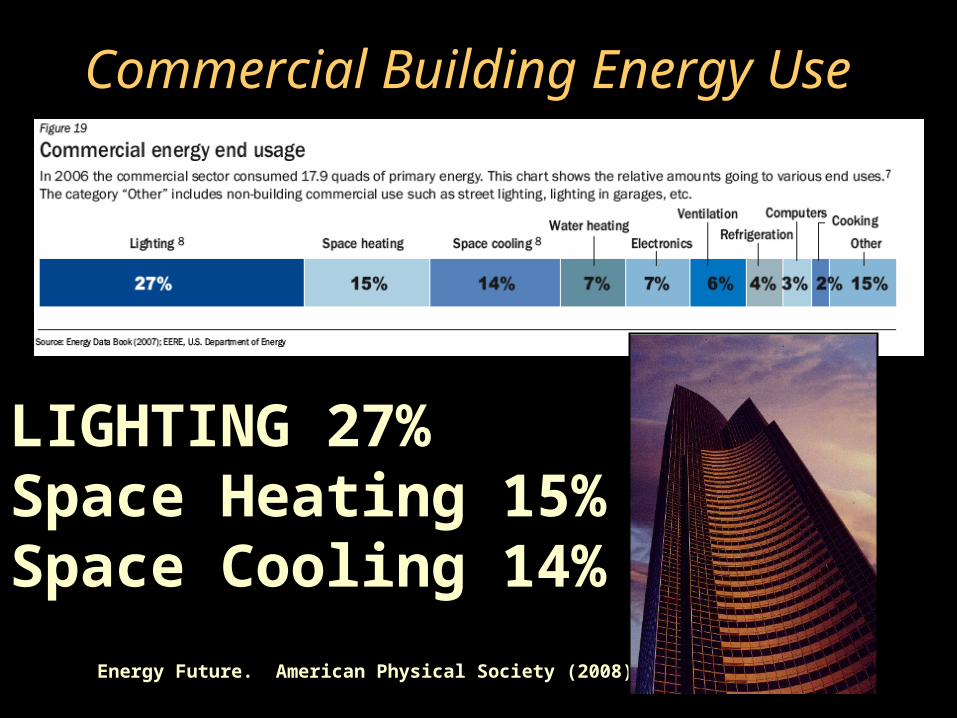
Commercial Building Energy Use
Energy Future. American Physical Society (2008)
LIGHTING 27%Space Heating 15%Space Cooling 14%
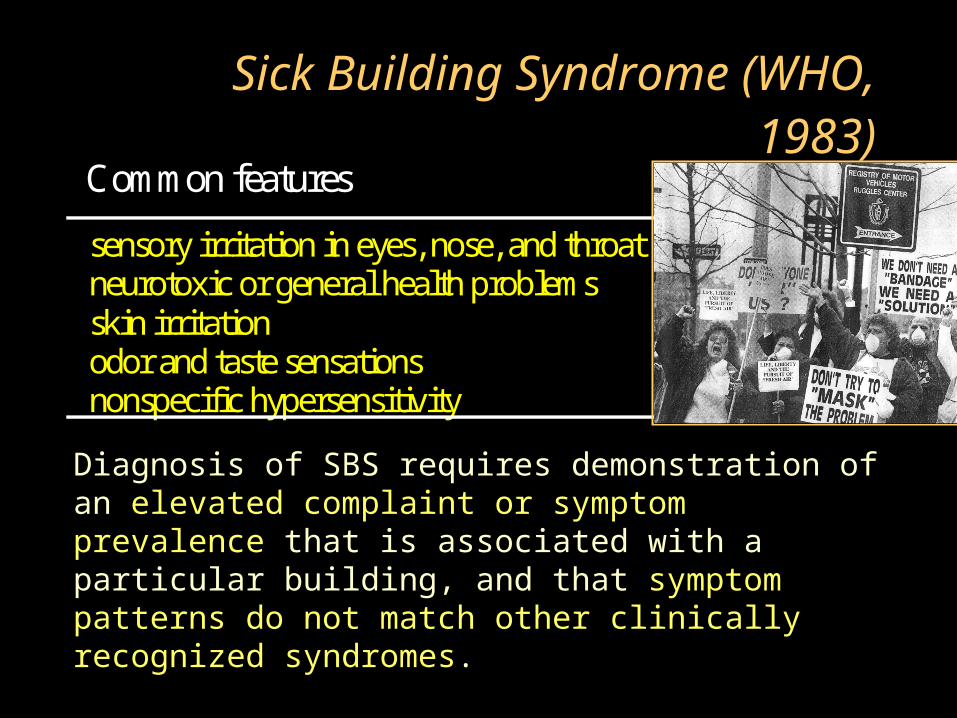
Sick Building Syndrome (WHO, 1983)Common features
sensory irritation in eyes, nose, and throat neurotoxic or general health problems skin irritation odor and taste sensations nonspecific hypersensitivity
Diagnosis of SBS requires demonstration of an elevated complaint or symptom prevalence that is associated with a particular building, and that symptom patterns do not match other clinically recognized syndromes.
Terminology
• Sick Building Syndrome– Symptoms linked
to building
– Resolve when not in building
– Effect a substantial fraction of occupants
Sick Building Symptoms
• Dry, itchy eyes
• Nasal irritation
• Hoarseness, irritated throat, laryngitis
• Skin problems
• Fuzzy thinking, memory
• Irritability, sleep disruption, fatigue
• Headaches, nausea
Potential Building Related Illnesses
• Contagious Diseases– Influenza
– SARS
– Common cold (HRV)
– Measles
– Chicken pox
– TB
• Environmental– Legionnaires
– Humidifier fever
– Asthma
– CO poisoning
– Nitrogen Dioxide
– Pesticide poisoning
– Lung Cancer• Radon, asbestos, ETS
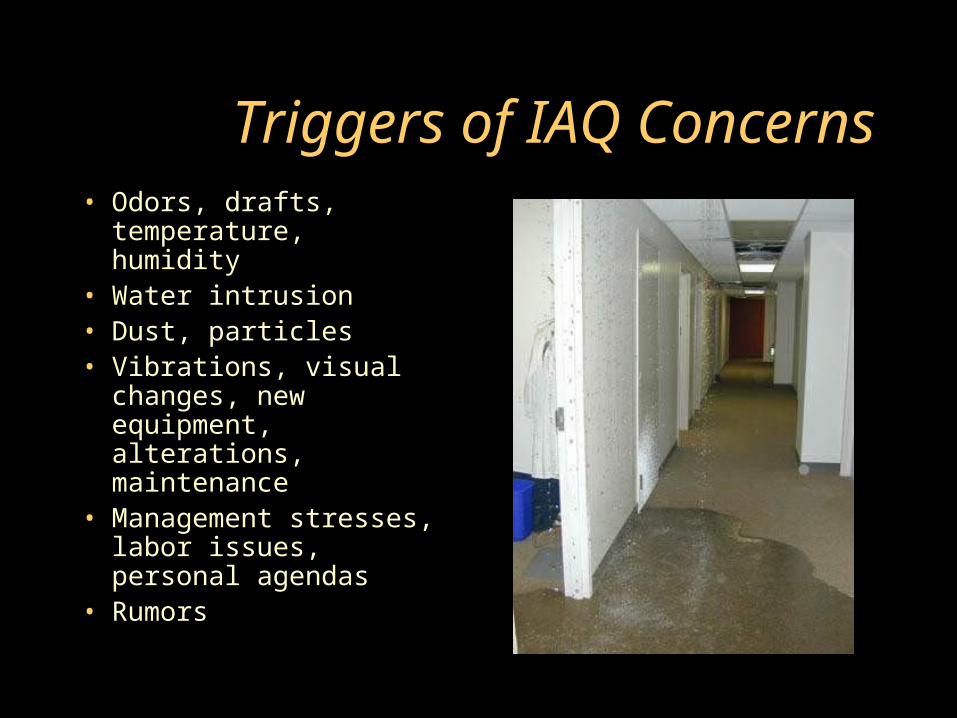
Triggers of IAQ Concerns• Odors, drafts,
temperature, humidity• Water intrusion• Dust, particles• Vibrations, visual
changes, new equipment, alterations, maintenance
• Management stresses, labor issues, personal agendas
• Rumors
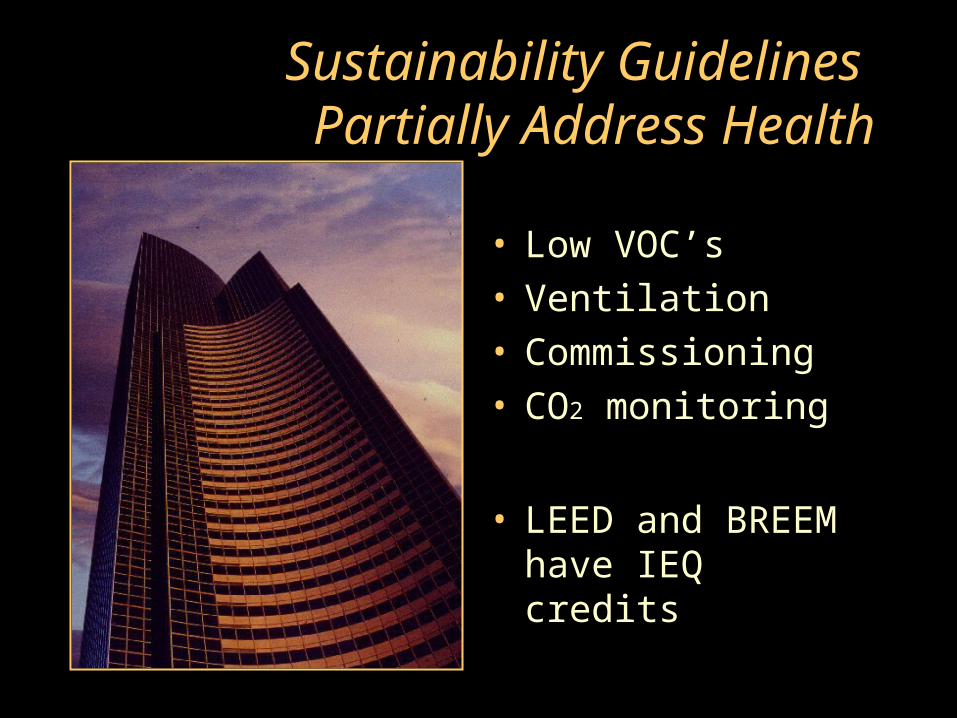
Sustainability Guidelines Partially Address Health
• Low VOC’s• Ventilation• Commissioning• CO2 monitoring
• LEED and BREEM have IEQ credits
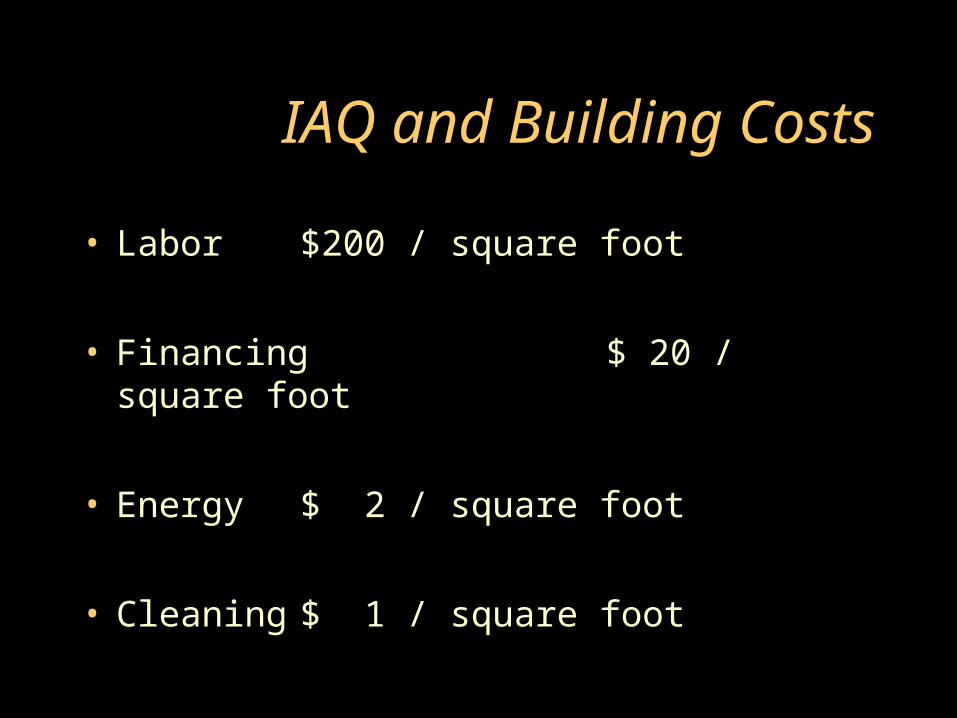
IAQ and Building Costs
• Labor $200 / square foot
• Financing $ 20 / square foot
• Energy $ 2 / square foot
• Cleaning $ 1 / square foot
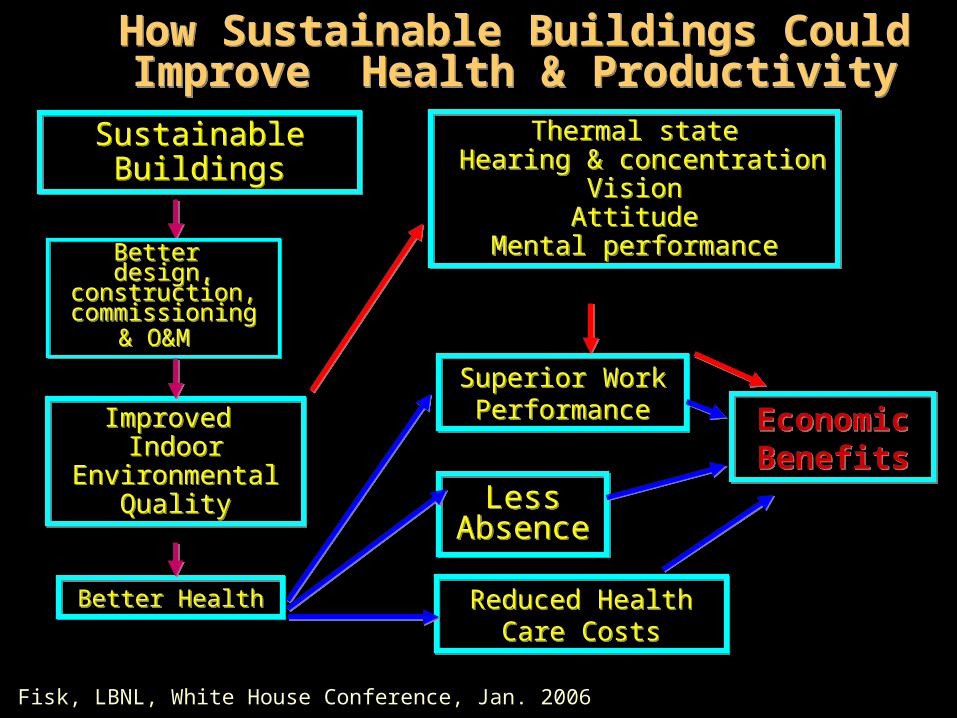
How Sustainable Buildings Could Improve Health & ProductivityHow Sustainable Buildings Could Improve Health & Productivity
Sustainable Buildings
Sustainable Buildings
Superior Work Performance
Superior Work Performance Economic
BenefitsEconomic Benefits
Better HealthBetter Health Reduced Health Care Costs
Reduced Health Care Costs
Less AbsenceLess
Absence
Thermal state Hearing & concentration
VisionAttitude
Mental performance
Thermal state Hearing & concentration
VisionAttitude
Mental performance
Improved Indoor
Environmental Quality
Improved Indoor
Environmental Quality
Better design,
construction, commissioning
& O&M
Better design,
construction, commissioning
& O&M
W. Fisk, LBNL, White House Conference, Jan. 2006
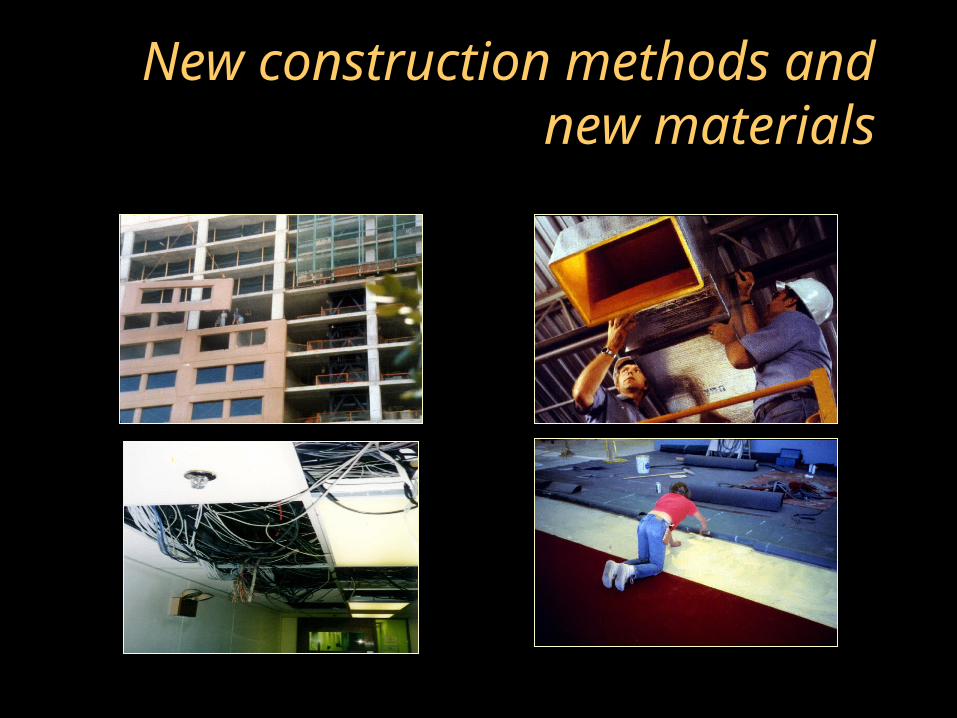
New construction methods and new materials
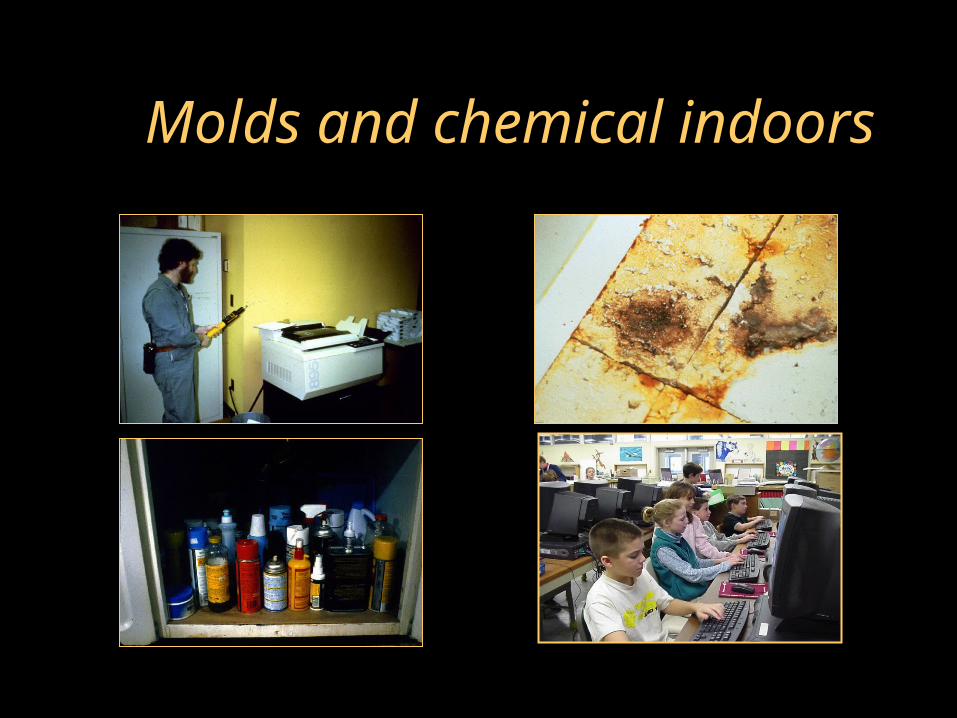
Molds and chemical indoors
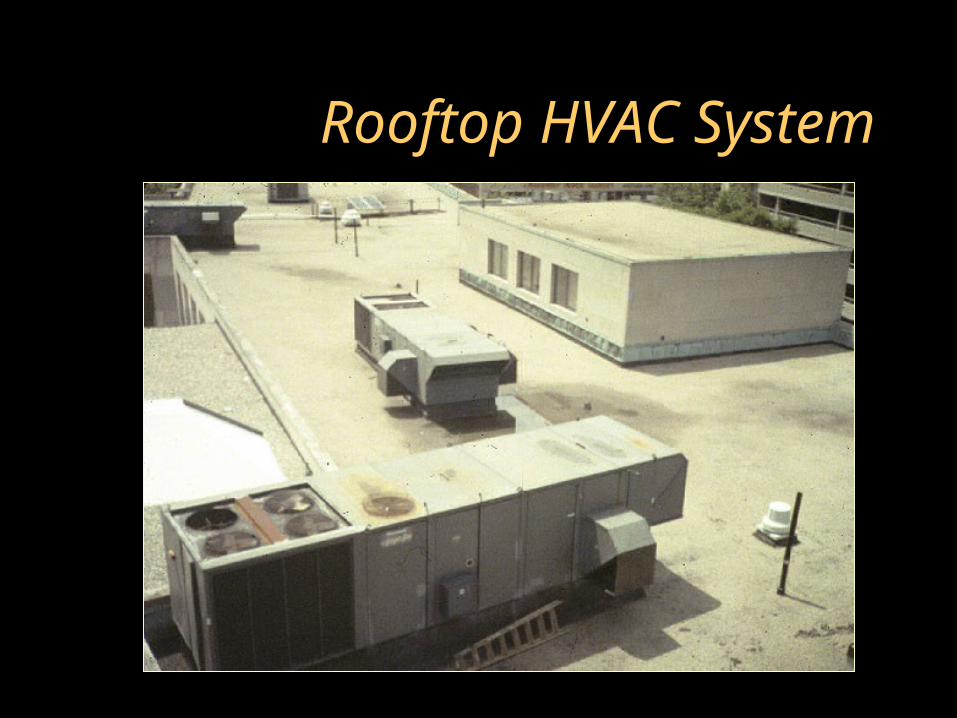
Rooftop HVAC System
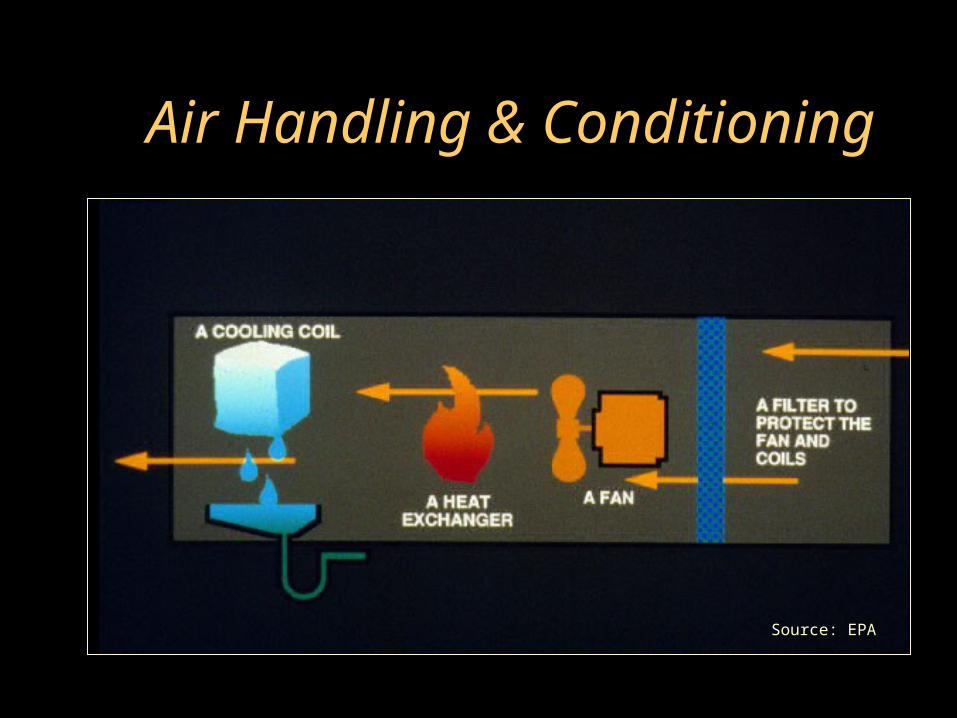
Air Handling & Conditioning
Source: EPA
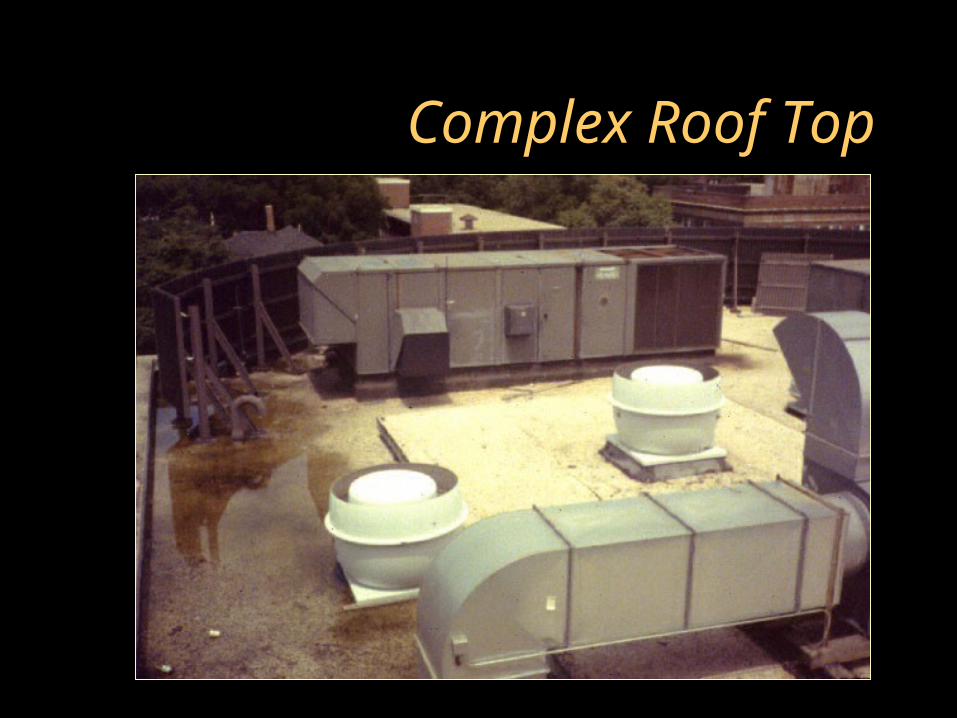
Complex Roof Top
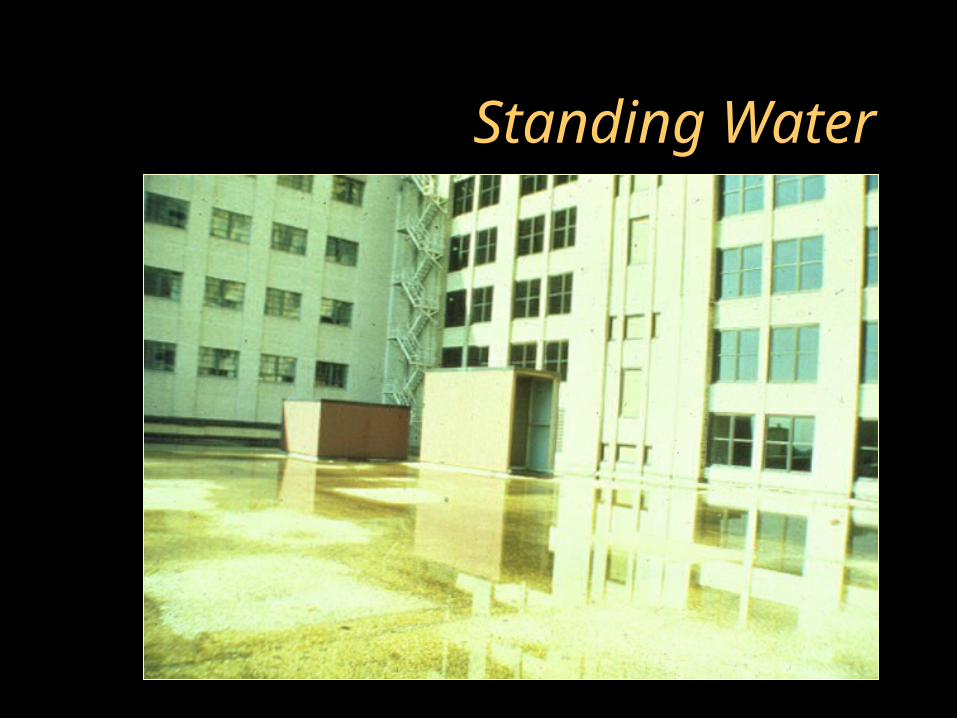
Standing Water
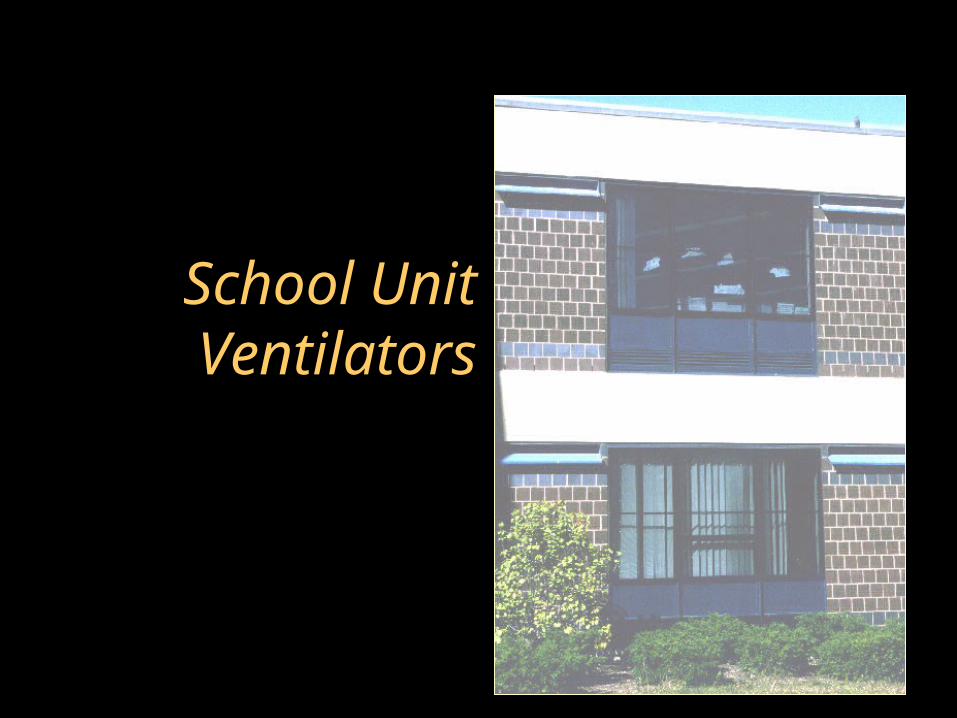
School Unit Ventilators
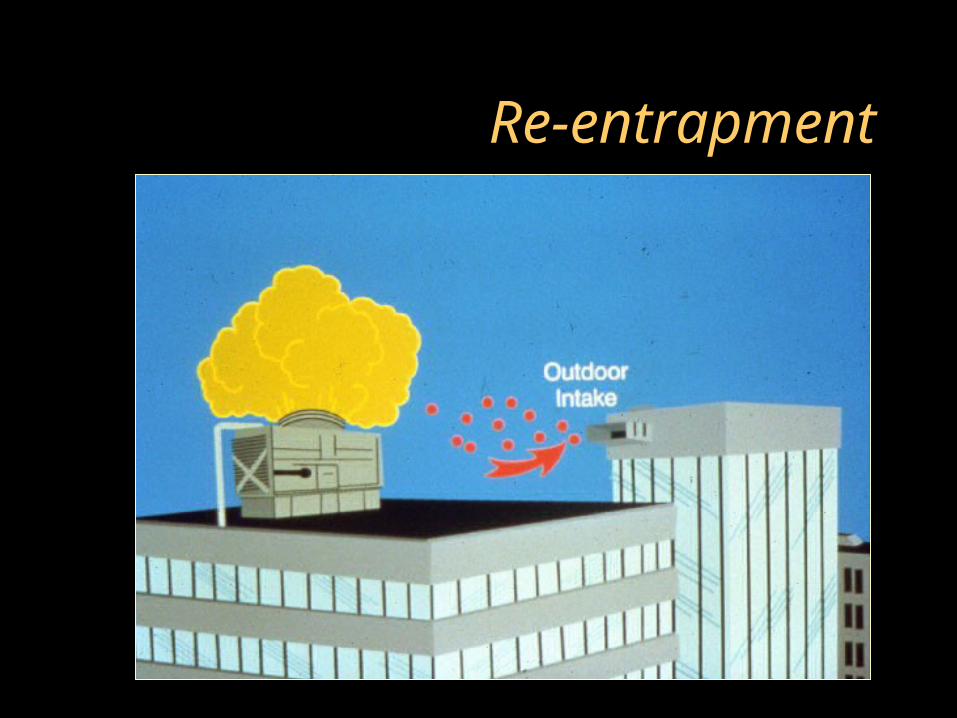
Re-entrapment
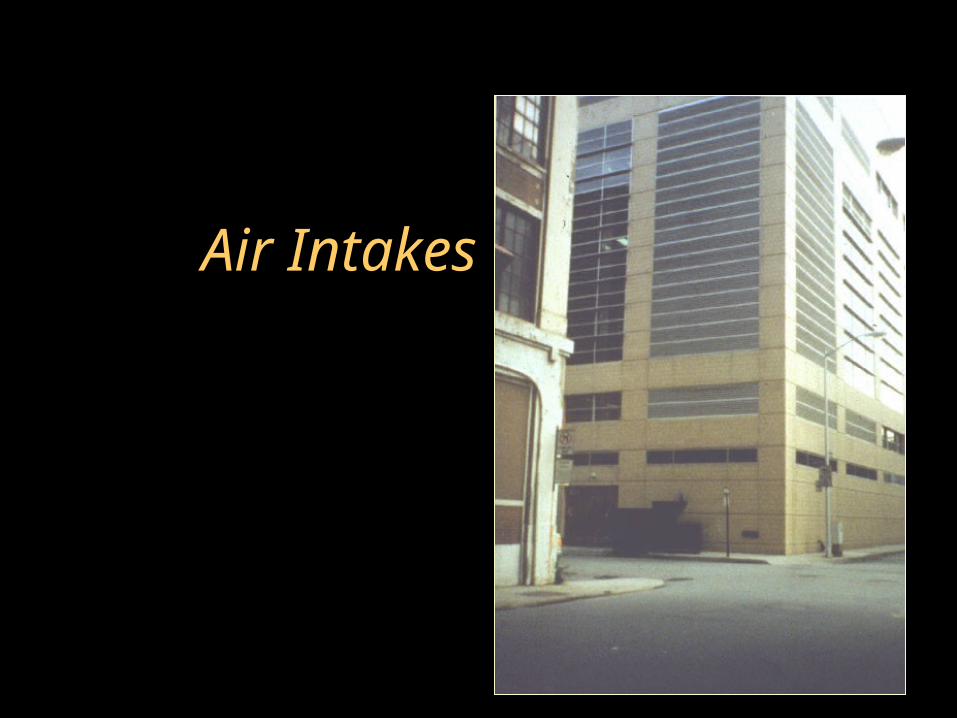
Air Intakes
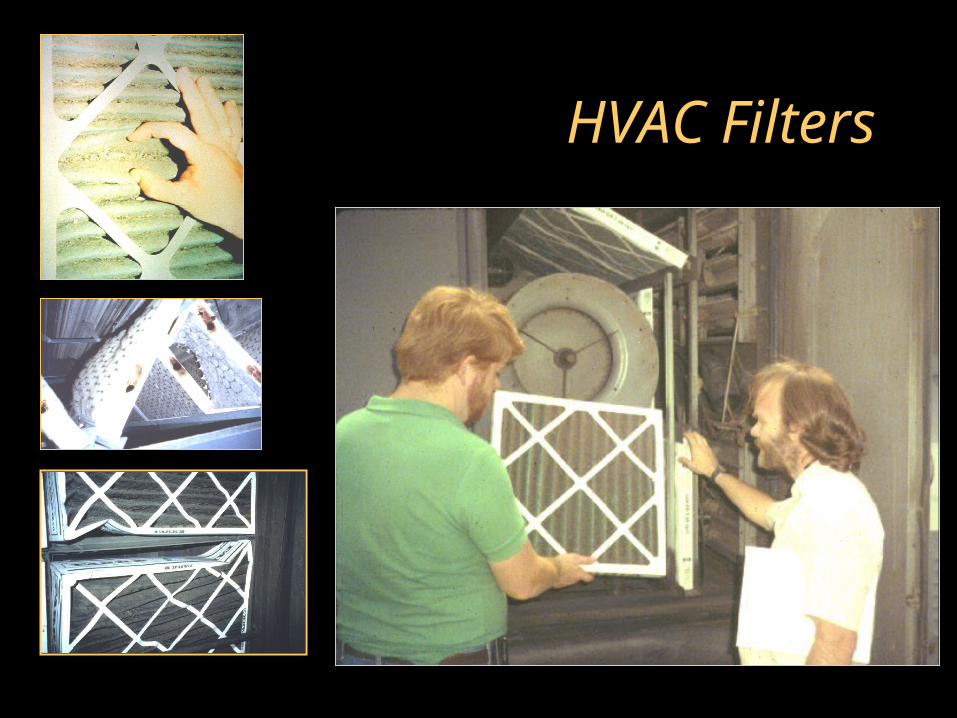
HVAC Filters
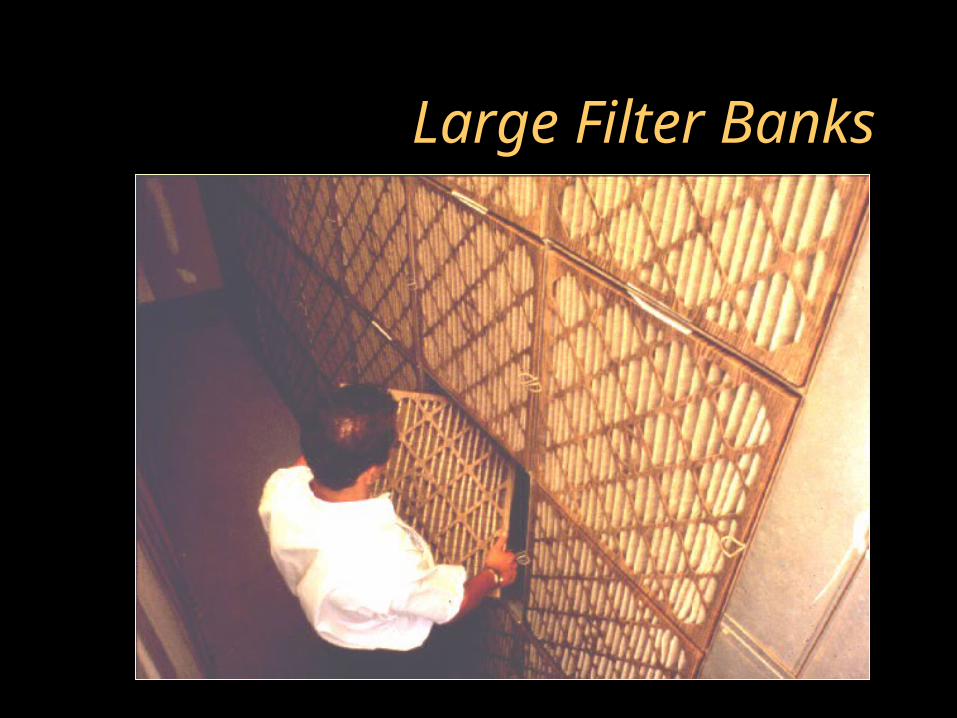
Large Filter Banks
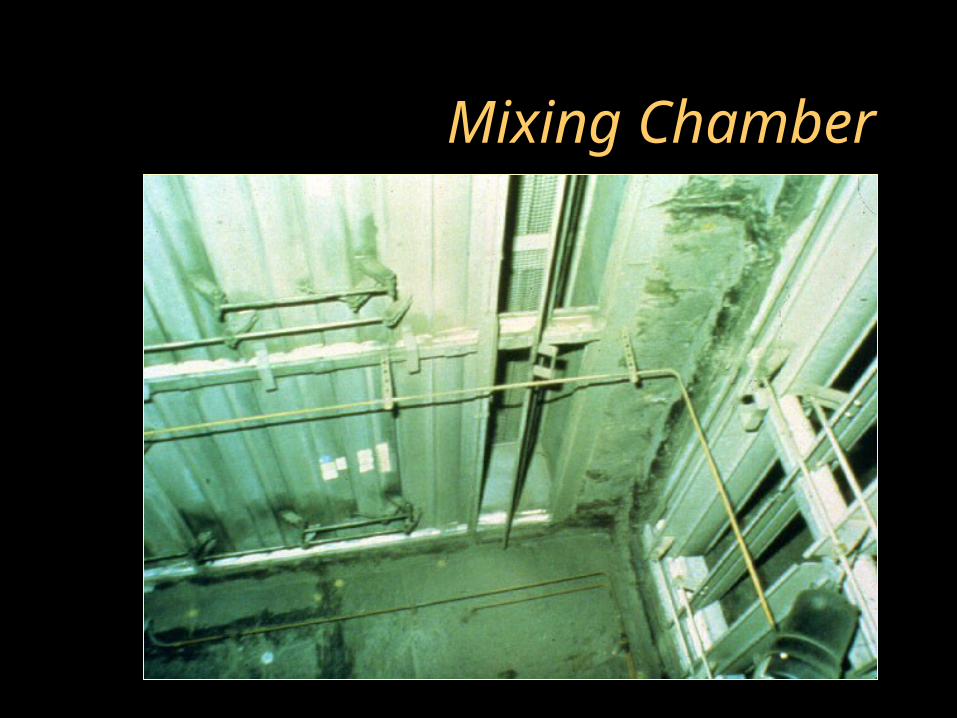
Mixing Chamber

Condensate Drip Pan
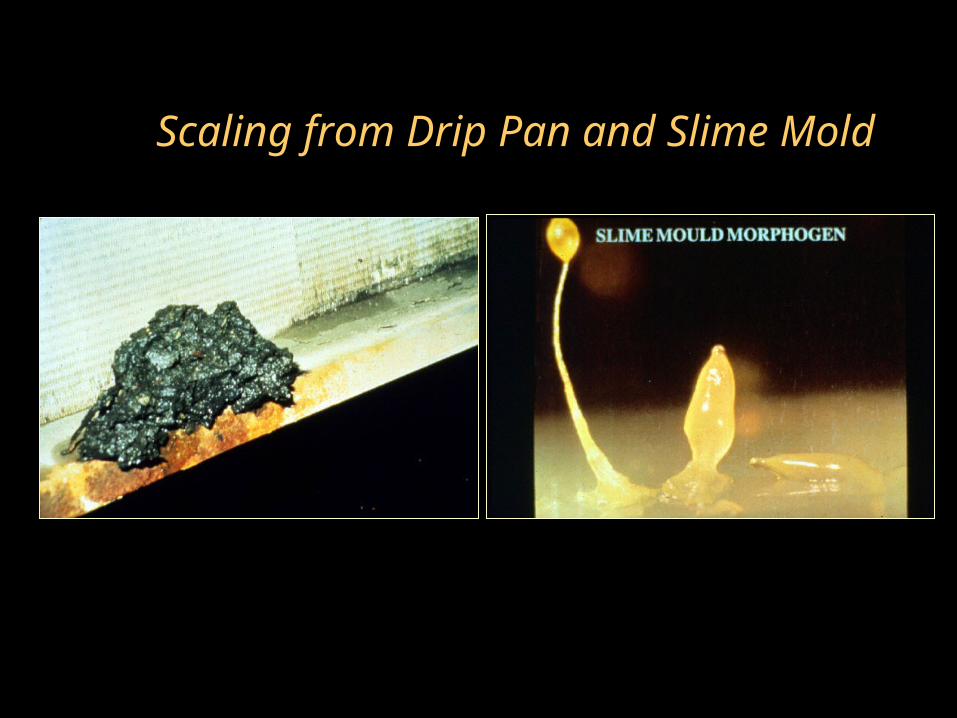
Scaling from Drip Pan and Slime Mold
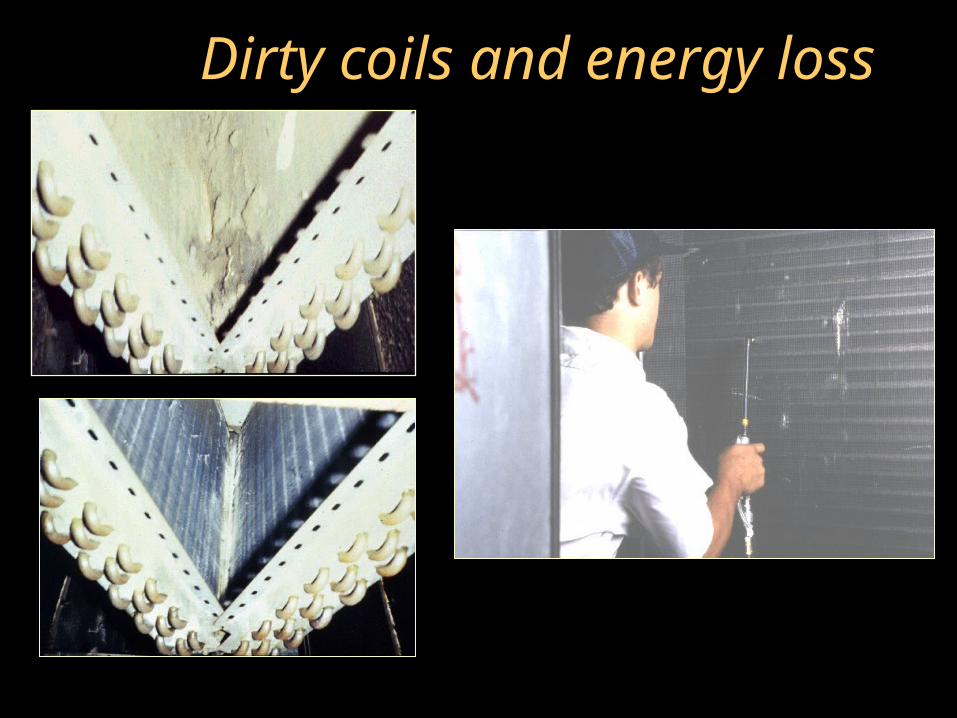
Dirty coils and energy loss
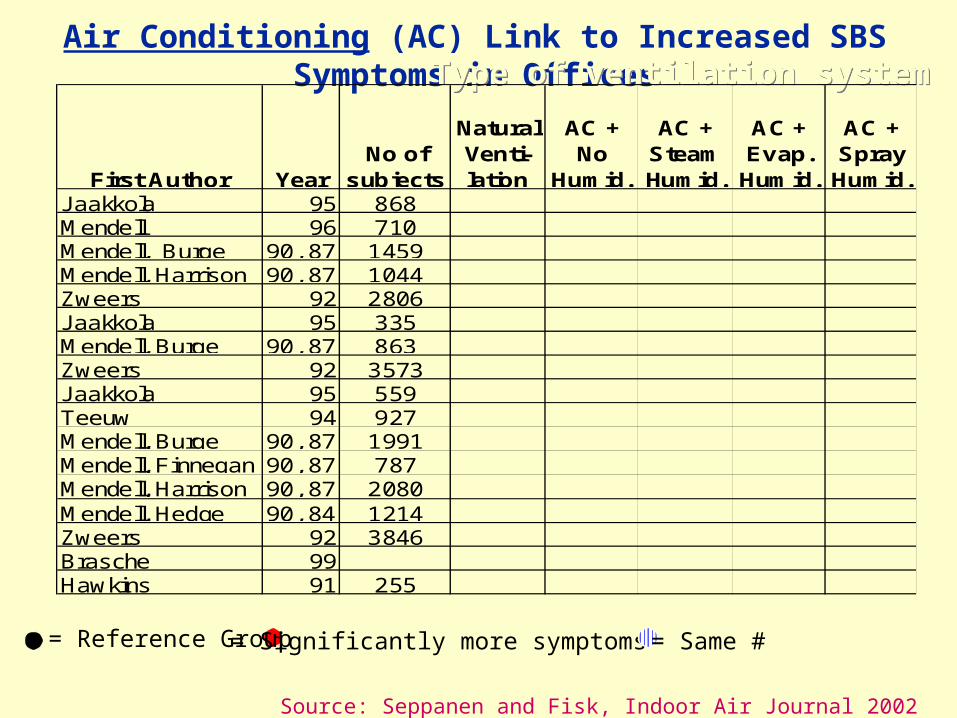
Air Conditioning (AC) Link to Increased SBS Symptoms in Offices
Source: Seppanen and Fisk, Indoor Air Journal 2002
Type of ventilation systemType of ventilation system
= Significantly more symptoms= Reference Group = Same #
First Author YearNo of
subjects
Natural Venti-lation
AC + No
Humid.
AC + Steam Humid.
AC + Evap.
Humid.
AC + Spray
Humid.Jaakkola 95 868Mendell 96 710Mendell, Burge 90, 87 1459Mendell, Harrison 90, 87 1044Zweers 92 2806Jaakkola 95 335Mendell, Burge 90, 87 863Zweers 92 3573Jaakkola 95 559Teeuw 94 927Mendell, Burge 90, 87 1991Mendell, Finnegan 90, 87 787Mendell, Harrison 90, 87 2080Mendell, Hedge 90, 84 1214Zweers 92 3846Brasche 99Hawkins 91 255
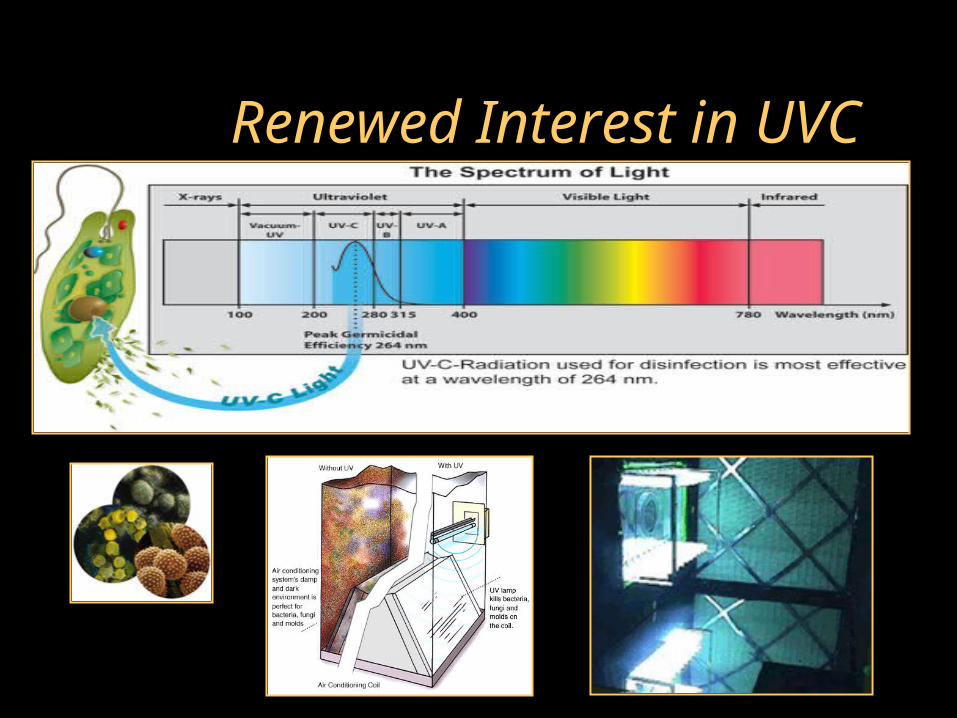
Renewed Interest in UVC

Ventilation Ducts
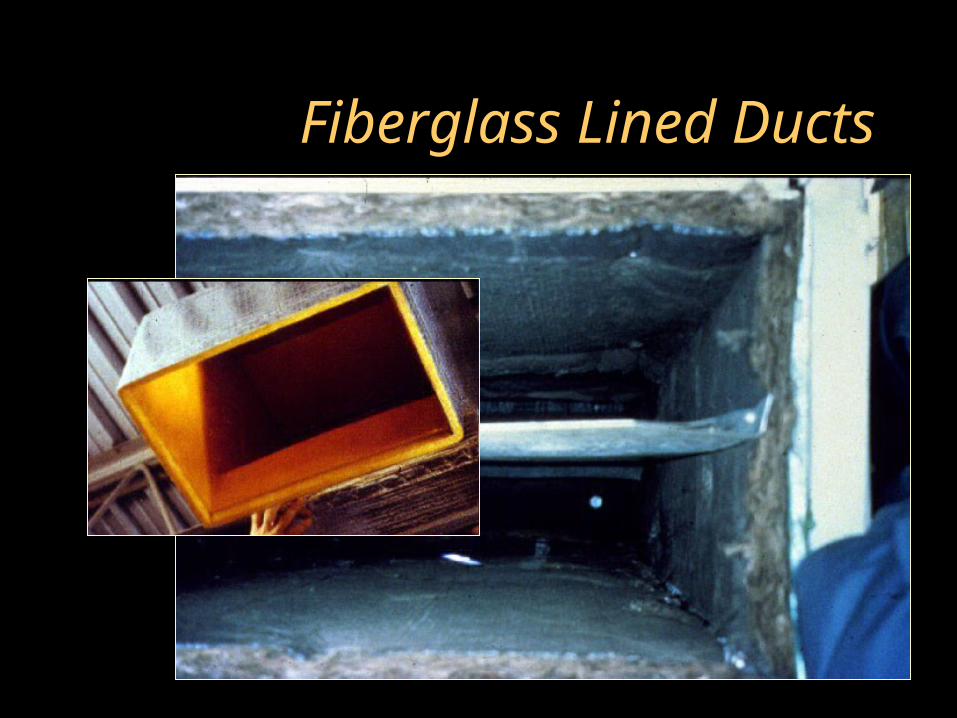
Fiberglass Lined Ducts
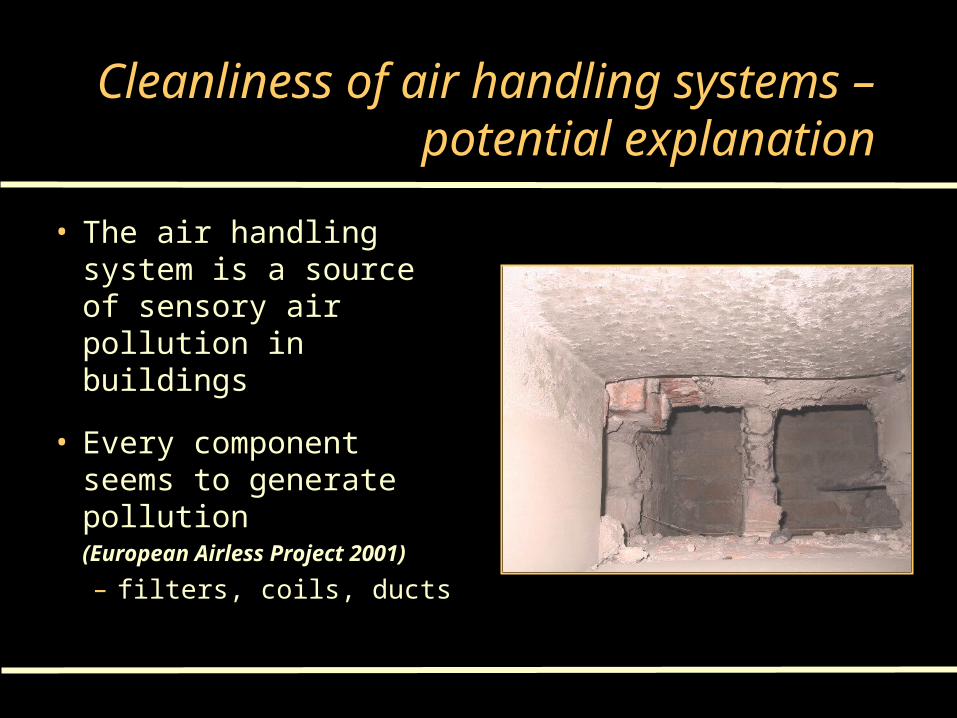
Cleanliness of air handling systems – potential explanation
• The air handling system is a source of sensory air pollution in buildings
• Every component seems to generate pollution (European Airless Project 2001)
– filters, coils, ducts

Dirty Ducts
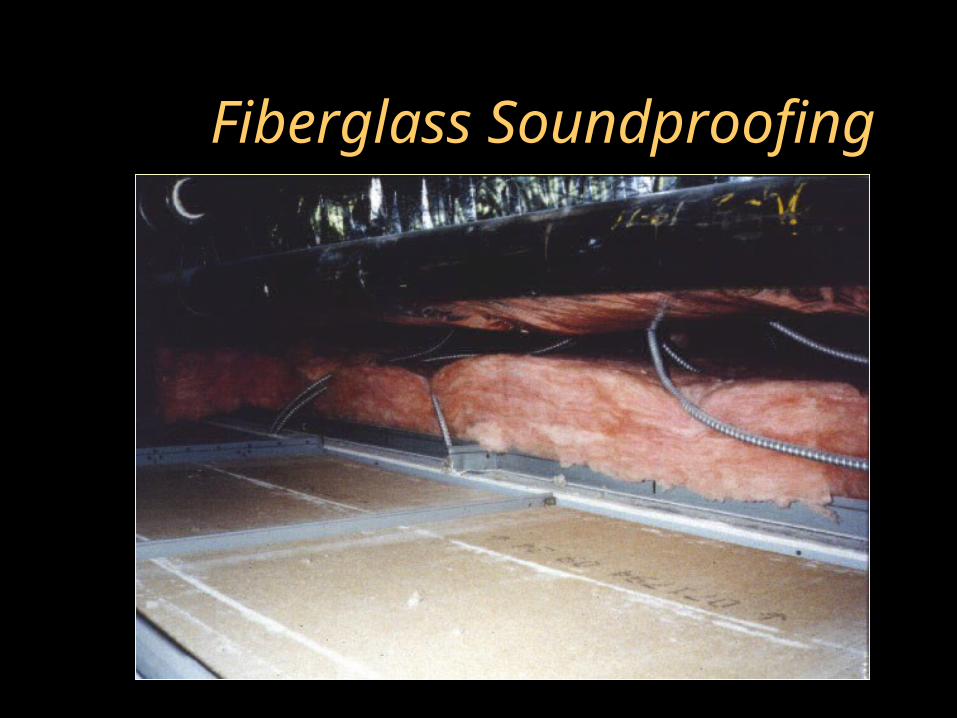
Fiberglass Soundproofing
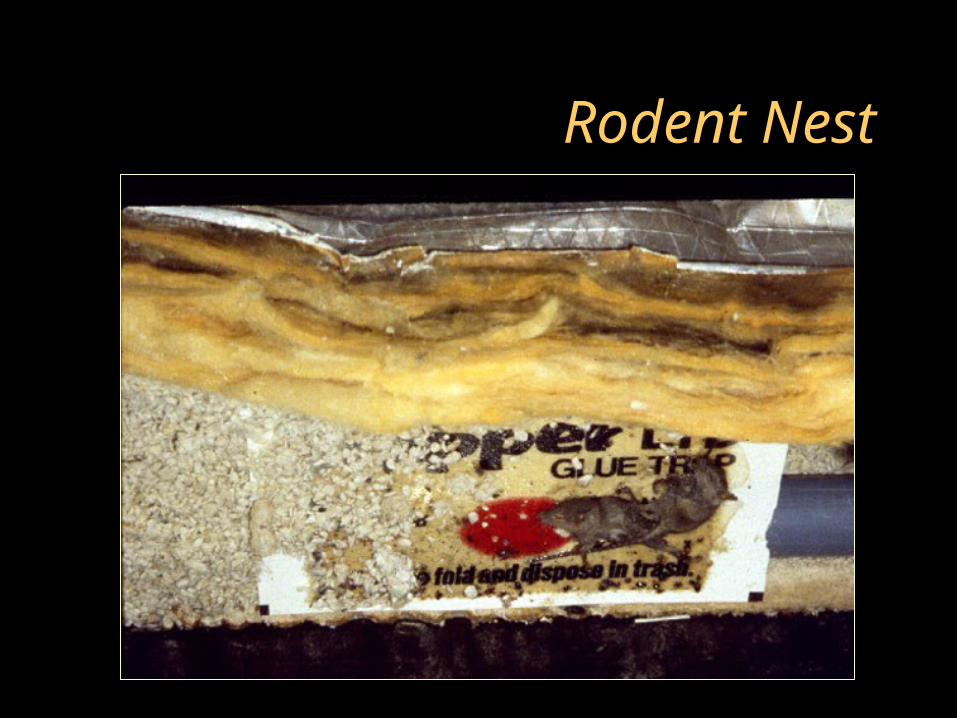
Rodent Nest
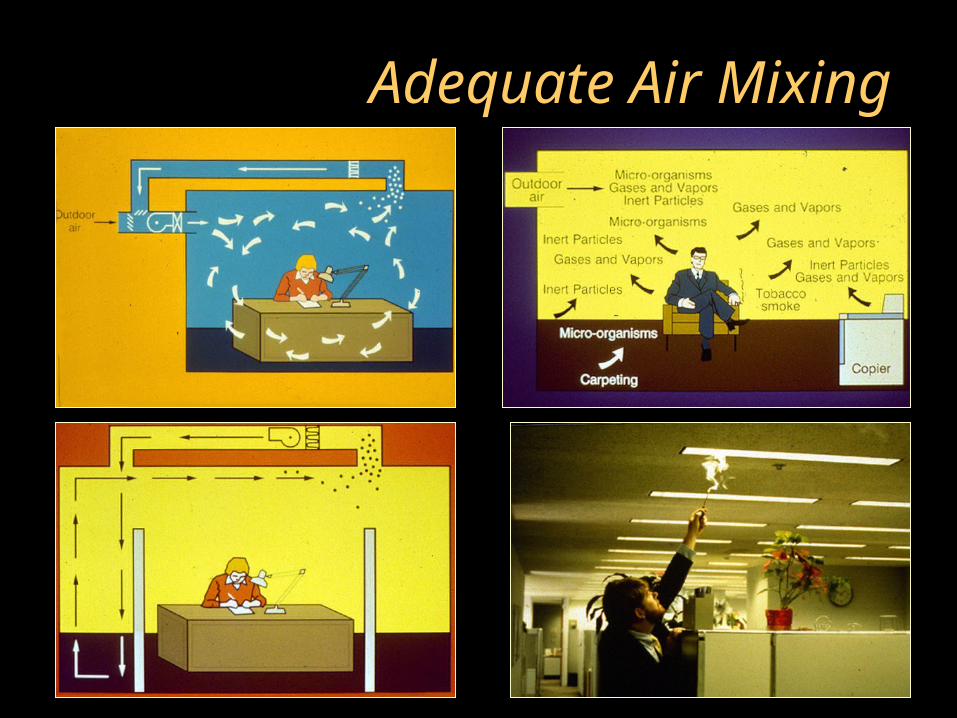
Adequate Air Mixing
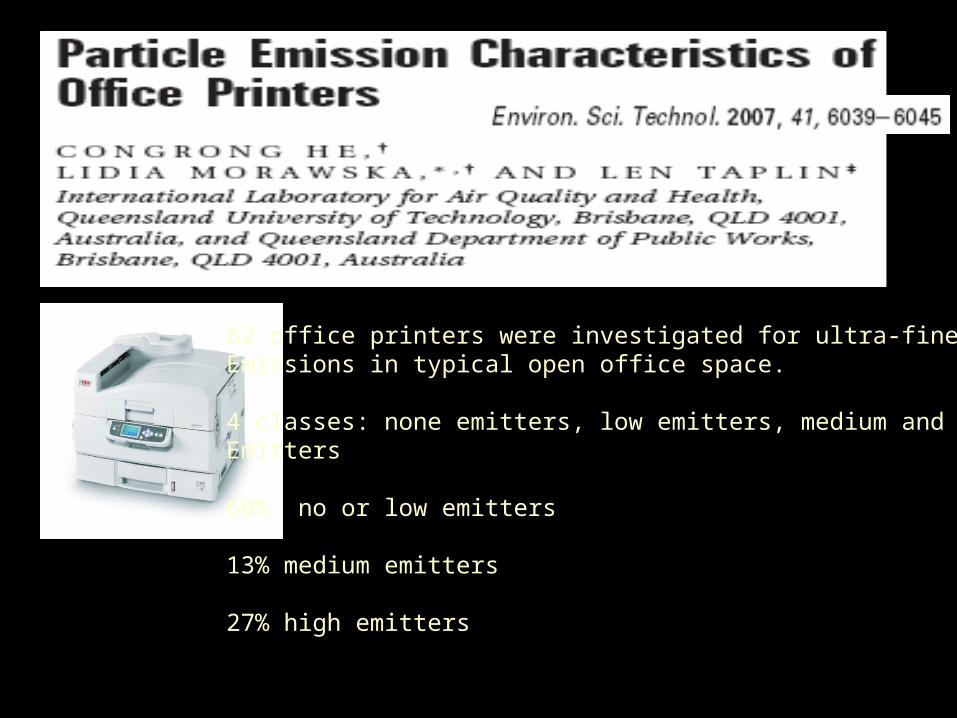
62 office printers were investigated for ultra-fine particleEmissions in typical open office space.
4 classes: none emitters, low emitters, medium and highEmitters
60% no or low emitters
13% medium emitters
27% high emitters
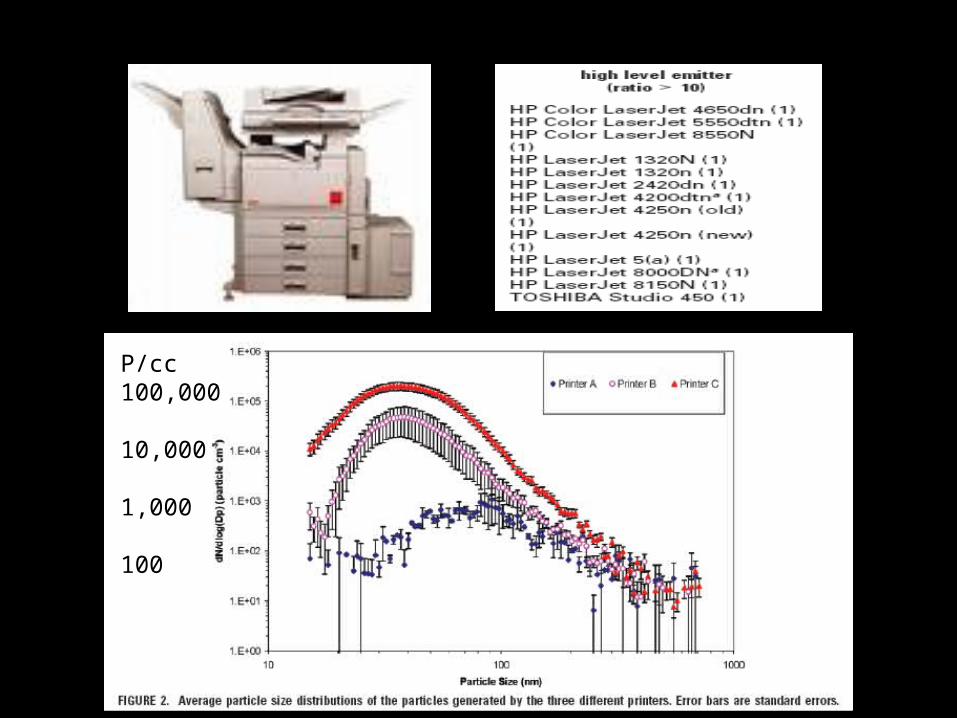
P/cc100,000
10,000
1,000
100
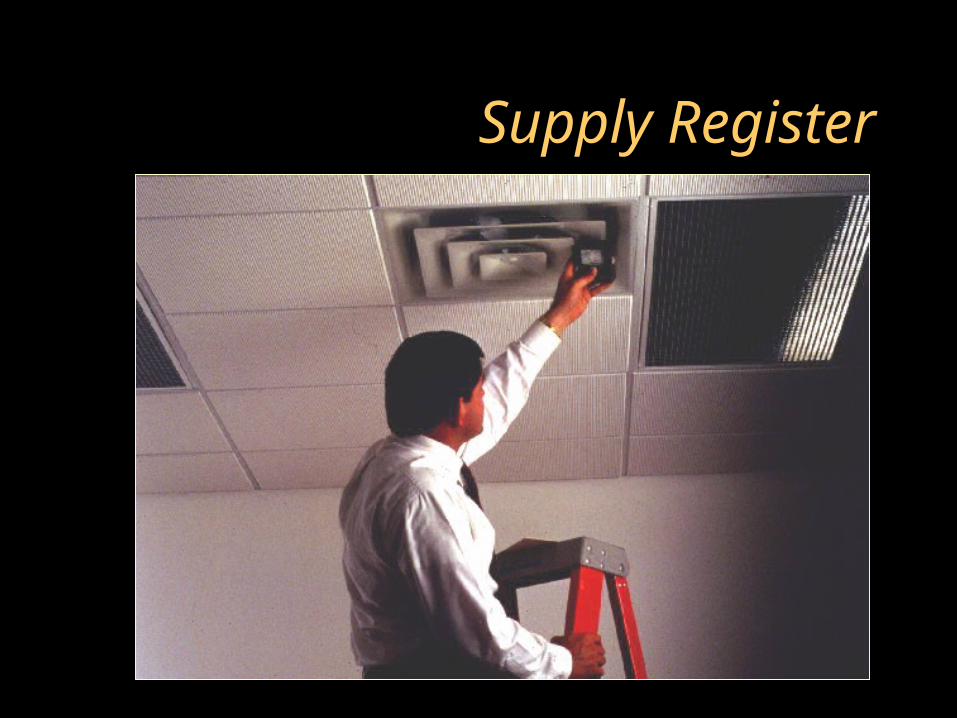
Supply Register
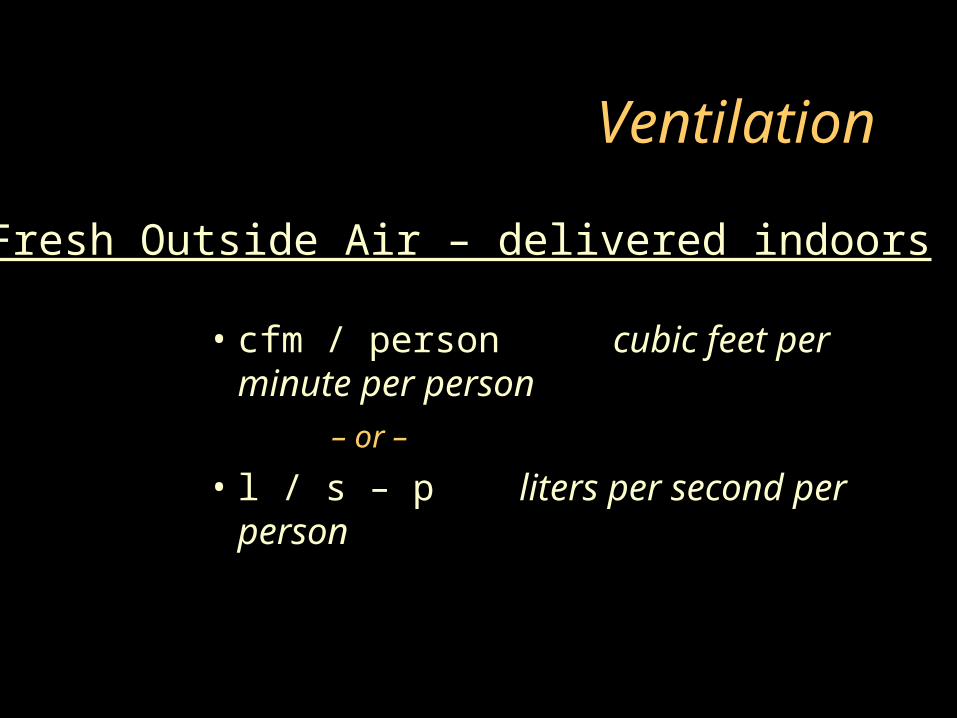
Ventilation
• cfm / person cubic feet per minute per person
– or –
• l / s – p liters per second per person
Fresh Outside Air – delivered indoors
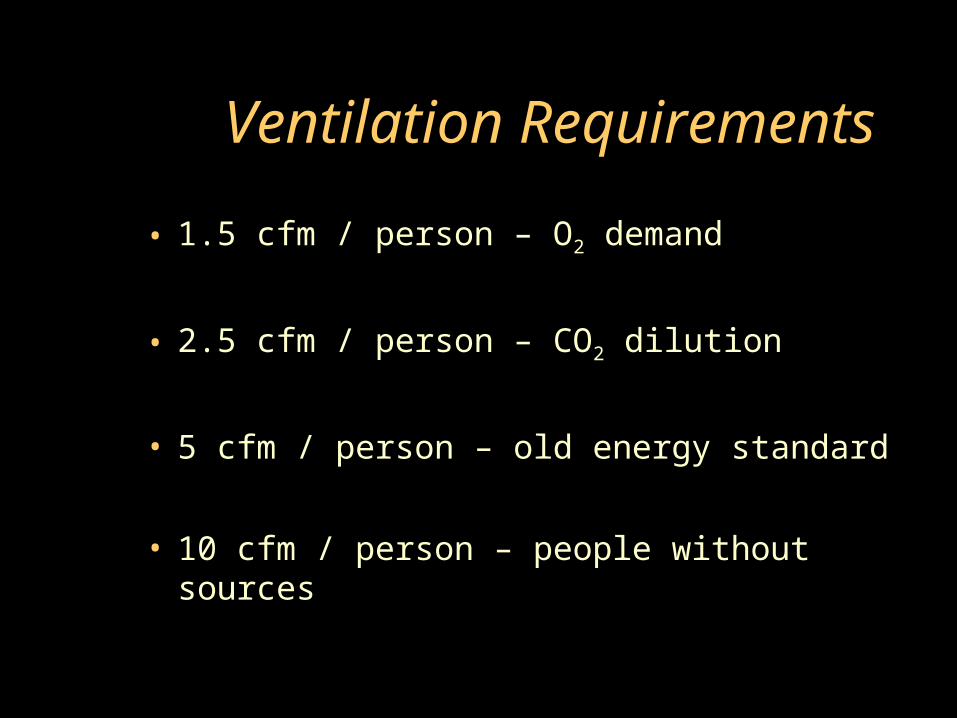
Ventilation Requirements
• 1.5 cfm / person – O2 demand
• 2.5 cfm / person – CO2 dilution
• 5 cfm / person – old energy standard
• 10 cfm / person – people without sources
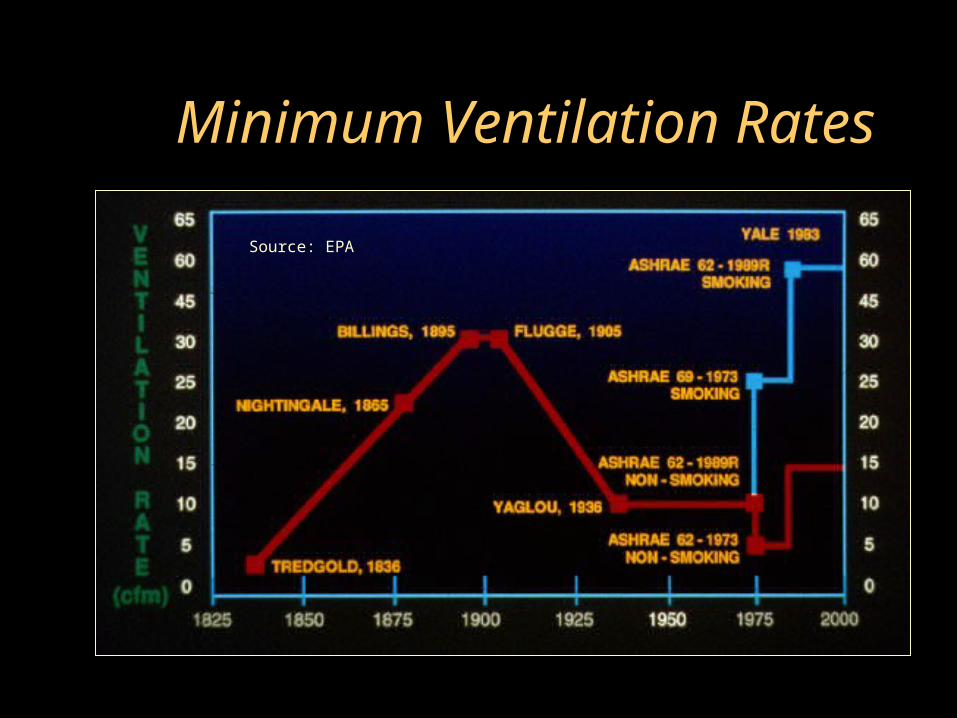
Minimum Ventilation Rates
Source: EPA
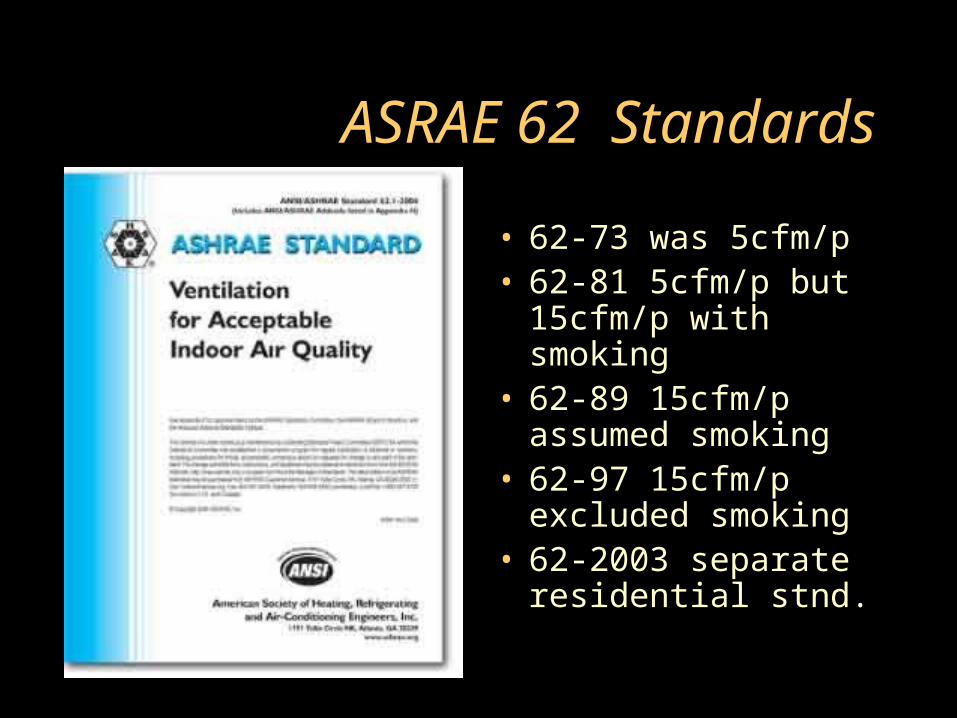
ASRAE 62 Standards
• 62-73 was 5cfm/p• 62-81 5cfm/p but
15cfm/p with smoking• 62-89 15cfm/p
assumed smoking• 62-97 15cfm/p
excluded smoking• 62-2003 separate
residential stnd.
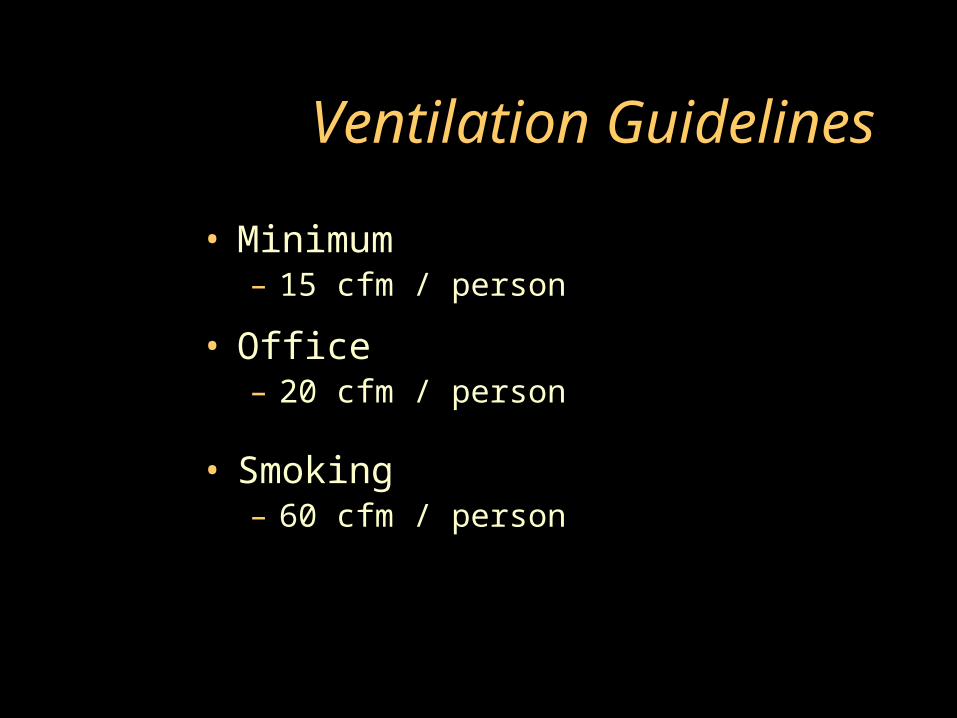
Ventilation Guidelines
• Minimum– 15 cfm / person
• Office– 20 cfm / person
• Smoking– 60 cfm / person
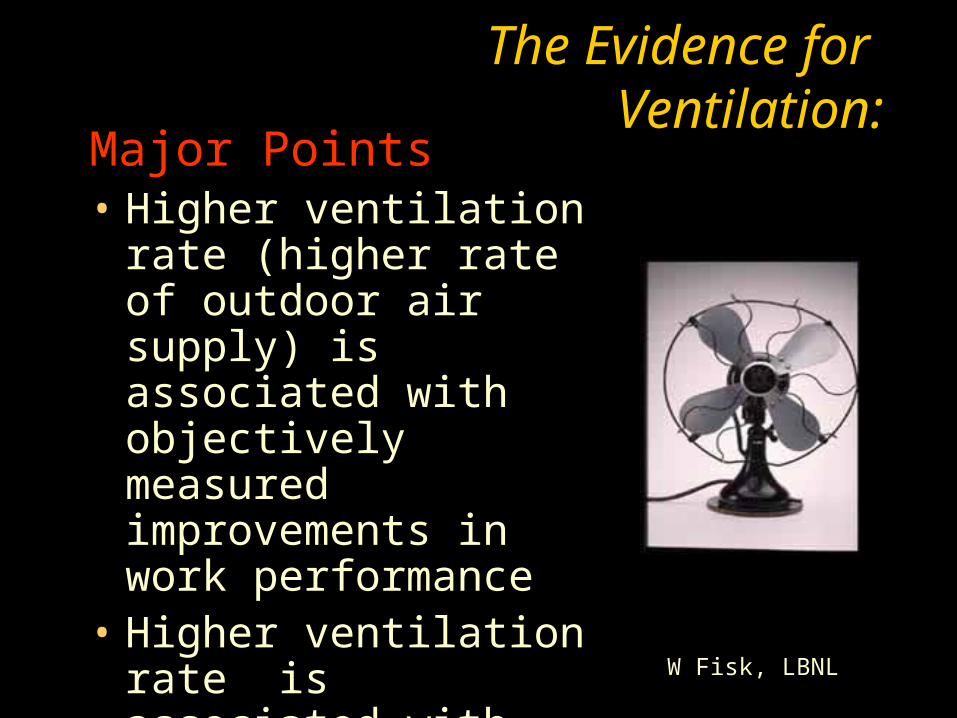
The Evidence for Ventilation:
Major Points• Higher ventilation rate
(higher rate of outdoor air supply) is associated with objectively measured improvements in work performance
• Higher ventilation rate is associated with reduced respiratory illness, less absence, and reduced sick building symptoms W Fisk, LBNL
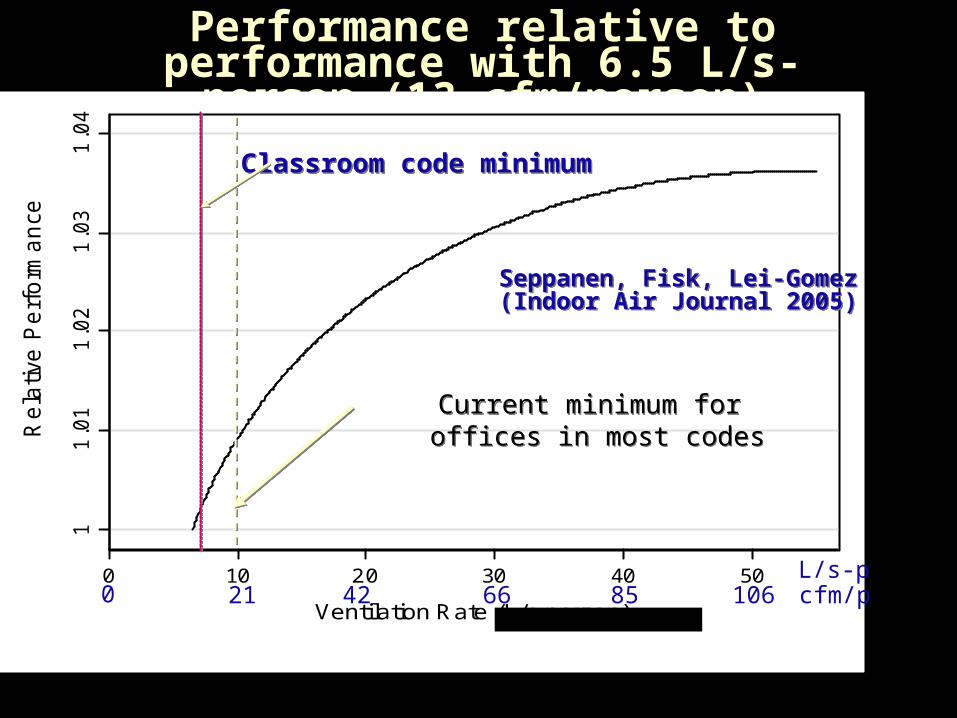
Performance relative to performance with 6.5 L/s-person (13
cfm/person)1
1.0
11
.02
1.0
31
.04
Re
lative
Pe
rfo
rma
nce
0 10 20 30 40 50
Ventilation Rate (L/s-person)
Current minimum for offices in most codesCurrent minimum for offices in most codes
Classroom code minimumClassroom code minimum
L/s-p21 42 66 85 106 cfm/p0
Seppanen, Fisk, Lei-Gomez (Indoor Air Journal 2005)Seppanen, Fisk, Lei-Gomez (Indoor Air Journal 2005)
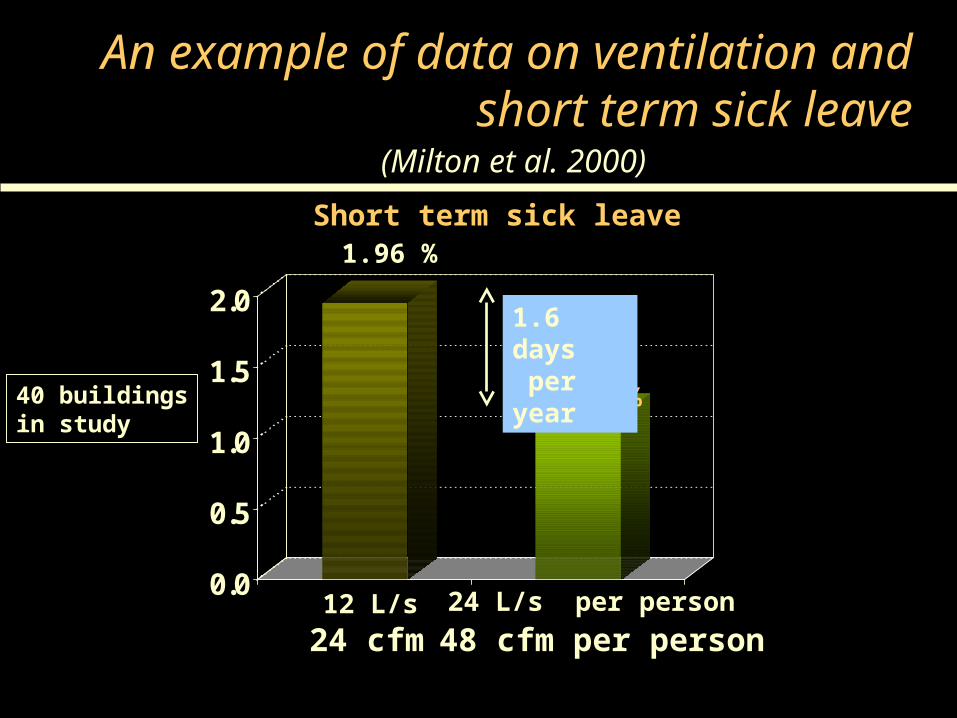
An example of data on ventilation and short term sick leave
Short term sick leave
0.0
0.5
1.0
1.5
2.0
12 L/s 24 L/s per person
1.16 %
1.96 %
1.6 days per year
(Milton et al. 2000)
24 cfm 48 cfm per person
40 buildingsin study

Even in Green Schools Ventilation can be Inadequate
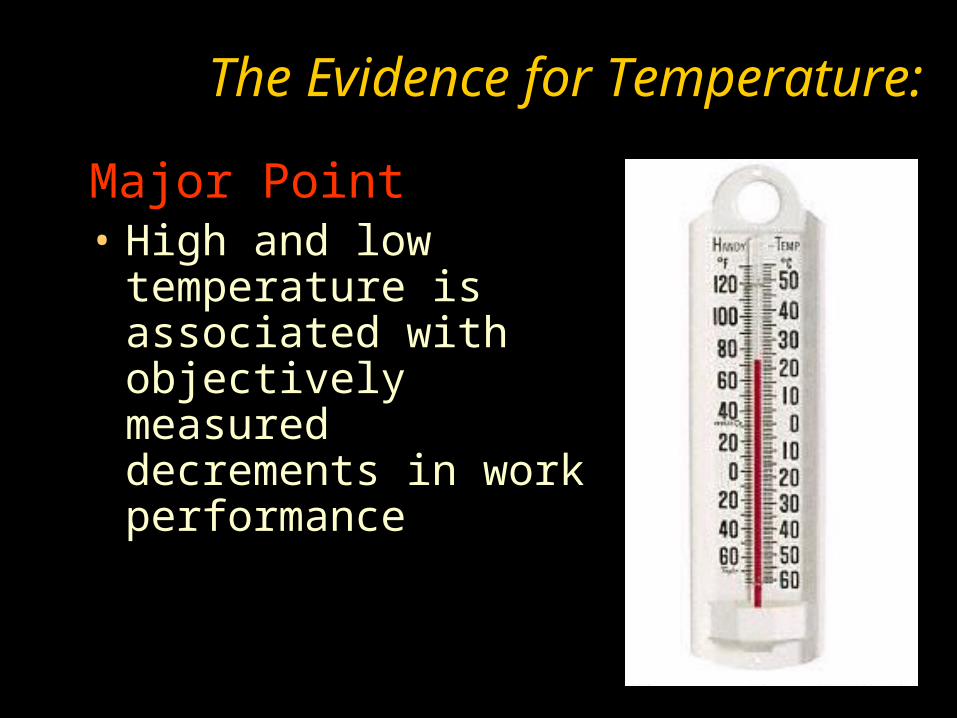
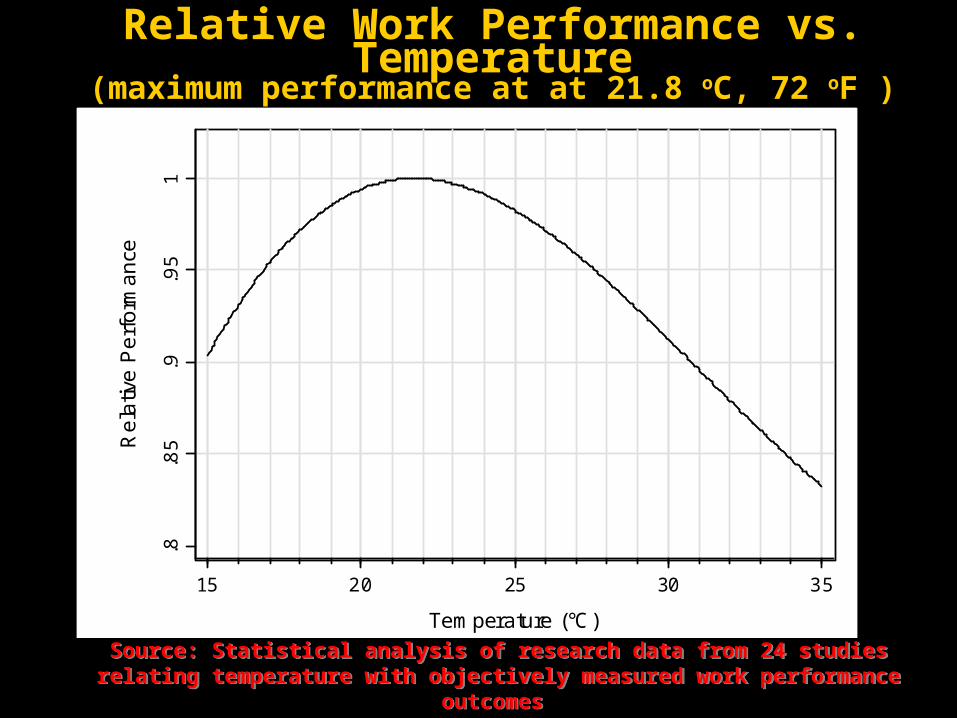
The Evidence for Temperature:
Major Point• High and low temperature
is associated with objectively measured decrements in work performance
.8.8
5.9
.95
1
Re
lativ
e P
erf
orm
an
ce
15 20 25 30 35
Temperature (°C)
Source: Statistical analysis of research data from 24 studies relating temperature with objectively measured work performance
outcomes Seppanen and Fisk (2005)
Source: Statistical analysis of research data from 24 studies relating temperature with objectively measured work performance
outcomes Seppanen and Fisk (2005)
Relative Work Performance vs. Temperature
(maximum performance at at 21.8 oC, 72 oF )
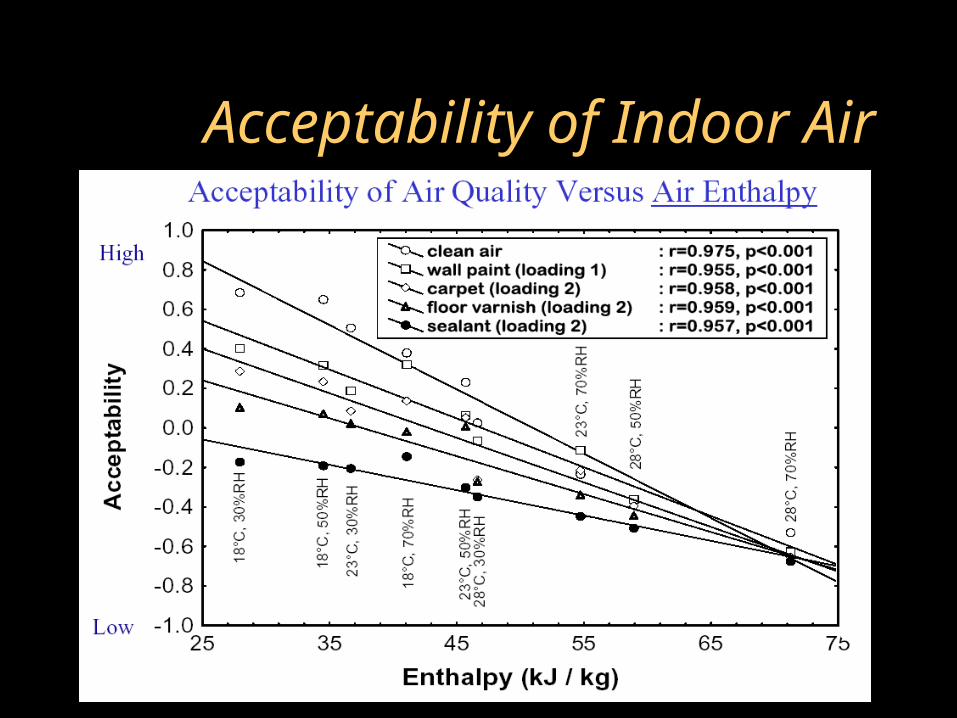
Acceptability of Indoor Air
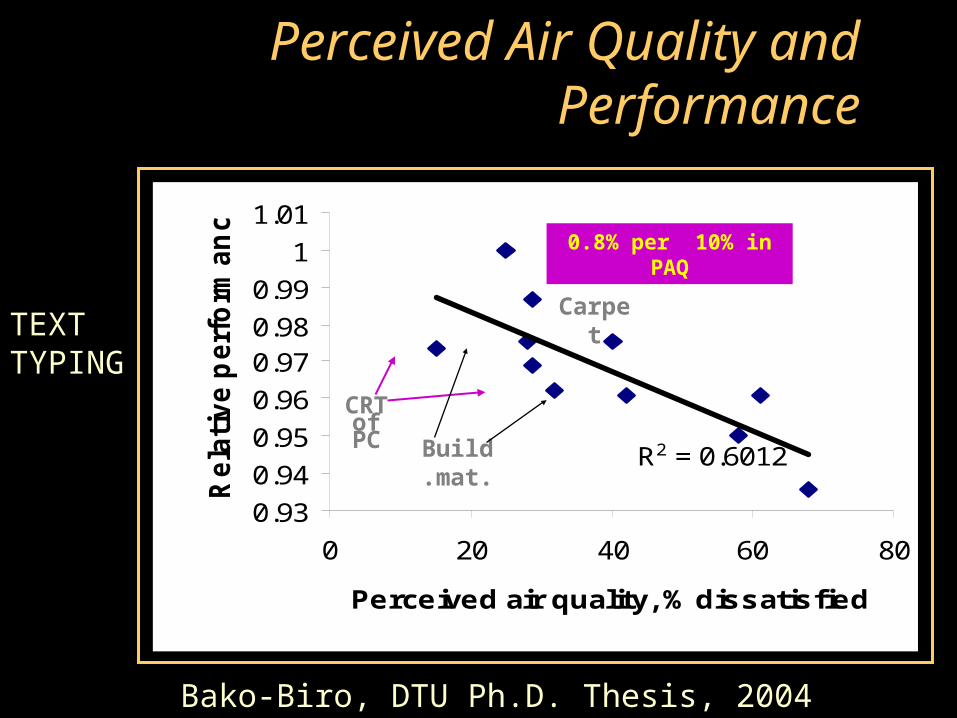
R2 = 0.6012
0.93
0.94
0.95
0.96
0.970.98
0.99
1
1.01
0 20 40 60 80
Perceived air quality, % dissatisfied
Rela
tive p
erf
orm
an
ce
CRT of
PC Build.mat.
Carpet
0.8% per 10% in PAQ
Perceived Air Quality and Performance
Bako-Biro, DTU Ph.D. Thesis, 2004
TEXTTYPING
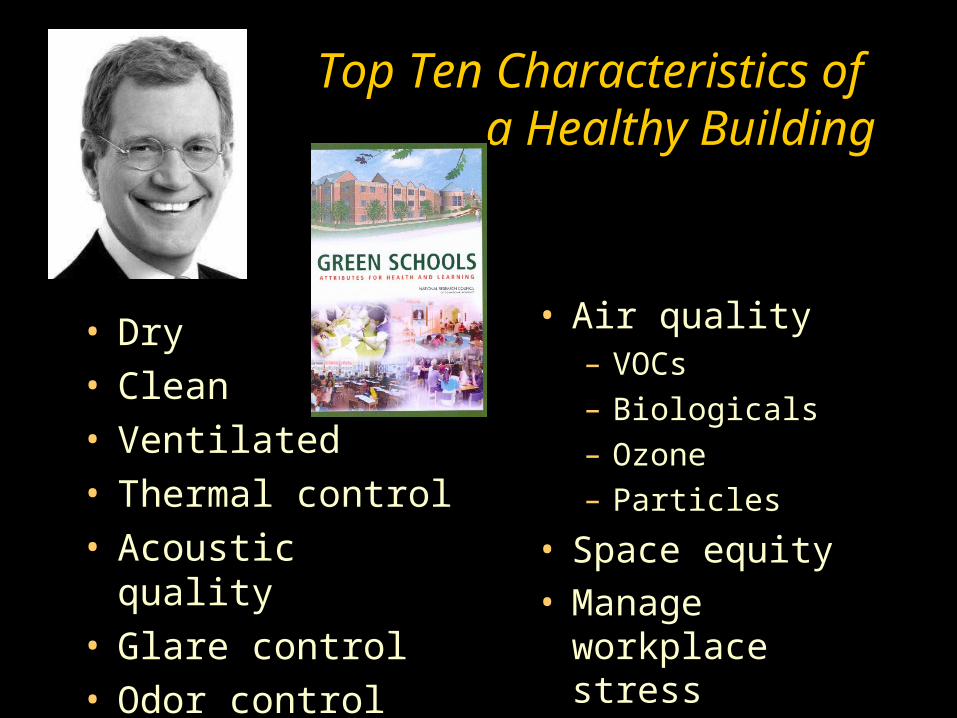
Top Ten Characteristics of a Healthy Building
• Dry• Clean• Ventilated• Thermal control• Acoustic quality• Glare control • Odor control
• Air quality– VOCs
– Biologicals
– Ozone
– Particles
• Space equity• Manage workplace
stress