and the search for nucleon resonances
TRANSCRIPT
PHYSICAL REVIEW C 80, 065209 (2009)
Partial wave analysis of the reaction γ p → pω and the search for nucleon resonances
M. Williams,1,* D. Applegate,1,† M. Bellis,1,† C. A. Meyer,1 K. P. Adhikari,27 M. Anghinolfi,18 H. Baghdasaryan,27,36 J. Ball,7
M. Battaglieri,18 I. Bedlinskiy,21 B. L. Berman,14 A. S. Biselli,1,11 W. J. Briscoe,14 W. K. Brooks,33,35 V. D. Burkert,33
S. L. Careccia,27 D. S. Carman,33 P. L. Cole,16 P. Collins,3 V. Crede,13 A. D’Angelo,19,30 A. Daniel,26 R. De Vita,18
E. De Sanctis,17 A. Deur,33 B Dey,1 S. Dhamija,12 R. Dickson,1 C. Djalali,32 G. E. Dodge,27 D. Doughty,8,33 M. Dugger,3
R. Dupre,2 A. El Alaoui,20,‡ L. Elouadrhiri,33 P. Eugenio,13 G. Fedotov,31 S. Fegan,15 A. Fradi,20 M. Y. Gabrielyan,12
M. Garcon,7 G. P. Gilfoyle,29 K. L. Giovanetti,22 F. X. Girod,7,§ W. Gohn,9 E. Golovatch,31 R. W. Gothe,32 K. A. Griffioen,37
M. Guidal,20 N. Guler,27 L. Guo,33,‖ K. Hafidi,2 H. Hakobyan,35,38 C. Hanretty,13 N. Hassall,15 K. Hicks,26 M. Holtrop,24
Y. Ilieva,14,32 D. G. Ireland,15 B. S. Ishkhanov,31 E. L. Isupov,31 S. S. Jawalkar,37 H. S. Jo,20 J. R. Johnstone,15 K. Joo,9
D. Keller,26 M. Khandaker,25 P. Khetarpal,28 W. Kim,23 A. Klein,27,‖ F. J. Klein,6 Z. Krahn,1,¶ V. Kubarovsky,28,33
S. V. Kuleshov,21,35 V. Kuznetsov,23 K. Livingston,15 H. Y. Lu,32 M. Mayer,27 J. McAndrew,10 M. E. McCracken,1
B. McKinnon,15 M. Mirazita,17 V. Mokeev,31,33 B. Moreno,20 K. Moriya,1 B. Morrison,3 E. Munevar,14 P. Nadel-Turonski,6
C. S. Nepali,27 S. Niccolai,20 G. Niculescu,22 I. Niculescu,22 M. R. Niroula,27 R. A. Niyazov,28,33 M. Osipenko,18
A. I. Ostrovidov,13 M. Paris,33,** K. Park,23,32,§ S. Park,13 E. Pasyuk,3 S. Anefalos Pereira,17 Y. Perrin,20,‡ S. Pisano,20
O. Pogorelko,21 S. Pozdniakov,21 J. W. Price,4 S. Procureur,7 D. Protopopescu,15 G. Ricco,18 M. Ripani,18 B. G. Ritchie,3
G. Rosner,15 P. Rossi,17 F. Sabatie,7 M. S. Saini,13 J. Salamanca,16 C. Salgado,25 D. Schott,12 R. A. Schumacher,1
H. Seraydaryan,27 Y. G. Sharabian,33 E. S. Smith,33 D. I. Sober,6 D. Sokhan,10 S. S. Stepanyan,23 P. Stoler,28 I. I. Strakovsky,14
S. Strauch,14,32 M. Taiuti,18 D. J. Tedeschi,32 S. Tkachenko,27 M. Ungaro,9,28 M. F. Vineyard,34 E. Voutier,20,‡ D. P. Watts,15,††
D. P. Weygand,33 M. H. Wood,5,32 J. Zhang,27 and B. Zhao9,‡‡
(CLAS Collaboration)1Carnegie Mellon University, Pittsburgh, Pennsylvania 15213, USA
2Argonne National Laboratory, Argonne, Illinois 60441, USA3Arizona State University, Tempe, Arizona 85287-1504, USA
4California State University, Dominguez Hills, Carson, California 90747, USA5Canisius College, Buffalo, New York 14208, USA
6Catholic University of America, Washington, DC 20064, USA7CEA, Centre de Saclay, Irfu/Service de Physique Nucleaire, F-91191 Gif-sur-Yvette, France
8Christopher Newport University, Newport News, Virginia 23606, USA9University of Connecticut, Storrs, Connecticut 06269, USA
10Edinburgh University, Edinburgh EH9 3JZ, United Kingdom11Fairfield University, Fairfield Connecticut 06824, USA
12Florida International University, Miami, Florida 33199, USA13Florida State University, Tallahassee, Florida 32306, USA
14The George Washington University, Washington, DC 20052, USA15University of Glasgow, Glasgow G12 8QQ, United Kingdom
16Idaho State University, Pocatello, Idaho 83209, USA17INFN, Laboratori Nazionali di Frascati, I-00044 Frascati, Italy
18INFN, Sezione di Genova, I-16146 Genova, Italy19INFN, Sezione di Roma Tor Vergata, I-00133 Rome, Italy
20Institut de Physique Nucleaire ORSAY, Orsay, France21Institute of Theoretical and Experimental Physics, Moscow RU-117259, Russia
22James Madison University, Harrisonburg, Virginia 22807, USA23Kyungpook National University, Daegu 702-701, Republic of Korea
24University of New Hampshire, Durham, New Hampshire 03824-3568, USA25Norfolk State University, Norfolk, Virginia 23504, USA
26Ohio University, Athens, Ohio 45701, USA27Old Dominion University, Norfolk, Virginia 23529, USA
28Rensselaer Polytechnic Institute, Troy, New York 12180-3590, USA29University of Richmond, Richmond, Virginia 23173, USA
30Universita’ di Roma Tor Vergata, I-00133 Rome, Italy31Skobeltsyn Nuclear Physics Institute, Moscow RU-119899, Russia
32University of South Carolina, Columbia, South Carolina 29208, USA33Thomas Jefferson National Accelerator Facility, Newport News, Virginia 23606, USA
34Union College, Schenectady, New York 12308, USA35Universidad Tecnica Federico Santa Marıa, Casilla 110-V Valparaıso, Chile
36University of Virginia, Charlottesville, Virginia 22901, USA37College of William and Mary, Williamsburg, Virginia 23187-8795, USA
0556-2813/2009/80(6)/065209(18) 065209-1 ©2009 The American Physical Society
M. WILLIAMS et al. PHYSICAL REVIEW C 80, 065209 (2009)
38Yerevan Physics Institute, 375036 Yerevan, Armenia(Received 23 August 2009; published 30 December 2009)
An event-based partial wave analysis (PWA) of the reaction γp → pω has been performed on a high-statistics dataset obtained using the CLAS at Jefferson Lab for center-of-mass energies from threshold up to2.4 GeV. This analysis benefits from access to the world’s first high-precision spin-density matrix elementmeasurements, available to the event-based PWA through the decay distribution of ω → π+π−π 0. The dataconfirm the dominance of the t-channel π 0 exchange amplitude in the forward direction. The dominant resonancecontributions are consistent with the previously identified states F15(1680) and D13(1700) near threshold, as wellas the G17(2190) at higher energies. Suggestive evidence for the presence of a JP = 5/2+ state around 2 GeV, a“missing” state, has also been found. Evidence for other states is inconclusive.
DOI: 10.1103/PhysRevC.80.065209 PACS number(s): 11.80.Cr, 11.80.Et, 13.30.Eg, 14.20.Gk
I. INTRODUCTION
Studying near-threshold ω photoproduction presents aninteresting opportunity to search for new baryon resonances.Measurements made by previous experiments have producedrelatively high-precision cross sections at most productionangles; however, precise spin-density matrix elements haveonly been measured at very forward angles and at higher en-ergies [1–5]. In the near-threshold region, the only previouslypublished spin-density matrix results, which come from theSAPHIR Collaboration, constitute a total of eight data pointsin the energy range from ω photoproduction threshold up to acenter-of-mass energy, W , of about 2.4 GeV [5].
A number of theoretical studies have been undertakenwith the goal of extracting resonance contributions to ω
photoproduction from these data. All of the authors agree onthe importance of contributions from π0 exchange in the t
channel; however, discrepancies exist on the importance ofvarious resonance contributions. In the calculations of Ohet al. [6], the dominant resonance contributions are found tobe from a “missing” P13(1910) state (i.e., a state predicted bythe constituent quark model but not observed experimentally)and from a D13(1960) state. In contrast to this, Titov andLee [7] find the most significant resonance contributions tobe from the D13(1520) and F15(1680) states. The quark modelcalculations made by Zhao [8] find that the two most importantresonance contributions to ω photoproduction come from the
*Current address: Imperial College London, London SW7 2AZ,United Kingdom.†Current address: Stanford University, Stanford, CA 94305, USA.‡Current address: LPSC-Grenoble, France.§Current address: Thomas Jefferson National Accelerator Facility,
Newport News, Virginia 23606, USA.‖Current address: Los Alamos National Laborotory, New Mexico,
NM, USA.¶Current address: University of Minnesota, Minneapolis, MN
55455, USA.**Current address: The George Washington University, Washington,
DC 20052, USA.††Current address: Edinburgh University, Edinburgh EH9 3JZ,
United Kingdom.‡‡Current address: College of William and Mary, Williamsburg,
Virginia 23187-8795, USA.
P13(1720) and F15(1680) states. The P11(1710) and P13(1900)states were found to be the dominant resonance contributionsin the coupled-channel analysis of Penner and Mosel [9].
All of the models mentioned above were fit solely todifferential cross sections. A more recent analysis [10] alsoincluded the spin-density matrix elements published by theSAPHIR Collaboration [5]. This work found the largestresonant contributions to ω photoproduction to be from thesubthreshold D15(1675) and F15(1680) states. The authorsnoted the importance of the strong additional constraintsplaced on their model by the polarization information andconcluded that: there is urgent need for precise measurementsof the spin-density matrix in more narrow energy bins to pindown the reaction picture.
Recently published results from the CEBAF Large Accep-tance Spectrometer (CLAS) have provided such measurements[11]. In the center-of-mass (c.m.) energy range from thresholdup to 2.84 GeV, differential cross section results were reportedat 1960 points in W and cos θω
c.m.. The experiment did notuse a polarized beam or a polarized target; thus, only theρ0
00, ρ01−1, and Re(ρ0
10) elements of the spin-density matrixcould be determined (the definitions of which can be foundin [12]). These results were reported at 2015 points in W andcos θω
c.m.. The increase in precision for ρ0MM ′ , in the energy
range overlapping the SAPHIR results, is approximately afactor of 148.
In this paper, we present an event-based mass-independentpartial wave analysis (PWA) of these data, i.e., the dataare only divided into narrow c.m. energy bins. In each ofthese narrow bins, the spin-independent part of any resonancepropagator—a complex function of W—is approximated asa constant complex number. This allows us to reduce modeldependence in our treatment of resonances (see Sec. III C forfurther discussion on this topic).
The data used in our analysis were obtained using the CLAShoused in Hall B at the Thomas Jefferson National AcceleratorFacility. Real photons were produced via bremsstrahlungfrom a 4.02 GeV electron beam. The momenta of the recoilingelectrons were then analyzed in order to obtain the energy ofthe photons with an uncertainty of 0.1% [13]. The physicstarget was filled with liquid hydrogen. The ω → π+π−π0
decay was used to select the reaction of interest. The momentaof the charged particles (p, π+, π−) were determined using theCLAS with an uncertainty of approximately 0.5%. The neutral
065209-2
PARTIAL WAVE ANALYSIS OF THE REACTION . . . PHYSICAL REVIEW C 80, 065209 (2009)
π0 was reconstructed using kinematic fitting. More detailsconcerning the analysis techniques can be found in [11,14].A detailed description of the CLAS can be found in [15].
In total, the dataset consists of over 10 million signalevents divided into 112 10-MeV wide c.m. energy bins. Ourprimary interest is in extracting possible nucleon resonancecontributions; thus, we have restricted our PWA to includeonly bins with W < 2.4 GeV. In total, 67 c.m. energy binswere used in the PWA (the W = 1.955 GeV bin was excludeddue to issues with the normalization calculation [11]). Thiswork represents the first event-based PWA results on baryonsfrom photoproduction data.
II. PWA FORMULAS
As stated above, to limit theoretical model dependence wedivided our data into 10-MeV wide W bins. Thus, all formulaswritten below are intended to describe data from a narrow c.m.energy range. In all of the work that follows, pi, pf , q, and k
will be used for the initial proton, final proton, ω, and photonfour-momenta. The z-axis in the overall c.m. frame, definedby k, is used as the angular momentum quantization axis. TheMandelstam variables are defined as
s = (pi + k)2 = (pf + q)2, (1a)
t = (q − k)2 = (pi − pf )2, (1b)
u = (pi − q)2 = (pf − k)2. (1c)
The mass of the proton and ω are denoted as wp and wω,respectively.
The Lorentz invariant transition amplitude, M, of theprocess γp → pω → pπ+π−π0, can be written as
|M(�α, �x)|2 =∑
mi,mγ ,mf
∣∣∣∣∣∑
a
Aami ,mγ ,mf
(�α, �x)
∣∣∣∣∣2
, (2)
where mi,mγ ,mf are the initial proton, incident photon, andfinal proton spin projections, Aa
mi ,mγ ,mfare the partial wave
amplitudes (the form of which is discussed in Sec. III), �xdenotes the complete set of kinematic variables describing thereaction and �α are the unknown parameters to be determinedby the fit. We denote the detector acceptance by η(�x) and thephase-space volume as d�(�x) = φ(�x)d �x. A more detailed de-scription of the work presented in this section is given in [14].
A. Likelihood
All of our fits are event-based; thus, the data were onlybinned in W . To obtain estimators for the unknown parameters,α, we employ the extended unbinned maximum likelihoodmethod. The work detailed in this section is based on that ofChung [16]; however, the normalizations we have developeddiffer from his work. The likelihood function is defined as
L =[n(�α)n
n!e−n(�α)
] n∏i
P(�α, �xi), (3)
where the term in brackets is the Poisson probability ofobtaining n events given the expected number n(�α) (thecalculation of which is discussed below), �xi represents the
complete set of kinematic variables of the ith event, andP(�α, �x) is the probability density function given by
P(�α, �xi) = |M(�α, �xi)|2η(�xi)φ(�xi)∫ |M(�α, �x)|2η(�x)φ(�x)d �x . (4)
From left to right, Eq. (4) accounts for the relative strengthof the transition amplitude, the detection probability, andthe available phase space for the ith event. Calculation ofthe denominator, which normalizes the probability densityfunction, is discussed below. The estimators α are then foundby maximizing L.
B. Normalization
The expected number of signal events for a given set ofparameters is given by
n(�α) = T (s)(2π )4
8(s − w2
p
)∫
|M(�α, �x)|2η(�x)d�(�x), (5)
which includes the average over initial spin states
T (s) = F(s)ρtargtargNAb
Atarg(6)
is the “target factor” obtained from the target density, ρtarg,length, targ, and atomic number, Atarg; along with Avogadro’snumber, NA; the branching fraction of ω → π+π−π0, b; andthe integrated photon flux in each W bin, F(s).
The integral in Eq. (5) must be done numerically due tothe lack of an analytic expression for the detector acceptance.Monte Carlo events were generated in each W bin accordingto γp → pω (the ω mass was generated according to aBreit-Wigner distribution), ω → π+π−π0 phase space andthen run through a GEANT-based detector simulation package(discussed in detail in [11,14]). This procedure simulates theacceptance of the detector by rejecting events that would nothave survived the data analysis, i.e., for each generated event,the acceptance factor η(�xi) = 0 or 1. The integral can then beapproximated by∫
|M(�α, �x)|2η(�x)d�(�x) ≈∫
d�(�x)
ngen
nacc∑i
|M(�α, �xi)|2, (7)
where ngen(nacc) is the number of generated (accepted) MonteCarlo events and∫
d�(�x) = {[s − (wp + wω)2][s − (wp − wω)2]}1/2
4(2π )5s(8)
is the volume of the two-body pω phase space (the 3π phase-space volume is factored into the normalization of the ω decayamplitude).
Using Eqs. (7) and (8), Eq. (5) can be rewritten as
n(�α) = {[s − (wp + wω)2][s − (wp − wω)2]}1/2
64πs(s − w2
p
)
× T (s)
ngen
nacc∑i
|M(�α, �xi)|2. (9)
This normalization allows us to use physical coupling con-stants in our event-based fits, i.e., it allows us to put our
065209-3
M. WILLIAMS et al. PHYSICAL REVIEW C 80, 065209 (2009)
parameters on an absolute scale. Thus, our normalizationscheme permits direct theoretical input.
C. Log likelihood
Due to the monotonically increasing nature of the naturallogarithm, the likelihood, L, defined in Eq. (3) can bemaximized by minimizing
−lnL = −n ln n(�α) + ln n! + n(�α) −n∑i
lnP(�α, �xi), (10)
which, using Eqs. (4) and (5), can be rewritten as
−lnL = ln n! + n(�α) + n ln8(s − w2
p
)T (s)(2π )4
−n∑i
ln |M(�α, �xi)|2η(�xi)φ(�xi). (11)
Neglecting terms that do not depend on the parameters, we canthen rewrite Eq. (11) as follows:
−lnL = −n∑i
ln |M(�α, �xi)|2 + n(�α) + const. (12)
We note here that for any set of estimators that minimizeEq. (12), the expected number of events is n(α) = n.
D. Handling background
To accurately extract partial wave contributions to ω
photoproduction, background events, i.e., non-ω events, mustbe separated from the signal in a way that preserves allkinematic correlations. The method we applied to our data,described in detail in [11,14,17], assigned each event a signalquality factor, or Q factor. This background was assumed tobe noninterfering. Following our previous work [17], we canrewrite Eq. (12) using these Q factors as
−lnL = −n∑i
Qi ln |M(�α, �xi)|2 + n(�α) + const, (13)
where Qi is the Q factor for the ith event. Thus, the Q
factors are used to weight each event’s contribution to thelikelihood. We also note that in the literature, the t- andu-channel contributions are often referred to as background.This theoretical background is not to be confused with theexperimental background discussed here. In this analysis,the theoretical backgrounds were allowed to interfere withthe s-channel amplitudes in our PWA.
III. PWA AMPLITUDES
The choice of which amplitudes to include to describe thedata is partially motivated by experimental measurements.The ω photoproduction cross section is known to have astrong forward peak, even at near-threshold energies [11]. Athigher energies, the cross section develops a rather pronouncedbackward peak as well [11]. These features are typically
p p
ωγπ0ε , η
(a)
p p
ωγP
(b)
p ω
pγp
(c) (d)
(e)
p p
ωγ p
p p
ωγN∗
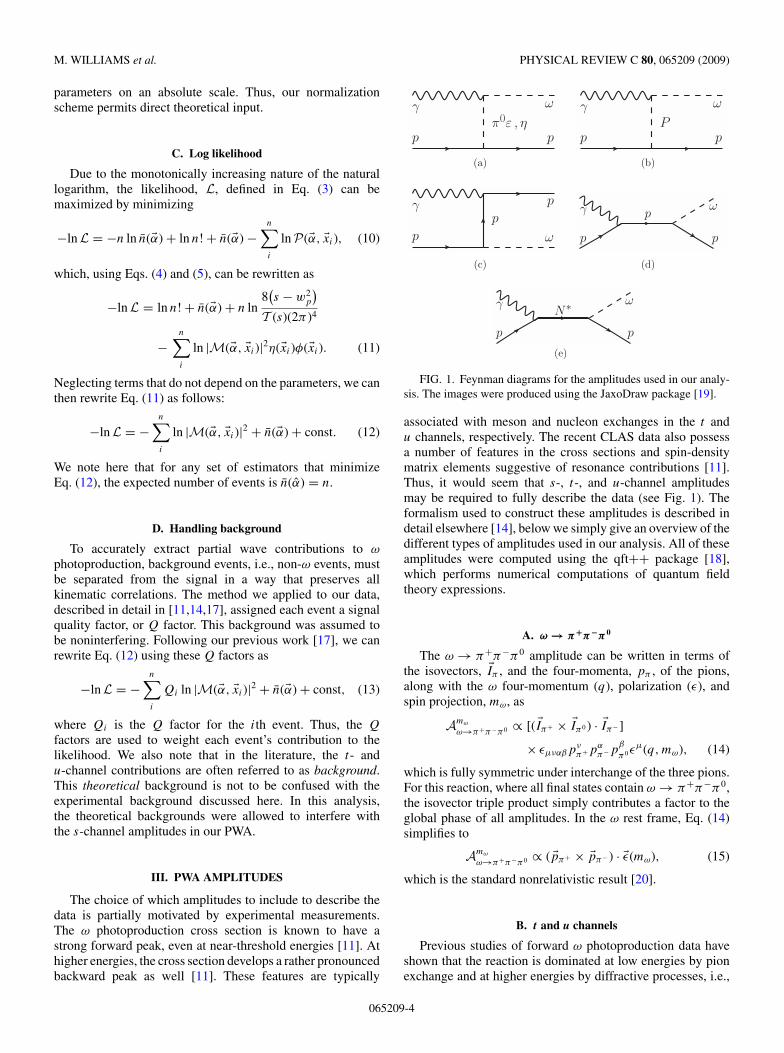
FIG. 1. Feynman diagrams for the amplitudes used in our analy-sis. The images were produced using the JaxoDraw package [19].
associated with meson and nucleon exchanges in the t andu channels, respectively. The recent CLAS data also possessa number of features in the cross sections and spin-densitymatrix elements suggestive of resonance contributions [11].Thus, it would seem that s-, t-, and u-channel amplitudesmay be required to fully describe the data (see Fig. 1). Theformalism used to construct these amplitudes is described indetail elsewhere [14], below we simply give an overview of thedifferent types of amplitudes used in our analysis. All of theseamplitudes were computed using the qft++ package [18],which performs numerical computations of quantum fieldtheory expressions.
A. ω → π+π−π 0
The ω → π+π−π0 amplitude can be written in terms ofthe isovectors, �Iπ , and the four-momenta, pπ , of the pions,along with the ω four-momentum (q), polarization (ε), andspin projection, mω, as
Amω
ω→π+π−π0 ∝ [( �Iπ+ × �Iπ0 ) · �Iπ− ]
× εµναβpνπ+pα
π−pβ
π0εµ(q,mω), (14)
which is fully symmetric under interchange of the three pions.For this reaction, where all final states contain ω → π+π−π0,the isovector triple product simply contributes a factor to theglobal phase of all amplitudes. In the ω rest frame, Eq. (14)simplifies to
Amω
ω→π+π−π0 ∝ ( �pπ+ × �pπ− ) · �ε(mω), (15)
which is the standard nonrelativistic result [20].
B. t and u channels
Previous studies of forward ω photoproduction data haveshown that the reaction is dominated at low energies by pionexchange and at higher energies by diffractive processes, i.e.,
065209-4
PARTIAL WAVE ANALYSIS OF THE REACTION . . . PHYSICAL REVIEW C 80, 065209 (2009)
Pomeron exchange (see, e.g., [1]). We have chosen to usethe nonresonant terms included in the model of Oh, Titov,and Lee (OTL) [6] in our partial wave analysis. The OTLPomeron exchange amplitude follows the work of Donnachieand Landshoff [21] with the unknown parameters fixed byfitting to high energy vector meson cross section data.
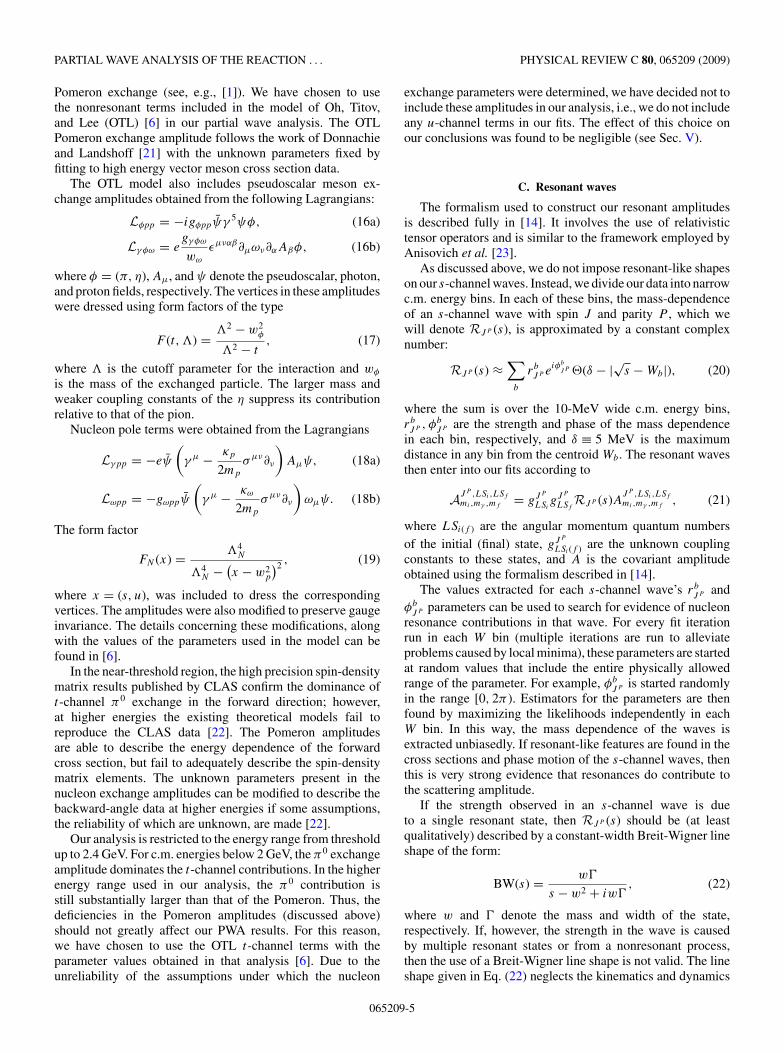
The OTL model also includes pseudoscalar meson ex-change amplitudes obtained from the following Lagrangians:
Lφpp = −igφppψγ 5ψφ, (16a)
Lγφω = egγφω
wω
εµναβ∂µων∂αAβφ, (16b)
where φ = (π, η), Aµ, and ψ denote the pseudoscalar, photon,and proton fields, respectively. The vertices in these amplitudeswere dressed using form factors of the type
F (t, �) = �2 − w2φ
�2 − t, (17)
where � is the cutoff parameter for the interaction and wφ
is the mass of the exchanged particle. The larger mass andweaker coupling constants of the η suppress its contributionrelative to that of the pion.
Nucleon pole terms were obtained from the Lagrangians
Lγpp = −eψ
(γ µ − κp
2mp
σµν∂ν
)Aµψ, (18a)
Lωpp = −gωppψ
(γ µ − κω
2mp
σµν∂ν
)ωµψ. (18b)
The form factor
FN (x) = �4N
�4N − (
x − w2p
)2 , (19)
where x = (s, u), was included to dress the correspondingvertices. The amplitudes were also modified to preserve gaugeinvariance. The details concerning these modifications, alongwith the values of the parameters used in the model can befound in [6].
In the near-threshold region, the high precision spin-densitymatrix results published by CLAS confirm the dominance oft-channel π0 exchange in the forward direction; however,at higher energies the existing theoretical models fail toreproduce the CLAS data [22]. The Pomeron amplitudesare able to describe the energy dependence of the forwardcross section, but fail to adequately describe the spin-densitymatrix elements. The unknown parameters present in thenucleon exchange amplitudes can be modified to describe thebackward-angle data at higher energies if some assumptions,the reliability of which are unknown, are made [22].
Our analysis is restricted to the energy range from thresholdup to 2.4 GeV. For c.m. energies below 2 GeV, the π0 exchangeamplitude dominates the t-channel contributions. In the higherenergy range used in our analysis, the π0 contribution isstill substantially larger than that of the Pomeron. Thus, thedeficiencies in the Pomeron amplitudes (discussed above)should not greatly affect our PWA results. For this reason,we have chosen to use the OTL t-channel terms with theparameter values obtained in that analysis [6]. Due to theunreliability of the assumptions under which the nucleon
exchange parameters were determined, we have decided not toinclude these amplitudes in our analysis, i.e., we do not includeany u-channel terms in our fits. The effect of this choice onour conclusions was found to be negligible (see Sec. V).
C. Resonant waves
The formalism used to construct our resonant amplitudesis described fully in [14]. It involves the use of relativistictensor operators and is similar to the framework employed byAnisovich et al. [23].
As discussed above, we do not impose resonant-like shapeson our s-channel waves. Instead, we divide our data into narrowc.m. energy bins. In each of these bins, the mass-dependenceof an s-channel wave with spin J and parity P , which wewill denote RJP (s), is approximated by a constant complexnumber:
RJP (s) ≈∑
b
rbJP e
iφb
JP �(δ − |√s − Wb|), (20)
where the sum is over the 10-MeV wide c.m. energy bins,rbJP , φb
JP are the strength and phase of the mass dependencein each bin, respectively, and δ ≡ 5 MeV is the maximumdistance in any bin from the centroid Wb. The resonant wavesthen enter into our fits according to
AJP ,LSi ,LSf
mi ,mγ ,mf= gJP
LSigJP
LSfRJP (s)A
JP ,LSi ,LSf
mi ,mγ ,mf, (21)
where LSi(f ) are the angular momentum quantum numbersof the initial (final) state, gJP
LSi (f ) are the unknown couplingconstants to these states, and A is the covariant amplitudeobtained using the formalism described in [14].
The values extracted for each s-channel wave’s rbJP and
φbJP parameters can be used to search for evidence of nucleon
resonance contributions in that wave. For every fit iterationrun in each W bin (multiple iterations are run to alleviateproblems caused by local minima), these parameters are startedat random values that include the entire physically allowedrange of the parameter. For example, φb
JP is started randomlyin the range [0, 2π ). Estimators for the parameters are thenfound by maximizing the likelihoods independently in eachW bin. In this way, the mass dependence of the waves isextracted unbiasedly. If resonant-like features are found in thecross sections and phase motion of the s-channel waves, thenthis is very strong evidence that resonances do contribute tothe scattering amplitude.
If the strength observed in an s-channel wave is dueto a single resonant state, then RJP (s) should be (at leastqualitatively) described by a constant-width Breit-Wigner lineshape of the form:
BW(s) = w�
s − w2 + iw�, (22)
where w and � denote the mass and width of the state,respectively. If, however, the strength in the wave is causedby multiple resonant states or from a nonresonant process,then the use of a Breit-Wigner line shape is not valid. The lineshape given in Eq. (22) neglects the kinematics and dynamics
065209-5
M. WILLIAMS et al. PHYSICAL REVIEW C 80, 065209 (2009)
of the mass dependence of the resonance. This can be an issue,e.g., near threshold. This will be addressed below.
IV. RESULTS
Before examining our results, it is important to reiteratethe goals of our analysis. We are attempting to extractstrong resonance contributions to ω photoproduction in a leastmodel-dependent way. We do not enforce resonance shapeson the mass dependence of our partial waves. Instead, we firstextract the strengths and phase motion of our partial wavesindependently in each W bin. This stage will be referred to asa partial wave extraction (PWE). The second stage involvescomparing the results of the PWE to what is expected fromresonances in a mass-dependent fit (MDF). The PWE’s areperformed using unbinned extended maximum likelihood fitsto the data in each W bin. The MDF’s are simply χ2 fits to thephase differences obtained between partial waves in a givenW region.
We are not looking to build a complete model of ω photo-production, i.e., we do not claim that the fits discussed belowcontain all of the amplitudes that contribute to this reaction.Because of this, we do not expect the physical observablesextracted from our fits to provide perfect descriptions of ourmeasurements; however, the descriptions in many kinematicregions are very good. Finally, we are not attempting to extractall resonance contributions to ω photoproduction, only themost significant.
A. Choice of wave sets
It is important to have a systematic method for selectingwave sets. As discussed in Sec. III B, all of the wave sets usedin our analysis contain the OTL t-channel terms (which containno free parameters) and no u-channel terms. Systematicstudies show that the effects on extracted resonance parametersdue to the choice of the nonresonant model are small(see Sec. V).
The mass-independent nature of our procedure, i.e., thebin-to-bin freedom of the resonance parameters, makes theuse of smaller wave sets advantageous. For this reason, webegan our wave selection process by scanning the entire energyrange of interest, 1.72 GeV < W < 2.4 GeV, using the OTL t-channel terms along with waves from a single spin-parity, JP .The goal of this scan was to identify (possible) energy rangeswhere waves of a given JP perform significantly better thanwaves of any other spin-parity. This information alone doesnot constitute evidence of resonance production; however, itcan serve as a guide as to which waves are more likely tocontribute strongly to ω photoproduction.
Given a pair of fits run with different wave sets, thedifference in the log likelihoods obtained from the fits,� lnL ≡ lnLa − lnLb, can be used to quantitatively de-termine which fit best describes the data. If � lnL > 0,then wave set a provides a better description of the datathan wave set b, while � lnL < 0 implies the converseis true.
W (MeV)
1800 1900 2000 2100
ln(L
)∆
0
5000
10000
15000
+,5/2+1/2 ln(L)∆
-,3/2+1/2 ln(L)∆
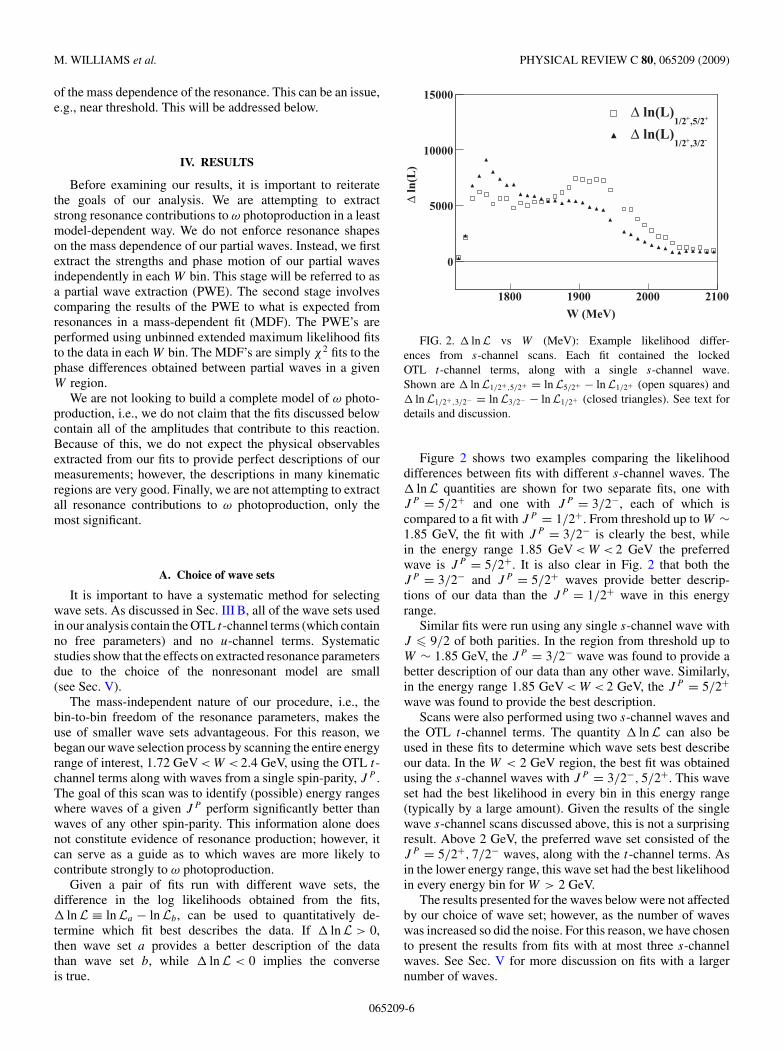
FIG. 2. � lnL vs W (MeV): Example likelihood differ-ences from s-channel scans. Each fit contained the lockedOTL t-channel terms, along with a single s-channel wave.Shown are � lnL1/2+,5/2+ = lnL5/2+ − lnL1/2+ (open squares) and� lnL1/2+,3/2− = lnL3/2− − lnL1/2+ (closed triangles). See text fordetails and discussion.
Figure 2 shows two examples comparing the likelihooddifferences between fits with different s-channel waves. The� lnL quantities are shown for two separate fits, one withJP = 5/2+ and one with JP = 3/2−, each of which iscompared to a fit with JP = 1/2+. From threshold up to W ∼1.85 GeV, the fit with JP = 3/2− is clearly the best, whilein the energy range 1.85 GeV < W < 2 GeV the preferredwave is JP = 5/2+. It is also clear in Fig. 2 that both theJP = 3/2− and JP = 5/2+ waves provide better descrip-tions of our data than the JP = 1/2+ wave in this energyrange.
Similar fits were run using any single s-channel wave withJ � 9/2 of both parities. In the region from threshold up toW ∼ 1.85 GeV, the JP = 3/2− wave was found to provide abetter description of our data than any other wave. Similarly,in the energy range 1.85 GeV < W < 2 GeV, the JP = 5/2+wave was found to provide the best description.
Scans were also performed using two s-channel waves andthe OTL t-channel terms. The quantity � lnL can also beused in these fits to determine which wave sets best describeour data. In the W < 2 GeV region, the best fit was obtainedusing the s-channel waves with JP = 3/2−, 5/2+. This waveset had the best likelihood in every bin in this energy range(typically by a large amount). Given the results of the singlewave s-channel scans discussed above, this is not a surprisingresult. Above 2 GeV, the preferred wave set consisted of theJP = 5/2+, 7/2− waves, along with the t-channel terms. Asin the lower energy range, this wave set had the best likelihoodin every energy bin for W > 2 GeV.
The results presented for the waves below were not affectedby our choice of wave set; however, as the number of waveswas increased so did the noise. For this reason, we have chosento present the results from fits with at most three s-channelwaves. See Sec. V for more discussion on fits with a largernumber of waves.
065209-6
PARTIAL WAVE ANALYSIS OF THE REACTION . . . PHYSICAL REVIEW C 80, 065209 (2009)
B. Fit I: The near-threshold region
Our preliminary s-channel scans showed that the best fitusing two s-channel waves, along with the OTL t-channelterms, in the energy range 1.72 GeV < W < 2 GeV isobtained using JP = 3/2−, 5/2+. To extract any possibleresonance contributions in these waves, event-based PWE fitswere run using the locked OTL t-channel terms along withJP = 3/2−, 5/2+ s-channel waves parametrized according toEq. (21). In each energy bin, multiple fit iterations were runusing random starting values for the parameters; the results pre-sented below are always from the fit with the best likelihood.
1. Cross sections and phase motion
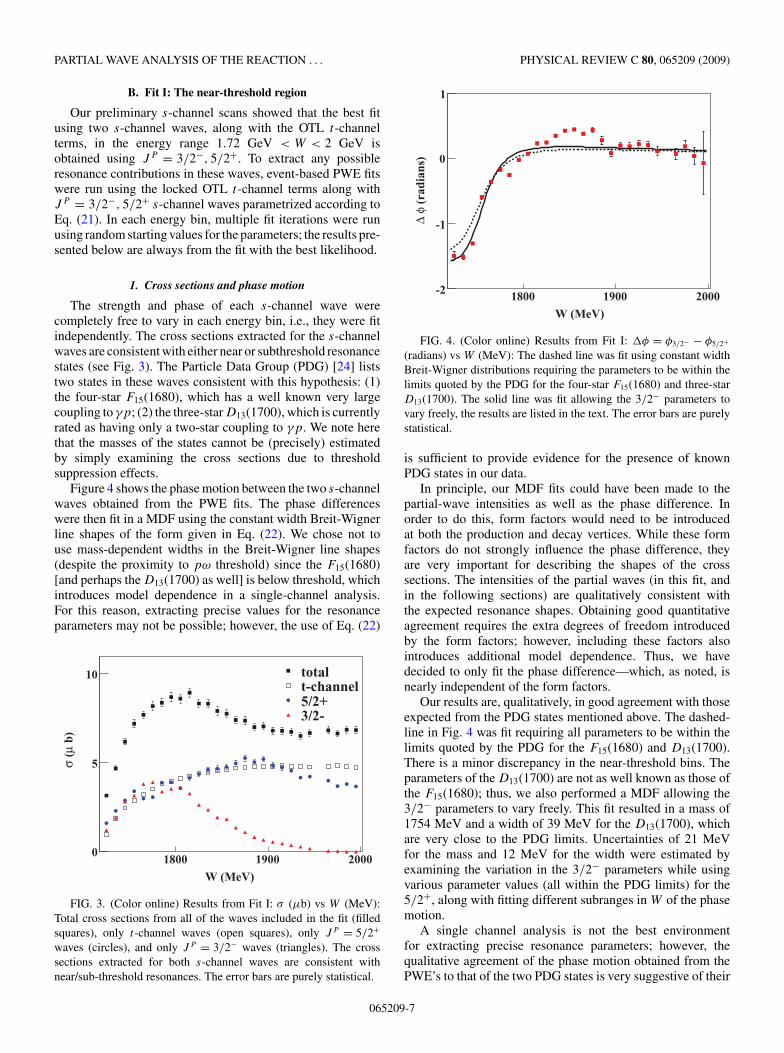
The strength and phase of each s-channel wave werecompletely free to vary in each energy bin, i.e., they were fitindependently. The cross sections extracted for the s-channelwaves are consistent with either near or subthreshold resonancestates (see Fig. 3). The Particle Data Group (PDG) [24] liststwo states in these waves consistent with this hypothesis: (1)the four-star F15(1680), which has a well known very largecoupling to γp; (2) the three-star D13(1700), which is currentlyrated as having only a two-star coupling to γp. We note herethat the masses of the states cannot be (precisely) estimatedby simply examining the cross sections due to thresholdsuppression effects.
Figure 4 shows the phase motion between the two s-channelwaves obtained from the PWE fits. The phase differenceswere then fit in a MDF using the constant width Breit-Wignerline shapes of the form given in Eq. (22). We chose not touse mass-dependent widths in the Breit-Wigner line shapes(despite the proximity to pω threshold) since the F15(1680)[and perhaps the D13(1700) as well] is below threshold, whichintroduces model dependence in a single-channel analysis.For this reason, extracting precise values for the resonanceparameters may not be possible; however, the use of Eq. (22)
W (MeV)
1800 1900 2000
b)
µ (σ
0
5
10 totalt-channel5/2+3/2-
FIG. 3. (Color online) Results from Fit I: σ (µb) vs W (MeV):Total cross sections from all of the waves included in the fit (filledsquares), only t-channel waves (open squares), only JP = 5/2+
waves (circles), and only J P = 3/2− waves (triangles). The crosssections extracted for both s-channel waves are consistent withnear/sub-threshold resonances. The error bars are purely statistical.
W (MeV)
1800 1900 2000
(ra
dian
s)φ ∆
-2
-1
0
1
FIG. 4. (Color online) Results from Fit I: �φ = φ3/2− − φ5/2+
(radians) vs W (MeV): The dashed line was fit using constant widthBreit-Wigner distributions requiring the parameters to be within thelimits quoted by the PDG for the four-star F15(1680) and three-starD13(1700). The solid line was fit allowing the 3/2− parameters tovary freely, the results are listed in the text. The error bars are purelystatistical.
is sufficient to provide evidence for the presence of knownPDG states in our data.
In principle, our MDF fits could have been made to thepartial-wave intensities as well as the phase difference. Inorder to do this, form factors would need to be introducedat both the production and decay vertices. While these formfactors do not strongly influence the phase difference, theyare very important for describing the shapes of the crosssections. The intensities of the partial waves (in this fit, andin the following sections) are qualitatively consistent withthe expected resonance shapes. Obtaining good quantitativeagreement requires the extra degrees of freedom introducedby the form factors; however, including these factors alsointroduces additional model dependence. Thus, we havedecided to only fit the phase difference—which, as noted, isnearly independent of the form factors.
Our results are, qualitatively, in good agreement with thoseexpected from the PDG states mentioned above. The dashed-line in Fig. 4 was fit requiring all parameters to be within thelimits quoted by the PDG for the F15(1680) and D13(1700).There is a minor discrepancy in the near-threshold bins. Theparameters of the D13(1700) are not as well known as those ofthe F15(1680); thus, we also performed a MDF allowing the3/2− parameters to vary freely. This fit resulted in a mass of1754 MeV and a width of 39 MeV for the D13(1700), whichare very close to the PDG limits. Uncertainties of 21 MeVfor the mass and 12 MeV for the width were estimated byexamining the variation in the 3/2− parameters while usingvarious parameter values (all within the PDG limits) for the5/2+, along with fitting different subranges in W of the phasemotion.
A single channel analysis is not the best environmentfor extracting precise resonance parameters; however, thequalitative agreement of the phase motion obtained from thePWE’s to that of the two PDG states is very suggestive of their
065209-7
M. WILLIAMS et al. PHYSICAL REVIEW C 80, 065209 (2009)
presence in our data. Recall that the phase parameters wereeach started pseudorandomly in the range [0, 2π ) in each W
bin. Yet the results are in good qualitative agreement withthe phase motion expected using simple constant width Breit-Wigner distributions for the PDG F15(1680) and D13(1700)states.
2. Production helicity amplitudes
We can also compare the production helicity couplingsextracted from our fits to those quoted by the PDG. The ratio ofthe helicity amplitudes is obtained using the production cou-plings, gJP
LSiin Eq. (21), extracted by the fits and the s-channel
production amplitudes. Due to the nature of the covariant for-malism, these amplitudes are energy-dependent; i.e., the ratioof the helicity amplitudes is a function of W . The PDG quotesthese values at the resonance masses. For the D13(1700), thePDG reports the ratio of the helicity amplitudes as [24]
A3/2
A1/2= 0.11 ± 1.34. (23)
Our fits extract this value to be in the range [−0.06, 0.13],depending on the mass of the JP = 3/2− state. This is in avery good agreement with the PDG value.
The ratio of the helicity amplitudes for the F15(1680)extracted by our fits is consistent with the PDG [24] value.However, projecting this ratio from the pω threshold down tothe required mass makes obtaining a precise quantitative valuedifficult.
3. Comparison to observables
Fit I consists of three production mechanisms: (1) OTLt-channel terms (with no free parameters), which are domi-nated by π0 exchange in this energy range; (2) JP = 3/2− s-channel waves, whose extracted parameters are consistentwith the PDG D13(1700) state; (3) JP = 5/2+ s-channelwaves, whose extracted parameters are consistent with thePDG F15(1680) state (at least, near threshold). This is almostcertainly not all of the physics contributing to ω photoproduc-tion in this energy range. Thus, we would not expect Fit I toprovide a perfect description of our data. Before we examinethe quality of Fit I, we note that the OTL t-channel terms doprovide a good description of our forward data in the energyregime of Fit I.
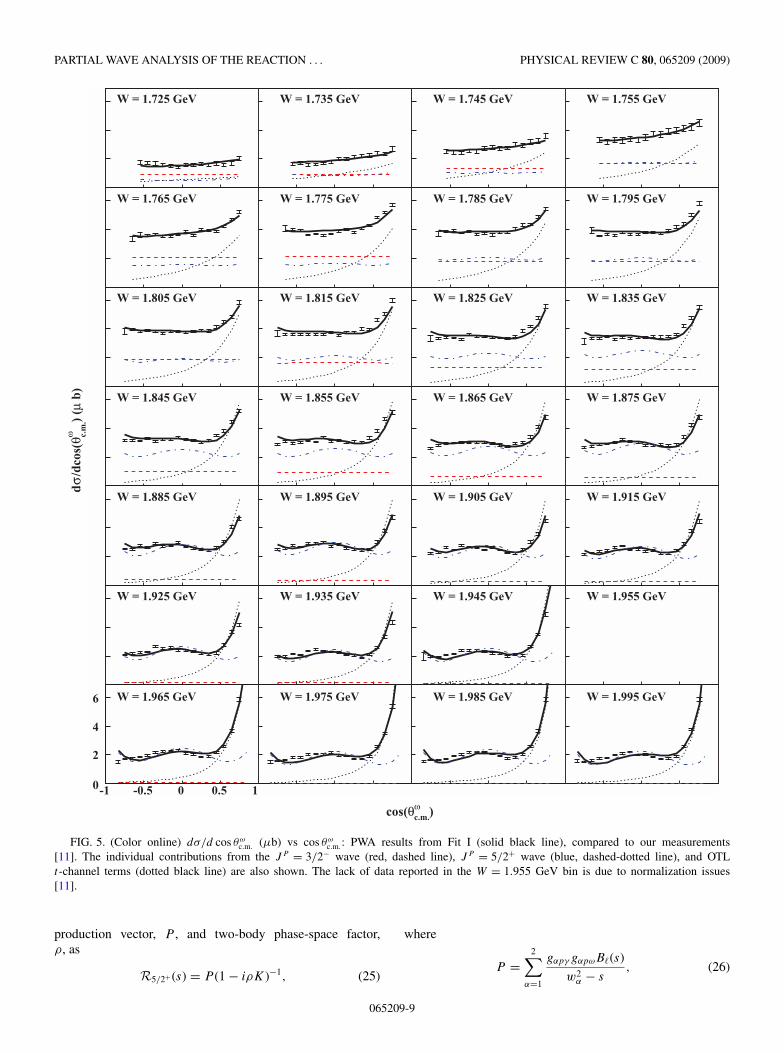
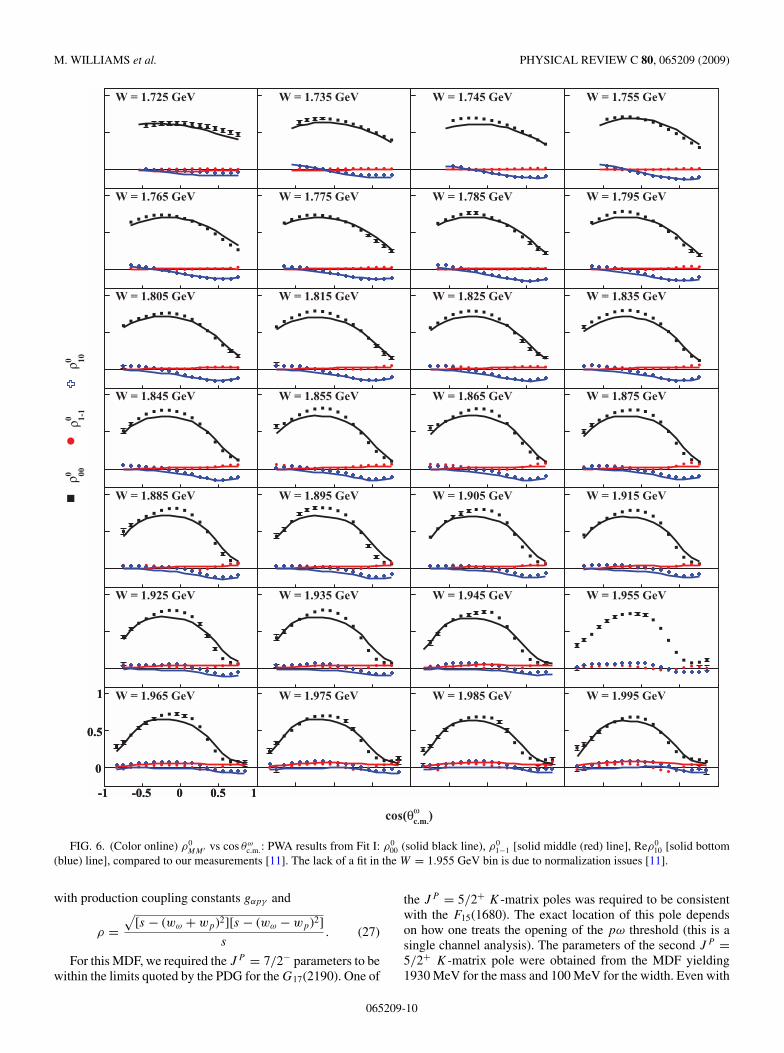
Figures 5 and 6 show comparisons of the differential crosssections and spin-density matrix elements extracted from thePWA fits compared to our measurements [11]. Recall that wedo not fit to the experimental observables directly. We performevent-based fits to the data used to obtain the measured results.The forward cross section and polarization observables arevery well described in this energy range, confirming that π0
exchange in the t channel does dominate the amplitude in thisregion. There is a discrepancy in the description of the crosssection at backward angles that increases with energy. Thiscould be due to the lack of u-channel terms. It could also be asignature of unaccounted-for s-channel amplitudes.
Though we did not start off by including known PDGresonance states, the fit has extracted evidence for them
from our data. We also note here that the large-angle crosssection at W = 1.8 GeV is virtually flat. Without polarizationinformation, the production mechanism could have easilybeen mistaken for a J = 1/2 wave. This demonstrates theimportance of the spin-density matrix elements.
The quality of the description of the observables decreasesslightly with increasing energy. This signifies that there isanother production mechanism that is not accounted for inthe fit. This is expected due to the limited number of wavesincluded in the PWA. Adding additional waves improvesthe description of the data but has virtually no effect onthe strengths and phase motion of the two s-channel wavespresented in this section. Thus, the conclusions drawn aboutresonance contributions are robust, and do not change whenadditions are made to the wave set. See Sec. IV D1 for resultsobtained by adding an additional s-channel wave to this fit.
C. Fit II: The higher mass region
Our preliminary s-channel scans showed that the best fitusing two s-channel waves and the OTL t-channel terms in theenergy range 2 GeV < W < 2.4 GeV is obtained using waveswith JP = 5/2+, 7/2−. To extract any possible resonancecontributions in these waves, the same procedure used forFit I was employed.
1. Cross sections and phase motion
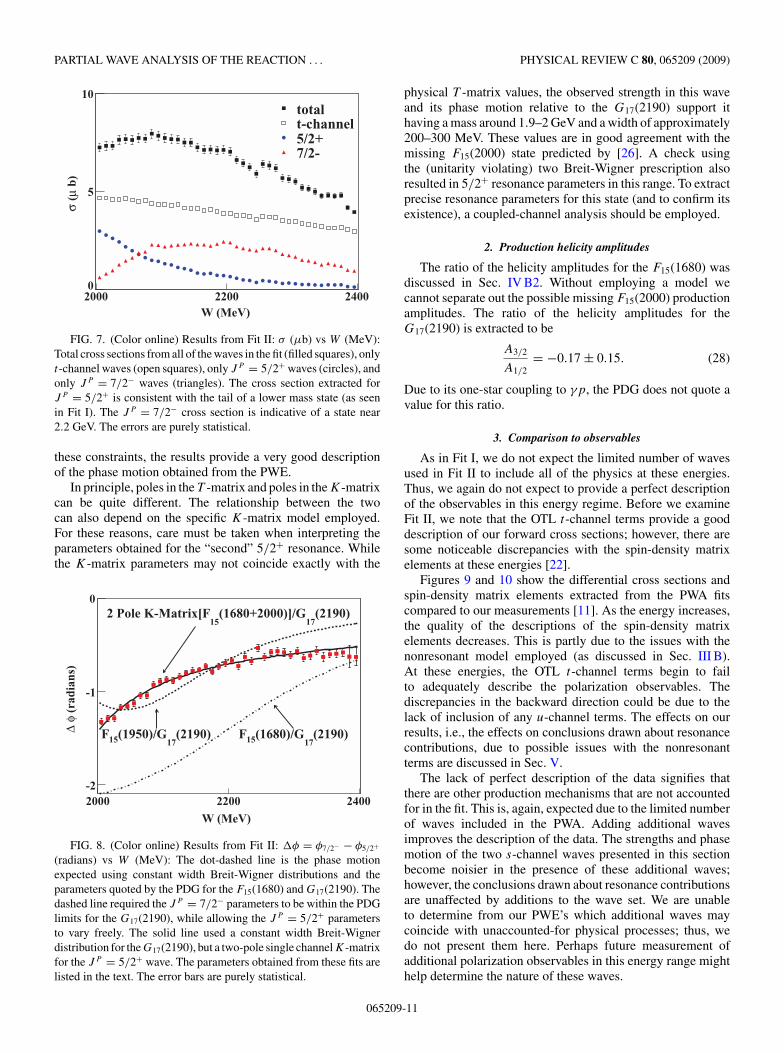
As in Fit I, the strength and phase of each s-channel wavewere completely free to vary in each energy bin in the PWE’s.The cross sections extracted for the s-channel waves, shownin Fig. 7, are consistent with the tail of a JP = 5/2+ state witha mass below 2 GeV (as seen in Fit I) and a JP = 7/2− statewith a mass near 2.2 GeV. The PDG lists a state consistentwith this hypothesis: the four-star G17(2190), which currentlyis only listed as having one-star coupling to γp.
Figure 8 shows the phase motion between the two s-channelwaves extracted from the PWE’s. Our results do not agree withthose expected from the PDG F15(1680) and G17(2190) states,assuming their mass dependencies are well described by theconstant width Breit-Wigner line shape described in Eq. (22).Allowing the JP = 5/2+ parameters to vary freely gives usbetter agreement and yields a mass around 1.95 GeV. Thepresence of a second state in the JP = 5/2+ wave near thismass would have virtually no effect on the results obtained inFit I; however, it would mean that the use of a Breit-Wignerdistribution in the energy range where both 5/2+ states arecontributing significantly, e.g., the energy region examined inFit II, is invalid.
Instead, we can employ a two-pole single channel K-matrixfor the 5/2+ states of the form [25]
K(s) =2∑
α=1
g2αpωB2
(s)
w2α − s
, (24)
where wα and gαpω are the K-matrix resonance massesand coupling constants to the pω final state and B arethe centrifugal barrier factors (see, e.g., [23]). The massdependence of the amplitude is then written in terms of the
065209-8
PARTIAL WAVE ANALYSIS OF THE REACTION . . . PHYSICAL REVIEW C 80, 065209 (2009)
W = 1.725 GeV
W = 1.765 GeV
W = 1.805 GeV
W = 1.845 GeV
W = 1.885 GeV
W = 1.925 GeV
-1 -0.5 0 0.5 10
2
4
6 W = 1.965 GeV
W = 1.735 GeV
W = 1.775 GeV
W = 1.815 GeV
W = 1.855 GeV
W = 1.895 GeV
W = 1.935 GeV
W = 1.975 GeV
W = 1.745 GeV
W = 1.785 GeV
W = 1.825 GeV
W = 1.865 GeV
W = 1.905 GeV
W = 1.945 GeV
W = 1.985 GeV
W = 1.755 GeV
W = 1.795 GeV
W = 1.835 GeV
W = 1.875 GeV
W = 1.915 GeV
W = 1.955 GeV
W = 1.995 GeV
b)
µ)
(ω c.
m.
θ/d
cos(
σd
)ωc.m.θcos(
FIG. 5. (Color online) dσ/d cos θωc.m. (µb) vs cos θω
c.m.: PWA results from Fit I (solid black line), compared to our measurements[11]. The individual contributions from the J P = 3/2− wave (red, dashed line), J P = 5/2+ wave (blue, dashed-dotted line), and OTLt-channel terms (dotted black line) are also shown. The lack of data reported in the W = 1.955 GeV bin is due to normalization issues[11].
production vector, P , and two-body phase-space factor,ρ, as
R5/2+ (s) = P (1 − iρK)−1, (25)
where
P =2∑
α=1
gαpγ gαpωB(s)
w2α − s
, (26)
065209-9
M. WILLIAMS et al. PHYSICAL REVIEW C 80, 065209 (2009)
W = 1.725 GeV
W = 1.765 GeV
W = 1.805 GeV
W = 1.845 GeV
W = 1.885 GeV
W = 1.925 GeV
-1 -0.5 0 0.5 1
0
0.5
1 W = 1.965 GeV
-1 -0.5 0 0.5 1
0
0.5
1
W = 1.735 GeV
W = 1.775 GeV
W = 1.815 GeV
W = 1.855 GeV
W = 1.895 GeV
W = 1.935 GeV
W = 1.975 GeV
W = 1.745 GeV
W = 1.785 GeV
W = 1.825 GeV
W = 1.865 GeV
W = 1.905 GeV
W = 1.945 GeV
W = 1.985 GeV
W = 1.755 GeV
W = 1.795 GeV
W = 1.835 GeV
W = 1.875 GeV
W = 1.915 GeV
W = 1.955 GeV
W = 1.995 GeV
000 ρ1-
1
0 ρ100 ρ
)ωc.m.θcos(
FIG. 6. (Color online) ρ0MM ′ vs cos θω
c.m.: PWA results from Fit I: ρ000 (solid black line), ρ0
1−1 [solid middle (red) line], Reρ010 [solid bottom
(blue) line], compared to our measurements [11]. The lack of a fit in the W = 1.955 GeV bin is due to normalization issues [11].
with production coupling constants gαpγ and
ρ =√
[s − (wω + wp)2][s − (wω − wp)2]
s. (27)
For this MDF, we required the JP = 7/2− parameters to bewithin the limits quoted by the PDG for the G17(2190). One of
the JP = 5/2+ K-matrix poles was required to be consistentwith the F15(1680). The exact location of this pole dependson how one treats the opening of the pω threshold (this is asingle channel analysis). The parameters of the second JP =5/2+ K-matrix pole were obtained from the MDF yielding1930 MeV for the mass and 100 MeV for the width. Even with
065209-10
PARTIAL WAVE ANALYSIS OF THE REACTION . . . PHYSICAL REVIEW C 80, 065209 (2009)
W (MeV)2000 2200 2400
b)
µ (σ
0
5
10totalt-channel5/2+7/2-
FIG. 7. (Color online) Results from Fit II: σ (µb) vs W (MeV):Total cross sections from all of the waves in the fit (filled squares), onlyt-channel waves (open squares), only J P = 5/2+ waves (circles), andonly J P = 7/2− waves (triangles). The cross section extracted forJ P = 5/2+ is consistent with the tail of a lower mass state (as seenin Fit I). The J P = 7/2− cross section is indicative of a state near2.2 GeV. The errors are purely statistical.
these constraints, the results provide a very good descriptionof the phase motion obtained from the PWE.
In principle, poles in the T -matrix and poles in the K-matrixcan be quite different. The relationship between the twocan also depend on the specific K-matrix model employed.For these reasons, care must be taken when interpreting theparameters obtained for the “second” 5/2+ resonance. Whilethe K-matrix parameters may not coincide exactly with the
W (MeV)
2000 2200 2400
(ra
dian
s)φ ∆
-2
-1
0
(2190)17
(1680)/G15F(2190)17
(1950)/G15F
(2190)17
(1680+2000)]/G15
2 Pole K-Matrix[F
FIG. 8. (Color online) Results from Fit II: �φ = φ7/2− − φ5/2+
(radians) vs W (MeV): The dot-dashed line is the phase motionexpected using constant width Breit-Wigner distributions and theparameters quoted by the PDG for the F15(1680) and G17(2190). Thedashed line required the J P = 7/2− parameters to be within the PDGlimits for the G17(2190), while allowing the J P = 5/2+ parametersto vary freely. The solid line used a constant width Breit-Wignerdistribution for the G17(2190), but a two-pole single channel K-matrixfor the J P = 5/2+ wave. The parameters obtained from these fits arelisted in the text. The error bars are purely statistical.
physical T -matrix values, the observed strength in this waveand its phase motion relative to the G17(2190) support ithaving a mass around 1.9–2 GeV and a width of approximately200–300 MeV. These values are in good agreement with themissing F15(2000) state predicted by [26]. A check usingthe (unitarity violating) two Breit-Wigner prescription alsoresulted in 5/2+ resonance parameters in this range. To extractprecise resonance parameters for this state (and to confirm itsexistence), a coupled-channel analysis should be employed.
2. Production helicity amplitudes
The ratio of the helicity amplitudes for the F15(1680) wasdiscussed in Sec. IV B2. Without employing a model wecannot separate out the possible missing F15(2000) productionamplitudes. The ratio of the helicity amplitudes for theG17(2190) is extracted to be
A3/2
A1/2= −0.17 ± 0.15. (28)
Due to its one-star coupling to γp, the PDG does not quote avalue for this ratio.
3. Comparison to observables
As in Fit I, we do not expect the limited number of wavesused in Fit II to include all of the physics at these energies.Thus, we again do not expect to provide a perfect descriptionof the observables in this energy regime. Before we examineFit II, we note that the OTL t-channel terms provide a gooddescription of our forward cross sections; however, there aresome noticeable discrepancies with the spin-density matrixelements at these energies [22].
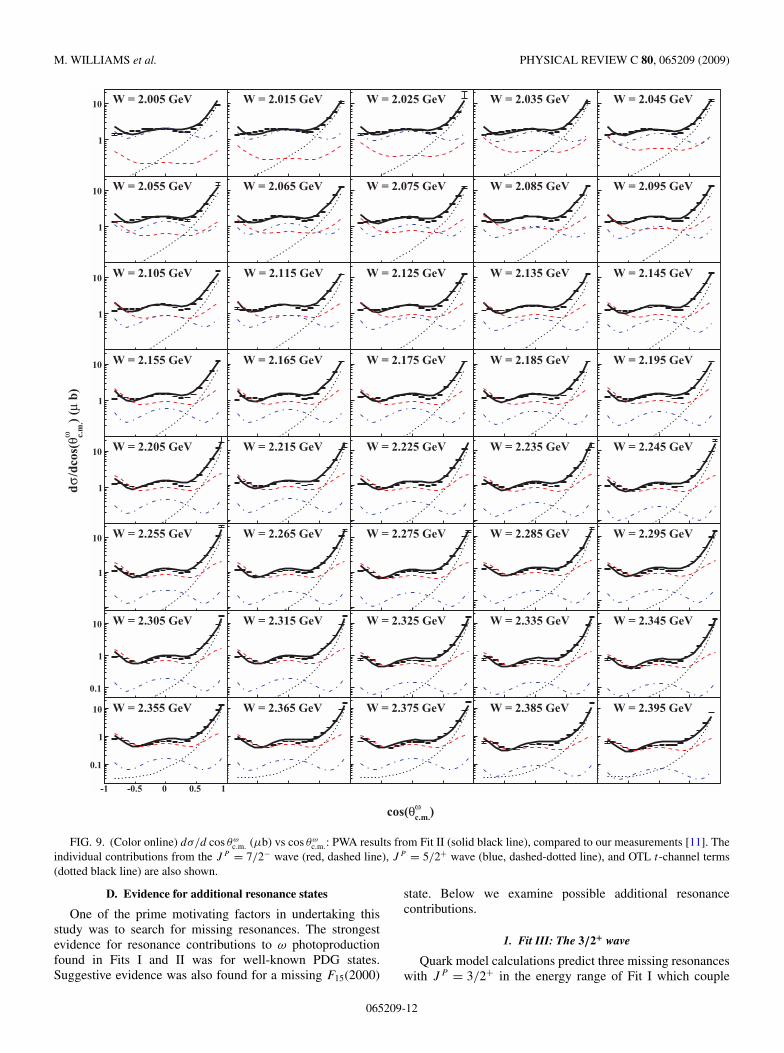
Figures 9 and 10 show the differential cross sections andspin-density matrix elements extracted from the PWA fitscompared to our measurements [11]. As the energy increases,the quality of the descriptions of the spin-density matrixelements decreases. This is partly due to the issues with thenonresonant model employed (as discussed in Sec. III B).At these energies, the OTL t-channel terms begin to failto adequately describe the polarization observables. Thediscrepancies in the backward direction could be due to thelack of inclusion of any u-channel terms. The effects on ourresults, i.e., the effects on conclusions drawn about resonancecontributions, due to possible issues with the nonresonantterms are discussed in Sec. V.
The lack of perfect description of the data signifies thatthere are other production mechanisms that are not accountedfor in the fit. This is, again, expected due to the limited numberof waves included in the PWA. Adding additional wavesimproves the description of the data. The strengths and phasemotion of the two s-channel waves presented in this sectionbecome noisier in the presence of these additional waves;however, the conclusions drawn about resonance contributionsare unaffected by additions to the wave set. We are unableto determine from our PWE’s which additional waves maycoincide with unaccounted-for physical processes; thus, wedo not present them here. Perhaps future measurement ofadditional polarization observables in this energy range mighthelp determine the nature of these waves.
065209-11
M. WILLIAMS et al. PHYSICAL REVIEW C 80, 065209 (2009)
1
10 W = 2.005 GeV
1
10 W = 2.055 GeV
1
10 W = 2.105 GeV
1
10 W = 2.155 GeV
1
10 W = 2.205 GeV
1
10 W = 2.255 GeV
0.1
1
10 W = 2.305 GeV
-1 -0.5 0 0.5 1
0.1
1
10 W = 2.355 GeV
W = 2.015 GeV
W = 2.065 GeV
W = 2.115 GeV
W = 2.165 GeV
W = 2.215 GeV
W = 2.265 GeV
W = 2.315 GeV
W = 2.365 GeV
W = 2.025 GeV
W = 2.075 GeV
W = 2.125 GeV
W = 2.175 GeV
W = 2.225 GeV
W = 2.275 GeV
W = 2.325 GeV
W = 2.375 GeV
W = 2.035 GeV
W = 2.085 GeV
W = 2.135 GeV
W = 2.185 GeV
W = 2.235 GeV
W = 2.285 GeV
W = 2.335 GeV
W = 2.385 GeV
W = 2.045 GeV
W = 2.095 GeV
W = 2.145 GeV
W = 2.195 GeV
W = 2.245 GeV
W = 2.295 GeV
W = 2.345 GeV
W = 2.395 GeV
b)
µ)
(ω c.
m.
θ/d
cos(
σd
)ωc.m.θcos(
FIG. 9. (Color online) dσ/d cos θωc.m. (µb) vs cos θω
c.m.: PWA results from Fit II (solid black line), compared to our measurements [11]. Theindividual contributions from the J P = 7/2− wave (red, dashed line), J P = 5/2+ wave (blue, dashed-dotted line), and OTL t-channel terms(dotted black line) are also shown.
D. Evidence for additional resonance states
One of the prime motivating factors in undertaking thisstudy was to search for missing resonances. The strongestevidence for resonance contributions to ω photoproductionfound in Fits I and II was for well-known PDG states.Suggestive evidence was also found for a missing F15(2000)
state. Below we examine possible additional resonancecontributions.
1. Fit III: The 3/2+ wave
Quark model calculations predict three missing resonanceswith JP = 3/2+ in the energy range of Fit I which couple
065209-12
PARTIAL WAVE ANALYSIS OF THE REACTION . . . PHYSICAL REVIEW C 80, 065209 (2009)
W = 2.005 GeV
W = 2.055 GeV
W = 2.105 GeV
W = 2.155 GeV
W = 2.205 GeV
W = 2.255 GeV
W = 2.305 GeV
-1 -0.5 0 0.5 1
0
0.5
W = 2.355 GeV
-1 -0.5 0 0.5 1
0
0.5
W = 2.015 GeV
W = 2.065 GeV
W = 2.115 GeV
W = 2.165 GeV
W = 2.215 GeV
W = 2.265 GeV
W = 2.315 GeV
W = 2.365 GeV
W = 2.025 GeV
W = 2.075 GeV
W = 2.125 GeV
W = 2.175 GeV
W = 2.225 GeV
W = 2.275 GeV
W = 2.325 GeV
W = 2.375 GeV
W = 2.035 GeV
W = 2.085 GeV
W = 2.135 GeV
W = 2.185 GeV
W = 2.235 GeV
W = 2.285 GeV
W = 2.335 GeV
W = 2.385 GeV
W = 2.045 GeV
W = 2.095 GeV
W = 2.145 GeV
W = 2.195 GeV
W = 2.245 GeV
W = 2.295 GeV
W = 2.345 GeV
W = 2.395 GeV
000 ρ1-
1
0 ρ100 ρ
)ωc.m.θcos(
FIG. 10. (Color online) ρ0MM ′ vs cos θω
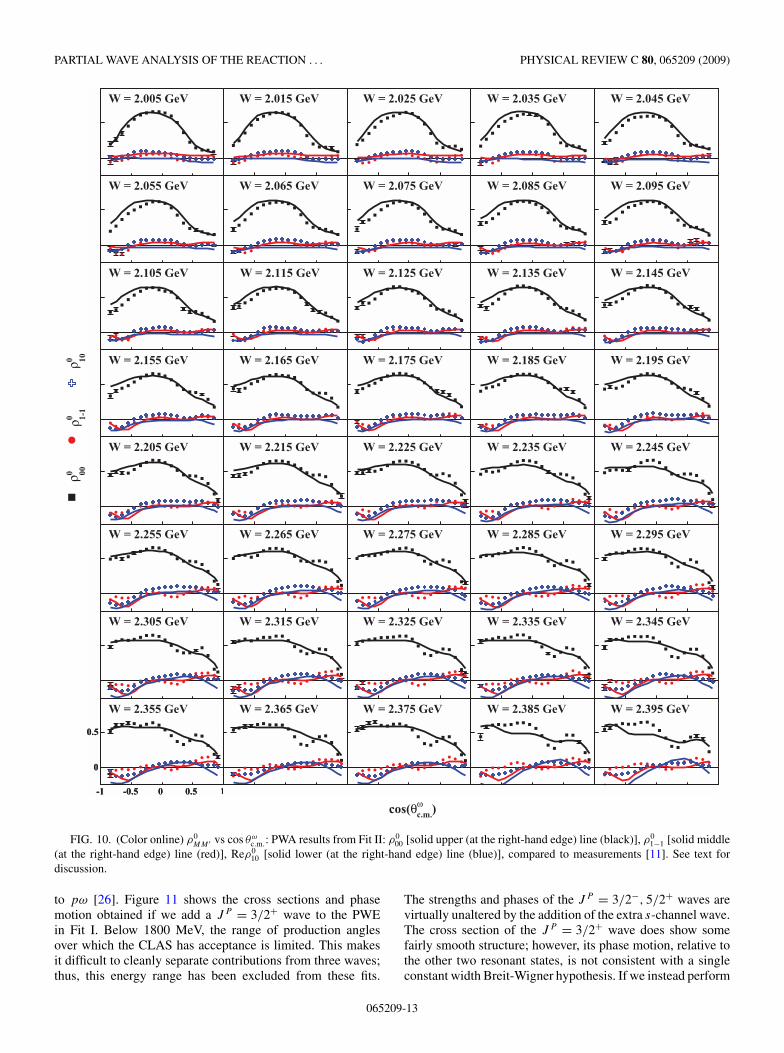
c.m.: PWA results from Fit II: ρ000 [solid upper (at the right-hand edge) line (black)], ρ0
1−1 [solid middle(at the right-hand edge) line (red)], Reρ0
10 [solid lower (at the right-hand edge) line (blue)], compared to measurements [11]. See text fordiscussion.
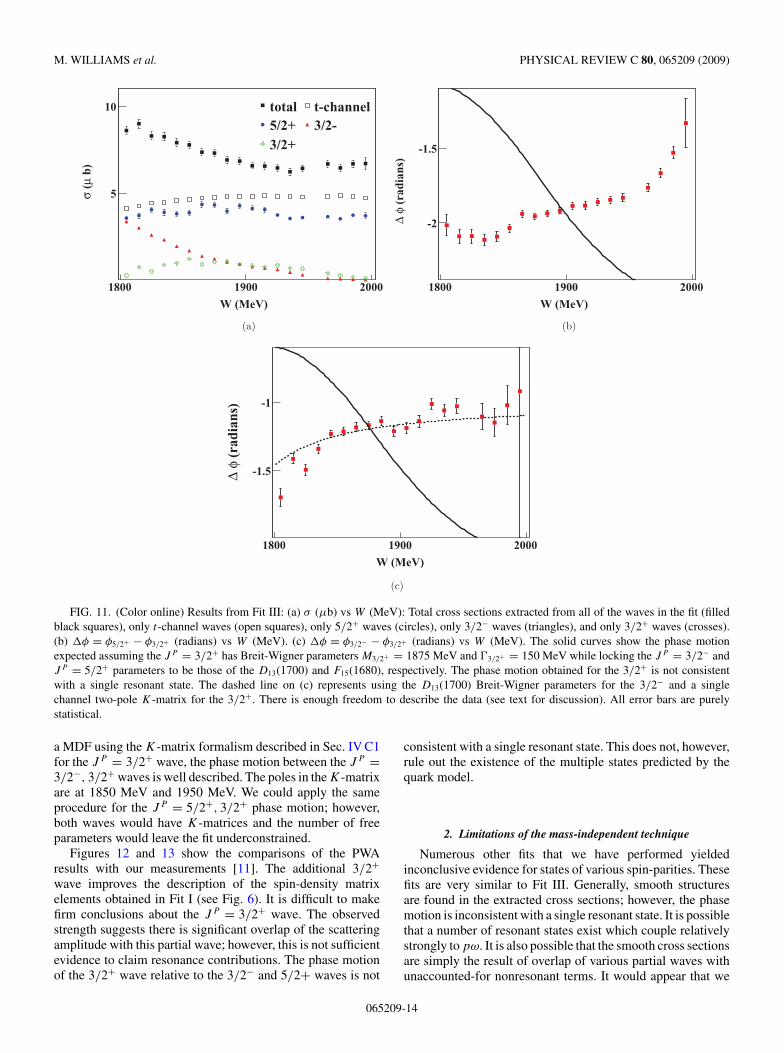
to pω [26]. Figure 11 shows the cross sections and phasemotion obtained if we add a JP = 3/2+ wave to the PWEin Fit I. Below 1800 MeV, the range of production anglesover which the CLAS has acceptance is limited. This makesit difficult to cleanly separate contributions from three waves;thus, this energy range has been excluded from these fits.
The strengths and phases of the JP = 3/2−, 5/2+ waves arevirtually unaltered by the addition of the extra s-channel wave.The cross section of the JP = 3/2+ wave does show somefairly smooth structure; however, its phase motion, relative tothe other two resonant states, is not consistent with a singleconstant width Breit-Wigner hypothesis. If we instead perform
065209-13
M. WILLIAMS et al. PHYSICAL REVIEW C 80, 065209 (2009)
W (MeV)
1800 1900 2000
b)
µ (σ 5
10 total t-channel5/2+ 3/2-3/2+
(a)
W (MeV)
1800 1900 2000
(ra
dian
s)φ
∆ -2
-1.5
(b)
W (MeV)
1800 1900 2000
(ra
dian
s)φ
∆ -1.5
-1
(c)
FIG. 11. (Color online) Results from Fit III: (a) σ (µb) vs W (MeV): Total cross sections extracted from all of the waves in the fit (filledblack squares), only t-channel waves (open squares), only 5/2+ waves (circles), only 3/2− waves (triangles), and only 3/2+ waves (crosses).(b) �φ = φ5/2+ − φ3/2+ (radians) vs W (MeV). (c) �φ = φ3/2− − φ3/2+ (radians) vs W (MeV). The solid curves show the phase motionexpected assuming the J P = 3/2+ has Breit-Wigner parameters M3/2+ = 1875 MeV and �3/2+ = 150 MeV while locking the J P = 3/2− andJ P = 5/2+ parameters to be those of the D13(1700) and F15(1680), respectively. The phase motion obtained for the 3/2+ is not consistentwith a single resonant state. The dashed line on (c) represents using the D13(1700) Breit-Wigner parameters for the 3/2− and a singlechannel two-pole K-matrix for the 3/2+. There is enough freedom to describe the data (see text for discussion). All error bars are purelystatistical.
a MDF using the K-matrix formalism described in Sec. IV C1for the JP = 3/2+ wave, the phase motion between the JP =3/2−, 3/2+ waves is well described. The poles in the K-matrixare at 1850 MeV and 1950 MeV. We could apply the sameprocedure for the JP = 5/2+, 3/2+ phase motion; however,both waves would have K-matrices and the number of freeparameters would leave the fit underconstrained.
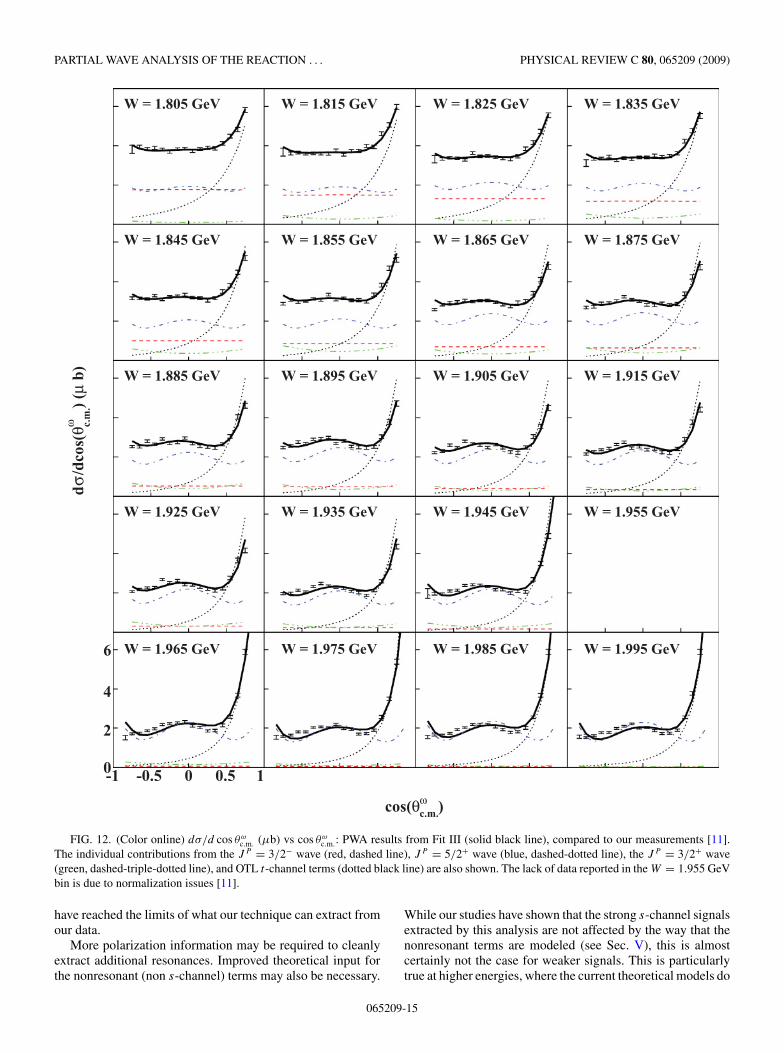
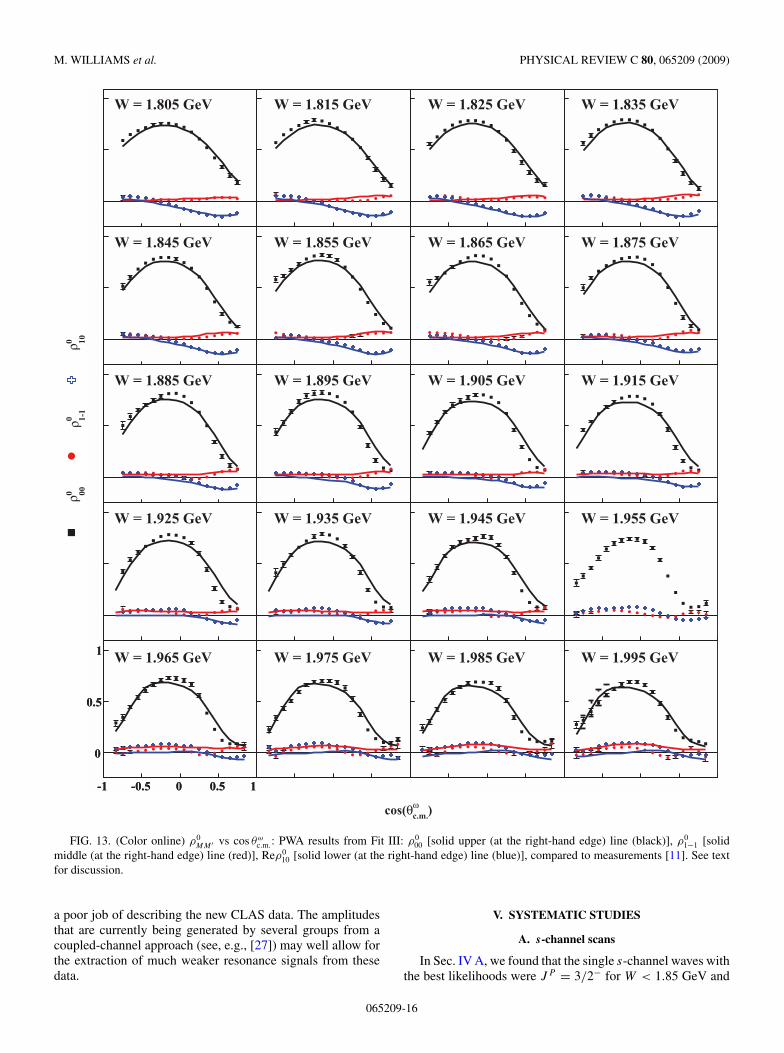
Figures 12 and 13 show the comparisons of the PWAresults with our measurements [11]. The additional 3/2+wave improves the description of the spin-density matrixelements obtained in Fit I (see Fig. 6). It is difficult to makefirm conclusions about the JP = 3/2+ wave. The observedstrength suggests there is significant overlap of the scatteringamplitude with this partial wave; however, this is not sufficientevidence to claim resonance contributions. The phase motionof the 3/2+ wave relative to the 3/2− and 5/2+ waves is not
consistent with a single resonant state. This does not, however,rule out the existence of the multiple states predicted by thequark model.
2. Limitations of the mass-independent technique
Numerous other fits that we have performed yieldedinconclusive evidence for states of various spin-parities. Thesefits are very similar to Fit III. Generally, smooth structuresare found in the extracted cross sections; however, the phasemotion is inconsistent with a single resonant state. It is possiblethat a number of resonant states exist which couple relativelystrongly to pω. It is also possible that the smooth cross sectionsare simply the result of overlap of various partial waves withunaccounted-for nonresonant terms. It would appear that we
065209-14
PARTIAL WAVE ANALYSIS OF THE REACTION . . . PHYSICAL REVIEW C 80, 065209 (2009)
W = 1.805 GeV
W = 1.845 GeV
W = 1.885 GeV
W = 1.925 GeV
-1 -0.5 0 0.5 10
2
4
6 W = 1.965 GeV
W = 1.815 GeV
W = 1.855 GeV
W = 1.895 GeV
W = 1.935 GeV
W = 1.975 GeV
W = 1.825 GeV
W = 1.865 GeV
W = 1.905 GeV
W = 1.945 GeV
W = 1.985 GeV
W = 1.835 GeV
W = 1.875 GeV
W = 1.915 GeV
W = 1.955 GeV
W = 1.995 GeV
b)
µ)
(ω c.
m.
θ/d
cos(
σd
)ωc.m.θcos(
FIG. 12. (Color online) dσ/d cos θωc.m. (µb) vs cos θω
c.m.: PWA results from Fit III (solid black line), compared to our measurements [11].The individual contributions from the J P = 3/2− wave (red, dashed line), J P = 5/2+ wave (blue, dashed-dotted line), the J P = 3/2+ wave(green, dashed-triple-dotted line), and OTL t-channel terms (dotted black line) are also shown. The lack of data reported in the W = 1.955 GeVbin is due to normalization issues [11].
have reached the limits of what our technique can extract fromour data.
More polarization information may be required to cleanlyextract additional resonances. Improved theoretical input forthe nonresonant (non s-channel) terms may also be necessary.
While our studies have shown that the strong s-channel signalsextracted by this analysis are not affected by the way that thenonresonant terms are modeled (see Sec. V), this is almostcertainly not the case for weaker signals. This is particularlytrue at higher energies, where the current theoretical models do
065209-15
M. WILLIAMS et al. PHYSICAL REVIEW C 80, 065209 (2009)
W = 1.805 GeV
W = 1.845 GeV
W = 1.885 GeV
W = 1.925 GeV
-1 -0.5 0 0.5 1
0
0.5
1 W = 1.965 GeV
-1 -0.5 0 0.5 1
0
0.5
1
W = 1.815 GeV
W = 1.855 GeV
W = 1.895 GeV
W = 1.935 GeV
W = 1.975 GeV
W = 1.825 GeV
W = 1.865 GeV
W = 1.905 GeV
W = 1.945 GeV
W = 1.985 GeV
W = 1.835 GeV
W = 1.875 GeV
W = 1.915 GeV
W = 1.955 GeV
W = 1.995 GeV
000 ρ1-
1
0 ρ100 ρ
)ωc.m.θcos(
FIG. 13. (Color online) ρ0MM ′ vs cos θω
c.m.: PWA results from Fit III: ρ000 [solid upper (at the right-hand edge) line (black)], ρ0
1−1 [solidmiddle (at the right-hand edge) line (red)], Reρ0
10 [solid lower (at the right-hand edge) line (blue)], compared to measurements [11]. See textfor discussion.
a poor job of describing the new CLAS data. The amplitudesthat are currently being generated by several groups from acoupled-channel approach (see, e.g., [27]) may well allow forthe extraction of much weaker resonance signals from thesedata.
V. SYSTEMATIC STUDIES
A. s-channel scans
In Sec. IV A, we found that the single s-channel waves withthe best likelihoods were JP = 3/2− for W < 1.85 GeV and
065209-16
PARTIAL WAVE ANALYSIS OF THE REACTION . . . PHYSICAL REVIEW C 80, 065209 (2009)
JP = 5/2+ for 1.85 GeV < W < 2 GeV. We proceeded to addsingle s-channel waves to these fits to determine which had thebest likelihoods; these were the basis for the wave sets used inFits I and II. We can also examine the “discarded” wave setsand examine the s-channel contributions as a systematic checkon our results.
In the W < 2 GeV energy range, the s-channel waves withJP = 3/2−, 5/2+, used in Fit I, had the best likelihood of alltwo s-channel wave combinations (when combined with theOTL t-channel waves). In this fit, the contributions extractedfor the two s-channel waves were approximately equal in sizefor W < 1.85 GeV. For all other [3/2−, J P ] combinations,the extracted contribution for the JP = 3/2− wave was thebigger of the two s-channel terms in this energy range. Inthe 1.85 GeV < W < 2 GeV energy range, the 5/2+ wave hadthe larger of the two s-channel contributions for every JP usedfor the other s-channel wave. Fits were also run using all twos-channel wave combinations (with the OTL t-channel terms)over the entire energy range. The contributions of the wavespresented in this paper were consistent, regardless of whichother waves they were fit with.
The robustness of the results presented in this paper wasalso tested by performing the PWE’s with larger wave sets.The presence of any additional J � 5/2 wave does noteffect the conclusions drawn about resonance contributions toFit I or Fit II. Fits run with very large wave sets that includedall s-channel waves with J � 9/2 also confirm the largecontributions from the JP = 3/2− and 5/2+ below 2 GeVand from J � 7/2 waves around 2.2 GeV; however, with thismany waves it was not possible to unambiguously determinethe spin-parity of the large J contribution.
B. Including u-channel terms
Another possible cause of systematic effects is our lackof inclusion of any u-channel terms. For W < 2 GeV, anyu-channel contribution must be small due to the lack ofany visible peak in the backward cross section. Thus, theconclusions drawn from Fit I are independent of whether ornot u-channel terms are included. The same cannot be said forthe energy regime of Fit II. In [22], we were able to modify theu-channel parameters of the Oh, Titov, and Lee model to betterdescribe our highest energy data; however, these amplitudeswere not included in our PWA fits due to a lack of confidencein the assumptions used to obtain the parameters.
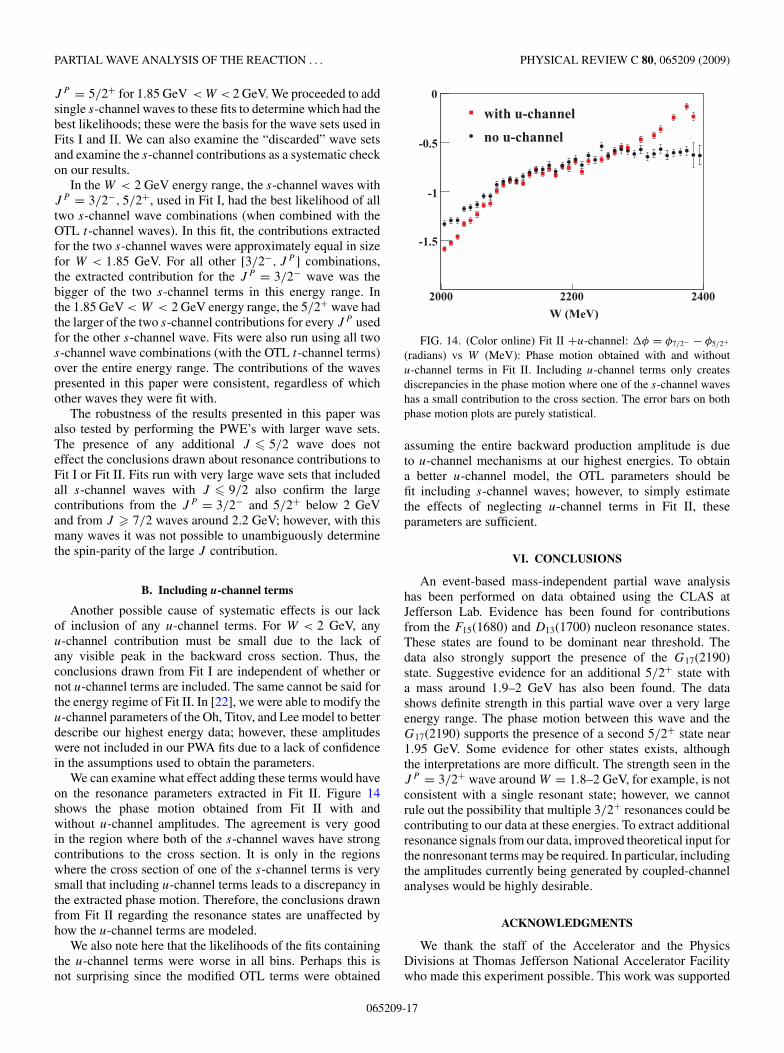
We can examine what effect adding these terms would haveon the resonance parameters extracted in Fit II. Figure 14shows the phase motion obtained from Fit II with andwithout u-channel amplitudes. The agreement is very goodin the region where both of the s-channel waves have strongcontributions to the cross section. It is only in the regionswhere the cross section of one of the s-channel terms is verysmall that including u-channel terms leads to a discrepancy inthe extracted phase motion. Therefore, the conclusions drawnfrom Fit II regarding the resonance states are unaffected byhow the u-channel terms are modeled.
We also note here that the likelihoods of the fits containingthe u-channel terms were worse in all bins. Perhaps this isnot surprising since the modified OTL terms were obtained
W (MeV)
2000 2200 2400
-1.5
-1
-0.5
0
with u-channel
no u-channel
FIG. 14. (Color online) Fit II +u-channel: �φ = φ7/2− − φ5/2+
(radians) vs W (MeV): Phase motion obtained with and withoutu-channel terms in Fit II. Including u-channel terms only createsdiscrepancies in the phase motion where one of the s-channel waveshas a small contribution to the cross section. The error bars on bothphase motion plots are purely statistical.
assuming the entire backward production amplitude is dueto u-channel mechanisms at our highest energies. To obtaina better u-channel model, the OTL parameters should befit including s-channel waves; however, to simply estimatethe effects of neglecting u-channel terms in Fit II, theseparameters are sufficient.
VI. CONCLUSIONS
An event-based mass-independent partial wave analysishas been performed on data obtained using the CLAS atJefferson Lab. Evidence has been found for contributionsfrom the F15(1680) and D13(1700) nucleon resonance states.These states are found to be dominant near threshold. Thedata also strongly support the presence of the G17(2190)state. Suggestive evidence for an additional 5/2+ state witha mass around 1.9–2 GeV has also been found. The datashows definite strength in this partial wave over a very largeenergy range. The phase motion between this wave and theG17(2190) supports the presence of a second 5/2+ state near1.95 GeV. Some evidence for other states exists, althoughthe interpretations are more difficult. The strength seen in theJP = 3/2+ wave around W = 1.8–2 GeV, for example, is notconsistent with a single resonant state; however, we cannotrule out the possibility that multiple 3/2+ resonances could becontributing to our data at these energies. To extract additionalresonance signals from our data, improved theoretical input forthe nonresonant terms may be required. In particular, includingthe amplitudes currently being generated by coupled-channelanalyses would be highly desirable.
ACKNOWLEDGMENTS
We thank the staff of the Accelerator and the PhysicsDivisions at Thomas Jefferson National Accelerator Facilitywho made this experiment possible. This work was supported
065209-17
M. WILLIAMS et al. PHYSICAL REVIEW C 80, 065209 (2009)
in part by the US Department of Energy (under Grant No.DE-FG02-87ER40315), the National Science Foundation, theItalian Istituto Nazionale di Fisica Nucleare, the FrenchCentre National de la Recherche Scientifique, the FrenchCommissariat a l’Energie Atomique, the Science and Tech-
nology Facilities Council (STFC), and the Korean Scienceand Engineering Foundation. The Southeastern UniversitiesResearch Association (SURA) operated Jefferson Lab underUS DOE Contract No. DE-AC05-84ER40150 during thiswork.
[1] J. Ballam et al., Phys. Rev. D 7, 3150 (1973).[2] R. W. Clift et al., Phys. Lett. B72, 144 (1977).[3] D. P. Barber et al. (LAMP2 Group Collaboration), Z. Phys. C
26, 343 (1984).[4] M. Battaglieri et al. (CLAS Collaboration), Phys. Rev. Lett. 90,
022002 (2003).[5] J. Barth et al. (SAPHIR Collaboration), Eur. Phys. J. A 18, 117
(2003).[6] Y. Oh, A. I. Titov, and T. S. H. Lee, Phys. Rev. C 63, 025201
(2001).[7] A. I. Titov and T. S. H. Lee, Phys. Rev. C 66, 015204
(2002).[8] Q. Zhao, Phys. Rev. C 63, 025203 (2001).[9] G. Penner and U. Mosel, Phys. Rev. C 66, 055212 (2002).
[10] V. Shklyar, H. Lenske, U. Mosel, and G. Penner, Phys. Rev. C71, 055206 (2005).
[11] M. Williams et al. (CLAS Collaboration), Phys. Rev. C 80,065208 (2009).
[12] K. Schilling, P. Seyboth, and G. Wolf, Nucl. Phys. B15, 397(1970).
[13] D. I. Sober et al., Nucl. Instrum. Methods Phys. Res. A 440, 263(2000).
[14] M. Williams, Ph.D. thesis, Carnegie Mellon University, 2007,www.jlab.org/Hall-B/general/clas thesis.html.
[15] B. A. Mecking et al., Nucl. Instrum. Methods Phys. Res. A 503,513 (2003).
[16] S. U. Chung, BNL preprint BNL-QGS-93-05 (1999).[17] M. Williams, M. Bellis, and C. A. Meyer, JINST 4, P10003
(2009).[18] M. Williams, Comput. Phys. Commun. 180, 1847 (2009).[19] D. Binosi and L. Theussl, Comput. Phys. Commun. 161, 76
(2004).[20] C. Zemach, Phys. Rev. 140, B109 (1965).[21] A. Donnachie and P. V. Landshoff, Phys. Lett. B296, 227 (1992).[22] M. Williams et al., “The impact on the phenomenology of γp →
pω of the first high-precision measurements of ω polarizationobservables,” Phys. Rev. (to be submitted).
[23] A. V. Anisovich et al., Eur. Phys. J. A 24, 111 (2005).[24] C. Amsler et al. (Particle Data Group), Phys. Lett. B667, 1
(2008).[25] C. Amsler et al. (Crystal Barrel Collaboration), Phys. Lett. B355,
425 (1995).[26] S. Capstick and W. Roberts, Phys. Rev. D 49, 4570 (1994).[27] M. W. Paris, Phys. Rev. C 79, 025208 (2009).
065209-18