anshul narula-2
DESCRIPTION
njTRANSCRIPT

DISSERTATIONS REPORT
STUDY OF READINESS OF AFTER SALES SERVICE OF LUXURY CARS TO ALIGN WITH ITS 2020 PERSPECTIVE IN DELHI
Submitted by
Anshul NarulaA0102214102
MBA Class of 2016
Under the Supervision of
Dr. Sumeet Singh Jasial
Assistant Professor
Department (Operations)
In Partial Fulfillment of the Requirements for the Degree of Master of Business Administration (Marketing & Sales)
AMITY BUSINESS SCHOOL
AMITY UNIVERSITY UTTAR PRADESH
SECTOR 125, NOIDA - 201303, UTTAR PRADESH, INDIA

DECLARATION
The title of Dissertation Report is study of readiness of after sales service of luxury cars
to align with its 2020 perspective in Delhi.
I declare that (a) the work presented for assessment in this Dissertation Report is my
original work, that it has not previously been presented for any other assessment and that
my debts (for words, data, arguments and ideas) have been appropriately acknowledged;
(b) work conforms to the guidelines laid by the University, and (c) Plagiarism for this
report has been checked using turnitin software and is 9 %. The summary of report is
attached along with for reference.
Date: …………… Anshul Narula
A0102214102
MBA – M&S
(Class of 2016)
ii

CERTIFICATE
This is to certify that Anshul Narula student of Masters of Business Administration –
M&S at Amity Business School, Amity University Uttar Pradesh has completed the
Dissertation Report on “study of readiness of after sales service of luxury cars to align
with its 2020 perspective in Delhi”, in Partial Fulfillment of the Requirements for the
Degree of Master of Business Administration – Marketing & Sales under my guidance.
The report has been checked for the plagiarism and it is acceptable.
Dr. Sumeet Singh Jasial
Assistant Professor
Department (Operations)
LETTER OF ACKNOWLEDGEMENT
iii

Dear Readers,
I am extremely thankful to my mentor and guide Dr. Sumeet Singh Jasial for her constant support, encouragement and guidance, without which I could not have successfully completed my project on the subject of ‘Study off readiness of after sales service of luxury cars to align with its 2020 perspective in Delhi’. I would also like to thank all the participants of the research, my family& friends and of course fellows who spared their valuable time to help me and provided us the guidance to finally come up with this report. I will seek my continuous assistance and support in future.
Sincerely,
Anshul Narula
MBA-Marketing & sales (2014-2016)
A0102214102
Table of Contents
iv

ContentsChapter 1: Introduction........................................................................................................1
1.1 Introduction................................................................................................................1
1.2 After Sales Service in the Automobile Industry........................................................2
1.2.1 Suppliers of the automobile.................................................................................2
1.2.2 Producers of the automobiles..............................................................................3
1.2.3 Dealers of the automobiles..................................................................................3
1.2.4 Buyers of the automobile....................................................................................3
1.3 Problem Statement.....................................................................................................4
Chapter 2: Literature Review...............................................................................................4
Chapter 3 : Research Methodology.....................................................................................6
3.1 Research Design.........................................................................................................6
3.2 Objectives of study.....................................................................................................9
3.3 Limitations.................................................................................................................9
Chapter 4: Data Analysis.....................................................................................................9
4.1 Statistical analysis......................................................................................................9
4.2 Response charts........................................................................................................10
4.3 Cross Tabs................................................................................................................47
4.4 Factor Analysis........................................................................................................52
Chapter 5: Findings............................................................................................................60
Chapter 6: Recommendation & Conclusion......................................................................61
Conclusion.........................................................................................................................62
References..........................................................................................................................62
LIST OF TABLES
v

Table no. Name Page no.
Table 4.1Responses of ownership of luxury car
brands.11
Table 4.2 Companies’ efficiency in after sales. 13
Table 4.3 Difficulty in maintenance of luxury car. 15
Table 4.4 Difficulty in maintenance of luxury car. 17
Table 4.5 Preference of service stations 19
Table 4.6 Affect on brand choice due to after sales 21
Table 4.7 Company having enough service stations 23
Table 4.8 Company providing on road assistance 25
Table 4.9 Justification of service costs. 27
Table 4.10 Responses on notification by the company 29
Table 4.11Responses on appropriation of service
duration31
Table 4.12 Responses on cost of service 33
Table 4.13Responses on security during servicing of
car35
Table 4.14 responses on duration of service 37
Table 4.15 Responses on location of service centre 39
Table 4.16Responses on communication between
company & customers41
Table4.17 Responses on quality of service 43
Table 4.18Responses on authorization of service
centers.45
Table 4.3.1 Cross table 4.3.1 47
Table 4.3.2 Cross table 4.3.2 47
Table 4.3.3 Cross table 4.3.3 47
vi

Table 4.3.4 Cross table 4.3.4 48
Table 4.3.5 Cross table 4.3.5 48
Table 4.3.6 Cross table 4.3.6 48
Table 4.3.7 Cross table 4.3.7 49
Table 4.3.8 Cross table 4.3.8 49
Table 4.3.9 Cross table 4.3.9 49
Table 4.3.10 Cross table 4.3.10 50
Table 4.3.11 Cross table 4.3.11 50
Table 4.3.12 Cross table 4.3.12 50
Table 4.3.13 Cross table 4.3.13 51
Table 4.3.14 Cross table 4.3.14 51
Table 4.3.15 Cross table 4.3.15 51
Table 4.4.1 KMO and Bartlett's Test 52
Table 4.4.2 Communalities 52
Table 4.4.3 Total Variance Explained 53
Table 4.4.4 Total Variance Explained 54
Table 4.4.5 Component Matrixa 54
Table 4.4.6 Component Transformation Matrix 55
Table 4.4.7 Rotated Component Matrixa 56
Table 4.4.8 Factors Extracted 57
Table 4.5 Representation of different responses. 58
LIST OF FIGURES
Figure no. Name Page no.
Figure 4.1 Responses of ownership of luxury car 12
vii

brands.
Figure 4.2 Companies’ efficiency in after sales. 14
Figure 4.3 Difficulty in maintenance of luxury car. 16
Figure 4.4 Difficulty in maintenance of luxury car. 18
Figure 4.5 Preference of service stations 20
Figure 4.6 Affect on brand choice due to after sales 22
Figure 4.7 Company having enough service stations 24
Figure 4.8 Company providing on road assistance 26
Figure 4.9 Justification of service costs. 28
Figure 4.10 Responses on notification by the company 30
Figure 4.11Responses on appropriation of service
duration32
Figure 4.12 Responses on cost of service 34
Figure 4.13Responses on security during servicing of
car36
Figure 4.14 responses on duration of service 38
Figure 4.15 Responses on location of service centre 40
Figure 4.16Responses on communication between
company & customers42
Figure 4.17 Responses on quality of service 44
Figure 4.18Responses on authorization of service
centers.46
viii

ABSTRACT
Purpose of this study is to Study off readiness of after sales service of luxury cars to align
with its 2020 perspective in Delhi’. This study examines the relation of satisfaction level
of luxury cars owners with after sales service. In February 2016, questionnaires were
sent out to a sample of people comprising of luxury car owners; mostly businessmen and
employees working in high end companies. It included 18 questions, relevant to the topic
of the study. A Total of 70 usable replies were received. The respondents belong to
different localities of Delhi. The statistics of each question of all 70 respondents was
taken on list and then categorized according to 18 different questions.
The score of each question was then averaged by the respondents and then the percentage
responses were determined.
ix

1
Chapter 1: Introduction
1.1 IntroductionAfter-sales service is one of the most deliberated facets of the Indian automobile industry.
Urban customers, with increasing regularity, are demanding an improvement in services
offered by car manufacturers. Companies themselves are aware of this changing trend,
with a consumers’ loyalty proportionate to the quality of after-sales service.
A collective term for attention to a transaction that normally takes place after the sale
(and often after delivery) is accomplished. Typical after sale service functions include:
installation, training, warranty-related repair and replacement part support. After-sale
service is an extremely important consideration because of the normally greater distances
between sellers and buyers in international trade. Some international contracts as
distribution contracts include a clause of after-sales services and maintenance: The
Distributor undertakes to carry out with its own staff and means, and assume the costs of,
and adequate after-sales and maintenance service for all Products sold within the
Territory. The Supplier shall provide the Distributor with the spare parts and other means
required to service the warranty conditions of the Products.
Lele and Karmarkar, 1983 said, "After-sales services" are often referred to as "product
support activities", means that all activities that support the product-centric transaction.
Vitasek, 2005, Elaborated the statement that "After-sales services" has been used the
most, to describe services that are provided to the customer after the products have been
delivered to the customer and It also being explained as "customer support" elements,
where all activities that ensure that a product is available to consumers "over its useful
lifespan for trouble-free use" said by Loomba, 1998. Profit margins can be turned high by
delivering the after sale service in comparison with product sale without it stated by
According to Alexander (2002) and Baumgarter (1999).

2
Saccani , 2006 ,Various authors have told and pointed that the after sale service play
valid key roles in supporting the marketing activities for the enhancement of customer
retention and loyalty, which will further fetch more profits in the long run.
The generation may be at least 3 times the turnover when compared to the original
purchase in a given lifecycle of a product. There are many ways in which the customer is
connected to a brand and one of the major one is after sale services. it can also be taken in
a way that after sale service is a way to recover profits which were lost due to high
competition on the selling prices of the equipment,at the same time it’s a way of forming
constant connection with the brand (Gallagher 2005). While on the other hand lewis
(2004) stated how it affects the brand image of the firm and gets affected due to same. So
after sale is a potential source of gaining competitive advantage over your competitors.
Armistead and Clark 1992; Goffin 1999 have stated after sales in a simpler terms , it can
be defined as periodically repairing and maintaining of the equipments by the
manufacturer or the supplier during and after the warranty period of the same.
In the automobile industry, after-sales service are commonly defined as "all activities
geared towards maintaining the quality and reliability of the car carried out after the
customer has taken delivery with the goal of ensuring customer satisfaction".
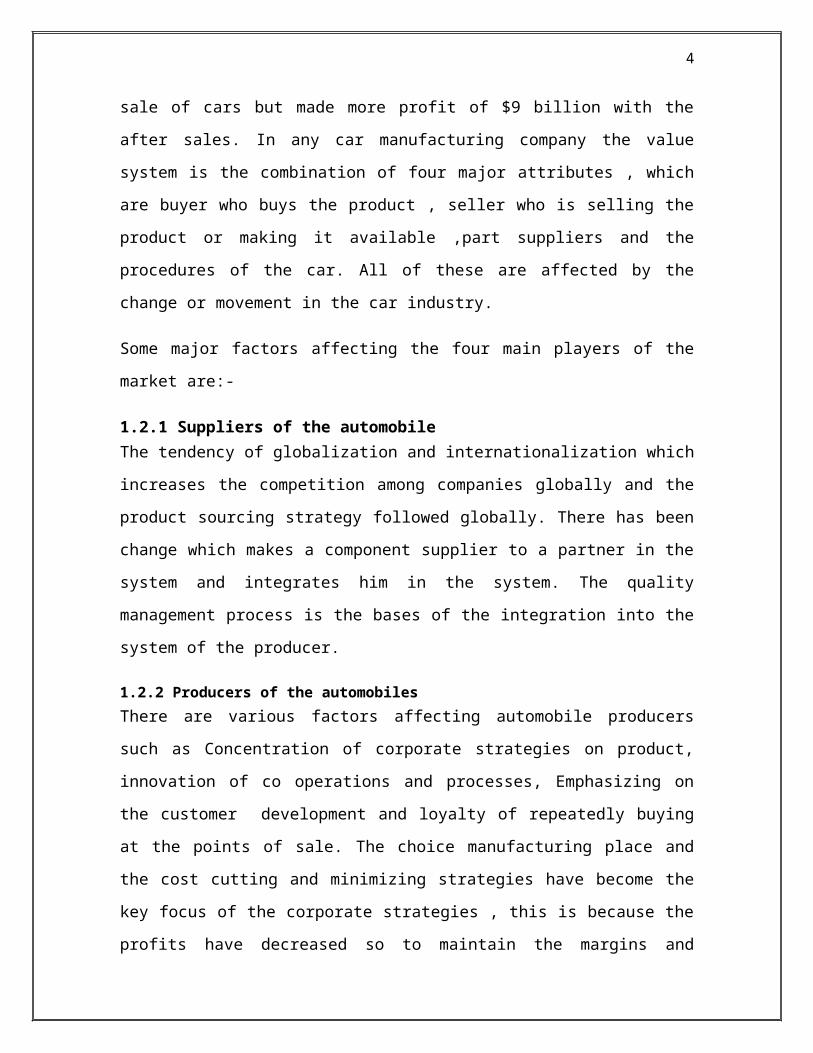
1.2 After Sales Service in the Automobile IndustryAfter sale of the products and the services cannot be considered as independent factors of
the product when talked about the market share and the profit generated , as the products
are being used to enter the market but the margins are charged on the aftermarket which
is the market of spare parts. the resent study of General Motors corporation states that
company made profits of $150 billion profit with the sale of cars but made more profit of
$9 billion with the after sales. In any car manufacturing company the value system is the
combination of four major attributes , which are buyer who buys the product , seller who
is selling the product or making it available ,part suppliers and the procedures of the car.
All of these are affected by the change or movement in the car industry.
Some major factors affecting the four main players of the market are:-

3
1.2.1 Suppliers of the automobileThe tendency of globalization and internationalization which increases the competition
among companies globally and the product sourcing strategy followed globally. There
has been change which makes a component supplier to a partner in the system and
integrates him in the system. The quality management process is the bases of the
integration into the system of the producer.
1.2.2 Producers of the automobilesThere are various factors affecting automobile producers such as Concentration of
corporate strategies on product, innovation of co operations and processes, Emphasizing
on the customer development and loyalty of repeatedly buying at the points of sale. The
choice manufacturing place and the cost cutting and minimizing strategies have become
the key focus of the corporate strategies , this is because the profits have decreased so to
maintain the margins and turnovers the same is done. Thinking across the global
boundaries ,which states that not only think about the customer in your country but the
customers who are potential buyer from all over the globe. There have been high
concentrations on the returns to be made on investments. Increasing the use of trading
tactics.
1.2.3 Dealers of the automobilesIn the European markets there has been situations in which the industries are not being
able to sell as much they are producing , in simpler words the production in way higher
then the sales , so the dealers are forced to move out and do business in other countries.
There has been reduction in the profits and returns , underutilization od the resources ,
loss in business of after sale car market which includes the second hand cars and the
spare part market, high producers are being put by the producer to sell more, difficulty
levels have increased in telling the differences in the available models. So it can be said
the dealers of the automobile market are not in the state they desire for.

4
1.2.4 Buyers of the automobileAs being one of the major automobile buyers there are various factors influencing them
such as, the buyer is now highly aware about the price and quality, the requirement of the
services and the importance being given to the same have increased drastically, the
demand is for a tottaly new concepts.
The after sales when thinking of a producer can consist of 3 major departments : the
accessories , parts , and pure services ehich are technical in most number of cases. The
division was required partly because of the huge differences in the profits margins which
were made on the parts and other common accessories ,but also because of the imported
car segments whose accessories were imported from the international markets. this
actually made after sale somewhat service oriented rather than completely product
oriented. In the current scenario it has become product plus service oriented. The
products are defined as the parts and pieces that are to be fitted in the car to meet the
demands of the customers and on the other hand services are defined as interaction
required to be done with the car owner to know customers requirements with the purpose
of completely satisfying him.
.
1.3 Problem StatementLuxury car segment being one of the rapid growing markets in India, which is affecting
GDP to NNP on a grand scale. And the fact that after sales service is one of the major
factors in this growing segment. So, it makes it very important to know about the
readiness of India on the perspective of coming future. As after-sales service is a segment
which generates some great revenue for the companies.

5
Chapter 2: Literature Review
Many studies have been or are being conducted in the area of after sales services
especially when we talk about automobile industry. These studies have revealed the
important role played by after sales service in the automotive industry. Over the period
studies conducted has show how companies can take advantage over others by adapting
to the change of modern times. i.e., providing customer the best quality of after sales
services to maintain a loyal customer and generating revenue from that loyalty.
With a satisfaction level of 80-100% Nissan has ranked their after-sales service of
distribution policy a very effective process. While its after-sales services were ranked
partly effective with only 45-59% of the satisfaction level.
With the satisfaction level of their distribution and service policies 60-79%which are
effective, Fiat has ranked their after-sales promotion but with 40-59% satisfaction level.
Their after-sales price policy was only ranked as effective in partly manner.
An Empirical Analysis conducted by Dirlenbach, Automotive After-Sales-Service
Innovations has revealed that, the link between long term success of a service and the
customer orientation innovation was both calculative in the quantitative as well as the
qualitative analysis. from the results of the defined qualitative interviews, It was also
deduced that, taking up customer needs by actually connecting forces in the
improvement of such features would increase the chance of a victorious service
innovation or by either actively attaining feedback of the new characters of after-sales
services. A further finding of the project showed the positive impact of the IT-
professionalism on short term of success.
Jain of "Honda Motors" conducted A report on Effect of After-Sales Services on
Consumer Satisfaction and preferences to find if there is a strong link between after-sales
service offered by the company with customer patronage and satisfaction. After-sales
services offerings was studied in expression of reliability of warranties and guarantees,
car insurances, free service and customer education provided for driving the car.

6
Bain and Co conducted a Automotive survey which had results like Improving the after-
sales service help in retention of the customers and an beholden article written by
Lamoure, Hoffmann, and Flees interpreted the results of surveys which were conducted
by, a popular consulting firm. Asserting that the way of winning new customers requires
the car manufacturer to develop more hi tech, joyful, and good millage vehicles, a task
that could take lot of months and years of professional and expertise investment. But the
study suggests that companies have had the chance to improve performance of their
business in short term by putting focus on the customers to whom they already have been
doing by offering the really good after-sales service.
When the vehicle gets aged and the warranty period ends at that time commonly the
attachment of the owner towards the brand ends. But the same happens only about a
period of about four five years from the time the vehicle was purchased. The company
should try to take advantage on the lolayty part by making regular visits and being in
touch with the customer.this will create a win win situation for both the parties. This
basically tells how important is ti be in touch with the customer in a critical time period
when the customers are looking to buy a new vehicle. This is the actual meaning of
customer retention.
There was a report written by Verma and Sarkar which was published in The Economic
Times. the same was regarding the dissatisfaction level of Indian consumers with after
sale services being offered by the dealers of luxury car dealers , the luxury car companies
had to do lot of efforts and hard work and had to develop themselves in a huge way
before they could promise a service support fitting they were planning for their image in
India. Concluding that the luxury in India had some limitations , among which after sale
servicing was one.

7
Chapter 3: Research Methodology
3.1 Research DesignDescriptive research methodology has been used for conducting this study. Instruments
like questionnaire and interviews were used for surveying and data collection. Surveys
were used for obtaining data from the individuals reading their own experiences with
after sales services in the luxury car segment. There were two types of research which I
used as my major tools for collecting information, which follows:
Qualitative research
Asking broad questions and collecting data in the form of words, images, etc. that is
analyzed and searching for themes .Qualitative research was used for conducting
exploratory research for later analysis to be done in the study. The same was in the
context of theoretical ad philosophical issue of social development This type of research
in layman’s language can be stated as analyzing the only the qualitative parameters of
respondents. In this research, I measured the satisfactory level of the dealers by asking
them few questions regarding the benefits provided to them which showed an amazing
result.
Quantitative research
In quantitative research I basically collected information by conducting interviews and
making them fill the questionnaire. All the information collected and analyzed are to be
presented in the form of pie charts and graphical figures. Quantitative research is linked
with the philosophical and theoretical stance of positivism. This is the research includes a
survey to be conducted with the help of a questionnaire which I have added as an
annexure in this report.
By using both quantitative and qualitative research tools, I was able to conduct a survey
including 70 respondents including various luxury car owners. While conducting this

8
survey I was able to establish a great contact with each one of them and was able to
collect valid responses. Which later I summarized and presented in an efficient manner
with the help pie charts and tables, and I was able to state all the major finding and give
some recommendations and in the end I concluded my result explaining what my
research has been all about.
When I started conducting this research the statement of objectives were lower in
numbers but when once I started a in detailed analysis I realized that there are various
variables which could be included in the questionnaire , which should be included in my
report. Before conducting the research i had a strong encounter with various sales
employees from different luxury brands which helped me gather some in depth
information which could be used as some important statement or the basis of analysis
regarding my research. After this I constructed a questionnaire including all the variables
affecting my research subject which I gathered from my mentor mr. sumit singh and
other sources. I faced some real hard problems conducting this research as fir I was
thinking to go for 100 respondents but due to the subject being limited to the luxury cars
owners I had to decrease the sample size to 70 respondents. And after this the information
I was really seeking for was still really difficult as the respondents didn’t had the time or
interest to fill up my questionnaire. I had to exercise these questionnaire by performing a
interpersonal communication channel to get the respondents show interest in m y research
and all the hard work came in handy I was able to gather some real crude information.
Which I analyzed by using cross tabs method and represented this analyzed data in an
organized way with help of some pie charts tabular figures and charts as featured in
chapter IV of my research.
9
3.2 Objectives of study To study and analyze the readiness of after sales service of luxury cars to align with its
2020 perspective in Delhi, So survey has been conducted on the sample of 70 luxury cars
owners.
To understand effectiveness of after sales service among luxury car owners.
To elaborate the importance of after sales service in the automotive industry.
Factors that influence decision-making for getting a luxury car services.
To understand satisfaction level of the luxury cars owners with respect to
comparison of perception between BMW, Audi and Mercedes.
3.3 Limitations1. As project being Time constraint, it acts as a limitation for conducting my
research.
2. It’s only a developing segment so speculations made can never be accurate.
3. Survey findings were limited as scope of sample was only 70 luxury cars owners.
4. As being Informatory project information was to be collected from internet which
was limited.

10
Chapter 4: Data Analysis
4.1 Statistical analysisThe analysis of the report has been done on the people answering the concerned
questions. The categorization was done by taking statistics of different questions
answered by all the 70 respondents. The score gathered from each question was then
divided by the number of respondents and percentage responses were determined and
using those figures, the tables and charts were made which are discussed further. Based
on these percentages, various findings were determined.
4.2 Response chartsPresented below are the different percentage responses of the participants to the different
questions of the survey questionnaire.
11
1. What luxury brand's car you own?
BMW: 25.61% Audi: 24.39% Mercedes: 21.95% JLR: 8.54% others: 19.51%
Answer Count Percent 20% 40% 60% 80% 100%
BMW 21 25.61%
Audi 20 24.39%
Mercedes 18 21.95%
JLR 7 8.54%
Others 16 19.51%
Total 82 100 %
Table 4.1. Responses of ownership of luxury car brands.

12
25.61%
24.39%21.95%
8.54%
19.51%
BMWAudiMercedesJLRothers
Figure 4.1 Responses of ownership of luxury car brands.
Interpretation
As most of the respondents has answered BMW (25%) , and the second best answer was
Audi (24%) , and other respondents have chose Mercedes (22%) , and then JLR (8%) as
their car owned. BMW has emerged as a brand most owned which could be because of
their goodwill in the market.
13
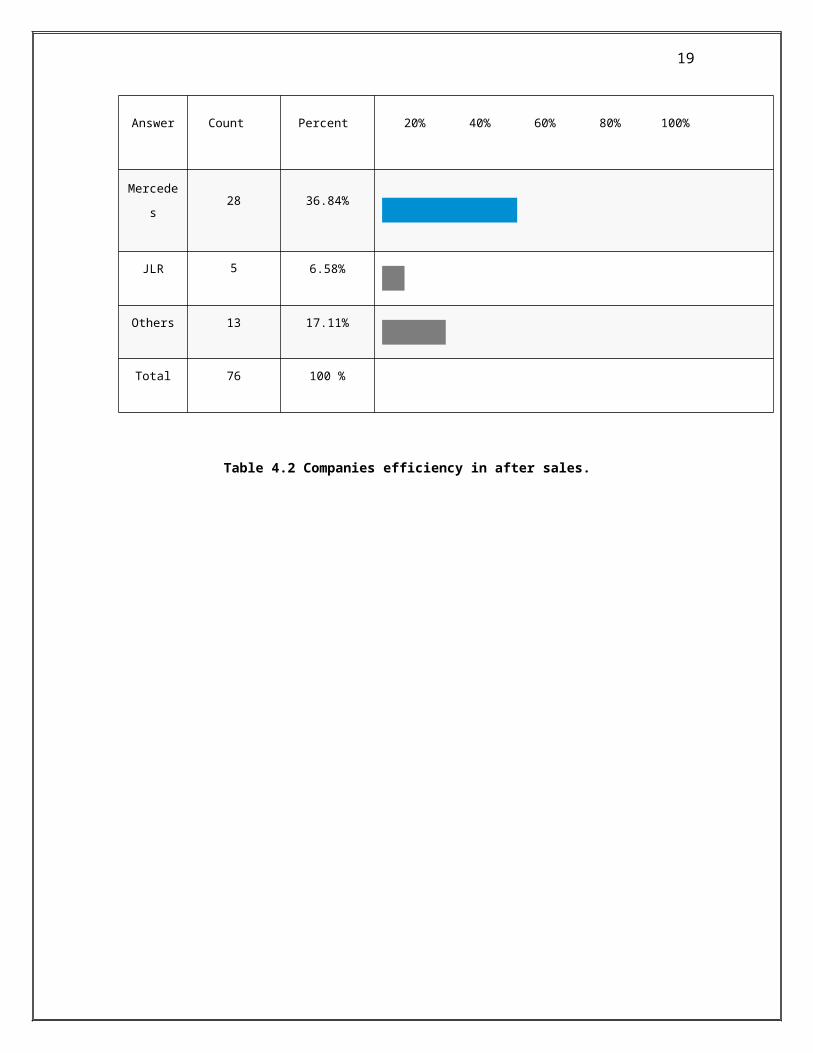
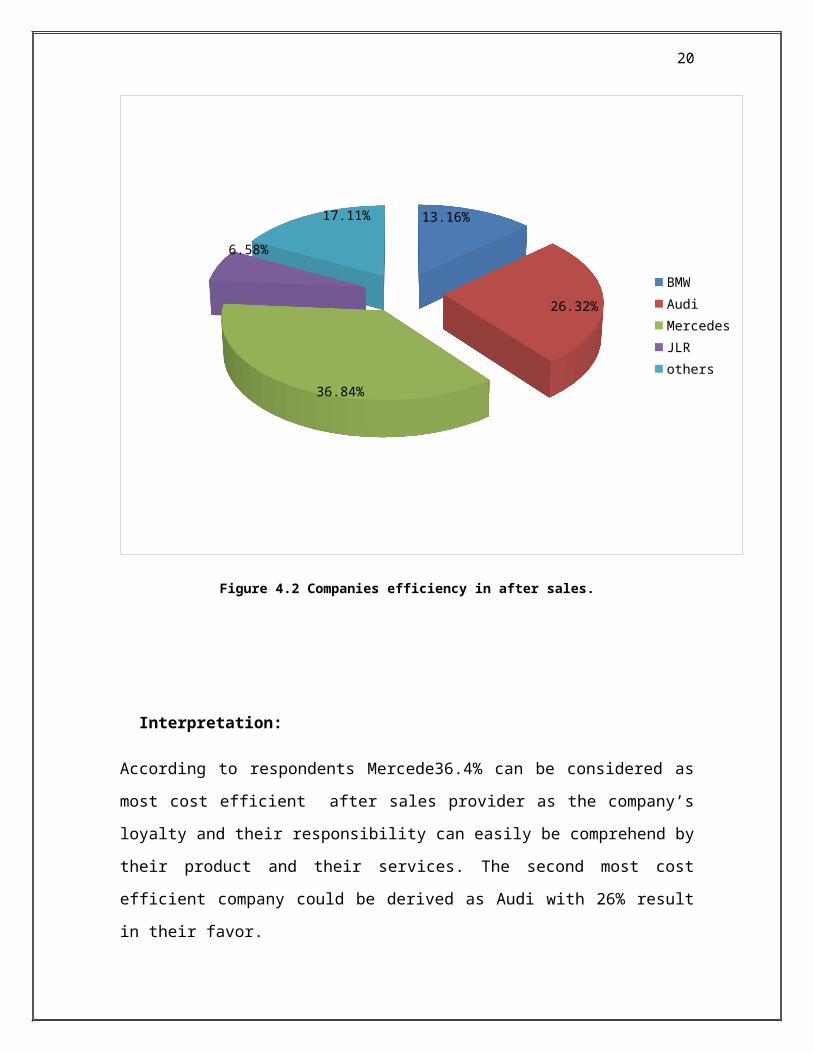
2. Which company provides the most cost efficient after sales service?
BMW: 13.16% Audi: 26.32% Mercedes: 36.84% JLR: 6.58% others: 17.11%
Answer Count Percent 20% 40% 60% 80% 100%
BMW 10 13.16%
Audi 20 26.32%
Mercedes 28 36.84%
JLR 5 6.58%
Others 13 17.11%
Total 76 100 %
Table 4.2 Companies efficiency in after sales.

14
13.16%
26.32%
36.84%
6.58%
17.11%
BMWAudiMercedesJLRothers
Figure 4.2 Companies efficiency in after sales.
Interpretation:
According to respondents Mercede36.4% can be considered as most cost efficient after
sales provider as the company’s loyalty and their responsibility can easily be comprehend
by their product and their services. The second most cost efficient company could be
derived as Audi with 26% result in their favor.

15
3) Which company provides the best quality after sales services?
BMW : 21.52%Audi : 30.38%Mercedes : 29.11%JLR : 7.59%others : 11.39% Audi :
30.38%
Count Percent20% 40% 60% 80% 100%
BMW 17 21.52%
Audi 24 30.38%
Mercedes 23 29.11%
JLR 6 7.59%
others 9 11.39%
Total 79 100 %
Table 4.3 Companies quality in after sales.

16
BMW Audi Mercedes JLR others0.00%
5.00%
10.00%
15.00%
20.00%
25.00%
30.00%
35.00%
Figure 4.3 Companies quality in after sales.
Interpretation:
With the result of 30% in their favor, Audi can be considered as the best quality after
sales service provider and as being the holder of 29% votes by the respondents Mercedes
is the second best quality after sales service provider.

17
4) Do you agree that It is difficult to maintain a luxury car.
Strongly Disagree : 4.29%Disagree : 18.57%Neutral : 30.00%Agree : 32.86%Strongly agree : 14.29% Agree : 32.86%
Count Percent20% 40% 60% 80% 100%
Strongly Disagree 3 4.29%
Disagree 13 18.57%
Neutral 21 30%
Agree 23 32.86%
Strongly agree 10 14.29%
Total 70 100 %
Table 4.4 Difficulty in maintenance of luxury car.

18
Strongly Disagree Disagree Neutral Agree0.00%
5.00%
10.00%
15.00%
20.00%
25.00%
30.00%
35.00%
Figure 4.4 Difficulty in maintenance of luxury car.
Interpretation:
When asked about the difficulty of maintenance then the measurity of people agreed to
the same , 32% people agreed to it and then 30 % were neutral. This states that when it
comes to difficulty in maintenance then in spite having the power to buy expensive cars
they find it difficult to maintain.
5) Luxury car owners only prefer company authorized service centers.

19
Strongly Disagree : 1.43%Disagree : 14.29%Neutral : 11.43%Agree : 51.42%Strongly agree : 21.43% Agree : 51.42%
Answer Count Percent 20% 40% 60% 80% 100%
Strongly Disagree 1 1.43%
Disagree 10 14.29%
Neutral 8 11.43%
Agree 36 51.43%
Strongly agree 15 21.43%
Total 70 100 %
Table 4.5 Preference of service stations

20
1.43%14.29%
11.43%
51.43%
Strongly Disagree Disagree Neutral Agree
Figure 4.5 Preference of service stations
Interpretation:
With the huge percentage of 51% , owners of luxury cars only prefer getting their cars
serviced at the company authorized service centre , then only 21 % of the luxury cars
owners don’t prefer the same due to miscellaneous reasons

21
6) After sales services affects one's brand choice.
Strongly Disagree : 2.86%Disagree : 10.00%Neutral : 31.43%Agree : 38.57%Strongly agree : 17.14%
Count Percent
20% 40% 60% 80% 100%
Strongly Disagree 2 2.86%
Disagree 7 10%
Neutral 22 31.43%
Agree 27 38.57%
Strongly agree 12 17.14%
Total 70 100 %
Table 4.6 affect on brand choice due to after sales .

22
3% 10%
31%
39%
17%
Strongly Disagree Disagree Neutral Agree Strongly agree
Figure 4.6 affect on brand choice due to after sales .
Interpretations:
When asked about that does your brand choice gets affected due to after sale services ,
then 38% of the luxury car owners agreed to the same while 31% of the owners were
neutral with the same.

23
7) Do you agree with the statement that, A company has enough number of service
centers to satisfy their every customer.
Strongly Disagree: 2.86% Disagree: 17.14% Neutral : 24.29% Agree : 44.29% Strongly agree : 11.43%
Count Percent 20% 40% 60% 80% 100%
Strongly Disagree 2 2.86%
Disagree 12 17.14%
Neutral 17 24.29%
Agree 31 44.29%
Strongly agree 8 11.43%
Total 70 100 %
Table 4.7 Company having enough service stations.
24
Strongly Disagree Disagree Neutral Agree0.00%
5.00%
10.00%
15.00%
20.00%
25.00%
30.00%
35.00%
40.00%
45.00%
50.00%
Figure 4.7 Company having enough service stations.
Interpretation:
As our research was mainly conducted in Delhi where there are huge number of luxury
car owners as compared to other states. So 42% of the luxury car owners were satisfied
with the same , followed by 24% who were neutral with the same. In Delhi there are lot
of service stations of various luxury car brands.
.
25
8) Do you agree with the statement that : Company always provides on-road assists.
Strongly Disagree : 4.29%Disagree : 18.57%Neutral : 34.29%Agree : 32.86%Strongly agree : 10.00%
Answer Count Percent20% 40% 60% 80% 100%
Strongly Disagree 3 4.29%
Disagree 13 18.57%
Neutral 24 34.29%
Agree 23 32.86%
Strongly agree 7 10%
Total 70 100 %
Table 4.8 Company providing on road assistance.

26
4.29%
18.57%
34.29%
32.86%
10.00%
Strongly Disagree Disagree Neutral Agree Strongly agree
Figure 4.8 Company providing on road assistance.
Interpretation:
There were huge number of customers, 34% who were not aware about the such services
so they also answered with neutral but also on the other hand there were customers who
agreed and disagreed to the same with 32% and 18% respectively.

27
9) Do you agree with the statement that: All service costs are completely justified.
Strongly Disagree : 20.00%Disagree : 24.29%Neutral : 25.71%Agree : 24.29%Strongly agree : 5.71%
Answer Count Percent20% 40% 60% 80% 100%
Strongly Disagree 14 20%
Disagree 17 24.29%
Neutral 18 25.71%
Agree 17 24.29%
Strongly agree 4 5.71%
Total 70 100 %
Table 4.9 Justification of service costs.

28
Strongly Disagree Disagree Neutral Agree Strongly agree0%
5%
10%
15%
20%
25%
30%
Figure 4.9 Justification of service costs.
Interpretation:
When asked about the justifications of the service cost there were mixed responses
gathered as 25% of the luxury car owners were neutral with the same , 24% agreed and
disagreed , 20% strongly disagreed. Some owners feel that if they can buy expensive cars
then they can also pay the service costs , on the other hand some feel that the company
charges bit extra.

29
10) Do you agree with the statement that, Company always notifies when your car
service is due.
Strongly Disagree : 4.29%Disagree : 5.71%Neutral : 22.86%Agree : 42.86%Strongly agree : 24.29%
Count Percent20% 40% 60% 80% 100%
Strongly Disagree 3 4.29%
Disagree 4 5.71%
Neutral 16 22.86%
Agree 30 42.86%
Strongly agree 17 24.29%
Total 70 100 %
Table 4.10 Responses on notification by the company

30
Strongly Disagree Disagree Neutral Agree Strongly agree0.00%
5.00%
10.00%
15.00%
20.00%
25.00%
30.00%
35.00%
40.00%
45.00%
Figure 4.10 Responses on notification by the company
Interpretation:
When asked about that does the company gives you reminder when your service is due,
then 42% of the luxury car owners agreed to it while 24% and 22% strongly agreed and
were neutral respectively. These responses were as almost all the companies luxury or not
but are putting huge emphasis on the communication part.

31
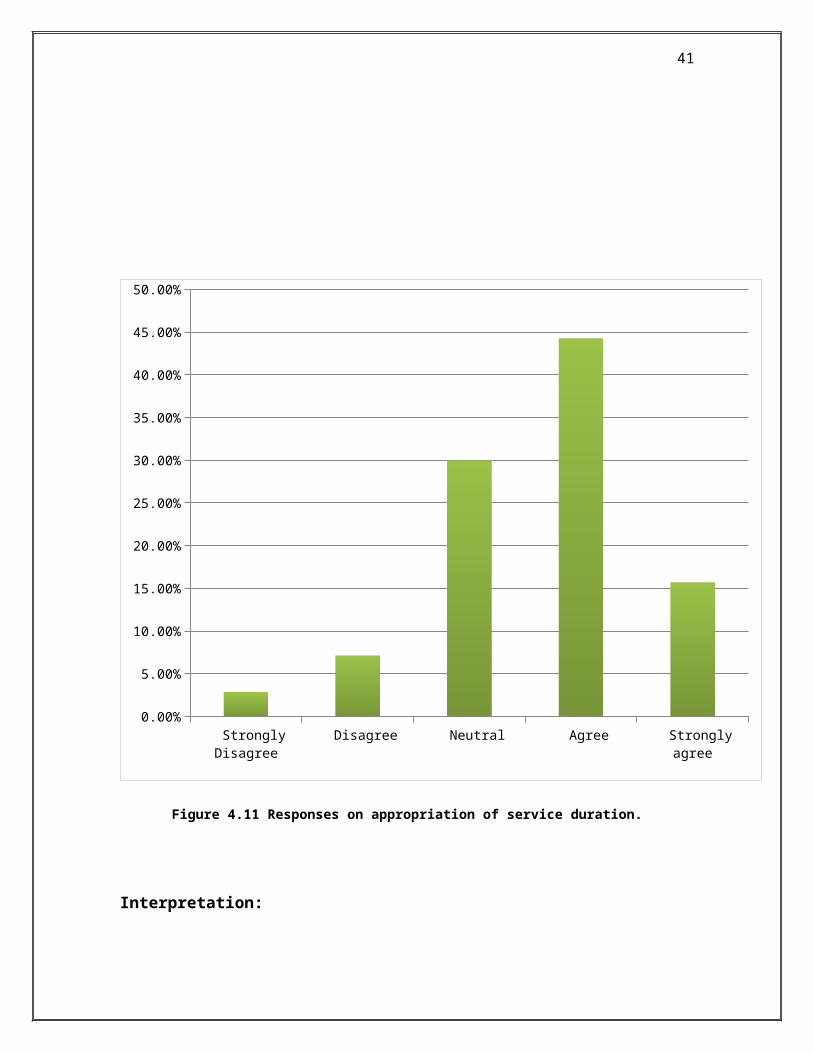
11) Is the Service duration is appropriate.
Strongly Disagree : 2.86%Disagree : 7.14%Neutral : 30.00%Agree : 44.29%Strongly agree : 15.71%
Answer Count Percent 20% 40% 60% 80% 100%
Strongly Disagree 2 2.86%
Disagree 5 7.14%
Neutral 21 30%
Agree 31 44.29%
Strongly agree 11 15.71%
Total 70 100 %
Table 4.11 Responses on appropriation of service duration.

32
Strongly Disagree Disagree Neutral Agree Strongly agree0.00%
5.00%
10.00%
15.00%
20.00%
25.00%
30.00%
35.00%
40.00%
45.00%
50.00%
Figure 4.11 Responses on appropriation of service duration.
Interpretation:
The service according to the customers takes appropriate time as 44% of the luxury car
owners agreed to the same followed by the 30% who were neutral. the customers are not
considering the time too much but had emphasis on cost and quality.
12) Rate the factor influencing your car service: cost of service

33
Strongly Disagree: 7.14% Disagree: 10.00% Neutral :38.57% Agree :: 31.43% Strongly agree: 12.86%
Answer Count Percent20% 40% 60% 80% 100%
Strongly Disagree 5 7.14%
Disagree 7 10%
Neutral 27 38.57%
Agree 22 31.43%
Strongly agree 9 12.86%
Total 70 100 %
Table 4.12 Responses on cost of service.

34
7% 10%
39%
31%
13%
Strongly Disagree Disagree Neutral Agree Strongly agree
Figure 4.12 Responses on cost of service.
Interpretations:
Majority 38% of the luxury car owners did not give much emphasis on the cost
factor ,but still a good number of 31% agreed on the factor and gave importance to the
same.

35
13) Rate the factor influencing your car service: security
Strongly Disagree: 0.00% Disagree: 5.71% Neutral: 22.86% Agree: 48.57% Strongly agree: 22.86%
Count Percent 20% 40% 60% 80% 100%
Strongly Disagree 0 0%
Disagree 4 5.71%
Neutral 16 22.86%
Agree 34 48.57%
Strongly agree 16 22.86%
Total 70 100 %
Table 4.13 Responses on security during servicing of car.

36
Strongly Disagree Disagree Neutral Agree Strongly agree0%
5%
10%
15%
20%
25%
30%
35%
40%
45%
50%
Figure 4.13 Responses on security during servicing of car.
Interpretation:
48% agreed to the point when asked about the security of their cars, as they buy these
expensive cars and also want them to be safe when given to the company for services and
other jobs.

37
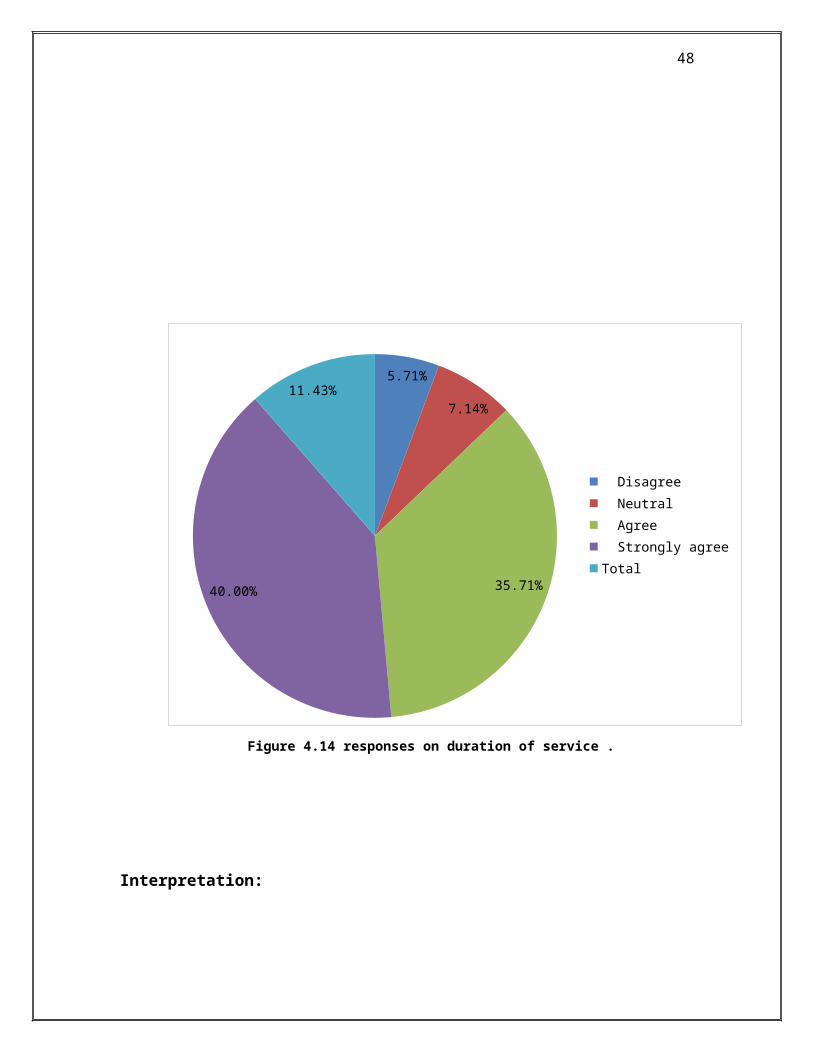
14) Rate the factor influencing your car service: duration of service
Strongly Disagree:: 5.71% Disagree : 7.14% Neutral: 35.71% Agree: 40.00% Strongly agree: 11.43%
Count Percent20% 40% 60% 80% 100%
Strongly Disagree 4 5.71%
Disagree 5 7.14%
Neutral 25 35.71%
Agree 28 40%
Strongly agree 8 11.43%
Total 70 100 %
Table 4.14 responses on duration of service .

38
5.71%
7.14%
35.71%40.00%
11.43%
Disagree Neutral Agree Strongly agreeTotal
Figure 4.14 responses on duration of service .
Interpretation:
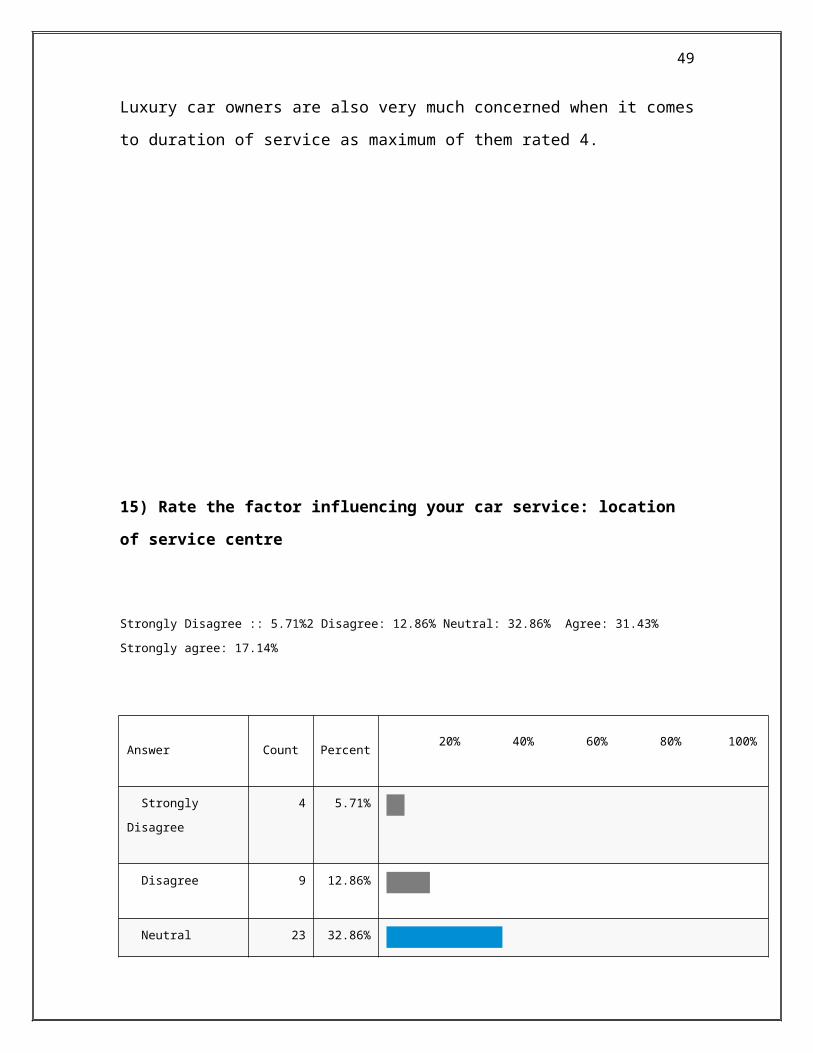
Luxury car owners are also very much concerned when it comes to duration of service as
maximum of them rated 4.

39
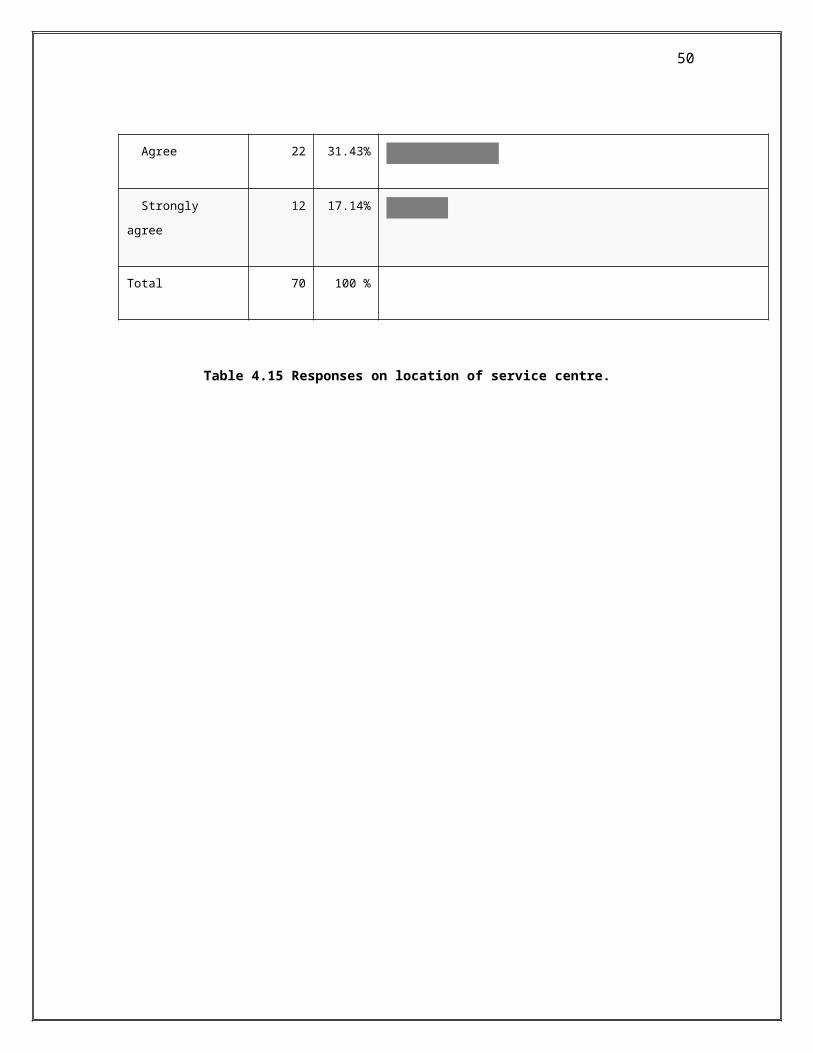
15) Rate the factor influencing your car service: location of service centre
Strongly Disagree :: 5.71%2 Disagree: 12.86% Neutral: 32.86% Agree: 31.43% Strongly agree: 17.14%
Answer Count Percent20% 40% 60% 80% 100%
Strongly Disagree 4 5.71%
Disagree 9 12.86%
Neutral 23 32.86%
Agree 22 31.43%
Strongly agree 12 17.14%
Total 70 100 %
Table 4.15 Responses on location of service centre.

40
Strongly Disagree Disagree Neutral Agree Strongly agree0.00%
5.00%
10.00%
15.00%
20.00%
25.00%
30.00%
35.00%
5.71%
12.86%
32.86%31.43%
17.14%
Figure 4.15 Responses on location of service centre.
Interpretation:
Location is not such a important point in the minds of luxury cars owners as there is pick
and drop facilities provided by all the companies.
16) Rate the factor influencing your car service: communication

41
Strongly Disagree: 5.71% Disagree: 7.14% Neutral: 28.57% Agree: 40.00% Strongly agree: 18.57%
Answer Count Percent20% 40% 60% 80% 100%
Strongly Disagree 4 5.71%
Disagree 5 7.14%
Neutral 20 28.57%
Agree 28 40%
Strongly agree 13 18.57%
Total 70 100 %
Table 4.16 Responses on communication between company & customers.

42
5.71%
7.14%
28.57%
40.00%
18.57%
Strongly Disagree Disagree Neutral Agree Strongly agree
Figure 4.16 Responses on communication between company & customers.
Interpretation:
The luxury car owners like to be communicated and informed about their cars and so they
have put emphasis on the same by rating it agree to the statement.

43
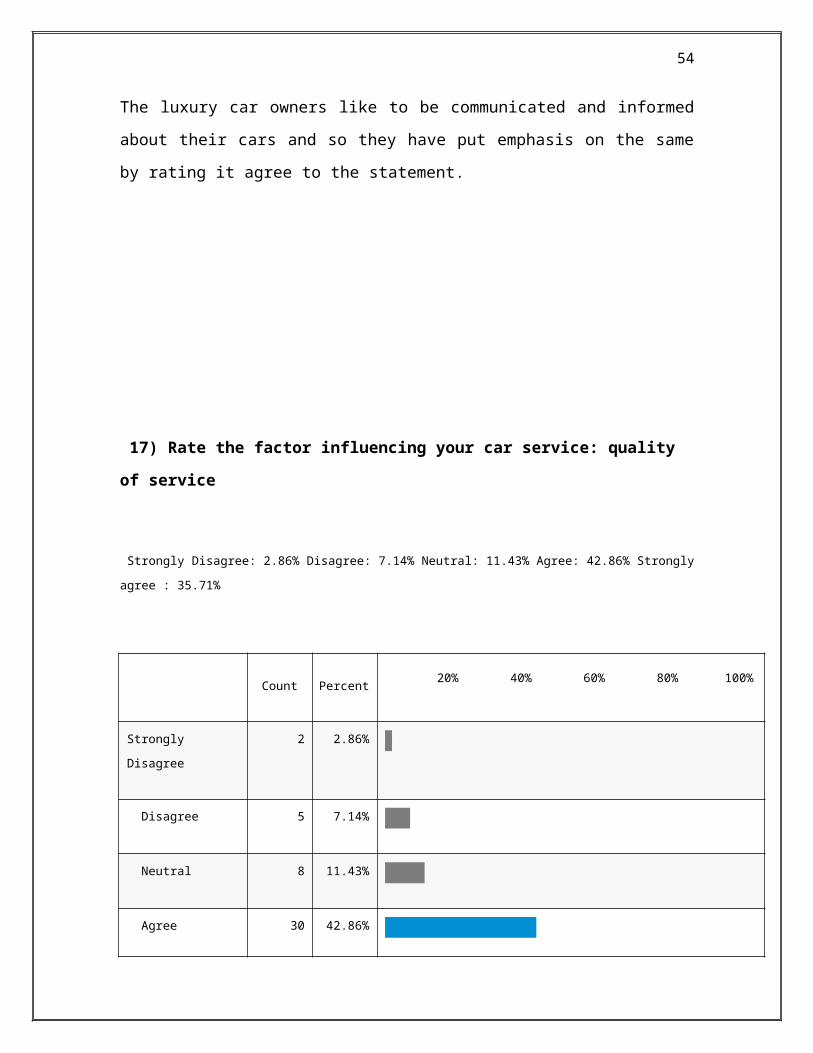
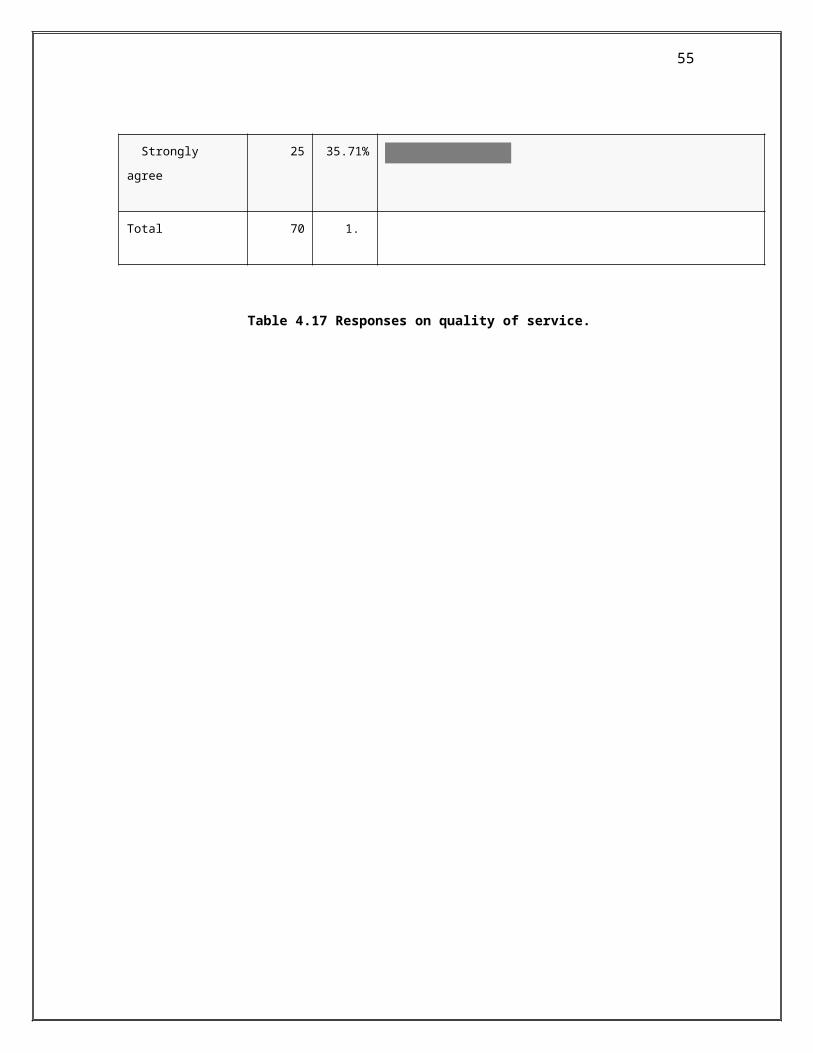
17) Rate the factor influencing your car service: quality of service
Strongly Disagree: 2.86% Disagree: 7.14% Neutral: 11.43% Agree: 42.86% Strongly agree : 35.71%
Count Percent20% 40% 60% 80% 100%
Strongly Disagree 2 2.86%
Disagree 5 7.14%
Neutral 8 11.43%
Agree 30 42.86%
Strongly agree 25 35.71%
Total 70 1.
Table 4.17 Responses on quality of service.

44
Strongly Disagree Disagree Neutral Agree Strongly agree0.00%
5.00%
10.00%
15.00%
20.00%
25.00%
30.00%
35.00%
40.00%
45.00%
50.00%
2.86%
7.14%
11.43%
42.86%
35.71%
Figure 4.17 Responses on quality of service.
Interpretations:
The quality is at the end of the day what matters , the cost and time does not put huge
impact on the customer but the quality is the point which remains on the top of the luxury
car owner.
18) Rate the factor influencing your car service: authorization

45
Strongly Disagree: 5.71% Disagree: 10.00% Neutral: 22.86% Agree: 32.86% Strongly agree: 28.57%
Count Percent20% 40% 60% 80% 100%
Strongly Disagree 4 5.71%
Disagree 7 10%
Neutral 16 22.86%
Agree 23 32.86%
Strongly agree 20 28.57%
Total 70 100 %
Table 4.18 Responses on authorization of service centers.
46
Strongly Disagree Disagree Neutral Agree Strongly agree0.00%
5.00%
10.00%
15.00%
20.00%
25.00%
30.00%
35.00%
6%
10%
23%
33%
29%
Figure 4.18 Responses on authorization of service centers.
Interpretations:
Authorization is also an important point when it comes to after sales service as 32% and
28% have agreed and strongly agreed to the same respectively.

47
4.3 Cross Tabs4.3.1 What luxury brands car you own ? * it is difficult to maintain a luxury car .cross tabulation
It is difficult to maintain a luxury car .
TotalWhat luxury brands car you own?
Strongly Disagree
Disagree Neutral Agree Strongly Agree
Others. 3 7 15 17 8 50
BMW 1 0 7 7 7 2 23
Total 3 14 22 24 10 73
4.3.2 What luxury brands car you own ? * it is difficult to maintain a luxury car .cross tabulation
It is difficult to maintain a luxury car . Total
What luxury brands car you own?
Strongly Disagree
Disagree Neutral Agree Strongly Agree
Others. 2 10 14 20 7 53
Audi 1 1 4 8 4 3 20
Total 3 14 22 24 10 73
4.3.3 What luxury brands car you own ? * it is difficult to maintain a luxury car .cross tabulation
It is difficult to maintain a luxury car . Total
What luxury brands car you own?
Strongly Disagree
Disagree Neutral Agree Strongly Agree
Others. 2 9 15 20 8 54
Mercedes 1 1 5 7 4 2 19
Total 3 14 22 24 10 73
Interpretation: We here get the perception regarding difficulty of maintain a luxury car , which comes ot to be BMW customers don’t have a single opinion , Audi and Mercedes customers are neutral to the same.

48
4.3.4 What luxury brands car you own? After sale services affects ones brand choice. Cross tabulation.
After sales services affects ones brand choice. Total
What luxury brands car you own?
Strongly Disagree
Disagree Neutral Agree Strongly Agree
Others. 2 5 13 23 7 50
BMW 1 0 2 9 5 7 23
Total 2 7 22 28 14 73
4.3.5 What luxury brands car you own? After sale services affects ones brand choice. Cross tabulation.
After sales services affects ones brand choice. Total
What luxury brands car you own?
Strongly Disagree
Disagree Neutral Agree Strongly Agree
Others. 0 3 16 21 13 53
Audi 1 2 4 6 7 1 20
Total 2 7 22 28 14 73
4.3.6 What luxury brands car you own? After sale services affects ones brand choice. Cross tabulation.
After sales services affects ones brand choice. Total
What luxury brands car you own?
Strongly Disagree
Disagree Neutral Agree Strongly Agree
Others. 2 3 17 20 12 54
Mercedes 1 0 4 6 8 2 19
Total 2 7 22 28 14 73
Interpretation: Here the perception found regarding after sales affecting once brand choice is, BMW customers are neutral, Audi and Mercedes customers agree to the sam

49
4.3.7 What luxury brands car you own? A company has enough number of service centers. Cross tabulation.
A company has enough number of service centers. Total
What luxury brands car you own?
Strongly Disagree Disagree Neutral Agree Strongly Agree
Others. 1 8 9 26 6 50
BMW 1 1 5 9 5 3 23
Total 2 13 18 31 9 73
4.3.8 What luxury brands car you own? A company has enough number of service centers. Cross tabulation.
A company has enough number of service centers. Total
What luxury brands car you own?
Strongly Disagree
Disagree Neutral Agree Strongly Agree
Others. 2 10 16 18 7 53
Audi 1 0 3 2 13 2 20
Total 2 13 18 31 9 73
4.3.9 What luxury brands car you own? A company has enough number of service centers. Cross tabulation.
A company has enough number of service centers. Total
What luxury brands car you own?
Strongly Disagree
Disagree Neutral Agree Strongly Agree
Others. 2 11 12 21 8 54
Mercedes 1 0 2 6 10 1 19
Total 2 13 18 31 9 73
Interpretation: The perception found by the statement “company has enough no of service centers” is, BMW, Audi and Mercedes customers are satisfied with the same.

50
4.3.10 What luxury brands car you own? Company always provides on road assists. Cross tabulation.
Company always provides on road assists. Total
What luxury brands car you own?
Strongly Disagree
Disagree Neutral Agree Strongly Agree
Others. 2 6 19 18 5 50
BMW 1 1 8 5 6 3 6
Total 3 14 24 24 8 73
4.3.11 What luxury brands car you own? Company always provides on road assists. Cross tabulation.
Company always provides on road assists. Total
What luxury brands car you own?
Strongly Disagree Disagree Neutral Agree Strongly Agree
Others. 2 11 15 18 7 53
Audi 1 1 3 9 6 1 20
Total 3 14 24 24 8 73
4.3.12 What luxury brands car you own? Company always provides on road assists. Cross tabulation.
Company always provides on road assists. Total
What luxury brands car you own?
Strongly Disagree
Disagree Neutral Agree Strongly Agree
Others. 2 10 20 16 6 54
Mercedes 1 1 4 4 8 2 19
Total 3 14 24 24 8 73
Interpretation: The perception found by the statement “company provides on road assist” is BMW customers did not agree, Audi customers were neutral and Mercedes customers agreed to the same.

51
4.3.13 What luxury brands car you own? All service costs are completely justified. Cross tabulation.
All service costs are completely justified. Total
What luxury brands car you own?
Strongly Disagree
Disagree Neutral Agree Strongly Agree
Others. 7 13 16 10 4 50
BMW 1 7 6 3 7 0 23
Total 14 19 19 17 4 73
4.3.14 What luxury brands car you own?All service costs are completely justified. Cross tabulation.
All service costs are completely justified. Total
What luxury brands car you own?
Strongly Disagree
Disagree Neutral Agree Strongly Agree
Others. 13 12 13 12 3 53
Audi 1 1 7 6 5 1 20
Total 14 19 19 17 4 73
4.3.15 What luxury brands car you own?All service costs are completely justified. Cross tabulation.
All service costs are completely justified. Total
What luxury brands car you own?
Strongly Disagree
Disagree Neutral Agree Strongly Agree
Others. 8 16 15 13 2 54
Mercedes 1 6 3 4 4 2 19
Total 14 19 19 17 4 73
Interpretation: The perception found with the statement “all cost are completely justified” were, BMW Audi and Mercedes customers disagreed to the same .

52
4.4 Factor Analysis
KMO and Bartlett's Test
Kaiser-Meyer-Olkin Measure of Sampling Adequacy.
.652
Bartlett's Test of Sphericity
Approx. Chi-Square 83.313
Df 28
Sig. .000
Table 4.4.1
Hence all these standards indicate that the data is suitable for the factor analysis. For extracting factors we have employed principal component analysis. Rotation methods, Kaiser Normalization with equamax were also applied. As per the latent root criterion, only the factor having latent roots or Eigen values greater than considered significant; and all the factor with latent root less than considered insignificant and disregarded.
Communalities
Initial Extraction
It is difficult to maintain a luxury car.
1.000 .525
luxury car owners only prefer company authorized service centres.
1.000 .437
After sales services affects one's brand choice.
1.000 .278
53
A company has enough number of service centres to satisfy Their every customer.
1.000 .562
Company always provides on-road assists.
1.000 .620
All service costs are completely justified.
1.000 .553
Company always notifies when your car service is due.
1.000 .486
Service duration is appropriate.
1.000 .428
Table 4.4.2
Extraction Method: Principal Component Analysis.
Total Variance Explained
Component Initial Eigenvalues Extraction Sums of Squared Loadings
Total % of Variance
Cumulative %
Total % of Variance
1 2.315 28.933 28.933 2.315 28.933
2 1.574 19.676 48.609 1.574 19.676
3 .925 11.560 60.169
4 .857 10.711 70.880
54
5 .748 9.355 80.235
6 .681 8.518 88.753
7 .484 6.047 94.799
8 .416 5.201 100.000
Table 4.4.3
Total Variance Explained
Component Extraction Sums of Squared Loadings
Rotation Sums of Squared Loadings
Cumulative % Total % of Variance Cumulative %
1 28.933 2.248 28.103 28.103
2 48.609 1.640 20.506 48.609
3
4
5
Table 4.4.4
Component Matrixa
Component
1 2
It is difficult to maintain a luxury car.
-.465 .555
luxury car owners only prefer company authorized service centres.
.308 .585
55
After sales services affects one's brand choice.
-.060 .524
A company has enough number of service centres to satisfy Their every customer.
.749 -.037
Company always provides on-road assists.
.785 .059
All service costs are completely justified.
.368 -.646
Company always notifies when your car service is due.
.527 .456
Service duration is appropriate.
.639 .139
Table 4.4.5
Extraction Method: Principal Component Analysis.
Large communalities in table indicate that a large number of variance has been accounted by the factor solution. They are bigger than 0.5 for all the questions. This is the indicator of suitability of the questions.
On the behalf of the data reduction in the following research the method applied is component matrix method in which various statements given a special trend for this. Component matrix has get with the help of SPSS.
Component Transformation Matrix
Component 1 2
1 .954 -.299
2 .299 .954

56
Table 4.4.6
Rotated Component Matrixa
Component
1 2
It is difficult to maintain a luxury car.
-.278 .669
luxury car owners only prefer company authorized service centres.
.469 .466
After sales services affects one's brand choice.
.099 .518
A company has enough number of service centres to satisfy Their every customer.
.703 -.259
Company always provides on-road assists.
.767 -.179
All service costs are completely justified.
.158 -.726
Company always notifies when your car service is due.
.640 .277
Service duration is appropriate.
.651 -.059
Table 4.4.7

57
Extraction Method: Principal Component Analysis.
Factors Extracted
S.No Factor Name Name of Dimension Factor Factor Loading
1 F1 Customer Care S4 0.703
S5 0.767
S8 0.651
2 F2 Price Predicament S1 0.669
S6 -0.726
Table 4.4.8
There are 2 factors which are extracted from the analysis and are named the following customer care and price predicament which were clubbed from analyzed statements.
Mean of 1st factor customer care is 3.45 and mean of 2nd factor price predicament is 3.015. So we can say that Customer care is the most important factor extracted from the analysis.

58
Representation of different responses.
S.No Questions Responses
1.What luxury brands car
you own?
BMW Audi Mercedes JLR Others
25.61% 24.39% 21.95% 8.54% 19.51%
2.Which company provides
you the most efficient after sale service?
BMW Audi Mercedes JLR Others
13.16% 26.32% 36.84% 6.58% 17.11%
3.Which company provides you the best quality after
sale services?
BMW Audi Mercedes JLR Others
21.52% 30.38% 29.11% 7.59% 11.39%
4.Is it difficult to maintain a
luxury car.
Strongly Disagree
Disagree Neutral AgreeStrongly
Agree
4.29% 18.57% 30% 32.86% 14.29%
5.Luxury car owners only
prefer company authorized service centre
Strongly Disagree
Disagree Neutral AgreeStrongly
Agree
1.43% 14.29% 11.53% 51.43% 21.43%
6.After sales service affects
once brand choice
Strongly Disagree
Disagree Neutral AgreeStrongly
Agree
2.86% 10% 31.43% 38.57% 17.14%
7.A company has enough no
of service centers.
Strongly Disagree
Disagree Neutral AgreeStrongly
Agree
2.86% 17.14% 24.29% 44.29% 11.45%
8.Company always provides
on road assistance.
Strongly Disagree
Disagree Neutral AgreeStrongly
Agree
4.29% 18.57% 34.29% 32.286% 10%
59
9.All service costs are completely justifies.
Strongly Disagree
Disagree Neutral AgreeStrongly
Agree
20% 24.29% 25.71% 24.29% 5.71%
10.Company always notifies when your car service is
due
Strongly Disagree
Disagree Neutral AgreeStrongly
Agree
4.29% 5.71% 22.86% 42.86% 24.29%
11.Is the service duration is
appropriate.
Strongly Disagree
Disagree Neutral AgreeStrongly
Agree
2.86% 7.14% 305 44.29% 15.71%
Table 4.5
There were various types of luxury car owners found during the collection of primary
data, some were very oriented towards price as they had bought their first luxury car and
were concerned about the budget part. On the other hand some were who primarily focus
on the quality and time as they had luxury cars for quite some time and money was not an
issue to them.
There are almost all types of luxury cars sold in the market buy the common brands were
Audi , BMW ,and Mercedes. All of them are known for their built quality but still
Mercedes had an edge over others when asked about the efficiency of after sales. On the
other hand Audi took over when asked about the quality of the same. As we have noticed
earlier that customers had different experiences and had different perception so fair
number of luxury car owners said they find it difficult to maintain a luxury car, but only
prefer authorized service centers. After sale was a factor known which affected the brand
choice of the customer .the research was mainly conducted in Delhi so it was found that
the company had enough no of service stations. it was surprising to know that many
customers did not know that their company provides on road assist .the cost of service is
not justified was said by major number of owners . at last when asked about the service
duration then majority of customers were satisfied with the same.
60
Chapter 5: Findings
With this research one of the major findings is that most of the people in Delhi owns
BMW (25%) , Audi (24%) , Mercedes (22%) , and then JLR (8%) .
Mercedes is the company which provides most cost efficient after sale service and
Audi tops the list when it comes to best quality of after sale service.
There is a huge no of customers of luxury cars but they have an perception that it is
difficult to maintain a luxury cars, but they also have a mind set of only getting their
cars serviced at the authorized service center. Even the choice of the customer is
influenced due to same.
The maximum numbers of customers are satisfied with the number of service centers
for their car. This is the situation when we talk of Delhi NCR area.
When we talk of on road assists, then the customers are somewhat not aware about
the same . as they don’t emphasize on the same till the time they don’t have a
requirement.
The customers are fine with the amount they are paying for the services in maximum
no of cases.
The customers are happy with the notifications they receive from the company and
also satisfied with the time taken for their services.
Cost of services , location of service centers , are not the major factors which
influence the customer while getting their car serviced ,but on the other hand
authorization , security , duration of service , communication and quality of service
play a vital role in getting their car services.

61
Chapter 6: Recommendation & Conclusion
Companies like JLR and BMW need to reposition themselves in customers head
as around, only 6% respondents feel that JLR provides the most cost efficient,
after sales service.
BMW and JLR need to start up building up a better quality management system
regarding after sales service as only around 6% respondents feel that JLR
provides best quality of after sales services.
Companies to change perception about the maintained of luxury cars as 46% of
respondents agree with the statement that it is difficult to maintain a luxury car
Companies need to try and build up more service centers as 20% respondents
disagrees with the statement that there’re enough service stations in there city.
Around 22 % of respondents still feel that companies doesn’t provide an efficient
on-road assist. So companies need to start focusing on the segment of on road
assistance.
As cost is one of the major reason owners consider while going for the service,
companies need to start justifying all cost related details to the customer.
As cost of service is a factor influencing the most among other factors companies
need to try and reduce or maintain a par service cost. So that a customer won’t
feel the burden of getting it over budget.
Most of the respondents feel that their expensive luxurious cars should be in a
secured facility. So, companies need to provide a safer environment.
Around 40% of respondents feel that the duration of getting their car serviced is a
key factor affecting their decisions companies need to try and provide more
effective and efficient services to their customers.
As communication, authorization and location of service centers are other major
factors affecting customer’s decision considering car service companies need to
build up a strong communication bridge towards their customers.

62
Conclusion
As Delhi is becoming a hub of luxury car companies, which is provide a growing market
and after sales servicing being one the most crucial factors coming in customers head
while going for a luxury cars it makes really important for companies to cope up with the
customers demand not only the product segment but also in after sales services. &
considering today’s position to cope up with the customer’s needs of after sales service,
and mind state of customer going for the luxury cars segment and the increasing numbers
of luxury cars owners Companies are taking some enduring initiatives to match up a
secured level keeping after sales services in consideration but there are various factors
which companies can look over to increase their efficiency and effectiveness in the case
of after sales service.i.e., that there is always a chance of improvement. So, we can
conclude that luxury car market in Delhi is ready in the perspective of year 2020.

63
References
.Armistead,c and Clark , G (1992). Customer service and support :implementing
effective strategies FT Books London.
Gallagher T. Mitchke M.D and Rogers,M.C (2005).Profiting from spare parts.
The McKinsey Quarterly,2March.
Heiko Dirlenbach.”Automotive-after-sales-service innovations-An Empiric
Analysis.”European Comission IST Project MYCAREVENT (NO.IST-004402)
CETIM Projects,2008.
John Sarkar and Meenakshi Verma “Back End Story”. Special Report. Economic
Times 29-july-2007.
Lele,M.M and Karmarkar, U.S.(1983).Good product support is smart
marketing.Harvard Business Review,Vol.61, pp 124-32.
Lewis,M.M,Portioli Staudacher,A. and Slack,N.(2004).Beyond products and
services:oppurtunities and threats in servitization.Proceedings of the IMS
International forum 2004, vol.1,pp.162-70.
Loomba,A.P.S (1998).Product distribution and service support stratergy
linkages:en empirical investigation. International journal Of Physical Distribution
And Logistics Management,vol.28,no.2,pp.162-70.
Marc Lamure,Serge Hoffmann and Lori Flees.Auto Survey:improving after-sales
service helps retain customers. Shanghgai daily 2-april-2009.
Olajide Omotuyi Ehinlanwo and Mohamed Zairi.”Best practice in the car after
sales service:an empirical study of Ford,Toyota,Nissan and Fiat in Germany.”
Business Process Management Journal (vol.2. issue3),1995.
Saccani,N,e.t,al(2006). The role and performance management of after sales in
the durable consumer goods industries;an empirical study.Journal Of Productivity
and Performance Management, vol.55 no. ¾ pp. 259-283.

64
Appendix
Questionnaire
1.What luxury brands car you own ?
BMW Audi Mercedes JLR Others
2.Which company provides the most cost efficient after sale service?
BMW Audi Mercedes JLR Others
3.Which company provides the best quality after sale service?
BMW Audi Mercedes JLR Others
4.Do you agree or disagree with the following statements.
S.No
Statements Strongly Agree
Agree Neutral Disagree
Strongly Disagree
1
It is difficult to maintain a luxury car .
2 Luxury car owners only prefer company authorized service

65
centers.
3 After sale services affects ones brand choice.
4 A company has enough no of service centers to satisfy their customers.
5 Company always provides on road assistance.
6 All service costs are completely justified
7 Company always notifies when your car service is dew
8 Service duration is appropriate.
5..Rate the following factors influencing your car service .
Cost of service Security Duration of Service Location of service centre Communication Quality Authorization

66
6.Contact information:
First Name Last Name Phone No. E-mail Id.