artificial turf field investigation in · pdf fileartificial turf field investigation in...
TRANSCRIPT

Artificial Turf Field Investigation in Connecticut Final Report
Prepared By
Nancy Simcox, MS Anne Bracker, MPH, CIH
John Meyer, MD, MPH
Section of Occupational and Environmental Medicine University of Connecticut Heath Center
July 27, 2010

2
TABLE OF CONTENTS
1.0 Executive Summary………………………………………………………………….
4
2.0 Introduction…………………………………………………………………………… 2.1 Purpose 2.2 Objectives 2.3 Sampling Plan 2.4 Connecticut Academy of Science and Engineering
5
3.0 Methods and Results……………………………………………………………….. 3.1 Field Recruitment ………………………………………………………….. 3.2 Meteorological Sampling…………………………………………………..
3.3. Bulk Sampling……………………………………………………………… 3.3.1 VOCs 3.3.2 Targeted Rubber-Related SVOCs 3.3.3 Lead 3.4 Air Monitoring……………………………………………………………….
3.4.1 VOCs 3.4.2 SVOCs 3.4.2.1. Polyaromatic Hydrocarbons (PAHs) 3.4.2.2. Miscellaneous SVOCs associated with air pollution 3.4.2.3 Targeted Rubber-Related SVOCs 3.4.3 Nitrosamines 3.4.4. PM10
7 7 7 9 13
4.0 Summary Findings…………………………………………………………………..
31
5.0 Limitations…………………………………………………………………………… 37 6.0 Connecticut Academy of Science and Engineering Review (CASE)…………. 38 7.0 Appendices (available upon request)…………………………………………….. A Sampling Map B Meteorological Report C Crumb Rubber Head Space VOC WOHL Reports D Crumb Rubber Head Space Target SVOCs WOHL Reports E Crumb Rubber Bulk Samples Lead EHL Reports F Air VOC WOHL Reports G Special Items Head Space WOHL Reports H Air PAHs and Miscellaneous SVOCs EPA Method TO-13A WOHL Reports I Air Targeted SVOCs NIOSH 2550 WOHL Reports J Air Nitrosamine WOHL Reports K Air PM10 WOHL Reports
41

3
ACKNOWLEDGMENTS
We would like to extend a special appreciation to Tara Kurland, a masters student in Environmental Science and Policy at Clark University, who completed her summer internship with us on this project. We especially thank her for contributing to all aspects of the field sampling. We also thank Paula Schenck, the University of Connecticut Health Center, for careful review of this report. Funding for this project was provided by the Connecticut Department of Environmental Protection.

4
1.0 Executive Summary The primary purpose of this project was to characterize the concentrations of volatile organic compounds (VOCs), semi-volatile organic compounds (SVOCs), rubber-related chemicals (e.g. benzothiazole), and particulate matter less than 10 micron (PM10 ) and its constituents in ambient air at selected crumb rubber fields in Connecticut under conditions of active field use. This project employed a cross-sectional environmental sampling strategy of synthetic crumb rubber turf fields to capture a range of chemical exposures during the summer season when ambient air temperatures are above 75-80oF. Three general types of fields were targeted: outdoor crumb rubber fields, indoor facilities with crumb rubber turf, and an outdoor grass field in a suburban area. Sampling goals were to collect air samples on old and new turf fields during active field use and to collect air samples at background sites upwind and off of each field. A special focus of the design study included personal air sampling of many of the chemicals reported in previous studies (e.g. VOCs and benzothiazole), and other chemicals of potential concern, such as a volatile nitrosamine reported to be part of rubber manufacture. The sampling strategy also included the collection of area air samples for chemicals at different heights on the turf to assess a vertical profile of release. These air samples were collected in areas on the turf field near active play and areas on the turf away from active play. Because crumb rubber includes some amount of dusts and small particles, particulate matter air monitoring was incorporated into the stationary sampling plan (using sampling at a single height only). Bulk samples of turf grass and crumb rubber were also collected, and meteorological data (e.g. air direction, wind speed and ambient air temperature) were recorded. Industrial hygienists from the Section of Occupational and Environmental Medicine at the University of Connecticut Health Center (OEM UCHC) conducted the field sampling and managed the analytical components of this exposure investigation. This report summarizes the data collected by OEM UCHC. This report identifies and measures chemicals across several synthetic crumb rubber turf fields and background locations. The measurements collected from background locations are necessary to better understand the data because many of these chemicals are present in ambient air as a result of general air pollution. CT DEP recruited six fields: 4 outdoor turf fields (Fields A-D), 1 indoor turf field (Field K) and 1 outdoor suburban grass area (Field L). Six additional fields were recruited to collect crumb rubber bulk samples only (Fields E-J). Air sampling occurred during July 2009 on crumb rubber fields with polyethylene fibers that were both new (<2 years) and old (>3years). Algorithms were developed to identify chemicals possibly related to turf. Of the 60 VOCs tested in air, 4 VOCs appear to be associated with turf. Of 22 PAHs, 6 were found in the air on the turf at 2 fold greater concentrations than in background locations on at least two fields. Of the five targeted SVOCs, benzothiazole and butylated hydroxytoluene were the only chemicals detected in the personal and area air samples from outdoor turf fields ranging from <80-1200 ng/m3 and <80-130 ng/m3, respectively. Nitrosamine air levels were below reporting levels. PM10 air concentrations were greater in background locations than on the turf at all fields with the exception of Field B. However, the PM10 air concentration on turf at Field B, 5.89 ug/m3, was within the range of other PM10 background concentrations. All of the composite samples of turf fibers and crumb rubber were below the level EPA considers as presenting a “soil-lead hazard” in play areas (400ppm). The airborne concentrations of VOCs, targeted SVOCs (e.g. benzothiazole) and miscellaneous SVOCs were highest at the indoor field. These data were collected from only one indoor facility. Higher concentrations of these chemicals at the indoor field likely reflects the lack of air movement relative to outdoor fields. In addition, the air in the indoor field was not influenced by outdoor factors that may degrade and off-gas chemicals, such as sunlight, rain, and other weather conditions. Furthermore, potential point sources were identified in the facility, (electric carts, portable chargers, and maintenance supplies) and the indoor facility did not have its exhaust system operating on the day samples were collected. More research is needed to better understand chemical exposures in indoor facilities.
5
2.0 Introduction 2.1 Purpose Crumb rubber fields have been installed or are being proposed in many towns throughout Connecticut, and elsewhere in the United States. Crumb rubber consists of recycled, chipped/pulverized, used automobile tires. The tire crumbs are roughly the size of grains of course sand and generally are spread two to three inches thick over the field surface and packed between ribbons of green plastic used to simulate grass. Crumb rubber granules may release a variety of chemicals typical in rubber, including polycyclic aromatic hydrocarbons (PAHs) and volatile organic chemicals (VOCs). In addition, crumb rubber includes some amount of dusts and small particles, which may be further increased by mechanical abrasion and wear that comes with use of the fields [1]. Health questions continue to arise because exposures and risks to playing on these fields have not been fully characterized [2, 3, 4]. The primary purpose of this project was to characterize the concentrations of volatile organic compounds (VOCs), semi-volatile organic compounds (SVOCs), rubber-related chemicals (e.g. benzothiazole), and particulate matter less than 10 micron concentrations (PM10 ) and its constituents in ambient air at selected crumb rubber fields in Connecticut under conditions of active field use. Air monitoring data is needed to characterize exposure patterns of targeted compounds in the breathing zone of children using artificial turf fields. In addition, there is insufficient data on how relevant variables, such as weather conditions, age of field, nature of sporting activities and type of infill, affect exposure to chemical constituents and particulate matter. In Connecticut, we know of at least 85 crumb rubber fields already in use, and another 30 that have been proposed or are being constructed. Air data collected at selected crumb rubber fields are needed to begin the characterization of potential exposures that could be used in a companion risk assessment of the data generated from this work. Data from the Connecticut Agricultural Experiment Station (CAES) laboratory head space analyses on manufacturers’ crumb rubber infill were used to guide aspects of the design of this field investigation [5]. We also established collaborative relationships with those doing similar research in New Jersey, New York State, New York City and U.S. EPA to learn of parallel activities and results as this project proceeded [6, 7]. For example, a recent study conducted in New York found that rubber dust was not found in the respirable range, and therefore, PM10 was selected for this study [6]. 2.2 Field Investigation Objectives This exposure characterization had the following objectives.
1. Collect personal measurements in the breathing zone of the target population - young children who play on crumb rubber athletic fields.
2. Characterize the concentrations of VOCs, SVOCs, and particulate matter (PM) (and constituents on PM) in air at selected crumb rubber fields in Connecticut under conditions involving active field use in warm weather.
3. Assess airborne concentrations of the targeted chemicals and particulates in areas surrounding and away from the crumb rubber fields. The collection of background samples is a key component as exposure to airborne rubber particles and component gases is not unique to turf fields.
2.3 Sampling Plan Industrial hygienists from the Section of Occupational and Environmental Medicine at the University of Connecticut Health Center (OEM UCHC) conducted the field sampling and managed the analytical components of this exposure investigation. OEM UCHC provides research, educational programs and training, industrial hygiene consulting, prevention guidance, risk communication and clinical care for occupational and environmental illnesses and problems. Specifically, OEM UCHC personnel performed the collection of air samples, contracted with laboratories for analyses, provided quality control /quality assurance, and reviewed and compiled the data. OEM UCHC sub-contracted laboratory analyses to three AIHA accredited laboratories: Wisconsin Occupational Health Laboratory (WOHL), the Wisconsin State Laboratory of Hygiene (WSLH) and the ESIS Environmental Health Laboratory (EHL) in Cromwell, Connecticut. WOHL is a full service industrial hygiene chemistry laboratory that is part of the Wisconsin State Laboratory of Hygiene (WSLH) at the University of Wisconsin-Madison. WSLH analyzed air samples for VOCs, SVOCs and PM10. WOHL analyzed bulk crumb rubber head space for VOCs and targeted SVOCs (e.g. benzothiazole), and air samples for nitrosamines and targeted SVOCs. Additional bulk

6
samples were analyzed for lead by the ESIS Environmental Health Laboratory (EHL). The EHL has been accredited by the American Industrial Hygiene Association (AIHA) for both industrial hygiene and environmental lead. This report summarizes the data collected by OEM UCHC. This project employed a cross-sectional environmental sampling strategy of synthetic crumb rubber turf fields to capture a range of chemical exposures during the summer season when ambient air temperatures are above 75-80oF. Three general types of sites were targeted: outdoor crumb rubber fields, indoor facilities with crumb rubber turf, and an outdoor grass field in a suburban area. Sampling goals were to collect air samples on old and new turf fields during active field use and to collect air samples at an upwind site of each field. A special focus of the design included personal air sampling of many of the chemicals reported in previous studies (e.g. VOCs and benzothiazole), and other chemicals of potential concern, such as a nitrosamine. The sampling strategy also included the collection of area air samples for chemicals at different heights on the turf to assess a vertical profile of release. These air samples were collected in areas on the turf field near active play and areas on the turf away from active play. Because crumb rubber includes some amount of dusts and small particles, particulate matter air monitoring was incorporated into the stationary sampling plan (using sampling at a single height only). Bulk samples of turf grass and crumb rubber were also collected, and meteorological data (e.g. air direction, wind speed and ambient air temperature) were recorded. Bulk Samples: Composite bulk samples of green artificial turf fibers and composite bulk samples of crumb rubber were collected from 5 locations on each study field. These samples were analyzed for lead by EHL in Connecticut. Additional bulk samples of crumb rubber were collected at eleven fields. These samples were analyzed for targeted SVOCs, VOCs and other chemicals in a 340 milliliter large volume sample headspace unit (LVSH) by WOHL. CAES collected and analyzed samples of crumb rubber material supplied by several manufacturers [5]. Their crumb rubber samples included material from only two of our outdoor fields (A and D). These two crumb rubber fields were manufactured by two different companies. The results are difficult to compare between the two laboratories (WOHL and CAES) because they used different analytical methods. Personal Sampling: Study team members from the Connecticut Department of Public Health (CT DPH), Connecticut Department of Environmental Protection (CT DEP), and OEM-UCHC simulated a soccer game for the collection of the personal airborne chemicals. Active play among 3-4 players consisted of running and kicking the ball on the turf field, one on one soccer drills and “keep away” soccer games. Duration of play was two hours with one break. Personal air samples were collected at waist height, approximately 3-feet, with sampling equipment worn by 3 players during active play on the field. Personal measurements for nitrosamine, benzothiazole, and VOC were collected from players at each field. Two personal samples were collected for each of the types of measurements. Evacuated 1.4 liter SUMMA canisters were worn by players at hip height to collect VOC samples. Personal sampling pumps fit with absorptive media were worn by players at hip height to collect samples for benzothiazole, nitrosamine, 4-Tert (octyl) phenol, 2-mercaptobenzothiazole, Butylated hydroxyanisole (BHA) and Butylated hydroxytoluene (BHT). Area Sampling: Area samples were collected for 2 hours to measure VOCs, SVOCs, benzothiazole, and ambient PM10 concentrations during active play. Samplers were located at various heights on the field in the immediate vicinity of the simulated soccer game and in an off-turf upwind area to represent background locations. Additional background samples were collected in one suburban community location (non-turf grass field) to help put the field-related results into a larger exposure context. VOCs were measured with 6-liter SUMMA canisters according to EPA Method TO-15 [8]. SVOCs in ambient air were measured with PS-1 Samplers according to EPA Method TO-13A [9]. An additional day of sampling for 6 hours was conducted with the PS-1 Samplers on one field without active play. Specific chemicals (e.g. benzothiazole and nitrosamines) were separately measured using sampling pumps and sorptive media to trap those chemicals according to NIOSH methods [10, 11]. PM10 concentrations were measured using Harvard Impactors (Air Diagnostics and Engineering, Inc., Harrison, ME) [12, 13]. OEM-UCHC collected all samples and shipped sampling media to WOHL for analysis. Table 1 provides a general description of the targeted analytes, air sampling and analytical methods for each set of analytes. Appendix A provides a sampling map.

7
3.0 Methods and Results 3.1 Field Recruitment CT DEP recruited six fields: 4 outdoor turf fields (Fields A-D), 1 indoor turf field (Field K) and 1 outdoor suburban grass area (Field L). Six additional fields were recruited to collect crumb rubber bulk samples only (Fields E-J). As shown in Table 2, air sampling occurred during July 2009 on crumb rubber fields with polyethylene fibers that were both new (<2 years) and old (>3years). Fields B, C, and J contained silica sand in the crumb rubber. Sampling dates were chosen to coordinate several factors: sunny and no wind days, rental sampling equipment costs/availability, field accessibility due to school summer programs, and staff availability. Table 2 provides the total number of air samples collected at each field. Fields A-B and K were in located in rural areas and fields C, D and L were in suburban communities with nearby roads with high traffic volume. Field D was also near an interstate highway. Field K, the indoor turf facility, had four exhaust fans at each end of the building. These fans were not operating during sampling. There was an equipment room located inside the facility containing small electric motorized carts (these carts were driven out of the facility minutes before the sampling began). In addition, the room had a portable charger, an ice machine, maintenance supplies (e.g. cans of paints) and other gym equipment. 3.2 Meteorological Sampling Meteorological conditions for each sampling day were collected by a subcontactor (Air Quality Research and Logistics, LLC) with a Davis Vantage Pro 2 weather station by Air Quality Research and Logistics, Inc. Meteorological parameters included: wind speed, wind direction and air temperature at different heights (near ground level and 3 feet above the ground). Thermometers were enclosed in naturally aspirated radiation shields (Davis Part. No. 7714). Measurement of continuous (15 minute average) ambient air temperature, wind direction and speed were collected. Table 3 provides a summary of the meteorological conditions at each field. Appendix B provides a report by Air Quality Research and Logistics, Inc. On July 28, 2009, meteorological data was not collected during the 6 hour sampling at Field D. Temperature and wind direction data were obtained from Weather Underground (www.wunderground.com). Table 1. Target Analytes, Air Sampling Equipment and Analytical Methods
Compounds Type N Sampling Equipment and Media
Analytical Method
Volatile Organic Compounds (VOCs)
Personal
Area
10 16
1.4 L SUMMA 6.0 L SUMMA
EPA TO-15 (GC/MS)
General Semi-Volatile Organic Compounds (SVOCs) scan
Area 12
PS-1 Sampler PUF and XAD-2
EPA TO-13A (modified)
GC/MS
Targeted SVOCs Benzothiazole 2-mercaptobenzothiazole 4-Tert (octyl)phenol Butylated hydroxyanisole Butylated hydroxytoluene
Personal
Area
10 35
Personal Pump
Gilair®, SKC Airlite® XAD-2
37mm, 2 μm PTFE pre-filter
WOHL Method LC-100
(based upon NIOSH 2550)
Nitrosamines Personal Area
10 23
Personal Pump Gilair®, SKC Airlite®
Thermosorb/NTM
WOHL Method LC-96 (based upon NIOSH
2522)
Particulate Matter (PM10) Area 12 MS&T Area Sampler 20 L sampling pump 37 mm Teflon Filter
2 μm pore size
CFR Title 40 Part 50 (Appendix L) WP001-03
Gravimetric Analysis

8
Table 2. Total number of air samples collected at each field Compounds/ Methods
Location N Fields A B C D K L
Sampling Comments
VOCs EPA TO-15
Personal On Turf Area Background Area
10 10 6
2 2 1
221
2 2 1
2 2 1
2 2 1
0 0 1
At Field A, no data at 6” on turf AFAP
At Field C, pesticide application occurred adjacent to turf field
SVOCs scan EPA TO-13A
On Turf Area Background Area
6 6
1 1
10
1 0
2 2
1 1
0 2
At Fields B, C and L, no data at background locations
Targeted SVOCs NIOSH 2550 (modified)
Personal On Turf Area Background Area Field Blanks Field Spikes
10 23 12 7 6
2 4 2 1 1
24212
2 4 2 1 0
2 6 2 2 1
2 4 2 1 2
0 1 2 1 0
At Field D during 6 hour sampling, no data at 6” or 3’ on turf
Nitrosamines NIOSH 2522
Personal On Turf Area Background Area Field Blanks
10 12 11 7
2 2 2 1
2221
2 2 2 1
2 4 2 2
2 2 2 1
0 0 1 1
None
PM10 CFR Title 40 Part 50
On Turf Area Background Area Field Blanks
5 7 6
1 1 1
111
1 1 1
1 1 1
1 1 1
0 2 1
At Field A, no data at 3’ on turf or at background location
Table 3. Description of sampling fields and weather conditions during sampling day.
Field ID
Surface Age (location)
Sampling Date
Sampling Time of Day
Ambient Temperature On Surface (oFahrenheit)
3 inches 36 inches
Wind Speed(mph)
A 2 years (outdoor)
7/27/09 12:15-2:15pm 79-89 76-83 0-6
B 2 years (outdoor)
7/15/09 11:30-1:30pm 83-89 77-80 4-8
C 5 years (outdoor)
7/20/09 11:30-1:45pm 85-88 81-82 1-2
D 2 years (outdoor)
7/14/09 7/28/09
12:35-2:40pm 9:30-3:30pm
80-88
76-86 68-87*
1-3 2-8
K 3 years (indoor)
7/22/09 3:50-5:50pm
77-79 78-80 1-2
L Grass (outdoor)
7/12/09 11:48-1:48pm NA a 78-80b 1-3
* Temperature not measured directly. Information collected from Weather Underground. aNA=Not available. Temperature information was not collected 3 inches above the surface.

9
3.3 Bulk Samples Crumb Rubber Bulk Sampling Methods for Head Space Analysis: Crumb rubber bulk samples were collected from 11 different fields in June 2009. Table 3 provides the turf surface age for fields A-D, K. The turf surface age of the other six fields were: E (3 yrs), F (9 yrs), G (4 yrs), H (6 yrs), I (1 yr), and J (1 yr). Bulk samples were collected from 5 locations on each field (see Figure 1). At each location, crumb rubber was placed in a pre-cleaned glass jar, covered with foil and placed in a brown paper bag. Five samples per field were collected and shipped to WOHL (n=55).
20 paces
Figure 1. Sampling locations for bulk samples. 3.3.1 VOC Crumb Rubber Head Space Analysis: WOHL stored the samples in a refrigerator at 4oC. Bulk samples were analyzed for VOCs by WOHL method WG086.2, a method based on OSHA PV2120 for the analysis of volatile organic compounds (VOCs) in air. The samples were analyzed in a 340 milliliter large volume sample headspace unit (LVSH) as follows: The cleaned LVSH was heated to 70oC overnight and then brought to room temperature in a clean room. A 0.5 gram sample was placed in the LVSH and heated in an oven at 70oC for at least 1 hour. Immediately after the LVSH was removed from the oven, a 100 ml sample volume from the LVHS was cryofocused and injected in a gas chromatograph equipped with a mass selective detector and a RTX-624 capillary column. The following precautions were taken for the bulk crumb rubber VOC analysis: 1)bulk crumb rubber samples were stored in teflon lined screw capped jars and were opened only when removing sample for analysis;2) the 340mL LVSH were baked at 70oC overnight; and 3) one of the LVSH units was analyzed empty with each analytical run as a method blank, and any VOCs detected above reporting limit noted in the analytical report. VOC identification was conducted by the National Institute of Standards and Technology Library (NIST) search. Laboratory blanks during analyses were below reporting limits for most compounds. Carbon disulfide, silyls, and siloxane-containing VOCs are common contaminants of the analytical system. Therefore, trace amounts of these VOCs reported may not be components of the samples. Trace levels of carbon disulfide were detected in laboratory blanks. All siloxane-containing VOCs were below reporting limits (<20ppb) in laboratory blanks. Because some of the VOC compounds detected in bulk crumb rubber off gassing experiments are commonly used laboratory solvents, a laboratory background VOC sample was also collected in the walk-in cooler/sample storage area and analyzed. The following VOC compounds were reported in the laboratory background sample: 2-methyl-butane (31ppb), acetone (830ppb), benzene (18ppb), methylene chloride (1030ppb), methyl alcohol (790ppb), and pentane (52ppb).

10
The head space methodology used by WOHL differed from CAES in several areas. WOHL used smaller amount of crumb rubber (0.5 vs.1 gram), a larger volume head space unit, and different analytical parameters (e.g. cryogenically concentrates head space injection vs. direct injection technique). Appendix C provides a description of the analytical method used by WOHL. Results: Table 4 provides a list of VOCs identified in crumb rubber samples from the 11 different turf fields. The most commonly found VOCs (range of concentrations in parts per billion-ppbV) include: acetonitrile (60-300ppbV), methylene chloride (20-430ppbV), methyl alcohol (33-270ppbV), and methyl isobutyl ketone (21-150ppbV). Bulk crumb rubber from the newer fields (A, B and D) contained more than ten VOCs. Crumb rubber from other fields contained less than 5 VOCs. Carbon disulfide concentrations were found in the majority of field samples with estimates ranging from 41-141 ppb, and are considered a contaminant of the analytical system and not a turf related VOC. VOCs also found in the laboratory background sample are noted below with the asterisks “c”. Appendix C provides the WOHL analytical laboratory reports of the data. Table 4. VOCs identified in bulk crumb rubber head space at 11 fields. Volatile Organic Compounds (VOCs) Fields A-D, K Fields E-J 1,1,2-Trichloro-1,2,2-trifluoroethane A 2-methyl-Butanec A, B, C 3-methyl-Pentane A a, B, Db Acetonec A a, B a Ia Acetonitrile A, B, C, D E Benzenec A, D Carbon Tetrachloride A Cyclopentane, methyl- A, B, D Ethanol A Ethyl Benzene D Hexane B, C, D Isopropyl Alcohol A, B Methyl Alcoholc A, B, C, D, K E Methylene Chloridec A, B, C, D E, F, G, H, I Methyl Isobutyl Ketone A, B, D E, G, H, I Pentanec A Styrene A, B, D Toluene A, B, D Reporting limit is <10 or 20 ppbV depending on the chemical. aIndicates that the area summed includes an unresolved compound. bIndicates that there is some question as to identity. cCompound was also detected in the laboratory background sample.

11
3.3.2 Targeted SVOCs Bulk Crumb Rubber Head Space Analysis: In the crumb rubber bulk samples, five targeted SVOCs were analyzed: benzoathiazole, 2-mercaptobenzothiazole, butylated hydroxyanisole (BHA), butylated hydroxytoluene (BHT), and 4-tert-(octyl)-phenol). Four chemicals, 2-mercaptobenzothiazole, BHA, BHT, and 4-tert-(octyl)-phenol) were added to the list of targeted SVOCs as a result of the findings reported by CAES in 2009. For targeted SVOCs, a Supelco Adsorbent Tube Injector System (ATIS) was utilized to thermally extract the bulk rubber infill samples. The off-gassed SVOCs were loaded onto sampling media and analyzed according to the various analytical methods used in the study. For benzothiazole/4-tert-(octyl)-phenol, the method is based upon National Institute for Occupational Safety and health (NIOSH) Method Number 2550 (Modified). In summary, SVOCs off gassed from bulk infill material collected on XAD filter air sampling devices were desorbed separately with 10 minutes of sonication performed 3 times with 3mL of methanol each. The combined methanol fractions were evaporated to approximately 0.5mL with nitrogen, and brought to a final volume of 1.0mL with methanol. Extracts were analyzed by reversed phase high-performance liquid chromatography employing a 0.1% formic acid:methanol linear gradient program. Detection was achieved by triple quadrupole mass spectrometry using multiple reaction monitoring (MRM). SVOCs Bulk Crumb Rubber Results: Table 5 provides a list of SVOCs identified in crumb rubber samples from the 11 different turf field fields. Appendix D provides WOHL laboratory analytical reports. Table 5. Identification of targeted SVOCs in bulk crumb rubber head space samples collected at 11 fields. Semi-Volatile Organic Compounds (SVOCs)
Study Turf Fields A-K
Additional Turf Fields E -J
Benzothiazole A, B, C, D and K E, G, J
2-mercaptobenzothiazole None None 4-tert-(octyl)-phenol A, B, C, D and K E, F, G, H, I, J Butylated hydroxyanisole (BHA)
None None
Butylated hydroxytoluene (BHT)
A, K G
Nitrosamine None None

12
3.3.3 Lead Bulk Sampling Method: Composite bulk samples of green artificial turf fibers and composite bulk samples of crumb rubber were collected from 5 locations on each field (Figure 1) at study fields only. The bulk samples were placed in zip lock bags. Because lead was detected in the composite bulk sample from Field D, four additional crumb rubber composite bulk samples (two at 20 paces and two at 40 paces) and one additional composite fiber bulk sample were collected from Field D. The bulk samples were analyzed for environmental lead by the ESIS Environmental Health Laboratory (EHL) in Cromwell, Connecticut. The analytical method used by the laboratory was Modified EPA-SW-846-3050/ ICP, Modified OSHA ID 125. The sampling and analytical methods are similar to the methods used by New York City Department of Parks and Recreation during their study of 103 crumb rubber fields [14]. Results: Table 6 show that all of the composite samples were below the level EPA considers as presenting a “soil-lead hazard” in play areas (400ppm). This definition, however, applies to residential buildings and to soil rather than other surfaces [15]. Appendix E provides the EHL analytical laboratory reports. Table 6. Concentrations of microgram lead/gram material (µg/g) in fibers and crumb rubber at study field fields. Field
Fiber Concentration (µg/g)
Crumb Rubber Concentration (µg/g)
A < 60.1 <71.4 B <59.0 <68.9 C <60.2 <70.4 D <59.0
<76.5 271 (20 paces)
<70.6 (20 paces) <78.5 (20 paces) <72.6 (40 paces) <78.7 (40 paces)
K <60.8 <72.1 Limit of Detection: 7.5 µg/sample Environmental Protection Agency (EPA) lead level for soil in children’s play areas: 400 ppm (µg/g)

13
3.4 Air Samples 3.4.1 Volatile Organic Compounds (VOCs) Personal Sampling: Personal air samples for VOCs were collected using evacuated 1.4 L silica-lined SUMMA Canisters with FSL QT MicroValve (Entech Instruments, California). Two study team members each wore a canister at waist-height during each sampling session. Each canister was placed inside a cotton “tool belt” and secured to a coated mesh waist belt with plastic ties. Study team members played soccer on the turf field with 2 other members for 120 minutes. One water/food break (5-10 minutes) was taken by the team members during the play period. At the beginning of each sampling event staff checked each canister’s gauge and confirmed that the pressure was at the level noted in the laboratory’s SOP. At the end of each sampling event, staff confirmed that the pressure gauge had reached “0”. The majority of samples collected air for at least 60 minutes or greater. Two samples collected air for less than 25 minutes (collected at indoor field, Field K). Samples were sent to the WSLH laboratory (Madison, WI) by overnight mail on the day they were collected. All canisters were received by WSLH the next day. Ten samples were collected, two from each turf field field (Fields A, B, C, D, and K). All of the 1.4L cans were pressure checked upon return to the lab and prior to analysis. No data wereflagged to indicate problems. Newly purchased items, such as apron belt, coated mesh belt, and plastic twist ties were used to hold the sampling equipment in place during personal sampling. Because several VOCs, such as acrolein, were present in personal samples and not in any area samples, a request was made to WOHL to analyze these extra items to determine if they released any VOC emissions. Therefore, seven months after sampling, a cloth apron, plastic twist tie, sampling pump, segment of the coated mesh waist belt and the belt buckle were analyzed for VOCs in the head space unit. This sampling was done because these items were in close contact to the sampling inlet of the 1.4L canisters that team members wore. Area Sampling: Area air samples for VOCs were collected using evacuated 6 liter (L) silica-lined SUMMA Canisters with Nupro Valve (Entech Instruments, California). Canisters were placed at 6 inches and at 3 feet above the turf in an area away from active play of study team members (AFAP) during each sampling session. Another canister was placed upwind of the turf field on grass at 3 feet above the ground. At Field L (grass field), the canister was placed at 3 feet. At the beginning of each sampling event staff checked each canister’s gauge and confirmed that the pressure was at the level noted in the laboratory’s SOP. At the end of each sampling event, staff confirmed that the pressure gauge had reached “0”. The majority of samples collected air for at least 60 minutes or greater. One sample collected air for less than 20 minutes (collected at outdoor background, Field K). Samples were sent to the WSLH (Madison, WI) by overnight mail on the day they were collected. All canisters were received by WSLH the next day. In total, sixteen samples were collected from the various fields. Samples were collected from the following fields: A (n=3), B (n=3), C (n=3), D (n=3), K (n=3) and L (n=1). The lab confirmed if the canister valve was closed and tight upon arrival. One 6 L canister valve was open upon arrival, and the sample was not analyzed (collected at Field A, 6 inches above the turf). Sample Preparation and Analysis: All canisters (1.4L and 6L) were calibrated with a mass flow controller to collect air samples for up to 120 minutes by the ESS Organics WSHL. A modified version of Compendium EPA Method TO-15 by GC/MS was used to measure ambient-level concentrations for 60 VOC analytes. Briefly, this method incorporates a multi-stage concentration process using an Entech 7100A Preconcentrator. This removes carbon dioxide, nitrogen, and water with a series of traps. The sample (500ml) is injected on a glass bead trap at a temperature of -150°C. The trap is then heated to 10°C and purged gently with helium to transfer the VOCs and the carbon dioxide to a second trap. The second trap, which contains Tenax(tm), is then cooled to 10°C, allowing the carbon dioxide to pass through the trap while retaining the VOCs. The second trap is heated and back-flushed with helium, sending the sample to the focusing trap, which is cooled to -160°C. The focusing trap is then rapidly heated to 60°C and the sample is injected onto the Rxi-lm s (Restek U.S., 110 Benner Circle, Bellefonte, PA 16823), 60m capillary column and finally the mass spec detector. VOC concentrations were reported in ppbV and microgram per cubic meter (μg/m3 ). Each analytical run included one method blank per batch of samples. If an analyte in the method blank was greater than its limit of detection (LOD), the result for that analyte was flagged to indicate blank contamination. One set of samples contained acetone in the blank sample, and concentrations were corrected (samples collected at Field B). Duplicate analysis was performed on one sample per analytical batch. Duplicate analyses were always within 25% for each compound. Daily quality control checks were

14
performed using a second source standard. Analytes in the quality control/QC check standard were always within 30% of the corresponding calibration standards. Results: The EPA Method TO-15 is designed to scan for 60 VOCs, and the results provide a list of VOCs that are detected at least once on field or background locations. WSHL analytical laboratory reports for all 60 VOCs (in ppbV) in air per field are summarized in Appendix F. Tables 7-10 summarize the VOC concentrations in μg/m3 at Fields A-D, all outdoor turf fields. Table 11 shows the VOC concentrations from Field K (an indoor field), and Table 12 presents data for Field L (the non-turf grass background suburban site). Table 13 provides an additional list of VOCs in the personal, on-turf, and background samples that were tentatively identified through the use of the National Institute of Standards and Technology (NIST) library. VOC concentrations are shown in bold for each VOC analyte if concentrations were two times higher than the background concentration. Total Volatile Organic Compound (TVOC) value is the sum of the all the concentrations that were detectable, and is not an approximate concentration based on toluene response. The airborne VOC concentrations reported at Field C should be reviewed with caution (Table 9). During the first ten minutes of sampling at Field C, a pesticide mixture was applied to the grass field adjacent to the synthetic turf field. Study coordinator asked the applicator to stop the application. Unfortunately, air sampling had already begun in the background location near the grass field when the application occurred. Three different pesticides (Merit 75 WSP Insecticide, Drive 75 DF Herbicide, and Cross Check Insecticide) were applied to the perimeter of the field with a Perma Green Ride-on Spreader. Special Sampling Equipment Head Space Results: WOHL’s VOC head space analyses of the plastic ties, cloth apron bag, mesh waist belt and buckle are summarized in Appendix G. The cloth apron contained detectable levels of acetaldehyde, propanal, hexanal, nonanal, and octanal and trace levels of acrolein. The mesh belt contained acetaldehyde, 2-butenal, pentanal, hexanal, heptanal, and nonanal and trace levels of acrolein. A peak with NIST mass spectral library match for acrolein was detected in the cloth apron and mesh belt sample. These peaks were below the reporting limit of 20ppb and additional mass spectral peaks were present, including possible co-eluting compounds. Detectable levels of nonanal, decanal, and octanal were found in the plastic ties.

15
Table 7. Volatile Organic Compound (VOC) Concentrations in μg/m3 at Field A (personal and on-turf concentrations 2X higher than background are in bold)
VOC Concentration (μg/m3) Compound Name Personal Personal On Turf 3
AFAP 3 ft Background
3 ft 1,1,2,2-Tetrachloroethane <0.68 <0.68 <0.68 1.02 1,2,4-Trichlorobenzene <0.74 <0.74 <0.74 0.89 Acetone 52.17 33.20 12.33 12.33 Acrolein 1.95 1.40 <1.15 <1.15 Benzene <0.32 <0.32 <0.32 0.41 Bromoform <1.02 2.35 <1.022 <1.02 Carbon Tetrachloride <0.62 <0.62 <0.62 0.93 Chloromethane 1.57 1.55 1.45 1.33 Dichlorodifluoromethane 2.42 2.47 2.28 2.23 Ethyl Acetate 1.37 1.76 <0.36 0.61 Halocarbon 11 1.85 1.79 1.74 1.96 Hexane 24.61 8.79 <0.35 3.30 Methyl Ethyl Ketone 2.94 2.53 1.35 1.74 Methylene Chloride <0.34 <0.34 <0.34 0.69 Propene <0.17 0.38 <0.17 <0.17 Toluene 1.58 1.92 <0.38 0.75 Vinyl Acetate 1.23 1.13 <0.35 1.02 Total VOCs* 91.69 59.27 19.15 29.21 A tentative ID match for four compounds was made using the NIST Library in personal samples. No tentative ID matches were found in other areas. See Table 13. AFAP= away from active play of study team members. *Total VOCs is the sum of all the concentrations that were detectable (does not include values less than reporting limit).

16
Table 8. Volatile Organic Compound (VOC) Concentrations in μg/m3 at Field B. (personal and on-turf concentrations 2X higher than background are in bold) VOC Concentration (μg/m3)
Compound Name Personal Personal On Turf AFAP 6 inch
On Turf AFAP 3 ft
Background 3 ft
1,2,4-Trimethyl Benzene 1.32 2.16 <0.49 <0.49 <0.49 1,2-Dichloropropane <0.46 1.14 <0.46 <0.46 <0.46 1,3,5-Trimethyl Benzene <0.49 1.37 <0.49 <0.49 <0.49 1-Ethyl-4-Methyl Benzene <0.49 1.86 <0.49 <0.49 <0.49 Acetonea 13.75 34.74 3.93 3.65 4.01 Acrolein 1.58 3.66 <1.15 <1.15 <1.15 Benzene < 0.32 1.56 <0.32 <0.32 <0.32 Carbon Disulfide <0.31 0.47 <0.31 <0.31 <0.31 Carbon Tetrachloride 0.68 <0.68 0.75 0.81 0.75 Chlorobenzene <0.46 0.78 <0.46 <0.46 <0.46 Chloromethane 1.25 1.70 1.19 1.14 1.04 Cyclohexane 0.86 17.51 1.51 <0.34 <0.34 Dichlorodifluoromethane 2.42 2.13 2.52 2.57 2.42 Ethyl Acetate 1.30 11.87 <0.36 <0.36 <0.36 Ethylbenzene <0.43 4.29 <0.43 <0.43 <0.43 Halocarbon 11 1.46 1.40 1.51 1.51 1.51 Heptane <0.41 5.72 <0.41 <0.41 <0.41 Hexane <0.35 31.29 <0.35 <0.35 0.88 M/P-Xylene <0.87 10.83 <0.87 <0.87 <0.87 Methyl Ethyl Ketone <0.29 <0.23 1.41 1.21 1.30 Methyl Isobutyl Ketone 2.33 3.39 <2.04 <2.04 <2.04 Methylene Chloride <0.34 14.08 <0.34 <0.34 <0.34 O-Xylene <0.43 3.90 <0.43 <0.43 <0.43 Propene 0.5 0.89 <0.17 <0.17 <0.17 Styrene <0.43 1.96 <0.43 <0.43 <0.43 Tetrachloroethylene <0.67 3.29 <0.67 <0.67 <0.67 Tetrahydrofuran <1.48 2.47 <1.5 <1.5 <1.5 Toluene 1.54 52.66 0.87 0.79 0.87 Trichloroethylene <0.53 23.39 <0.53 <0.53 <0.53 Total VOCs* 28.99 240.51 13.69 11.68 12.78 A tentative ID match for 16 compounds was made using the NIST Library in personal samples. See Table 12. There was one tentative ID match in a background sample. See Table 13. AFAP= away from active play of study team members. aAcetone was detected in lab blank (1.5ppb) and all concentrations were corrected. *Total VOCs is the sum of all the concentrations that were detectable (does not include values less than reporting limit).

17
Table 9. Volatile Organic Compound (VOC) Concentrations in μg/m3 at Field C. (personal and on-turf concentrations 2X higher than background are in bold) VOC Concentration (μg/m3) Compound Name Personal Personal On Turf
6 inch AFAP On Turf
3 ft AFAP Background
3 ft 1,1,2,2-Tetrachloroethane <0.68 <0.68 <0.68 <0.68 1.09 1,1,2-Trichlorotrifluorethane <0.78 <0.78 <0.78 0.76 1.99 1,1-Dichloroethane <0.40 <0.40 <0.40 <0.40 0.80 1,1-Dichloroethene <0.40 <0.40 <0.40 <0.40 0.63 1,2-Dibromoethane <0.80 <0.80 <0.80 <0.80 1.84 1,3- Butadiene <0.22 <0.22 <0.22 <0.22 0.38 1,2-Dichlorobenzene <0.60 <0.60 <0.60 <0.60 1.37 1,3-Dichlorobenzene <0.60 <0.60 <0.60 <0.60 1.13 1,4-Dichlobenzene <0.60 <0.60 <0.60 <0.60 1.37 Acetone 30.83 26.08 23.71 10.67 11.14 Benzene 0.61 0.57 0.54 0.54 0.92 Bromoform 1.94 <1.02 <1.02 <1.02 1.74 Bromomethane <0.38 <0.38 <0.38 <0.38 0.69 Carbon Disulfide <0.31 0.50 <0.31 <0.31 0.62 Carbon Tetrachloride 0.68 <0.62 0.87 0.93 1.43 Chlorobenzene <0.49 <0.49 <0.49 <0.49 1.10 Chloroethane <0.26 <0.26 <0.26 <0.26 0.55 Chloromethane 0.70 0.63 1.00 1.06 1.02 Cis-1,3-Dichloropropene <0.45 <0.45 <0.45 <0.45 0.99 Cyclohexane 0.62 <0.34 <0.34 <0.34 <0.34 Dibromochloromethane <0.84 <0.84 <0.84 <0.84 1.85 Dichlorodifluoromethane 1.43 1.19 2.23 2.42 2.33 Ethyl Acetate <0.36 0.61 <0.36 <0.36 <0.36 Ethylbenzene <0.43 <0.43 <0.43 <0.43 1.21 Halocarbon 11 1.01 0.84 1.51 1.62 2.46 Heptane 0.49 <0.41 <0.41 <0.41 <0.41 Hexane 3.48 0.63 0.87 0.49 1.02 Methyl Ethyl Ketone 2.06 1.83 1.62 2.03 1.53 Methylene Chloride 1.20 <0.43 <0.43 <0.43 0.76 M/P-Xylene 1.56 <0.66 <0.66 <0.66 1.78 o-Xylene <0.43 <0.43 <0.43 <0.43 0.91 Propene 0.34 0.24 <0.17 <0.17 <0.17 Styrene <0.42 <0.42 <0.42 <0.42 0.94 Tetrachloroethylene <0.67 <0.67 <0.67 <0.67 1.27 Toluene 4.89 1.77 1.13 1.13 1.54 Trans-1,2-Dichloroethylene <0.39 <0.39 <0.39 <0.39 0.82 Vinyl Chloride <0.25 <0.25 <0.25 <0.25 0.48 Total VOCs* 51.84 34.89 33.48 21.66 48.43 A tentative ID match for 5 compounds was made using the NIST Library in personal samples. No tentative ID matches for compounds were found in other areas. See Table 13. AFAP= away from active play of study team members. *Total VOCs is the sum of all the concentrations that were detectable (does not include values less than reporting limit).

18
Table 10. Volatile Organic Compound (VOC) Concentrations in μg/m3 at Field D. (personal and on-turf concentrations 2X higher than background are in bold)
VOC Concentration (μg/m3) Compound Name Personal Personal On Turf
6 inch AFAP On Turf
3 ft AFAP Background
3 ft 1,2,4-Trimethyl Benzene 1.37 <0.49 <0.49 <0.49 <0.49 Acetone 28.45 23.71 5.69 6.64 7.35 Bromoform 1.02 13.29 1.02 1.02 1.02 Chloromethane 0.98 1.06 1.10 1.08 1.06 Dichlorodifluoromethane 2.23 2.33 2.42 2.47 2.47 Ethyl Acetate 1.15 1.22 <0.36 <0.36 <0.36 Halocarbon 11 1.40 1.40 1.40 1.46 1.46 Heptane 0.65 0.70 <0.41 <0.41 <0.41 Hexane 0.77 0.77 <0.35 <0.35 1.05 Methyl Ethyl Ketone 1.59 1.44 1.09 1.12 1.06 Methyl Isobutyl Ketone 2.66 2.29 <2.04 <2.04 <2.04 Propene 0.48 0.50 <0.17 <0.17 <0.17 Toluene 1.39 1.47 0.71 <0.38 <0.38 Total VOCs* 44.14 50.18 13.43 13.79 15.47 A tentative ID match for 6 compounds was made using the NIST Library in personal samples. There were tentative ID matches 3 feet above the turf and in the background area. See Table 13. AFAP= away from active play of study team members. *Total VOCs is the sum of all the concentrations that were detectable (does not include values less than reporting limit).

19
Table 11. Volatile Organic Compound (VOC) Concentrations in μg/m3 at Field K. (personal and on-turf concentrations 2X higher than background are in bold)
VOC Concentration (μg/m3) Compound Name Personal Personal On Turf
6 inch AFAP On Turf
3 ft AFAP Background
3 ft
1,1,-2Trichlorotrifluoroethane <0.54 <0.54
<0.54 <0.54 1.53 1,1,2-Trichloroethane <0.54 <0.54 <0.54 <0.54 0.76 1,2-Dichloropropane <0.45 <0.45 <0.45 <0.45 0.69 1,2,4-Trimethyl Benzene 1.28 2.11 <0.49 <0.49 <0.49 1,2-Dichloroethane 1.04 <0.40 <0.40 <0.40 0.68 1,3,5-Trimethyl Benzene <0.49 1.18 <0.49 <0.49 <0.49 1-Ethyl-4-Methyl Benzene <0.49 1.37 <0.49 <0.49 <0.49 Acetone 92.48 <1.19 17.01 12.33 9.25 Acrolein 3.66 3.89 <1.15 <1.15 <1.15 Benzene 1.15 1.18 <0.32 <0.32 0.64 Bromodichloromethane 0.62 <0.62 <0.66 <0.66 <0.66 Bromoform 34.75 <1.02 <1.02 <1.02 <1.02 Carbon Disulfide 0.87 0.84 0.90 0.90 <0.31 Carbon Tetrachloride <0.62 <0.62 <0.62 <0.62 1.30 Chloroform <0.48 <0.48 <0.48 <0.48 0.68 Chloromethane 1.57 1.45 1.17 1.23 1.21 Cyclohexane 10.30 7.21 0.82 0.82 <0.34 Dichlorodifluoromethane 3.02 2.87 2.77 2.87 2.72 Ethyl Acetate 10.07 11.87 <0.36 <0.36 <0.36 Ethylbenzene 4.77 4.77 1.00 1.04 <0.43 Halocarbon 11 2.07 1.96 1.90 2.02 2.41 Heptane 10.22 7.36 0.98 0.98 0.53 Hexane 11.25 10.90 7.38 7.38 9.4 M/P-Xylene 12.13 11.70 2.17 2.17 <0.87 Methyl Ethyl Ketone 44.15 44.15 2.09 2.00 1.83 Methyl Isobutyl Ketone 20.44 22.08 35.98 35.98 <0.29 Methylene Chloride 10.30 9.96 1.10 1.17 1.10 O-Xylene 3.42 4.03 0.87 0.91 <0.43 Propene 0.76 0.72 <0.17 <0.17 <0.17 Styrene 1.45 3.53 <0.43 <0.43 <0.43 Tetrachloroethylene 1.34 1.14 <0.67 <0.67 0.94 Tetrahydrofuran 3.53 3.24 <1.42 <1.42 <1.47 Toluene 135.4 127.88 2.78 2.82 1.09 Trichloroethylene 2.23 2.13 <0.53 <0.53 <0.53 Vinyl Acetate <0.35 2.95 <0.35 <0.35 <0.35 Total VOCs* 424.27 292.47 78.92 71.80 36.76 A tentative ID match for 10 compounds was made using the NIST Library in personal samples. There were tentative ID matches for 5 compounds on turf and no matches were found in the background area. See Table 13. aConcentration is an estimate. The value is above the upper calibration range. AFAP= away from active play of study team members. *Total VOCs is the sum of all the concentrations that were detectable (does not include values less than reporting limit).

20
Table 12. Volatile Organic Compounds (VOC) Concentrations in μg/m3 at Field L. Compound Name VOC Concentration (μg/m3)
3 ft Acetone 7.11 Carbon Tetrachloride 0.75 Chloromethane 1.19 Dichlorodifluoromethane 2.28 Halocarbon 11 1.46 Hexane 7.38 Methyl Ethyl Ketone 1.41 Methylene Chloride 0.48 Propene 0.48 Toluene 0.90 Total VOCs 23.44 No tentative ID matches for additional compounds were found using the NIST Library. *Total VOCs is the sum of all the concentrations that were detectable (does not include values less than reporting limit). Table 13. Tentative identification of VOCs in personal, on-turf and background areas matched with the NIST Library at all fields (A-D, K-L). Chemicals Fields
Personal Fields
On-Turf (height of sample)
Fields (Background)
1-Bromo-propane B, K 1-Chloro-1,1- Difluoroethane
K K (3’)
1,1-Difluorethane B B (6” and 3’) B (3’) 1,2-diethylbenzene D 2-Methyl Butane B, K D, K (3’) 2-Methyl Pentane B 3-Methyl Hexane B 3-Methyl Pentane B 1,3-Pentadiene A, 1R-Alpha-Pinene D Acetaldehyde A, B, C Acetonitrile B, K Beta-Pinene D Butane K (6” and 3’) D-Limonen B Ethanol K K (6”) Ethyl Alcohol B Fluorobenzene D Hexanal B, K Isobutane B Isobutene K Isopropyl Alcohol A, B, C, D, K K (6” and 3’) Methyl-Cyclopentane B Nonanal C Octamethyl – Cyclotetrasiloxane
D D (3’) D (3’)
Octanal A, B, C Pentane B, C, K K (6” and 3’)

21
3.4.2 Semi-Volatile Organic Compounds (SVOCs) An SVOC is any organic compound having a vapor pressure of 1 mmHg or less at standard conditions (293 K and 760 mmHg). Three categories of SVOCs were included in this investigation:1) polyaromatic hydrocarbons (PAHs), 2) miscellaneous SVOCs associated with air pollution such as alkanoic acids (sources include road dust), hopanes/steranes (sources include diesel and gasoline vehicles), and other general compounds such as branched/n-alkanes [16] and 3) five targeted rubber-related SVOCs: benzothiazole, 2-mercaptobenzothiazole, 4-tert-(octyl-phenol, butylated hydroxanisole (BHA), and butylated hydroxytoluene (BHT). PAHs and Miscellaneous SVOCs Area Sampling: PAHs and miscellaneous SVOCs associated with air pollution were collected with Polyurethane Foam Samplers (PS-1, Anderson Instruments, Inc., GA) according to EPA Method TO-13A. Air samples were collected for two hours at flow rates ranging from 207-237 liters per minute (lpm). At Field D, additional air sampling was conducted for 6 hours at flow rates ranging from 209-226 lpm. Samplers were placed on the turf near the middle of each field and in a location upwind and off the turf field (background). All of the samples were collected at a height of approximately 4 feet. The same sampler was used for each designated location (background or on-turf) at all fields. Several extension cords (100-150ft) were used to supply power to samplers from buildings near the sampling fields. The motor of each sampler was exhausted downwind and away from sampling equipment with a 15 foot flexible duct. Sampler magnehelic gauges were calibrated for each sampling event using a calibrated critical orifice as a transfer standard. The orifices were connected to a slack tube manometer in the UCHC office in Farmington, CT. Manometer and magnehelic gauge readings were recorded, and flow rates were compared to the WOHL calibrations measurements recorded in the WOHL laboratory. Measurements were within + 10% of one another. Calibration flow verifications were performed after use to ensure that the calculated magnehelic set point was accurate. Prior to each sampling event, sampling heads and samplers were cleaned with hexane. Sampling heads were loaded with cylindrical glass PUF (polyurethane foam)/XAD-2 cartridge (PUF Plug Part #20038, Supelco, Bellefonte, PA) and filter (Whatman Quartz Microfiber Filters, 102 mm, NJ) in UCHC office. After loading, each head was placed in a ziplock bag, then placed in a travel bag, and transported to the field. In the field, samplers were turned on for five minutes. Leak checks were conducted on site prior to sampling. Sampling heads were placed in the PS-1 samplers and magnehelic gauge measurements were recorded on site at the beginning and end of sampling. Magnehelic gauge measurements were the same at the beginning and end of sampling at all fields. Sampling heads were transported to UCHC on ice. Media was processed out of the sampling heads and placed in glass jars at UCHC. All samples were shipped to WOHL/WSLH on ice on the same day as sampling. During 2 hour sampling at Field D on July 14, 2009, the PS-1 Sampler was turned on for approximately ten minutes without the valve open (sample 217-background). Site coordinator corrected the problem, checked for air leaks, re-tightened seals, and re-checked for air leaks. During the 6-hour sampling session on July 28 at Field D, power was lost for approximately ten minutes (sample 221-background). The site coordinator reported the power problem, and facilities corrected it. A total of 12 field samples were collected. The first set of samples collected from Field L (community) broke during shipment to WOHL/WSLH. Shipping procedures were modified to place the glass cartridges in foam and extra wrapping. Unfortunately, glass PUF/XAD cartridges broke during transportation of the media to UCHC and insufficient sampling media was available to collect samples from Fields B and C (upwind background location only). It was not possible to reschedule these sampling events to collect more data. Ten field samples were analyzed. Sample Preparation and Analysis: Samples were prepared and analyzed according to EPA Method TO-13 by WSLH. All samples had all internal standards spiked pre-extraction. A rotovap was used in place of a K-D concentrator. Other parameters include: inlet temp 300 C, flow 1.0 ml/min, and average velocity 37cm/sec. Initial oven temperature 65C hold for 10 min, ramp up at 10 C/min until 300 C, then hold at 300 C for 26.50 minutes. Although laboratory spike recoveries of benzothiazole were acceptable on the PUF/XAD media, low levels of benzothiazole were observed in the high volume field samples in comparison to the personal sampler benzothiazole method. Since collection efficiency is unknown for benzothiazole on high volume sampler media, the high volume sampler results were determined to be non-reportable.

22
If an analyte in the method blank was greater than its reporting limit, the result for that analyte was flagged to indicate blank contamination. Concentrations were corrected for any blank contamination. Extraction of most chemicals was complete ranging from 75 to 125% as specified by the EPA Method TO-13A. Final concentrations were adjusted by extraction recoveries for analytes below 75% (Appendix H). Concentrations with recoveries exceeding 125% are not adjusted. Results: Tables 1-6 in Appendix I provide the SVOC concentrations for Fields A-D and K. Final SVOC concentrations are reported as nanogram per cubic meter (ng/m3). Analytes not detected are reported as nondetectable (ND). Target analytes positively detected but too far below the reporting limit are reported as DNQ. Values for analyte concentrations confirmed but measured below the reporting limit are reported with the footnote “a”. Values for analyte concentrations corrected by extraction recoveries are reported with the footnote “b”. SVOCs Six Hour vs. Two Hour Sampling Method: Our sampling strategy included a 2 hour sampling time because it represents a typical activity period for athletes using turf fields. At Field D, an extra day of sampling was conducted for 6 hours using EPA Method TO-13A to increase the sensitivity (Tables 3 and 4 in Appendix I). The results suggest that the 2 hour sampling time period allowed for the collection of useful data. During both the 2 and 6 hour sampling periods, similar patterns were observed-nearly half of the SVOCs were either not detected or they were found in greater concentrations on turf than in background locations. Although additional PAHs were detected on turf during the 6 hour sampling (e.g. benz(a)anthracene, benzo(b)fluoranthene, benzo(e)pyrene, benzo(GHI)perylene, benzo(k)fluroanthene), their concentrations on turf were similar to background concentrations. Eight miscellaneous SVOCs were not detected during the 2 hour sampling but were reported with two fold greater concentrations on the turf than in background during the 6 hour sampling period (e.g. decycloclohexane , dodecane, dotriacontane, octacosane, pristine, tetratriacontane, triacontane, tritriacontane).

23
Polyaromatic Hydrocarbons The EPA Method TO-13A includes qualitative and quantitative analyses for certain categories of compounds, such as PAHs. The concentrations of PAHs are provided in Tables 14-16. Because PAHs may be found in crumb rubber made from tires, the following 22 were targeted: Acenaphthene Acenaphthylene Anthracene Fluoranthene Benz(a)anthracene Fluorene Benzo(a)pyrene Indeno(1,2,3-cd)pyrene Benzo(e)pyrene Naphthalene Benzo(GHI)perylene Phenanthrene Benzo(k)fluoranthene Perylene Benzo(b)fluoranthene 1-Methylnaphthalene Chrysene 2-Methylnaphthalene Coronene 2,6-Dimethylnaphthalene Dibenz(a,h)anthracene Pyrene Table 14. PAH concentrations in ng/m3 at Fields A-C (ng/m3).
(on-turf concentrations 2X higher than background are in bold for field A only) SVOC Concentrations ng/m3 PAHs Field A
On Turf Field A Background
Field B On Turf
Field C On Turf
Acenaphthene 2.14 2.95 2.74 b 3.46 b
Benz(a)anthracene ND <0.36 ND <0.41 0.11 a ND <0.41 Benzo(a)pyrene ND <0.20 ND <0.22 0.19 a 0.16 a
Benzo(b)fluoranthene ND <0.65 ND <0.74 0.22 a 0.13 a
Benzo(e)pyrene ND <0.21 ND <0.24 0.26 0.12 a
Benzo(GHI)fluoranthene ND <0.35 ND <0.40 0.08 a ND <0.39 Benzo(GHI)perylene 0.14 a ND <0.67 0.05 a 0.07 a
Benzo(k)fluoranthene ND <0.32 ND <0.40 0.04 a 0.08 a
Chrysene ND <0.26 ND <0.30 0.34 0.13 a
Fluoranthene 1.68 1.474 2.83 1.70Fluorene 2.21 b 2.87 b 4.10 b 2.62 b
Naphthalene 5.99 7.72 6.17 12.51 Phenanthrene 5.07 6.35 10.46 7.27Pyrene 1.70 1.01 2.66 0.971-Methylnaphthalene 3.96 b 6.34b 3.72 b 5.67 b
2,6-Dimethylnaphthalene 2.83 4.47 ND <0.91 5.74Abbreviations: ND= analytes not detected. DNQ= analytes positively detected but too far below the reporting limit. aValues for analyte concentrations confirmed but measured below the reporting limit. bValues for analyte concentrations corrected by extraction recoveries. See Appendix F.

24
Table 15. PAH concentrations in ng/m3 at Field D (2 and 6 hour sampling). (on-turf concentrations 2X higher than background are in bold) PAHs Field D
On Turf (2 hour)
Field D Background (2 hour)
Field D On Turf (6 hour)
Field D Background (6 hour)
Acenaphthene 3.38 b 2.95 b 2.79 b 2.47 b
Acenaphthylene 6.60 b ND <3.74 ND <1.25 0.77Anthracene ND <0.22 ND <0.22 ND <0.07 0.02 a
Benz(a)anthracene ND <0.42 ND <0.42 0.04 a 0.03Benzo(a)pyrene ND <0.23 ND <0.23 0.07 a 0.05 a
Benzo(b)fluoranthene ND <0.75 ND <0.76 0.07 a 0.07 a
Benzo(e)pyrene ND <0.24 ND <0.25 0.07 a 0.06 a
Benzo(GHI)fluoranthene DNQ ND <0.41 0.02 a ND <0.13 Benzo(GHI)perylene ND <0.67 ND <0.69 0.04 a 0.06 a
Benzo(k)fluoranthene ND <0.37 ND <0.38 0.05 a 0.04 a
Chrysene 0.30 0.07 a 0.12 0.08 a
Fluoranthene 6.76 1.19 2.26 3.96Fluorene 3.65 b 3.59 b 2.93 b 2.43 b
Naphthalene 6.32 4.51 14.57 16.94Phenanthrene 14.34 6.11 11.48 13.05Pyrene 6.92 0.47 2.42 3.161-Methylnaphthalene 9.31 b 4.08 b 8.31 b 6.91 b
2-Methylnaphthalene 4.237 b 2.16 b 3.76 b 3.31 b
2,6-Dimethylnaphthalene ND <0.95 ND <0.97 7.65 6.13Abbreviations: ND= analytes not detected. DNQ= analytes positively detected but too far below the reporting limit. aValues for analyte concentrations confirmed but measured below the reporting limit. bValues for analyte concentrations corrected by extraction recoveries. See Appendix F.
Table 16. PAH concentrations in ng/m3 at Field K. (on-turf concentrations 2X higher than background are in bold) PAHs Field K
On Turf Field K Background
Acenaphthene 17.37 b 3.99 b
Acenaphthylene 6.79 ND <3.20 Chrysene ND <0.26 0.04 a
Fluoranthene 5.55 0.58Fluorene 53.70 b 3.42 b
Naphthalene 112.99 7.05Phenanthrene 32.26 7.56Pyrene 11.84 0.371-Methylnaphthalene 114.20 b 6.16 b
2,6-Dimethylnaphthalene 28.70 10.372-Methylnaphthalene 63.38 b 2.72 b
Abbreviations: ND= analytes not detected. aValues for analyte concentrations confirmed but measured below the reporting limit. bValues for analyte concentrations corrected by extraction recoveries. See Appendix F. *Not in calibration standard mix but is quantitated.

25
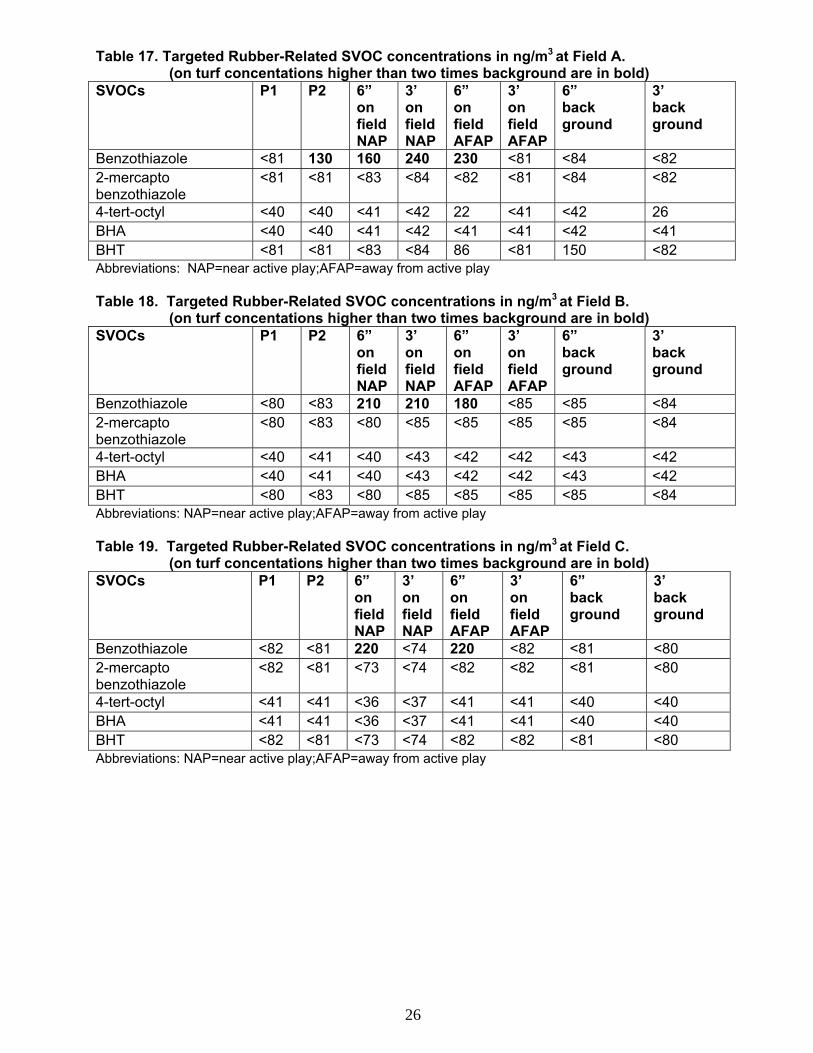
3.4.2.3 Targeted Rubber-Related SVOCs Air Sampling: Personal and area air samples were collected for the following five rubber-related SVOCs: benzothiazole, 2-mercaptobenzothiazole, 4-tert-(octyl-phenol, butylated hydroxanisole (BHA), and butylated hydroxytoluene (BHT). Air samples for these compounds were collected using sampling pumps fit with XAD-2 adsorbent media and 37mm, 2 micron PTFE pre filters. The pumps were pre and post calibrated for approximately 2 liters per minute (LPM). The samples were collected for two hours. At Fields A-D and K, the personal samples were collected by placing the pumps at waist-height on two study team members involved in active play. Two area samples were collected at 6 inches and 3 feet above the ground at the following locations: on the field near active play (NAP), on the field away from active play (AFAP), and at the upwind background location. At Field L, an area sample was collected at 3 feet. At Field D during the six hour sampling event, two on field air samples were collected (6 inches and 3 feet). The two sampling pumps failed during the six hour sampling event. The data were considered unreliable and are not reported. A field blank was submitted for each field. Field spike samples were also submitted for Fields A, B, D (6 hr), and K. A total of 58 samples were collected including 7 field blanks and 6 field spikes. Sample Analysis: All samples were analyzed by WOHL using NIOSH Method 2550 (modified). Bulk material or samples collected on XAD-2 (vapor) and/or PTFE pre-filter (particulate) filter air sampling devices were desorbed with 10 minutes of sonication performed with methanol. Desorption volumes were 2mL methanol for the particulate portion and 1mL methanol for vapor portion of each sample. Extracts were analyzed by reversed phase high-performance liquid chromatography employing a 0.1% formic acid:methanol linear gradient program. Detection was achieved by triple quadrupole mass spectrometry using multiple reaction monitoring (MRM). Quality control samples also included laboratory reagent blanks, laboratory method blanks, and laboratory control spikes. Calibration check standards were also analyzed after every 10 samples analyzed. Results: Concentrations are reported in ng/m3. Benzothiazole and 2-mercaptobenzothiazole recoveries were incomplete (below 75%). The field spike recovery for benzathiozole (vapor phase) was also incomplete (mean recovery = 72%). Therefore, results reported were corrected for incomplete recoveries. 4-tert-(octyl-phenol, Butylated hydroxanisole (BHA), and Butylated hydroxytoluene (BHT) recoveries were also adjusted when spike recoveries observed were below 75%. In cases where background signal was observed in reagent and/or method blanks, the reporting limit was raised to account for this. The reporting limit chosen for each analyte also represents the lowest calibration standard that resulted in acceptable back calculated recovery (within +/- 25% of theoretical value). Appendix I provides the WOHL analytical laboratory reports. Tables 17-22 in Appendix I provide the results of the targeted rubber-related SVOCs.
26
Table 17. Targeted Rubber-Related SVOC concentrations in ng/m3 at Field A. (on turf concentations higher than two times background are in bold) SVOCs P1 P2 6”
on field NAP
3’ on field NAP
6” on field AFAP
3’ on field AFAP
6” back ground
3’ back ground
Benzothiazole <81 130 160 240 230 <81 <84 <82 2-mercapto benzothiazole
<81 <81 <83 <84 <82 <81 <84 <82
4-tert-octyl <40 <40 <41 <42 22 <41 <42 26 BHA <40 <40 <41 <42 <41 <41 <42 <41 BHT <81 <81 <83 <84 86 <81 150 <82 Abbreviations: NAP=near active play;AFAP=away from active play Table 18. Targeted Rubber-Related SVOC concentrations in ng/m3 at Field B. (on turf concentations higher than two times background are in bold) SVOCs P1 P2 6”
on field NAP
3’ on field NAP
6” on field AFAP
3’ on field AFAP
6” back ground
3’ back ground
Benzothiazole <80 <83 210 210 180 <85 <85 <84 2-mercapto benzothiazole
<80 <83 <80 <85 <85 <85 <85 <84
4-tert-octyl <40 <41 <40 <43 <42 <42 <43 <42 BHA <40 <41 <40 <43 <42 <42 <43 <42 BHT <80 <83 <80 <85 <85 <85 <85 <84 Abbreviations: NAP=near active play;AFAP=away from active play Table 19. Targeted Rubber-Related SVOC concentrations in ng/m3 at Field C. (on turf concentations higher than two times background are in bold) SVOCs P1 P2 6”
on field NAP
3’ on field NAP
6” on field AFAP
3’ on field AFAP
6” back ground
3’ back ground
Benzothiazole <82 <81 220 <74 220 <82 <81 <80 2-mercapto benzothiazole
<82 <81 <73 <74 <82 <82 <81 <80
4-tert-octyl <41 <41 <36 <37 <41 <41 <40 <40 BHA <41 <41 <36 <37 <41 <41 <40 <40 BHT <82 <81 <73 <74 <82 <82 <81 <80 Abbreviations: NAP=near active play;AFAP=away from active play

27
Table 20. Targeted Rubber-Related SVOC concentrations in ng/m3 at Field D. (on turf concentations higher than two times background are in bold) SVOCs P1 P2 6”
on field NAP
3’ on field NAP
6” on field AFAP
3’ on field AFAP
6” back ground
3’ back ground
Benzothiazole 240 <82 610 210 1200 280 700 <77 2-mercapto benzothiazole
<81 <82 <78 <80 <82 <84 <79 <77
4-tert-octyl <40 <41 <39 <40 <41 <42 <40 <38 BHA <40 <41 <39 <40 <41 <42 <40 <38 BHT <81 97 160 130 <82 <84 <79 <77 Abbreviations: NAP=near active play;AFAP=away from active play Table 21. Targeted Rubber-Related SVOC concentrations in ng/m3 at Field K. (on turf concentations higher than two times background are in bold) SVOCs P1 P2 6”
on field NAP
3’ on field NAP
6” on field AFAP
3’ on field AFAP
6” back ground
3’ back ground
Benzothiazole 11000 13000 14000 12000 11000 12000 <82 <82 2-mercapto benzothiazole
<82 <86 <81 <83 <82 <82 <82 <82
4-tert-octyl <41 <43 <41 <42 <41 <41 <41 <41 BHA <41 <43 <41 <42 <41 <41 <41 <41 BHT 1300 1800 2100 3900 2100 1900 88 <82 Abbreviations: NAP=near active play;AFAP=away from active play Table 22. SVOC concentrations in ng/m3 at Field L. SVOCs 3’ on grass
Benzothiazole <83 2-mercapto benzothiazole <83 4-tert-octyl <42 BHA <42 BHT 280

28
3.4.3 Nitrosamines Air Sampling: Personal and air samples for Nitrosamine were collected using sampling pumps fit with Thermosorb/NTM tubes. The pumps were pre and post calibrated at approximately 2 liters per minute. The samples were collected for two hours. At fields A-D and K, the personal samples were collected by placing the pumps at waist-height on two study team members involved in active play. Two area samples were collected on the fields away from active (AFAP) at 6 inches and 3 feet above the ground, and two area samples were collected at the upwind background location at 6 inches and 3 feet above the ground. At Field L, one area sample was collected at 3 feet. At Field D during the six hour sampling event, two on field area samples (6 inches and 3 feet) were collected. A field blank was collected at each field. A total of 40 samples were collected including 7 field blanks. Upon arrival to WOHL, one field sample had a cracked inlet Analysis: All samples were analyzed by WOHL using NIOSH 2522 for the following nitrosamines: N-nitrosodimethylamine (NDMA), N-nitrosomorpholine (NMOR), N-nitrosopyrrolidine (NPYR), N-nitrosodiethylamine (NDEA), N-nitrosopiperdine (NPIP), N-nitrosodipropylamine (NDPA), and N-nitrosodibutylamine (NDBA). Nitrosamines were not found in the field blanks. Results: Table 23 provides the results of the nitrosamine sampling. Concentrations are reported in µg/m3. All concentrations were below the reporting limits. Appendix J provides the WOHL analytical laboratory reports for nitrosamine sampling.

29
Table 23. Nitrosamine concentrations in µg/m3 at each field (A-D, K-L)
Field Location Nitrosamine
µg/m3
A 6" on field AFAP <0.41 A 3' on field AFAP <0.32 A 6" background <0.42 A 3' background <0.41 A Personal <0.42 A Personal <0.41 B 6" on field AFAP <0.34 B 3' on field AFAP <0.41 B 6" background <0.35 B 3' background <0.43 B Personal <0.39 B Personal <0.41 C 6" on field AFAP <0.41 C 3' on field AFAP <0.34 C 6" background <0.39 C 3' background <0.32 C Personal <0.38 C Personal <0.38 D 6" on field AFAP <0.42 D 3' on field AFAP <0.42 D 6" background <0.38 D 3' background <0.35 D Personal <0.39 D Personal <0.40
D-6hr 6" on field AFAP <0.14 D-6hr 3' on field AFAP <0.14
K 6" on field AFAP <0.40 K 3' on field AFAP <0.39 K 6" background <0.31 K 3' background <0.34 K Personal <0.39 K Personal <0.41 L 3' <0.25a
Abbreviations: AFAP=away from active play. a The sampler had a cracked inlet upon arrival to WOHL.

30
3.4.3 Air Particulate Matter (PM10) Air Sampling: Area Air samples for particulate matter (PM10) were collected using the Harvard Impactor (MS&T Area Sampler, Air Diagnostics and Engineering, Harrison, ME, USA). Samples were collected onto 37 mm Teflon filters (2.0 um) at a flow rate of 20 Liters/minute (Pump Model SP-280, Air Diagnostics and Engineering Inc., Harrison, ME;S/N 30637 and 30565). Two samples were collected at 3 feet above the ground per field: on turf near the middle of the field and upwind off-turf (background). Field blanks were collected and analyzed at every sampled field. Extension cords were connected to electrical outlets in external buildings to provide power to the sampling pumps. The airflow rate was measured with a rotameter (AALBORG, Orangeburg, NY, S/N 227-202-4) before and after sampling with a representative sample medium according to HSPH Type Impactor SOP Protocol (6-26-00-Air Diagnostics and Engineering, Harrison, ME, USA). Flow rates after sampling were within + 5% of the initial flow rate at each sampling field. Twelve field samples and six field blanks were collected (two field samples and one blank per field). Filters were shipped to the WOHL laboratory on the same day as sampling on ice and frozen upon receipt until weight analysis. Analysis: Samples were weighed according to CFR Title 40 Part 50 (Appendix L) before and after sampling to determine PM10 concentration. Tare (before sampling) and post sampling weights were measured three times on a Mettler Toledo Model MX5 Balance (weighs to 0.001mg). These measurements were averaged, and the difference between the average tare and post sampling concentrations were used to calculate PM10 concentration as micrograms per cubic meter of air (μg/m3). Final PM10 concentrations for field samples were corrected by field blanks (samples at fields C and K were corrected). Results: Table 24 provides the PM10 concentrations for all fields. PM10 concentrations were greater in background locations than on the turf at all fields with the exception of Field B. However, the concentration on turf at Field B, 5.89 μg/m3, was within the range of background concentrations (4.96-17.79 μg/m3). The protocol for sampling at Field A was not followed properly and, therefore, data is not available. Table 24. Concentrations of Airborne Particulate Matter (PM10) at 3 feet above the surface at fields (A-D, K-L). Field ID
Location Type
Pm10Concentration (ug/m3)
On Turf Background A Outdoor --- a --- a B Outdoor 5.89 <0.38 C Outdoor 16.54b 17.79b D Outdoor 4.52 4.96 L Outdoor
(non-turf site) NAc 8.81
8.61 K Indoor 7.22 9.04 a --- Sampling protocol was not followed during sampling. bPesticide application occurred adjacent to field during sampling day (~10 minutes) cNA is non applicable because sampling occurred in an suburban grass field (non-turf). Air Particulate Matter (PM10) Characterization Following gravimetric analysis, samples were stored at room temperature until particulate characterization analyses. Six samples were selected for Microscopic Particle Identification and characterization by Polarized Light Microscopy (WP001.20 Analysis), Scanning Electron Microscopy, and Energy Dispersive X-Ray (EDXA) analyses. These samples were collected from Fields B, D, K (on turf) and L (suburban grass). Appendix K provides the WOHL analytical laboratory reports for PM10. Other samples were not analyzed as planned because rubber fragments were not easily detected and identification of particles were inconclusive.

31
4.0 Summary Findings This report identifies and measures chemicals across several synthetic crumb rubber turf fields and background locations. The measurements collected from background locations are necessary to better understand the data because many of these chemicals are present in ambient air as a result of air pollution. The following algorithm was used to identify a possible turf-related VOC, targeted SVOC or nitrosamine: Chemicals found in: A) either 6” or 3’ samples; or B) in both personal and either 6” or 3’ samples, greater than two times the background concentration measured near the field, were considered to have originated from the turf. The attribution of a chemical to the turf was considered stronger if the chemical was also found in at least one field’s crumb rubber head space. For PAHs and general SVOC’s the following algorithm was used to identify a possible turf related chemical: Chemicals found in turf air samples but: A) not in background air samples or B) at twice the field’s background concentration, were considered to have originated from the turf. Attribution of a chemical to an origin in the turf was considered stronger if this finding held on at least two fields. 4.1 Crumb Rubber Infill Bulk VOCs The most commonly found VOCs (range of concentrations in parts per billion-ppbV) detected in crumb rubber infill include: acetonitrile (60-300ppbV), methylene chloride (dichloromethane) (20-430ppbV), methyl alcohol (33-270ppbV), and methyl isobutyl ketone (21-150ppbV). Bulk crumb rubber from the newer fields (A, B and D) contained more than ten VOCs. Crumb rubber from other fields contained less than 5 VOCs. Bulk crumb rubber can act as a sink for organic compounds in the environment. Some VOCs, such as methylene chloride, methyl alcohol and acetone, were also found in a laboratory blank where the crumb rubber field samples were processed for the head space analysis. Presence of a VOC in the head space of the bulk crumb rubber infill as well as in air samples at two times greater than background levels is considered more suggestive that crumb rubber infill is the source of the VOC. 4.2 Air VOCs-Possibly Turf-Related Of the 60 VOCs tested, 4 VOCs appear to be associated with turf. The concentration of methyl isobutyl ketone (35.98 μg/m3) was the highest VOC detected in area samples collected on the turf (Field K). Acetone was the second highest VOC found in area samples on the turf, and it was also found in the air of the background location at lower concentration. Inter-player variability of total VOC air concentrations was notable on fields B (28.99 vs. 240.51 μg/m3) and K (292.47 vs. 424.27 μg/m3). The highest air concentrations on the turf for most VOCs were found at Field K. Table 25 summarizes one possible algorithm for determining which VOCs may be related to crumb rubber emissions. Chemicals meeting these criteria are bolded, and most frequently found in Field K, the indoor facility, and not in the outdoor fields. Chemicals found in personal samples (at two times greater concentrations than background) but not in 6” or 3’ or any bulk crumb rubber head space sample are unlikely to be turf related. The belts and aprons that held the personal samplers in place during simulated soccer play emit a number of chemicals. Trace levels of acrolein were detected seven months later in mesh belt and cloth apron. Other sources of VOCs, such as sweat or the players’ use of personal care products (e.g. sunscreen, deodorant, etc,) may be contributing to the VOC levels found in the personal results; however, it is difficult to determine this. In the future, personal samples should also be collected on grass (non-turf) field in order to better interpret the data.

32
Table 25. VOC exposure assessment- screening algorithm for chemicals’ relationship to crumb rubber emissions. Screen for each field Chemical Field Either 6” or 3’ two times > background for this field Chemical in this field’s crumb rubber head space
Toluene
D
Either 6” or 3’ two times > background for this field Chemical not in field’s crumb rubber head space but in at least one other field’s crumb rubber head space
Acetonec Ethyl Benzene Methyl Isobutyl Ketone Toluene
C K K K
Either 6” or 3’ two times > background for this field Chemical is not in any field’s crumb rubber head space
Carbon Disulfide Cyclohexane M/P-Xylene O-Xylene
K B, K K K
Personal two times > background for this field Chemical is two times background in 6” or 3’ sample Chemical is in this field’s crumb rubber head space
Toluene
D
Personal two times > background for this field Chemical is two times background in 6” or 3’ sample Chemical not in field’s crumb rubber head space but in at least one other field’s crumb rubber head space
Acetonec Ethyl Benzene Methyl Isobutyl Ketone Toluene
C K K K
Personal two times > background for this field Chemical is two times background in 6” or 3’ sample Chemical is not in any field’s crumb rubber head space
Carbon Disulfide Cyclohexane M/P-Xylene O-Xylene
K B, K K K
Personal two times > background for this field Chemical is not two times > background in 6” or 3’ sample Chemical is in this field’s crumb rubber head space
Acetonec Hexane Methylene Chloride Methyl Isobutyl Ketone Toluene (Acetonitrile)^ (Isopropyl Alcohol)^
A, B B, C B B, D A, B B A, B
Personal two times > background for this field Chemical is not two times > background in 6” or 3’ sample Chemical not in field’s crumb rubber head space but in at least one other field’s crumb rubber head space
Acetonec Benzenec Ethyl Benzene Hexane Toluene (Acetonitrile)^ (Isopropyl Alcohol)^
D B B A B, C K C, D, K
Personal two times > background for this field Chemical not two times > background in 6” or 3’ sample Chemical is not in any field’s crumb rubber head space
Acrolein Bromodichloromethane Bromoform Carbon Disulfide Ethyl Acetate Heptane M/P-Xylene O-Xylene Propene Styrene Tetrachloroethylene Tetrahydrofuran Trichloroethylene Vinyl Acetate 1,2-Dichloropropane 1-Ethyl-4-Methyl Benzene 1,2,4-Trimethyl Benzene 1,3,5-Trimethyl Benzene
A, B, K K A, K B A, B, C, D, K B, C, D B B B, C, D, K B, K B, K B, K B, K K B B, K B, K B, K
^ tentative identification with NIST Library cCompound was detected in the background sample of the laboratory used to analyze the bulk crumb rubber head space.

33
Air VOCs-Background Twenty VOCs of 60 were found in upwind background locations (Table 26). Five of these VOCs (chloromethane, dichlorodifluormethane, halocarbon 11, hexane and methyl ethyl ketone) were found in the upwind background locations at all five fields. Air concentrations of acetone, carbon tetrachloride and toluene were found at four background sites, whereas benzene and methylene chloride were detected at three sites. Table 26. VOC Concentrations in upwind background locations at all fields. VOCs Fields Range of VOC Concentrations μg/m3 (parts per billion ppbV) 1,1,-2-Trichlorotrifluoroethane K 1.53 (0.20) 1,1,2-Trichloroethane K 0.76 (0.14) 1,2-Dichloropropane K 0.69 (0.15) 1,2-Dichloroethane K 0.68 (0.17) 1,1,2,2-Tetrachloroethane A 1.02 0.15) Acetone A, B, D, L 7.11-12.33 (3.0-5.2) Benzene A, D, L 0.41-0.64 (0.13-0.20) Carbon Tetrachloride A, B, K, L 0.75-1.30 (0.14-0.21) Chloroform K 0.68 (0.14) Chloromethane A, B, D, K, L 1.06-1.33 (0.52-0.65) Dichlorodifluoromethane A, B, D, K, L 2.23-2.47 (0.45-0.5) Ethyl Acetate A 0.61 (0.17) Halocarbon 11 A, B, D, K, L 0.53-1.96 (0.13-0.35) Heptane K 0.53 (0.13) Hexane A, B, D, K, L 0.88-9.40 (0.25-2.6) Methyl Ethyl Ketone A, B, D, K, L 1.06-1.74 (0.36-0.62) Methylene Chloride A, K, L 0.48-1.83 (0.14-0.32) Propene L 0.48 (0.28) Toluene A, B, K, L 0.75-0.1.09 (0.2-0.29) Vinyl Acetate A 1.02 (0.29)

34
4.3 Air PAHs and SVOCs-Possibly Turf Related The EPA Method TO-13A was followed to collect and analyze ten air samples for 115 SVOCs. Table 27 provides the range of concentrations of PAHs across all the fields on outdoor turf, indoor turf and upwind background locations. Table 28 summarizes one possible algorithm for determining which miscellaneous SVOCs may be related to crumb rubber emissions. The criteria used to determine if a chemical is potentially turf-related includes: Chemicals found in turf air samples but : A) not in background air samples or B) at twice the field’s background concentration, were considered to have originated from the turf. Attribution of a chemical to an origin in the turf was considered stronger if this finding held on at least two fields. At Field K, several compounds were ten fold higher on turf than background including five PAHS (1-methylnaphthalene, 2-methylnaphthalene, fluorene, naphthalene, and pyrene) and 7 general SVOCs (dotriacontane, heptacosane, hexacosane, octanoic acid, pentacosane, tetracosane, and tetradecane). Table 27. Range Concentrations of PAHs in ng/m3 On Outdoor Turf and Upwind Background Locations.
PAH Outdoor On Turf Range ng/m3
(n=5*)
Indoor On Turf Concentration
ng/m3
(n=1)
Background Range ng/m3
(n=4) 1-Methylnaphthalene 3.72-9.31 ND 4.08.6.91 2,6 Dimethylnaphthalene ND-7.65 28.70 ND-10.37 2-Methylnaphthalene 1.88-4.24 63.38 ND-3.31 Acenaphthene 2.14-3.45 17.37 ND-0.3.99 Acenaphthylene ND-6.59 6.78 ND-0.77 Anthracene ND-ND ND ND-0.02 Benz(a)anthracene ND-ND ND ND-0.03 Benzo(a)pyrene ND-0.19 ND ND-0.05 Benzo(b)fluoranthene ND-0.21 ND ND-0.07 Benzo(e)pyrene ND-0.26 ND ND-0.06 Benzo(GHI)fluoranthene ND-0.08 ND ND-ND Benzo(GHI)perylene ND-0.14 ND ND-0.06 Benzo(k)fluoranthene ND-0.08 ND ND-0.04 Chrysene ND-0.34 ND ND-0.04 Fluoranthene 1.68-6.76 5.55 0.58-3.96 Fluorene 2.21-4.09 53.70 2.43-3.59 Indeno(1,2,3-cd)pyrene ND-0.05 8.90 ND-0.05 Naphthalene 5.99-14.57 113.00 4.50-16.94 Phenanthrene 5.07-14.34 32.26 6.11-13.05 Pyrene 0.97-6.92 11.84 0.37-3.16 ND=nondetectable; see appendix for reporting limits. *Four fields were sampled, and one field (D) was sampled twice.

35
Table 28. SVOC exposure assessment- screening algorithm for chemicals’ relationship to crumb rubber emissions. Screen for each field Chemical Field PAHs detected on the turf field and not detected in background, and found on at least 2 fields
Acenaphthylene
D and K
PAHs detected on the turf field at more than two times the concentration of background levels, and found on at least 2 fields
1-Methylnaphthalene 2- Methylnaphthalene Fluoranthene Phenanthrene Pyrene
D and K D and K D and K D and K D and K
Miscellaneous SVOCs detected on the turf field at more than two times the concentration of background levels, and found on at least 2 fields
Eicosane Eicosanic acid Heneicosane Hexadecanoic acid Octadecanoic acid Phytane Tetradecanoic acid Tetratriacontane Tricosane
D and K D and K D and K D and K A and D D and K D and K A and K D and K

36
4.4 Targeted SVOCs-Possibly Turf-Related Of the five targeted SVOCs in air, Benzothiazole and BHT were the only chemicals detected above background (Table 29). Concentrations of benzothiazole were higher on the turf at six inches away from active play than in background locations at all fields. Most concentrations of benzothiazole and BHT were an order of magnitude lower among the outdoor turf fields than the indoor field, ranging from <80-1200 ng/m3 and <80-130 ng/m3, respectively. Indoor concentrations of benzothiazole and BHT on the turf range from 11000-14,000 and 1240-3900 ng/m3, respectively. The indoor field contained the highest concentration of benzothiazole in the crumb rubber. 4-tert-(octyl)-phenol was detected in the crumb rubber head space in all fields (A-K), however, it was only found in two air samples (on turf level was less than background). BHT was detected in air at 3 feet at the grass background Site L (280 ng/m3). Table 29. Field locations where air concentrations are greater than relative background concentration for each field.
Personal 6” NAP 3’NAP 6” AFAP 3’ AFAP Benzothiazole A*, D#, K A, B, K B, D, K A, B, C, D, K D, K 2-mercaptobenzothiazole none none none none none 4-tert-octyl none none none none none BHA none none none none none BHT D*, K K D, K K K
Abbreviations: NAP=near active play;AFAP=away from active play * one of two personal samples exceeded background # one of two personal samples exceeded 6” background but not 3’ background Table 30 summarizes one possible algorithm for determining which targeted SVOC may be related to crumb rubber emissions. Chemicals found in: A) either 6” or 3’ samples; or B) in both personal and either 6” or 3’ samples, greater than the background concentration measured near the field, were considered to have originated from the turf. The attribution of a chemical to the turf was considered stronger if the chemical was also found in at least one field’s crumb rubber head space. Chemicals meeting these criteria are bolded. Benzothiazole and BHT met this criteria. Table 30. Targeted SVOCs exposure assessment- screening algorithm for chemicals’ relationship related to crumb rubber emissions. Screen for each field Chemical Field Either 6” or 3’ two times > background for this field Chemical in this field’s crumb rubber head space
Benzothiazole BHT
A, B, C, D, K K
Either 6” or 3’ two times > background for this field Chemical not in field’s crumb rubber head space but in at least another field’s crumb rubber head space
BHT D
Personal two times > 3’ background for this field Chemical is in 6” or 3’ sample two times background Chemical is in this field’s crumb rubber head space
Benzothiazole BHT
A, D, K K
Personal two times > 3’ background for this field Chemical is in 6” or 3’ sample two times background Chemical not in field’s crumb rubber head space but in at least another field’s crumb rubber head space
BHT D
Nitrosamine All samples were below the reporting limit including the crumb rubber infill. Particulate Matter (PM10) PM10 concentrations measured on the turf are typical levels found in background locations. Rubber fragments were not easily detected and analyses of particles were inconclusive. Lead All of the composite samples of artificial turf fibers and crumb rubber were below the level EPA considers as presenting a “soil-lead hazard” in play areas (400ppm). This definition, however, applies to residential buildings and to soil rather than other surfaces.

37
5.0 Limitations The primary objective of this project was to characterize human exposure via inhalation to a targeted group of chemicals that are associated with crumb rubber synthetic turf. Other routes of exposures, such as ingestion and contact, were not within the scope of this study. Some chemicals of potential concern, such as natural rubber latex, were not included as part of the targeted chemicals in our study but should be included in future studies. There are several limitations to this project. This project has a potential for selection bias because participation was voluntary and self-selected. The sample size was small (4 outdoor fields and 1 indoor field), however, goals of the project were met in recruiting outdoor turf fields, an indoor facility and a suburban grass field. During the summer of 2009, temperature conditions for the sampling events were on average lower than normal. The 30-year monthly average maximum temperature for the month of July is 84.9 oF, and during July 2009, the average was 79.9 oF. Most notably, wind conditions were low, and little cloud overcast occurred on most sampling days. Personal sampling occurred at waist height, and not in the normal breathing zone of the study team players. The placement of 1.4 L SUMMAs and personal sampling pumps at this height is not a conventional industrial hygiene personal sampling method. This method was chosen to better represent a child’s height. Some VOCs (e.g. acrolein) were found in personal samples and not on the turf or in the background areas. Players wore the SUMMAs close to their bodies, and they were up against the sampling belts and plastic ties that players wore to hold all the sampling equipment. The belts were purchased new, and may have had some coatings on them. SUMMAs are a very sensitive air sampling method, and may have collected VOCs associated with personal care products and sampling belts worn by the team players. Players were asked not to wear products to limit any contamination. Because of the intense heat and sun exposure, some players wore sun protection and all players sweated. WOHL conducted a follow-up experiment to determine if the new belts and plastic ties were capable of releasing compounds. WOHL detected trace levels of several compounds in the 7 month old belt, apron and tie. Any future personal sampling must address these kinds of issues, and “control” team members playing on the grass (non turf setting) should be included in the sampling strategy. There are many factors to consider for “control” team members, including the type of player clothing, personal product use, personal characteristics (sweat and exhaled breath), laundering practices, and behavior. Field coordination for this project was challenging at times. For example, it is unfortunate that background samples were not collected at two fields with the PS-1 Samplers as a result of media breakage issues during transportation. In addition, one of the fields (C) was contaminated by a pesticide application which may explain the larger number of VOCs found in comparison to the other outdoor fields. The indoor field had multiple uncharacterized potential point sources. Sampling for two hours was a limitation. Although the 6-hour sampling at Field D allowed for greater sensitivity, similar patterns were observed with both strategies. Benzothiazole is not a targeted SVOC for the TO-13A Method, and more validation studies are needed to better understand how to collect air samples with the PS-1 Samplers and analyze them for benzothiazole. NIOSH Method 2550 (modified) was adequate to capture concentrations of benzothiazole at the three levels, and other targeted SVOCs. The lab was not able to identify rubber particles on the Teflon filters from several fields, and therefore, SEM analysis was not completed for all field samples. U.S. EPA’s study used polycarbonate filters with the same air sampling method and reported similar difficulties. More research is needed to better characterize particulate matter containing crumb-rubber. The airborne concentrations of VOCs, Targeted SVOCs (e.g. benzothiazole) and SVOCs were highest in the indoor field. These data were collected from only one indoor facility. The crumb rubber of the indoor facility was manufactured by the same company as Field B, and installed one year earlier. The air in the indoor field was not influenced by outdoor factors that may degrade and off gas chemicals, such as sunlight, high temperatures, rain, and other weather conditions. Furthermore, potential point sources were identified in the facility, (electric carts, portable chargers, and maintenance supplies), and the indoor facility did not have its exhaust system operating on the day samples were collected. The use of the exhaust

38
system in this facility varies according to need. More research is needed to better understand chemical exposures in indoor facilities. 6.0 Connecticut Academy of Science and Engineering Review (CASE): CASE performed a peer review of this final report in June 2010. The scope of the technical review for this report included an examination of the appropriateness of the methods used to sample targeted compounds and the laboratory analytical methods. Based on CASE comments, this report was revised to: 1) clarify laboratory quality control and assurance laboratory procedures for VOCs by WSLH and WOHL, 2) strengthen the criteria of the algorithm used to identify a turf-related compound to take into account variability among concentrations (e.g. turf-related compound was reported as twice a field’s background concentration), 3) move tables presenting concentrations of miscellaneous SVOCs commonly found in the environment to appendices and 4) include a description of the similarities and source locations of the bulk crumb rubber samples collected from UCHC and CAES. CASE also highlighted that the SVOC air contaminants found above the field are consistent between fields, and are also consistent with air contaminants reported in other similar studies. Issues raised by the CASE review are addressed below and incorporated into the report. Design of Experiment: Analysis of crumb rubber for latex antigen was beyond the scope of the current investigation. This should be included in future studies. Explain why PM10 was measured and not PM2.5: During our planning for this study, several states and US EPA were finishing reports related to synthetic turf. We discussed their findings, and used data that best represents inhalation exposure while playing on a turf field. In US EPA’s scoping study, two kinds of PM10 integrated air samples were collected (one for particle mass and metals analysis and another for scanning electron microscopy analysis). NYCity did not reveal meaningful differences in concentrations between the results for the samples collected upwind and those on the field. In addition, they did not find rubber dust in the respirable range. Because of these findings, we decided to use the PM10 range. Concern with VOC Results: Precautions used by the laboratories to prevent VOC contamination were added in the UCHC final report as recommended by CASE. The OEM UCHC sub-contracted laboratory analyses to three AIHA accredited laboratories: Wisconsin Occupational Health Laboratory (WOHL), the Wisconsin State Laboratory of Hygiene (WSLH) and the ESIS Environmental Health Laboratory (EHL) in Cromwell, Connecticut. WOHL is a full service industrial hygiene chemistry laboratory that is part of the Wisconsin State Laboratory of Hygiene (WSLH) at the University of Wisconsin-Madison. WSLH analyzed air samples for VOCs, SVOCs and PM10. WOHL analyzed bulk crumb rubber head space for VOCs and targeted SVOCs (e.g. benzothiazole), and air samples for nitrosamines and targeted SVOCs. Additional bulk samples were analyzed for lead by the ESIS Environmental Health Laboratory (EHL). The following precautions were taken for the personal and area VOC analysis by WSLH: WSLH followed the quality control and assurance protocols defined in the EPA TO-15 Method. Each analytical run included one method blank per batch of samples. If an analyte in the method blank was greater than its limit of detection (LOD), the result for that analyte was flagged to indicate blank contamination. As indicated in the report, one set up samples contained acetone in the blank sample (1.5 ppb), and concentrations were corrected. Duplicate analysis was performed on one sample per analytical batch. Duplicate analyses were always within 25% for each compound. Daily quality control checks were performed using a second source standard. Analytes in the quality control/QC check standard were always within 30% of the corresponding calibration standards. The following precautions were taken for the bulk crumb rubber VOC analysis by WOHL and added to the final report: 1) bulk crumb rubber samples were stored in teflon lined screw capped jars and were opened only when removing sample for analysis;2) the 340mL LVSH were baked at 70oC overnight; and 3) one of the LVSH units was analyzed empty with each analytical run as a method blank, and any VOCs detected above reporting limit noted in the analytical report. In addition, a laboratory background VOC air sample was collected in the storage cooler of the bulk crumb rubber samples. As indicated in the report, six VOCs were found and reported in this sample. These six VOCs were flagged as a footnote in tables presenting results. Criteria used to determine concentrations greater than background: CASE recommended that qualifiers be included for the VOC and SVOC data for concentrations greater than background. UCHC agrees with CASE and modified the report. The criteria for identifying a possibly turf-related chemical of concern was changed: all concentrations greater than two times background were indicated in tables and bolded.

39
Semivolatile Organic Compound (SVOC) Results: CASE recommended leaving out the miscellaneous SVOCs since it appears that few, if any, of these pertain to crumb rubber or artificial turf. UCHC agrees with CASE, and moved the data into an appendix. Off-Gas Findings: DPH risk assessment discusses the consistency of the SVOC concentrations across fields. The UCHC final report provides the data for the risk assessment. Reference Lead Levels: CASE identified other reference levels for lead (e.g. Consumer Product Safety Commission standard for children’s products). UCHC is referencing the EPA lead in soil standard (400ug/g) in the final report because it is the most comparable standard for athletic playing fields. Analytical Results- CAES versus WOHL: CASE recommended including more information to describe the similarities and differences between CAES and WOHL samples. In the final report, UCHC included a description of the similarities and source locations of the bulk crumb rubber samples collected from UCHC and CAES. CAES collected and analyzed samples of crumb rubber material supplied by several manufacturers [5]. Their crumb rubber samples included material from only two of UCHC outdoor fields (A and D). These two crumb rubber fields were manufactured by two different companies. The results are difficult to compare between the two laboratories (WOHL and CAES) because they used different analytical methods.

40
REFERENCES
[1] KEMI (Swedish Chemicals Agency) (2006) Synthetic Turf from a Chemical Perspective – A Status Report. Available at http://www.kemi.se/upload/Trycksaker/Pdf/PM/PM3_06_eng.pdf
[2] Brown, D. (2007) Exposures to Recycled Rubber Tire Crumbs Used on Synthetic Turf Fields, Playgrounds and Gardening Mulch. Available at http://www.ehhi.org/turf/pr_turf_report.shtml.
[3] 2008. Synthetic Turf Health Debate Takes Root, Environ Health Perspect 116(3): A116-A122.
[4] Dye, C., Bjerke, A., Schmidbauer, N. and Mano, S. (2006) Measurement of Air Pollution in Indoor Artificial Turf Halls. Norwegian Inst Air Res Report NILU OR 03/2006. [5] CAES (Connecticut Agricultural Experimental Station) (2009) 2009 Study of Crumb Rubber Derived from Recycled Tires Final Report. [6] Vetrano, K and Ritter G. (2009) Air Quality Survey of Synthetic Turf Fields Containing Crumb Rubber Infill. Prepared for New York City Department of Health and Mental Hygiene, NY, NY. TRC Project No. 153896. [7] U.S. Environmental Protectional Agency (2009) A Scoping-Level Field Monitoring Study of Synthetic Turf Fields and Playgrounds. EPA/600/R-09/135. National Exposure Research Laboratory, Office of Research and Development. Available athttp://www.epa.gov/nerl/documents/tire_crumbs.pdf.. [8] U.S. Environmental Protectional Agency (1999) Compendium of Methods for the Determination of Toxic Organic Compounds in Ambient Air, Second Edition, Compendium Method TO-15 Determination Of Volatile Organic Compounds (VOCs) In Air Collected In Specially-Prepared Canisters And Analyzed By Gas Chromatography/Mass Spectrometry (GC/MS). Office of Research and Development, EPA/625/R-96/010b. [9] U.S. Environmental Protectional Agency (1999) Compendium of Methods for the Determination of Toxic Organic Compounds in Ambient Air, Second Edition, Compendium Method TO-13A Determination of Polycyclic Aromatic Hydrocarbons (PAHs) in Ambient Air Using Gas Chromatography/Mass Spectrometry (GC/MS). Office of Research and Development, EPA/625/R-96/010b. [10] National Institute of Occupational Safety and Health (NIOSH) (1998) Method 2550 Benzothiazole in Asphalt Fume. In: Eller PM, Cassinelli ME. Eds. NIOSH Manual of Analytical Methods, 4th ed., Cincinnati, OH: NIOSH. Available at http://www.cdc.gov/niosh/docs/2003-154/pdfs/2550.pdf. [11] National Institute of Occupational Safety and Health (NIOSH) (1994) Method 2522 Nitrosamine. In: Eller PM, Cassinelli ME. Eds. NIOSH Manual of Analytical Methods, 4th ed., Cincinnati, OH: NIOSH. Available at http://www.cdc.gov/niosh/docs/2003%2D154/pdfs/2522.pdf. [12] Marple, V.A., Rubow, K.L., Turner, W., Spengler, J.D., 1987. Low flow rate sharp cut impactors for indoor air sampling: design and calibration. Journal of Air Pollution Control Association 37, 1303–1307. (HSPH Type Particle Sampler S.O.P. Protocol 6-26-00-, Air Diagnostics and Engineering, Available at http://www.airdiagnostics.com/indoor_samp_equip.html). [13] U.S Environmental Protection Agency National Primary and Secondary Ambient Air Quality Standards, Title 40 CFR Part 50 Appendix L Reference Method for the Determination of Fine Particulate Matter as PM2.5 in the Atmosphere. Available at http://law.justia.com/us/cfr/title40/40 2.0.1.1.1.html#40:2.0.1.1.1.0.1.13.12 [14] New York City Department of Parks and Recreation: “Synthetic Turf Lead Results” (online) Available at http://www.nycgovparks.org/sub_things_to_do/facilities/synthetic_turf_test_results.html (Accessed August 19, 2009). [15] EPA 40 CFR Part 745- Lead; Identification of Dangerous Levels of Lead; Final rule; January 2001 (online) Available at http://www.epa.gov/fedrgstr/EPA-TOX/2001/January/Day-05/t84.pdf (Accessed August 19, 2009)
41
[16] Schauer J. 2005. “Analysis of Particle-Phase Organic Speciation Data to Assess Sources of PM”. Prepared for United States Environmental Protection Agency, Office of Air Quality Planning and Standards, Technical Report Number 4D6543NTTX. 7.0 Appendices (available upon request) Appendix A Sampling Map
Appendix B Meteorological Report
Appendix C Crumb Rubber Head Space VOC WOHL Reports
Appendix D Crumb Rubber Head Space Target SVOCs WOHL Reports
Appendix E Crumb Rubber Bulk Samples Lead EHL Reports
Appendix F Air VOC WOHL Reports
Appendix G Special Items Head Space WOHL Reports
Appendix H Air PAHs and Miscellaneous SVOCs EPA Method TO-13A WOHL Reports
Appendix I Air Targeted SVOCs NIOSH 2550 WOHL Reports
Appendix J Air Nitrosamine WOHL Reports
Appendix K Air PM10 WOHL Reports