at belle salle nihonbashi - ir · pdf fileaccounting period of financial business in southeast...
TRANSCRIPT

Copyright(C)2016 JTRUST Co.,Ltd. All Rights Reserved.
Earnings Presentation Materialat Belle Salle Nihonbashi
1st Quarter of FY 2017
17th August, 2016J Trust Co., Ltd.

2
Table of Contents
1.Financial Results for 1st Quarter of FY 2017
2.Performance and Results by Segments
3.Progress Report on the Full-Year Target
4.Others
APPENDIX(IFRS-unaudited)

3
Disclaimer• The information published in this material, including forecasts, is recognition, opinion,
judgment or projection of the Company at the time of creation of this material and the Company does not guarantee its achievement. As such, please be aware that actual results may differ from the forecasts provided in this material as a result of various factors.
• The earnings presentation and this material are prepared to provide information to facilitate greater understanding of the Company. It is not intended for use in soliciting investments in the securities issued by the Company or its subsidiaries.
• There are three months difference between consolidated accounting period and accounting period of Financial Business in Southeast Asia. (For example, 1Q FY2017 reflects figures from January 2016 till March 2016 of Bank JTrust Indonesia, likewise 2Q reflects its figures from April till June, 3Q reflects its figures from July till September, and 4Q reflects its figures from October till December.)
• The exchange rate published in this material, for Financial Business in South Korea indicates the end of June 2016, and for Financial Business in Southeast Asia indicates the end of March 2016.
• This material is an English translation of the original Japanese document, prepared solely for the convenience of and reference by overseas investors. If there exist any discrepancies between the original Japanese language and English translation, the Japanese language will always prevail. The issuer shall not be liable for this translation or any loss or damage arising from this translation.
44

Financial Results for 1Q FY2017
6
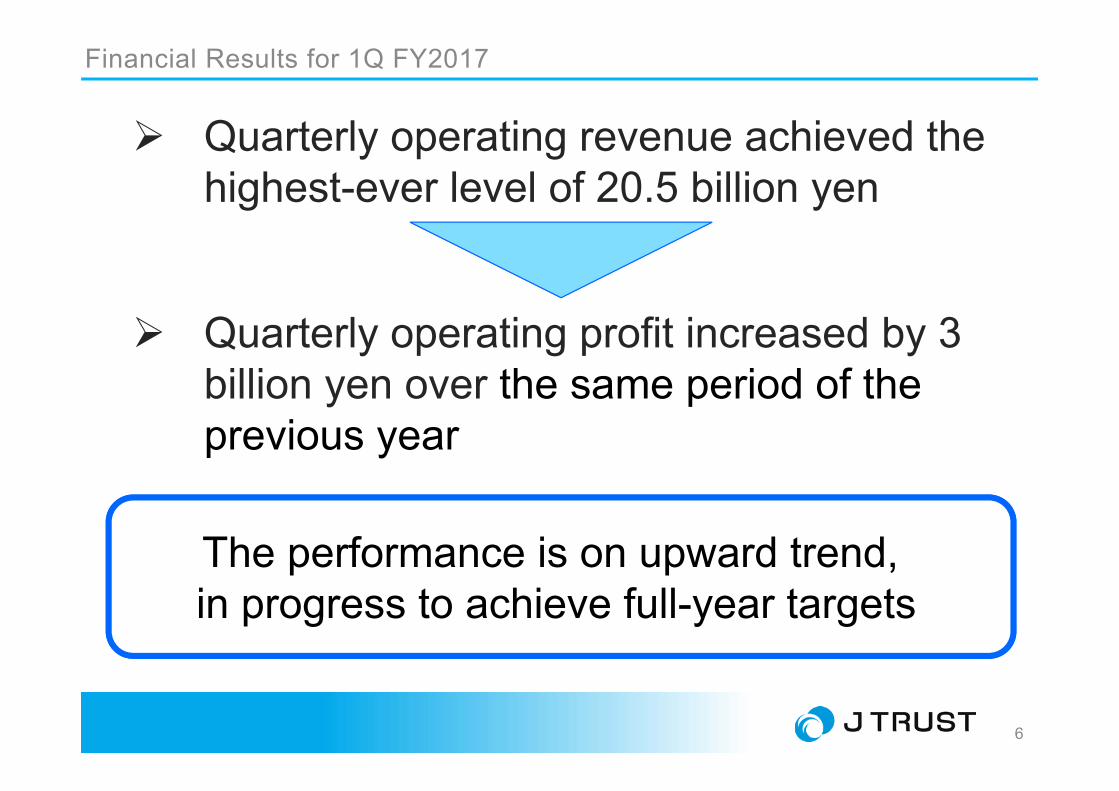
Quarterly operating revenue achieved the highest-ever level of 20.5 billion yen
Quarterly operating profit increased by 3 billion yen over the same period of the previous year
Financial Results for 1Q FY2017
The performance is on upward trend, in progress to achieve full-year targets
7
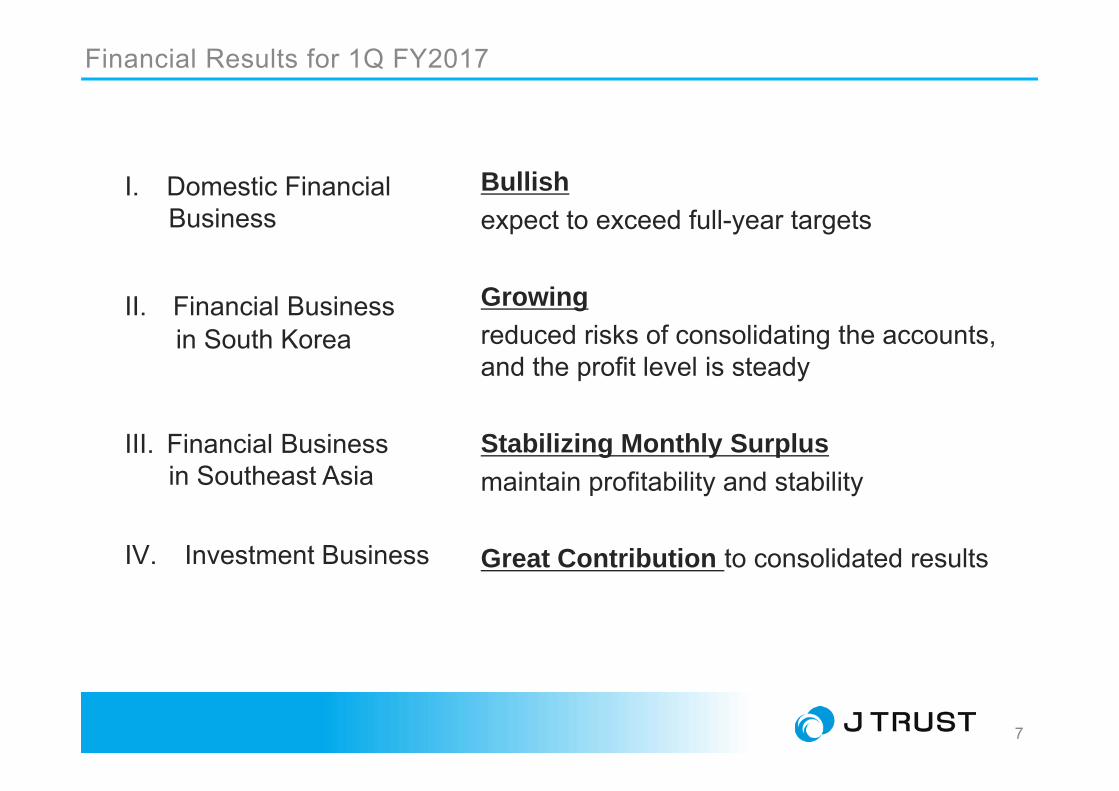
IV. Investment Business
Bullishexpect to exceed full-year targets
Growingreduced risks of consolidating the accounts, and the profit level is steady
Stabilizing Monthly Surplus maintain profitability and stability
Great Contribution to consolidated results
Financial Results for 1Q FY2017
I. Domestic FinancialBusiness
II. Financial Business in South Korea
III. Financial Business in Southeast Asia

Overview of Financial Results for 1Q FY2017

9
Overview of Financial Results for 1Q FY2017 /consolidated summary (progress of operating revenue and operating profit quarterly)
Quarterly operating revenue and operating profit are solid Quarterly consolidated operating revenue is recorded as 20.5 billion yen
195
183
201
175
754
205
0
100
200
300
400
500
600
700
800
2016/031Q
2Q 3Q 4QTOTAL
2017/031Q
Operating revenue
-19
-41
11
-4 2
-20
-50
-40
-30
-20
-10
0
10
20
2016/031Q
2Q 3Q 4QTOTAL
2017/031Q
Operating profit
*rounding off the number
Consolidated Summary Under J-GAAP (in 100 million yen)
10
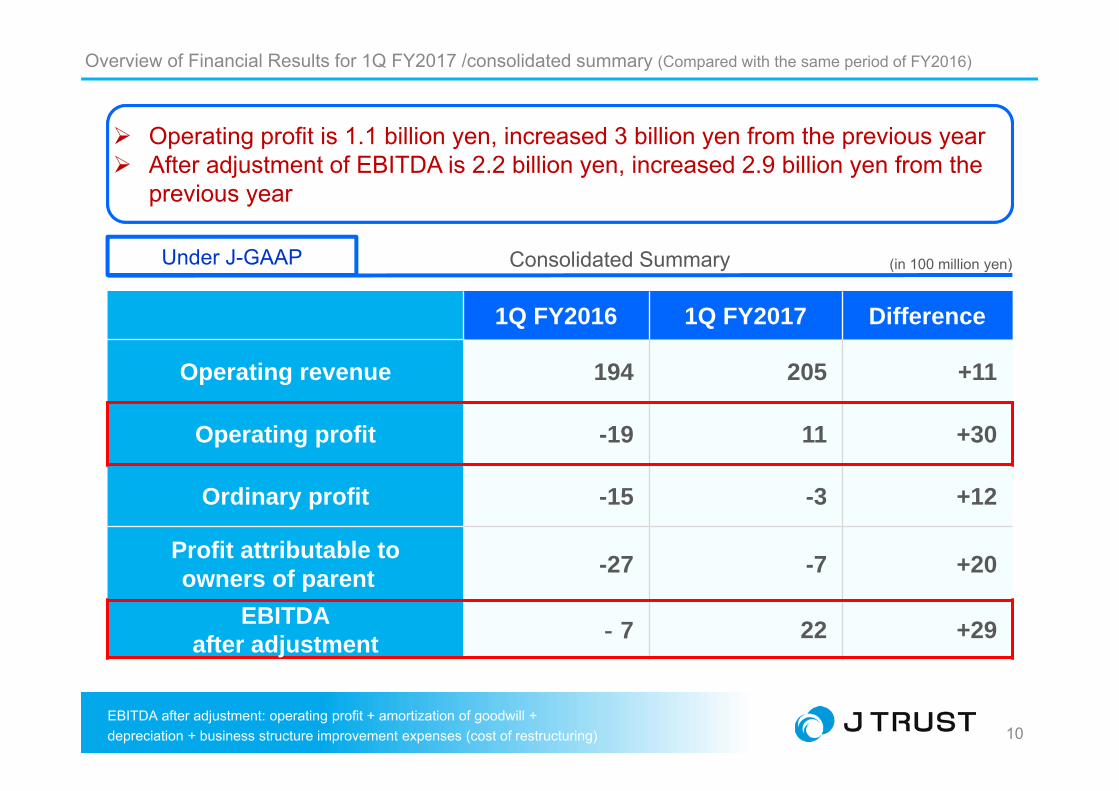
1Q FY2016 1Q FY2017 Difference
Operating revenue 194 205 +11
Operating profit -19 11 +30
Ordinary profit -15 -3 +12
Profit attributable toowners of parent -27 -7 +20
EBITDAafter adjustment ‐7 22 +29
Operating profit is 1.1 billion yen, increased 3 billion yen from the previous year After adjustment of EBITDA is 2.2 billion yen, increased 2.9 billion yen from the
previous year
EBITDA after adjustment: operating profit + amortization of goodwill +depreciation + business structure improvement expenses (cost of restructuring)
Under J-GAAP
Overview of Financial Results for 1Q FY2017 /consolidated summary (Compared with the same period of FY2016)
(in 100 million yen)Consolidated Summary

11
1Q FY2016 1Q FY2017 Difference
Domestic Financial Business 26 25 -1Financial Business in
South Korea 74 70 -4
Financial Business in Southeast Asia 32 35 +3
Investment Business 3 14 +11
Non-Financial Business 51 50 -1
MISC. 6 8 +2
Total 194 205 +11
*Non-Financial Business: real estate business and general entertainment business*MISC: constructing commercial facilities business, IT system, etc
Under J-GAAP
Overview of Financial Results for 1Q FY2017 /segment operating revenue (Compared with the same period of FY2016)
Domestic Financial Business is solid Financial Business in South Korea decreased due to the exchange rate (1Q FY2016=0.1107 KRW 1Q FY2017=0.0930 KRW) The operating revenue of Financial Business in Southeast Asia is increasing steadily
Operating revenue (in 100 million yen)

12
Overview of Financial Results for 1Q FY2017 /segment operating revenue(Compared with the same period of FY2016): Local currency approximation
Increased 11.8 billion KRW in Financial Business in South Korea Increased 70.6 IDR billion in Financial Business in Southeast Asia
Under J-GAAP
3,433 4,139
0
500
1,000
1,500
2,000
2,500
3,000
3,500
4,000
4,500
2016/031Q
2017/031Q
Financial Business in Southeast Asia
669762
0
100
200
300
400
500
600
700
800
900
2016/031Q
2017/031Q
Financial Business in South Koreain 100 million won in IDR 100 million
Exchange rate︓yen=won Exchange rate︓yen=IDR2016/03 1Q=0.1107won (Apr.-June 2015 Avg.) 2016/03 1Q =0.0094IDR (Jan.-Mar. 2015 Avg.)2017/03 1Q=0.0930won (Apr.-June 2016 Avg.) 2017/03 1Q =0.0086IDR (Jan.-Mar. 2016 Avg.)
Operating revenue

13
1Q FY2016 1Q FY2017 Difference
Domestic Financial Business 9 11 +2Financial Business in
South Korea 0 2 +1
Financial Business in Southeast Asia -25 -6 +19
Investment Business 2 13 +11
Non-Financial Business 1 ‐0 ‐1
MISC. ‐7 ‐7 ‐0
Total -19 11 +30
Domestic Financial Business is constantly growing Financial Business in South Korea is steadily profitable Financial Business in Southeast Asia is improving performance
Under J-GAAP
Overview of Financial Results for 1Q FY2017 /segment operating profit (Compared with the same period of FY2016)
*Non-Financial Business: real estate business and general entertainment business*MISC: constructing commercial facilities business, IT system, etc
Operating profit (in 100 million yen)

14
Overview of Financial Results for 1Q FY2017 /segment operating profit (Compared with the same period of FY2016): Local currency approximation
Increased 2.2 billion KRW, Financial Business in South Korea Improved 189.3 billion IDR, Financial Business in Southeast Asia
Under J-GAAP
1
23
0
5
10
15
20
25
2016/031Q
2017/031Q
Financial Business in South Korea
-2,680
-787
-3,000
-2,500
-2,000
-1,500
-1,000
-500
0
2016/031Q
2017/031Q
Financial Business in Southeast Asiain 100 million won in IDR 100 million
exchange rate︓yen=won exchange rate︓yen=IDR2016/03 1Q=0.1107won (Apr.-June 2015 Avg.) 2016/03 1Q =0.0094IDR (Jan.-Mar. 2015 Avg.)2017/03 1Q=0.0930won (Apr.-June 2016 Avg.) 2017/03 1Q =0.0086IDR (Jan.-Mar. 2016 Avg.)
Operating profit
15
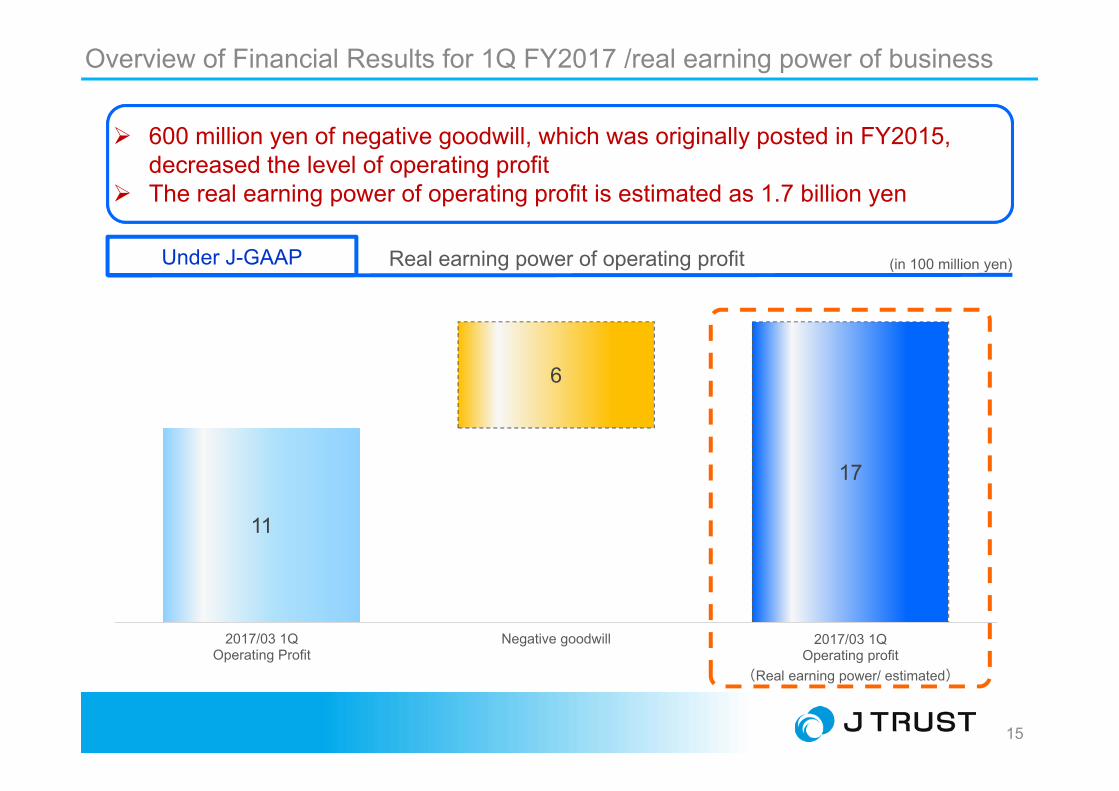
Overview of Financial Results for 1Q FY2017 /real earning power of business
Real earning power of operating profitUnder J-GAAP
600 million yen of negative goodwill, which was originally posted in FY2015, decreased the level of operating profit
The real earning power of operating profit is estimated as 1.7 billion yen
11
6
17
2017/03 1QOperating Profit
Negative goodwill 2017/03 1QOperating profit
(Real earning power/ estimated)
(in 100 million yen)

Performance and Results by Segments

17
Domestic Financial Business: operating revenue/operating profit
Operating revenue and operating profit are both solid. The goal is to exceed full-year targets
Due to the effect of restructuring, fixed cost is decreased. The business is constantly growing
26 25
0
5
10
15
20
25
30
35
40
45
2016/031Q
2017/031Q
Operating revenue
911
0
2
4
6
8
10
12
2016/031Q
2017/031Q
Operating profit
Domestic Financial BusinessUnder J-GAAP (in 100 million yen)

18
42
82
135
0
20
40
60
80
100
120
140
160
16/04 05 06
Apartment loan is constantly growing The approval is steadily increasing. In progress to achieve full-year
targets
Amount of credit guarantee by Nihon Hoshou Approved Apartment Loans(in 100 million yen)(in 100 million yen)
Domestic Financial Business/credit guarantee business
384
186
391 398 407424 435
453 466502
533 549 558 570
0
100
200
300
400
500
600
15/07 08 09 10 11 12 16/01 02 03 04 05 06
Size of guarantees Apartment Loans Total

19
The amount of receivables continued to increase because of successful purchased of NPLs
FY2017’s target is 440.9 billion yen. The achievement rate is 156%(Also, already achieved FY2018 target of 500.8 billion yen.)
Domestic Financial Business: Servicer business
Amount of receivables (in 100 million yen)
1,196 1,251 1,471
2,572 2,833
3,492
4,679
6,879
0
1,000
2,000
3,000
4,000
5,000
6,000
7,000
2010/03 2011/03 2012/03 2013/03 2014/03 2015/03 2016/03 2016/06
FY2018 targets: 5,008
FY2017 targets: 4,409

20
Financial Business in South Korea

21
Financial Business in South Korea: operating revenue/operating profit
Financial Business in South KoreaUnder J-GAAP (in 100 million won)
74 70
0
10
20
30
40
50
60
70
80
2016/031Q
2017/031Q
Operating revenue
0
2
0
1
1
2
2
3
2016/031Q
2017/031Q
Operating profit
Financial Business in South Korea decreased due to the foreign exchange rate(2016/03 1Q=0.1107KRW 2017/03 1Q=0.0930KRW)
Generating positive operating profit, the performance is on upward trend

22
Financial Business in South Korea
Financial Business in South Korea: in total *4x companies
(in 100 million won)
*4x companies of South Korea=JT Chinae Savings Bank, JT Savings Bank, JT Capital, TA Asset
reference rate︓1won=0.0896yen
K-GAAP (South Korean accounting standard) shows real earning power and both operating revenue/operating profit are solid
791 876
0100200300400500600700800900
1,000
2017/03 1QJ-GAAP
2017/03 1QK-GAAP
Operating revenue
24
136
0
20
40
60
80
100
120
140
160
2017/03 1QJ-GAAP
2017/03 1QK-GAAP
Operating profit

23
1,022
906 1,008
1,284 1,364 1,409
1,166
1,508 1,493 1,585
1,645
1,893
400
600
800
1,000
1,200
1,400
1,600
1,800
2,000
15/07 08 09 10 11 12 16/01 02 03 04 05 06
JT Capital
JT Savings Bank
JT Chinae Savings Bank
avg 979
avg 1,352avg 1,389
The amount of loan disbursed per month recorded the highest(3-month average: 170.8 billion KRW)
It is double the amount of avg. 97.9 billion KRW last year
avg 1,708
Amount of loan disbursed per month
Financial Business in South Korea : new loan balance
(in 100 million won)
reference rate︓1won=0.0896yen

24
Loan balance increased steadily
Financial Business in South Korea : loan balance
Loan balance (in 100 million won)
17,376 17,340 17,175 17,212 17,267 17,296 17,801
18,291 18,480 18,806
19,403 19,662
20,148
20,622 21,376
15,000
16,000
17,000
18,000
19,000
20,000
21,000
22,000
15/04 05 06 15/07 08 09 10 11 12 16/01 02 03 04 05 06
reference rate︓1won=0.0896yen

25
18,348
3,029
6,156
21,377 34.50%
5.64%
0.00%
5.00%
10.00%
15.00%
20.00%
25.00%
30.00%
35.00%
40.00%
0
5,000
10,000
15,000
20,000
14/04 05 06 07 08 09 10 11 12
15/01 02 03 04 05 06 07 08 09 10 11 12
16/01 02 03 04 05 06
Loan disbursed by group companies Purchased receivables Delinquency ratio
* definition of NPL: loans that are delinquent for 30 days or more
Financial Business in South Korea : operating assets
Loan balance and NPLs* at savings banks/capital company (in 100 million won)
reference rate︓1won=0.0896yen
Increasing excellent receivables, due to the credit screening by our group companies
Delinquency ratio record at the lowest level Revenue base becoming solid

26
Financial Business in South Korea/in total *4x companies
Under J-GAAP Total 4x companies of operating profit (estimated)
2
8
6
0
1
2
3
4
5
6
7
8
9
2017/03 1QActual
2017/03 1QReal earning power
Amount of amortization negative goodwill
The real earning power under J-GAAP is estimated 800 million yen, excluding the amount of amortization of negative goodwill
(in 100 million won)

27
Financial Business in South Korea /decreasing factor of operating profit – negative goodwill
Impact of negative goodwill on operating profit (as of the end of June 2016)
Amortized 6 in 1Q
Under J-GAAP
Negative goodwill posted in FY2015 impacted consolidated operating profit As of June 2016, the amount of unamortized is 900 million yen
(which will be amortized by FY2017)
95
15 96
Negative goodwill as of Mar. 2015(JTCK and JTSB were acquired)
Actual as of Mar. 2016 Actual as of Mar. 2017
Amortized 80
in FY2016
(in 100 million yen)

28
Financial Business in Southeast Asia

29
Financial Business in Southeast Asia: timing difference in account closing
Under J-GAAP, 3-month timing difference in account closing arises when consolidating results of Financial Business in Southeast Asia
■Image of consolidating results of Financial Business in Southeast Asia
FY2017 1Q 2Q 3Q 4Q
Under J-GAAP Jan.-Mar. 2016 Apr.-June 2016 July-Sept. 2016 Oct.-Dec. 2016
Operating revenue 35 - - -
Operating profit -6 - - -
(in 100 million yen)

30
Financial Business in Southeast Asia : operating revenue/operating profit
Financial Business in Southeast AsiaUnder J-GAAP
32 35
0
5
10
15
20
25
30
35
40
2016/031Q
2017/031Q
Operating revenue
-25
-6
-30
-25
-20
-15
-10
-5
0
2016/031Q
2017/031Q
Operating profit
Operating revenue is increasing, and the performance is on upward trend towards the end of the year
Operating profit has improved Focusing on cost-effective management
(in 100 million yen)

31
200
412
683
896
2015/4~6 7~9 10~12
2016/1~3
9.99%
10.55%
11.22%11.37%
2015/4~6 7~9 10~12
2016/1~3
8.43%
7.69%8.04%
7.84%
2015/4~6 7~9 10~12
2016/1~3
Financial Business in Southeast Asia – Bank Indonesia: Other key indicators
Avg. lending interest rate Avg. deposit interest rate Net interest income(in IDR 100 million)
Interest income increased by accumulating operating assets and raising average lending interest rates
A reduction in deposit rates also contributed to the steady growth of net interest income (interest income minus interest costs)
reference rate: 1 IDR=0.0086yen

32
80,735 83,157 83,806 84,081 86,344 88,656 84,374 87,173 93,870 93,870
98,122 100,567
4.50%4.90%
6.40%6.90%
7.50% 7.50%
3.00% 2.80% 2.60% 2.60% 2.50%
1.90%
0.00%
1.00%
2.00%
3.00%
4.00%
5.00%
6.00%
7.00%
8.00%
0
20,000
40,000
60,000
80,000
100,000
120,000
04 05 06 07 08 09 10 11 12 16/01 02 03
Operating assets accumulated steadily by strengthening sales force
Financial Business in Southeast Asia – Bank JTrust Indonesia: operating assets and NPL ratio
Operating assets and NPL ratio (in IDR 100 million)
reference rate: 1 IDR=0.0086yen

33
8.97%
8.87% 8.42%
8.30%8.15%
7.69%7.56%
8.01%
8.04%
8.18%
8.15%
7.84%
6.50%
7.00%
7.50%
8.00%
8.50%
9.00%
9.50%
15/04 05 06 07 08 09 10 11 12
16/01 02 03
Cost of Funds
76.29%
75.51%
77.09%
76.83%
81.99%
82.35%
85.35%
85.10%
85.15%
85.30%
88.34%
92.01%
40.00%
50.00%
60.00%
70.00%
80.00%
90.00%
100.00%
15/04 05 06 07 08 09 10 11 12
16/01 02 03
LDR
0%
Decreased COF (Cost of Funds) steadily Loan-To-Deposit ratio (LDR) increased due to our control of the deposit
amount in view of the loan balance (to reduce baseline costs)
0%
Financial Business in Southeast Asia – Bank JTrust Indonesia: COF and LDR
COF and LDR

34
Financial Business in Southeast Asia/Bank JTrust Indonesia: enhancement of business foundation 1
Finance money from Bank JTrust Indonesia with channeling scheme
Deploy with lighter POS for rural areas including islands of 13,000 in Indonesia Motorcycle, Agricultural
Equipment, Solar Panel, housing, white goods, etc.
PT Group Lease Finance
Indonesia
Group Lease Finance Indonesia (GLFI) has started operation this July and already made business contracts
Accelerate to accumulate loan balance from multi-finance business of Bank JTrust Indonesia
*multi-finance: funding to agents which deal with auto mobile and motorcycle loans

35
Financial Business in Southeast Asia/Bank JTrust Indonesia: nhancement of business foundation 2
Bank JTrust Indonesia Operating scene
Collaborated bank released rupiah linked time deposit which will contribute to lower COF of Bank JTrust Indonesia 【COF at Bank JTrust Indonesia : 7.84% (as of the end of 2016/03) COF from the product: 6.0%~6.5%】
Developing measures to reduce fixed cost and improve operating efficiency Transferred an additional management of IT department to speed up IT system Transferred an executive of Nihon Hoshou to Bank JTrust Indonesia as an executive officer of JTG

36
Investment Business

37
Investment Business: operating revenue/operating profit
Gained 1.4 billion yen of revenue by selling shares of Bank Mayapada By underwriting of convertible bond issued by Group Lease PCL, expecting to gain 800
million yen of revenue Stock price of Group Lease hikes, we could expect an increase in valuation gains in the
bond, and the stock conversion could also have an influence on our results
Investment Business (in 100 million yen)Under J-GAAP
*Group Lease: Group Lease PCL listed on the Stock Exchange of Thailand
3
14
0
2
4
6
8
10
12
14
16
2016/031Q
2017/031Q
Operating revenue
2
13
0
2
4
6
8
10
12
14
2016/031Q
2017/031Q
Operating profit

38
December 30th 2015: Converted GL's convertible bond into shares
Investment business: operating revenue/operating profit
‘eye on the future’ in investment
• No. of converted shares: 98.1million 1 share=18 baht (5.349 billion yen)
• Stock price on June 30th 2016 1 share = 36 baht(10.341 billion yen)
Difference: 5 billion yen (estimated) 「Unrealized gain」

39
Non-Financial Business

40
Non-Financial Business: operating revenue/operating profit
Operating revenue is steadily increasing The revenue of general entertainment business is increasing towards the
end of the year
Non-Financial Business
51 50
0
10
20
30
40
50
60
2016/031Q
2017/031Q
Operating revenue
(in 100 million yen)Under J-GAAP
1
-0
-1
0
1
2
2016/031Q
2017/031Q
Operating profit
*Non-Financial Business: real estate business and general entertainment business

41
New challenge
Bitcoin information website Chart Smartphone Application
Bitcoin exchange “J-Bits” has started in June 2016 Launched *native application for smartphones, first in the industry Focus on providing safe and reliable bitcoin service
*native application: an application program that has been developed for use on a smartphone.J-Bits application has all the information when dealing Bitcoins such as wallet, chart, market news, etc..

42
Progress Report on the Full-Year Target

43
Full-Year Target 1Q FY2017 Achievementrate To achieve
Domestic FinancialBusiness 111 25 22.5% 86
Financial Business in South Korea 408 70 17.2% 338
Financial Business in Southeast Asia 206 35 17.0% 171
Investment Business 37 14 37.8% 23
Non-Financial Business/MISC. 220 61 27.7% 159
Total 982 205 20.9% 777
Operating revenueUnder J-GAAP
(in 100 million yen)
Progress Report on the Full-Year Target/Segment operating revenue achievement rate
*Non-Financial Business: real estate business and general entertainment business*MISC: constructing commercial facilities business, IT system, etc
44
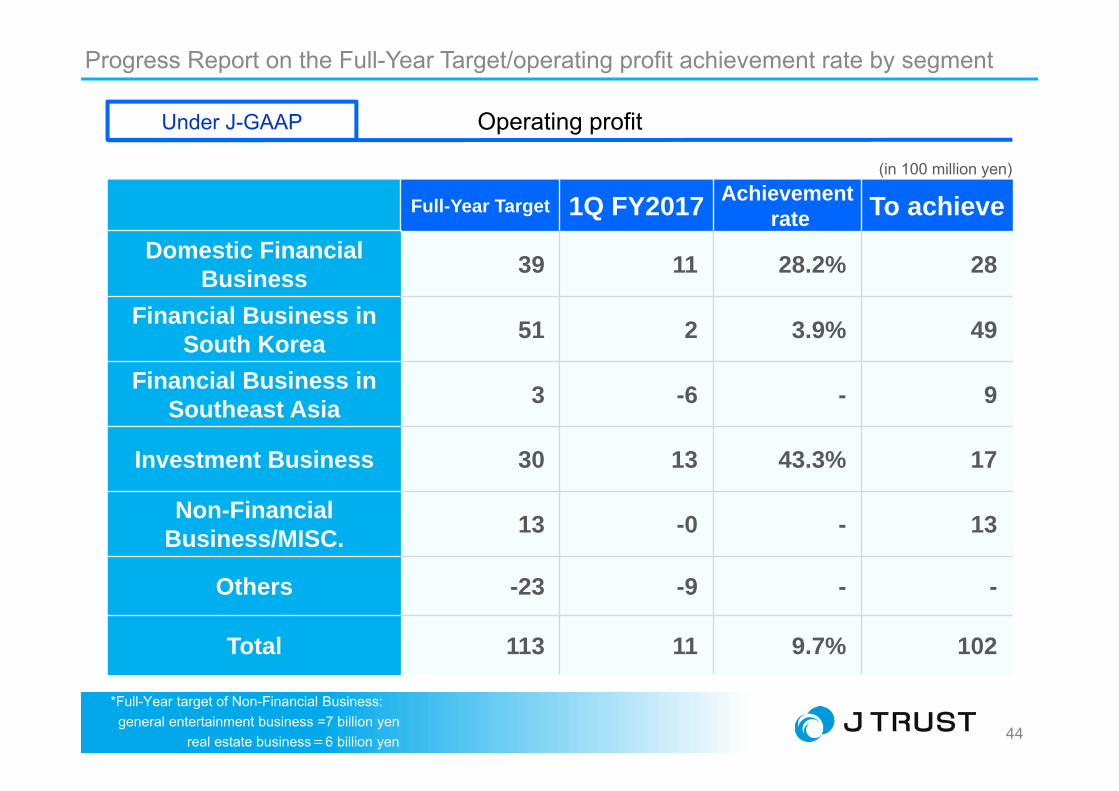
Full-Year Target 1Q FY2017 Achievementrate To achieve
Domestic FinancialBusiness 39 11 28.2% 28
Financial Business in South Korea 51 2 3.9% 49
Financial Business in Southeast Asia 3 -6 - 9
Investment Business 30 13 43.3% 17
Non-Financial Business/MISC. 13 -0 - 13
Others -23 -9 - -
Total 113 11 9.7% 102
*Full-Year target of Non-Financial Business:general entertainment business =7 billion yen
real estate business=6 billion yen
Operating profitUnder J-GAAP
(in 100 million yen)
Progress Report on the Full-Year Target/operating profit achievement rate by segment

45
Others

46
Others/About shares buyback
Total number of shares subscribed
Total share acquisition value
November 11th 2015 6,250,000 shares 6.2 billion 64 million yen
August 15th 2016 6,000,000 shares 4.9 billion 26 million yen
August 16th 2016 3,188,300 shares 2.3 billion 52 million yen
Flexible share-buy back for enhancing the capital efficiency
The results for the shares buyback of the past year
47
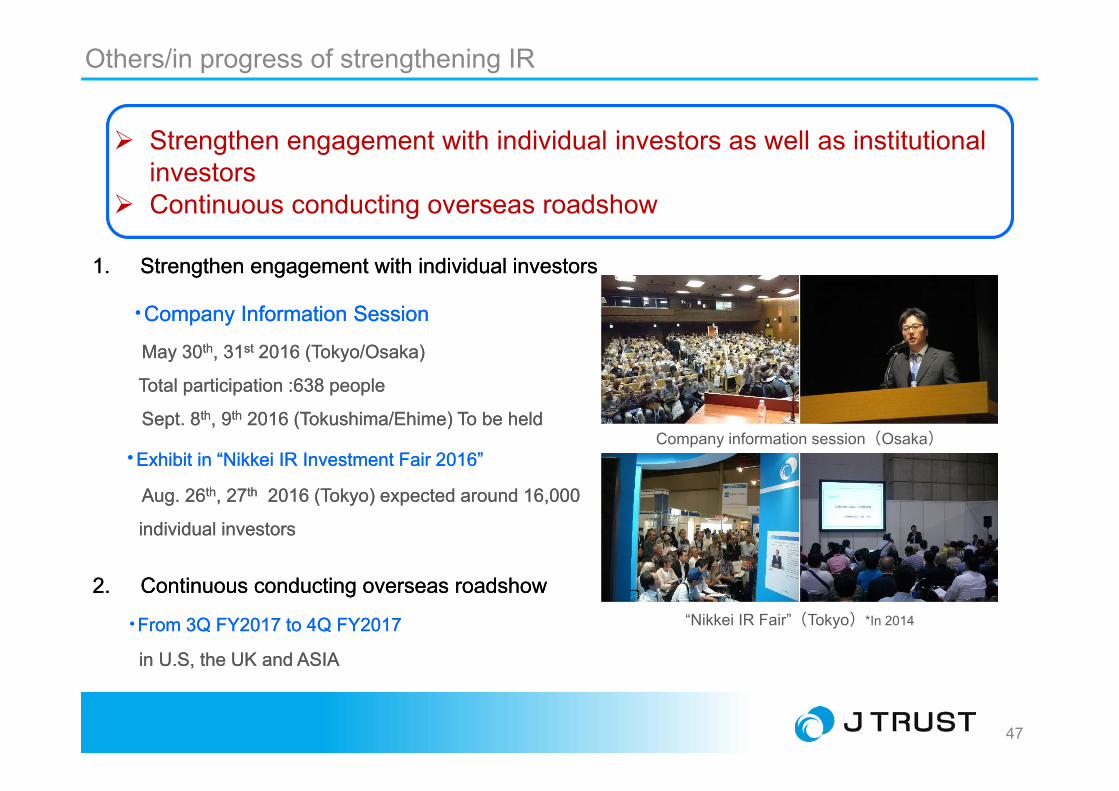
Others/in progress of strengthening IR
Strengthen engagement with individual investors as well as institutional investors
Continuous conducting overseas roadshow
1. Strengthen engagement with individual investors
・Company Information Session
May 30th, 31st 2016 (Tokyo/Osaka)
Total participation :638 people
Sept. 8th, 9th 2016 (Tokushima/Ehime) To be held
・Exhibit in “Nikkei IR Investment Fair 2016”
Aug. 26th, 27th 2016 (Tokyo) expected around 16,000
individual investors
2. Continuous conducting overseas roadshow
・From 3Q FY2017 to 4Q FY2017
in U.S, the UK and ASIA
2. Continuous conducting overseas roadshow
・From 3Q FY2017 to 4Q FY2017
in U.S, the UK and ASIA
Company information session(Osaka)
“Nikkei IR Fair”(Tokyo)*In 2014

48
Others/Our dividend policy
Paying dividend with 8 consecutive years Will pay dividend of 12 yen this fiscal year
Dividend
First half: 6 yen per share
Second half: 6 yen (plan)
・will add 2 yen dividend compared with the previous
year
※previous yearʼs dividend was included commemorative (2yen)
Dividend
First half: 6 yen per share
Second half: 6 yen (plan)
・will add 2 yen dividend compared with the previous
year
※previous yearʼs dividend was included commemorative (2yen)
12 3 3
5 5 56
1.5
43
34
5 5 5
6
2
2009.03 2010.03 2011.03 2012.03 2013.03 2014.03 2015.03 2016.03 2017.03(予定)
Change in dividendEnd of the year Mid-Term

49
APPENDIX

50
187
183
203
174
747
191
0
100
200
300
400
500
600
700
800
2016/031Q
2Q 3Q 4QTOTAL
2017/031Q
Operating revenue
-18
22 22
-21
33
28
-50
-40
-30
-20
-10
0
10
20
30
2016/031Q
2Q 3Q 4QTOTAL
2017/031Q
Operating profit
Under IFRS (unaudited)(in 100 million yen)
Overview of Financial Result for 1st Quarter/Consolidated summary (progress in quarterly)

51
1Q FY2016 1Q FY2017 Difference
Operating revenue 187 191 +4
Operating profit -18 22 +40
Profit attributable toowners of parent -19 1 +20
Under IFRS (unaudited)
(in 100 million yen)
Overview of Financial Result for 1st Quarter/Consolidated summary (compared with the period of FY2016)
52
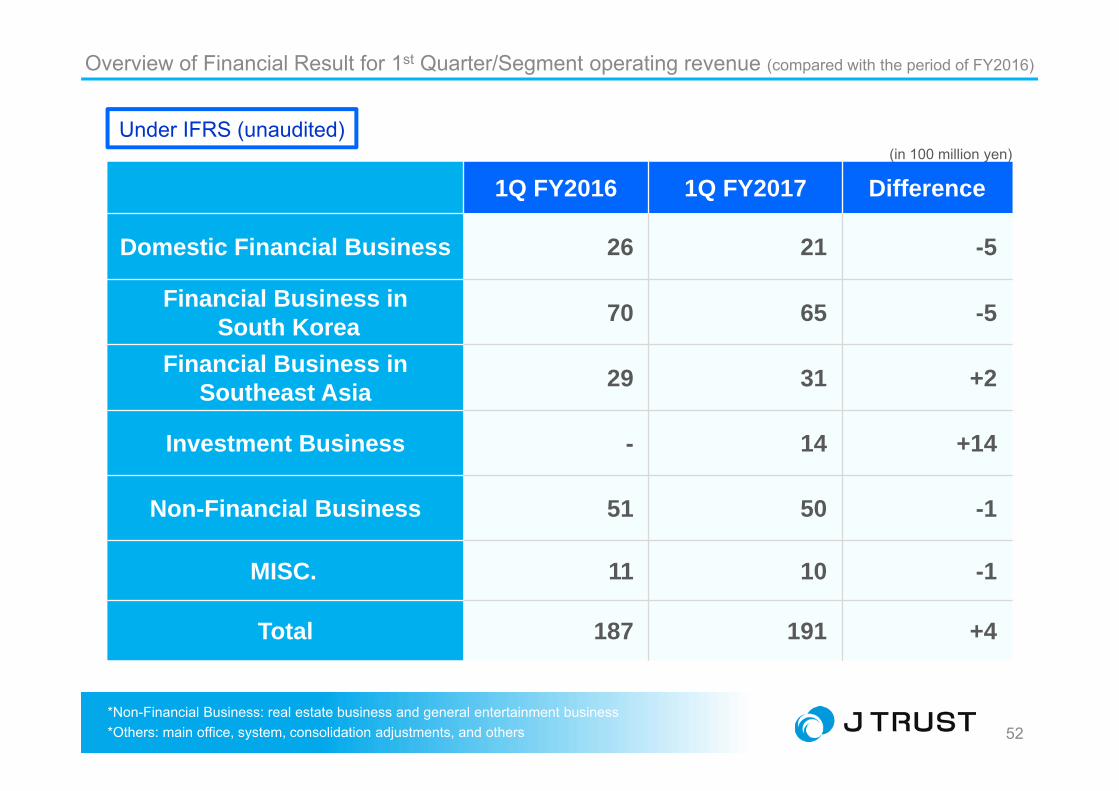
1Q FY2016 1Q FY2017 Difference
Domestic Financial Business 26 21 -5
Financial Business inSouth Korea 70 65 -5
Financial Business in Southeast Asia 29 31 +2
Investment Business - 14 +14
Non-Financial Business 51 50 -1
MISC. 11 10 -1
Total 187 191 +4
*Non-Financial Business: real estate business and general entertainment business *Others: main office, system, consolidation adjustments, and others
Under IFRS (unaudited)(in 100 million yen)
Overview of Financial Result for 1st Quarter/Segment operating revenue (compared with the period of FY2016)

53
1Q FY2016 1Q FY2017 Difference
Domestic Financial Business 11 11 ±0
Financial Business in South Korea -8 3 +11
Financial Business in Southeast Asia -5 1 +6
Investment Business - 13 +13
Non-Financial Business 1 1 ±0
MISC. -17 -7 +10
Total -18 22 +40
Under IFRS (unaudited)(in 100 million yen)
*Non-Financial Business: Real estate business and General entertainment business *MISC: main office, system, consolidation adjustments, and others
Overview of Financial Result for 1st Quarter/Segment operating profit (compared with the period of FY2016)

54
EBITDA after adjustment
1 2
42 45 58
134 156
-13 4
22
-40
-20
0
20
40
60
80
100
120
140
160
180
2008/03 2009/03 2010/03 2011/03 2012/03 2013/03 2014/03 2015/03 2016/03 2017/03
88*
*Simply multiplied by 4 of the numerical number for 1Q FY2017
(in 100 million yen)

55
Other comprehensive income
Other comprehensive income FY2016 FY2017
Valuation difference on available-for-sale securities 136 4,865
Foreign currency translation adjustment -3,469 -10,793
Remeasurements of defined benefit plans -112 -99
Total accumulated other comprehensive income -3,445 -6,027
Under J-GAAP(in million yen)

56