atelier méthodes quantitatives en environnement ... · atelier méthodes quantitatives en...
TRANSCRIPT
Atelier Méthodes quantitatives en environnement :
ModélisationRetroactions interdisciplinaires
David Claessen, Michael Ghil, Pietro Peterlongo
Problématique
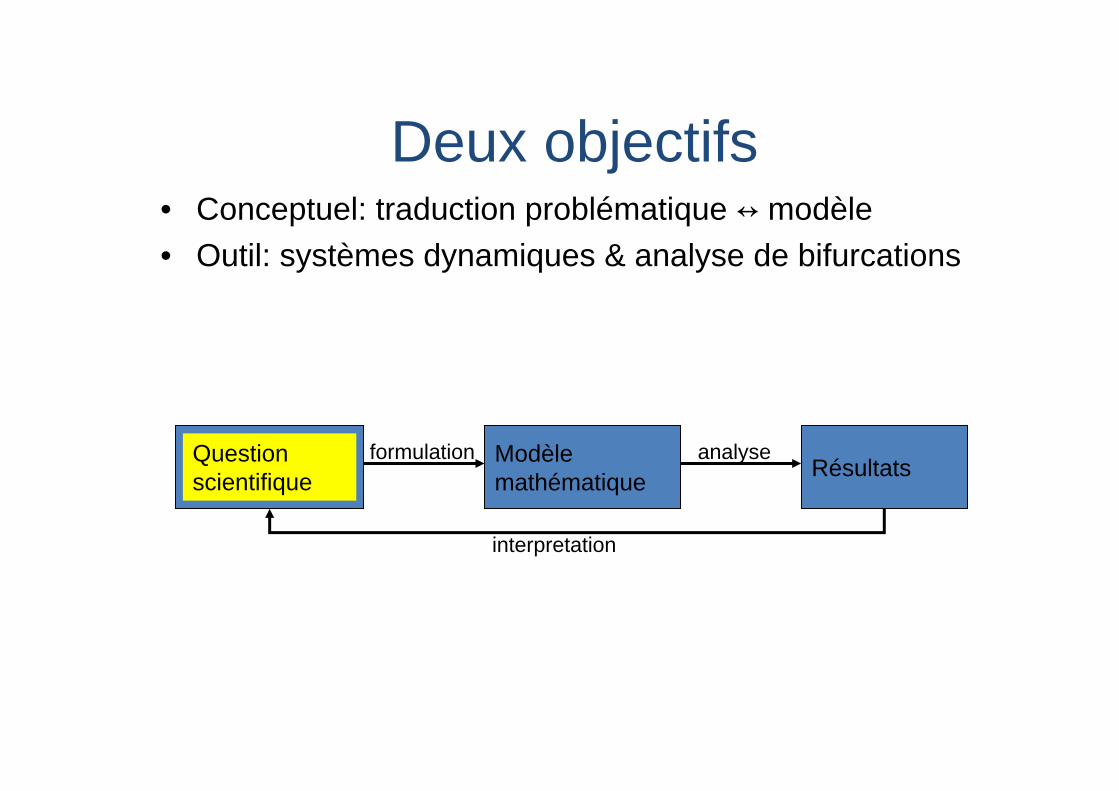
Deux objectifs• Conceptuel: traduction problématique ↔ modèle• Outil: systèmes dynamiques & analyse de bifurcations
Modèle mathématique Résultats
interpretation
formulation analyseQuestion scientifique
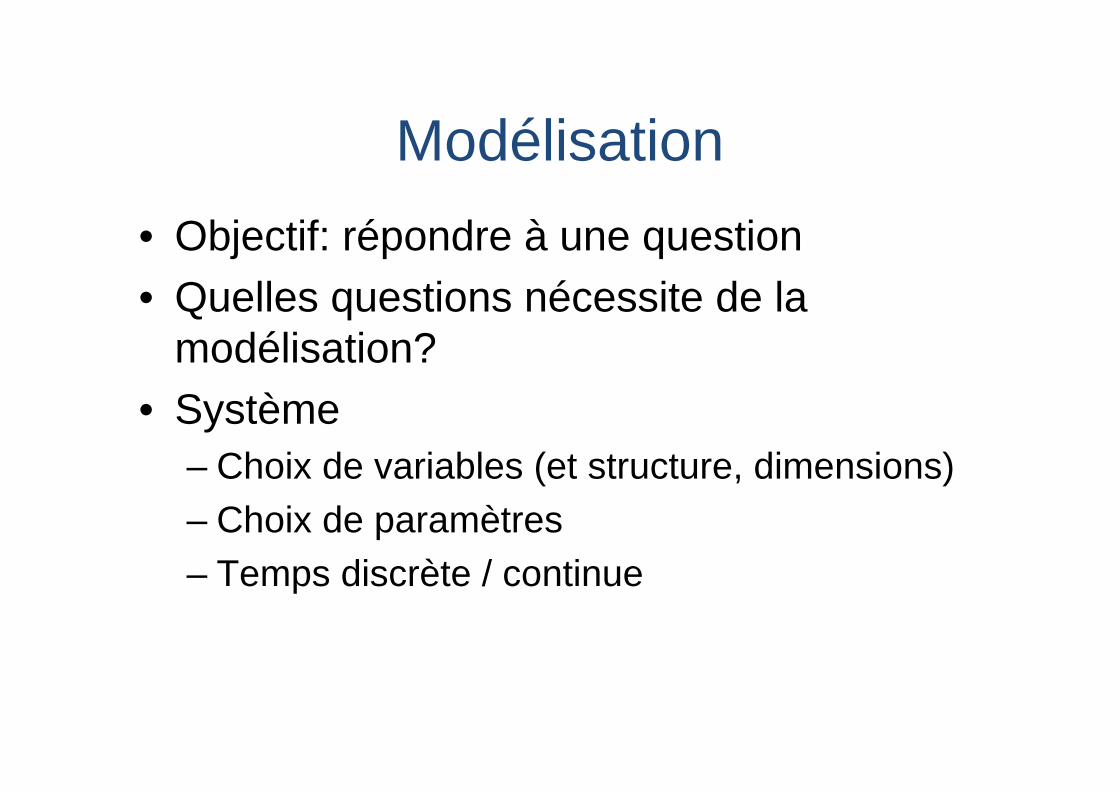
Modélisation• Objectif: répondre à une question• Quelles questions nécessite de la
modélisation?• Système
– Choix de variables (et structure, dimensions)– Choix de paramètres– Temps discrète / continue
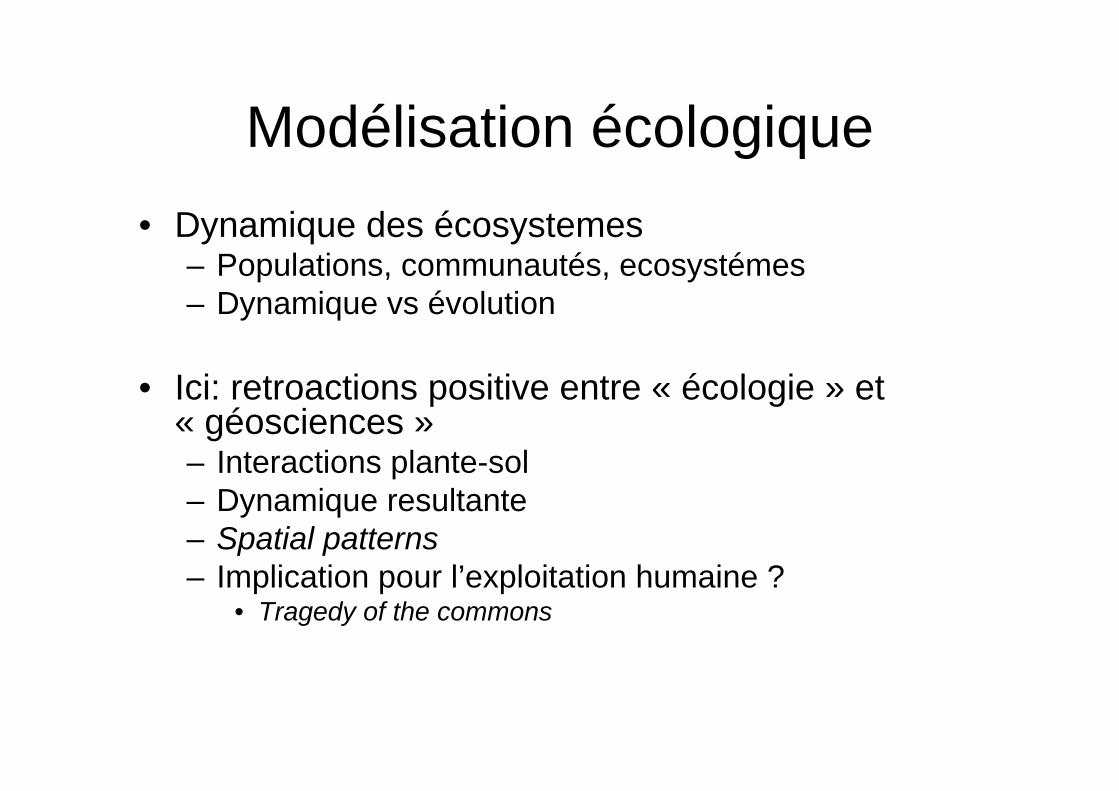
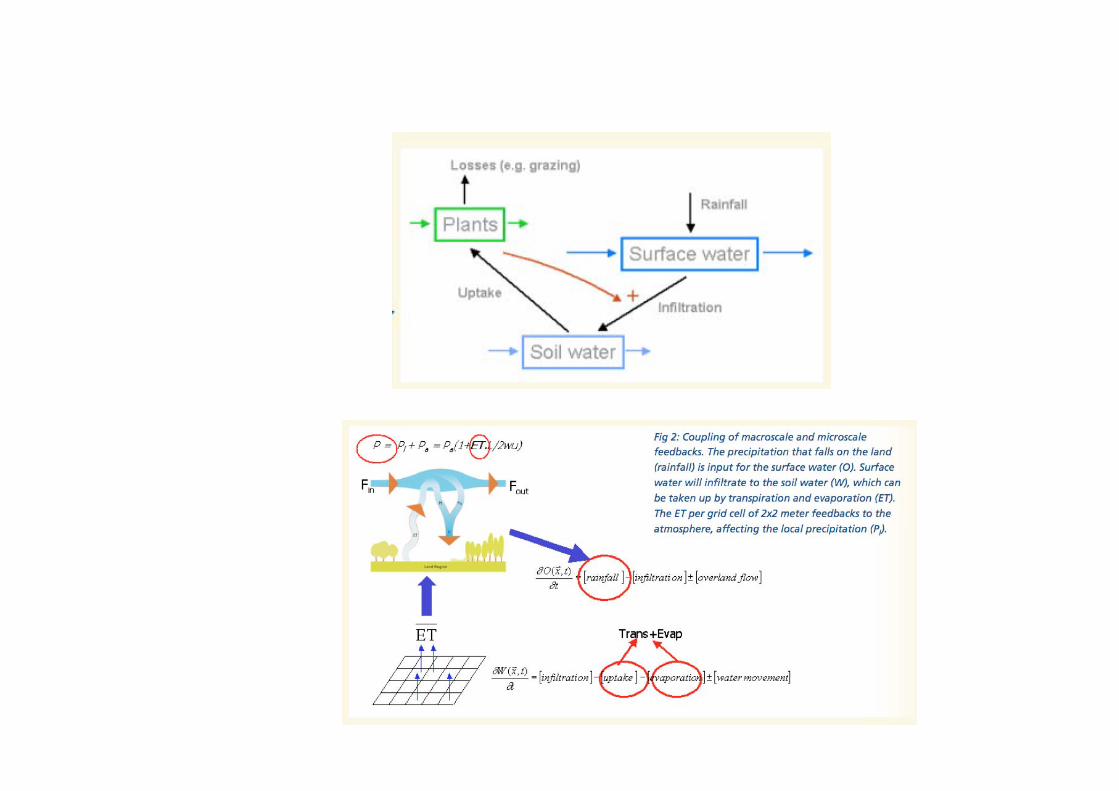
Modélisation écologique• Dynamique des écosystemes
– Populations, communautés, ecosystémes– Dynamique vs évolution
• Ici: retroactions positive entre « écologie » et « géosciences »– Interactions plante-sol– Dynamique resultante– Spatial patterns– Implication pour l’exploitation humaine ?
• Tragedy of the commons
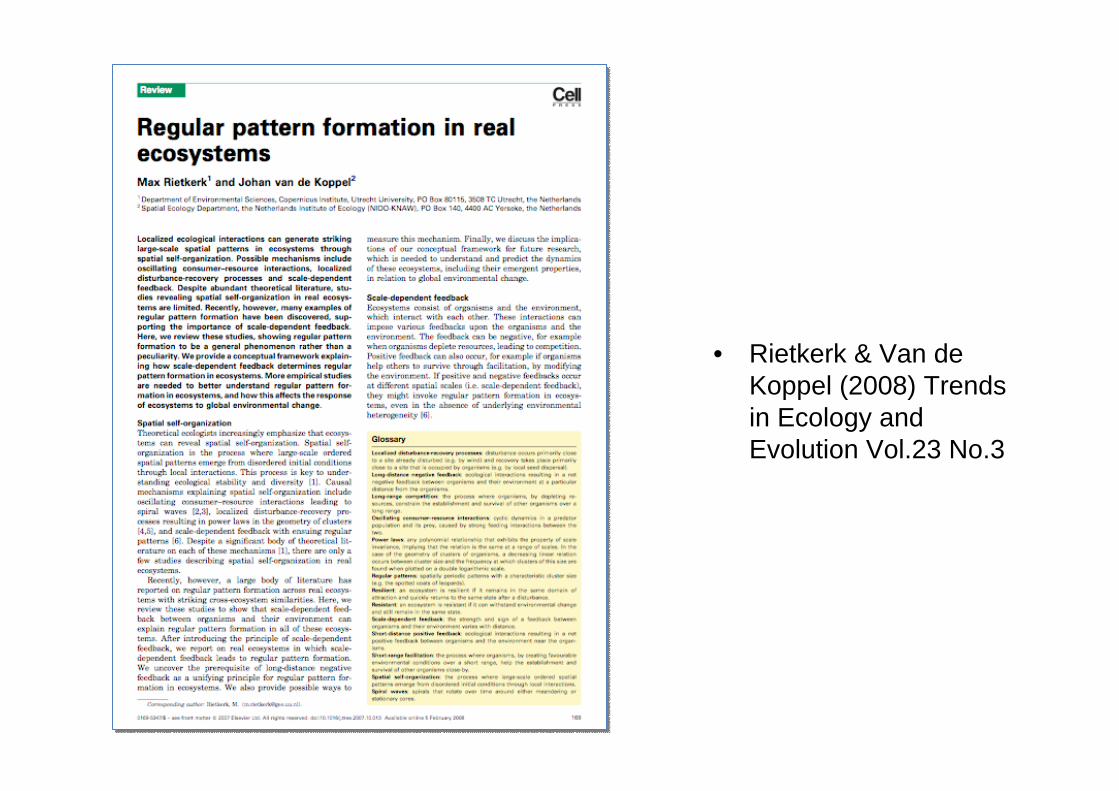
• Rietkerk & Van de Koppel (2008) Trends in Ecology and Evolution Vol.23 No.3
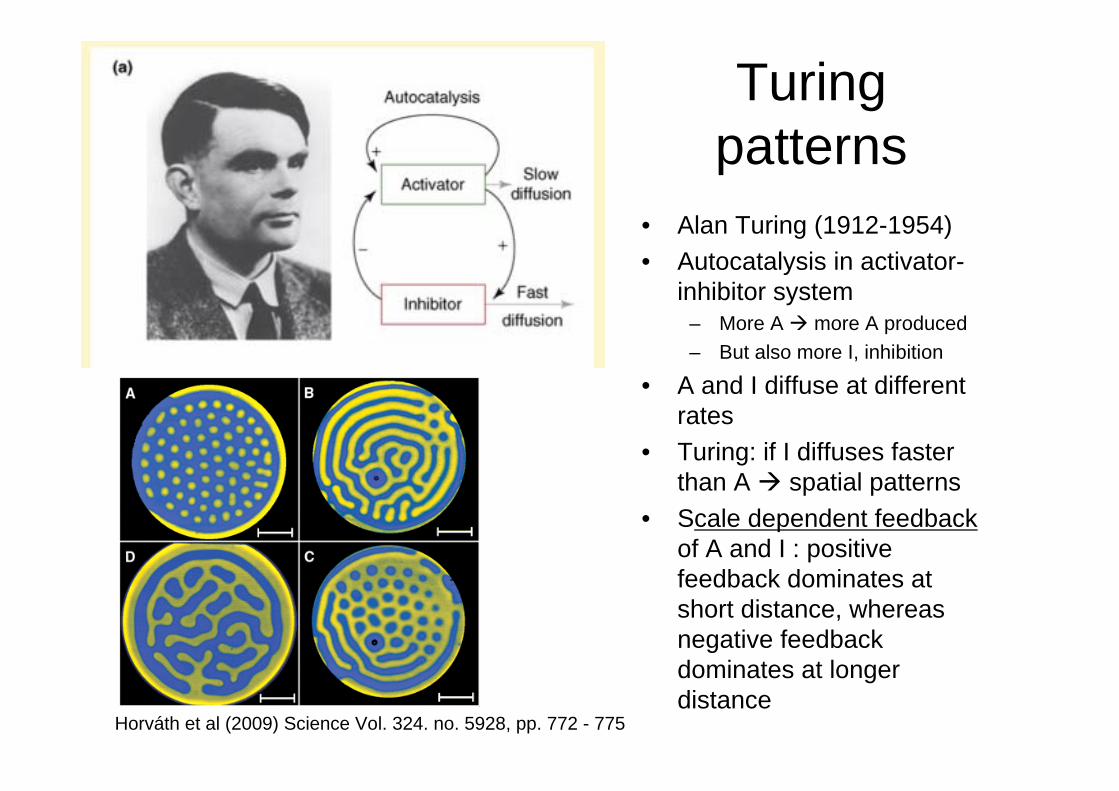
Turing patterns
• Alan Turing (1912-1954)• Autocatalysis in activator-
inhibitor system– More A more A produced– But also more I, inhibition
• A and I diffuse at different rates
• Turing: if I diffuses faster than A spatial patterns
• Scale dependent feedback of A and I : positive feedback dominates at short distance, whereas negative feedback dominates at longer distance
Horváth et al (2009) Science Vol. 324. no. 5928, pp. 772 - 775
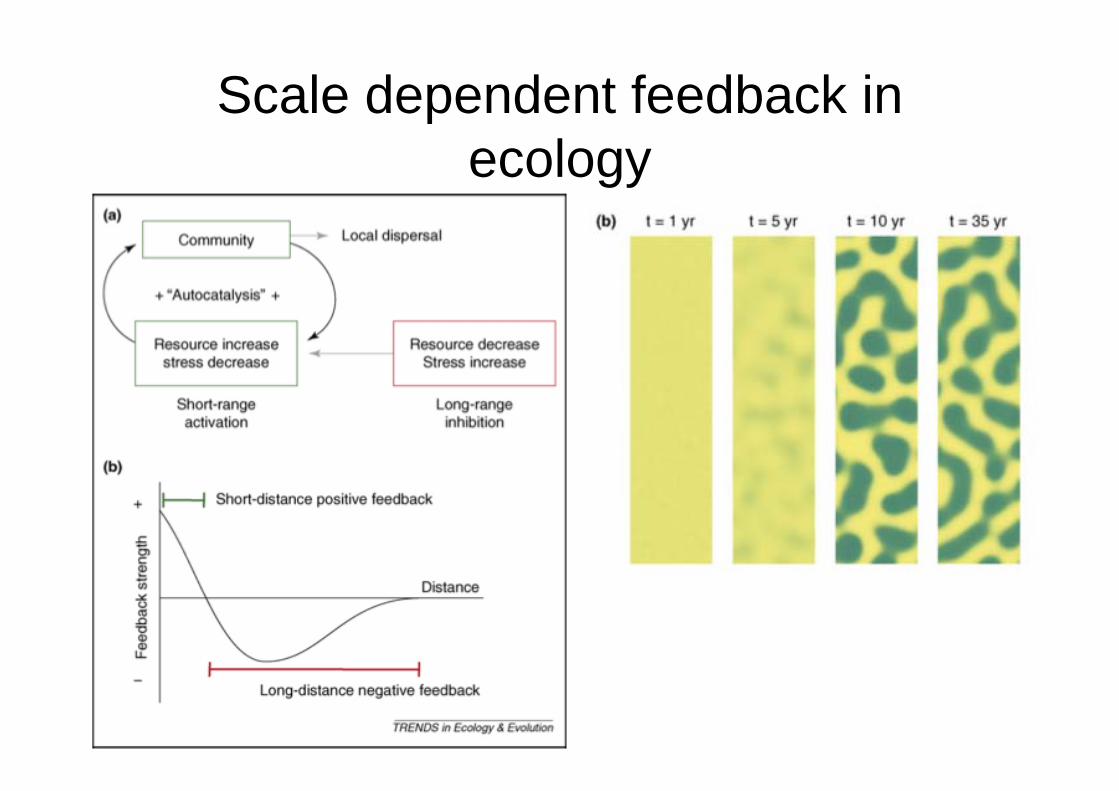
Scale dependent feedback in ecology
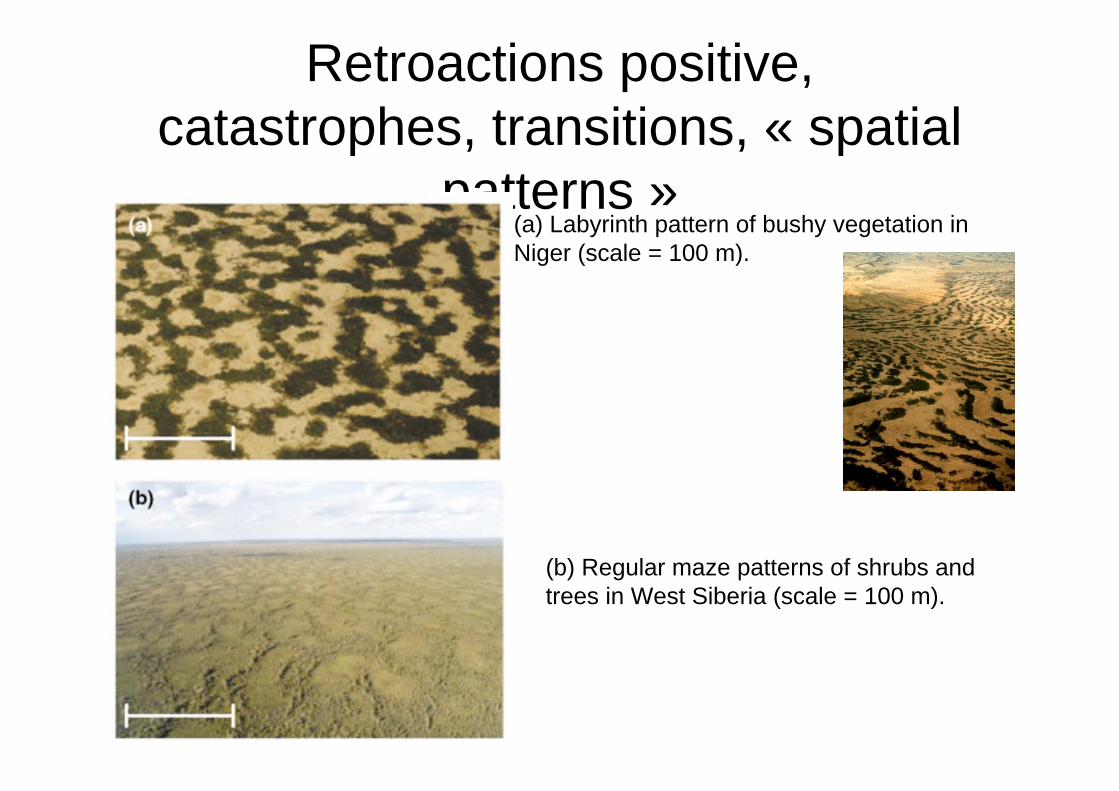
Retroactions positive, catastrophes, transitions, « spatial
patterns »(a) Labyrinth pattern of bushy vegetation in Niger (scale = 100 m).
(b) Regular maze patterns of shrubs and trees in West Siberia (scale = 100 m).
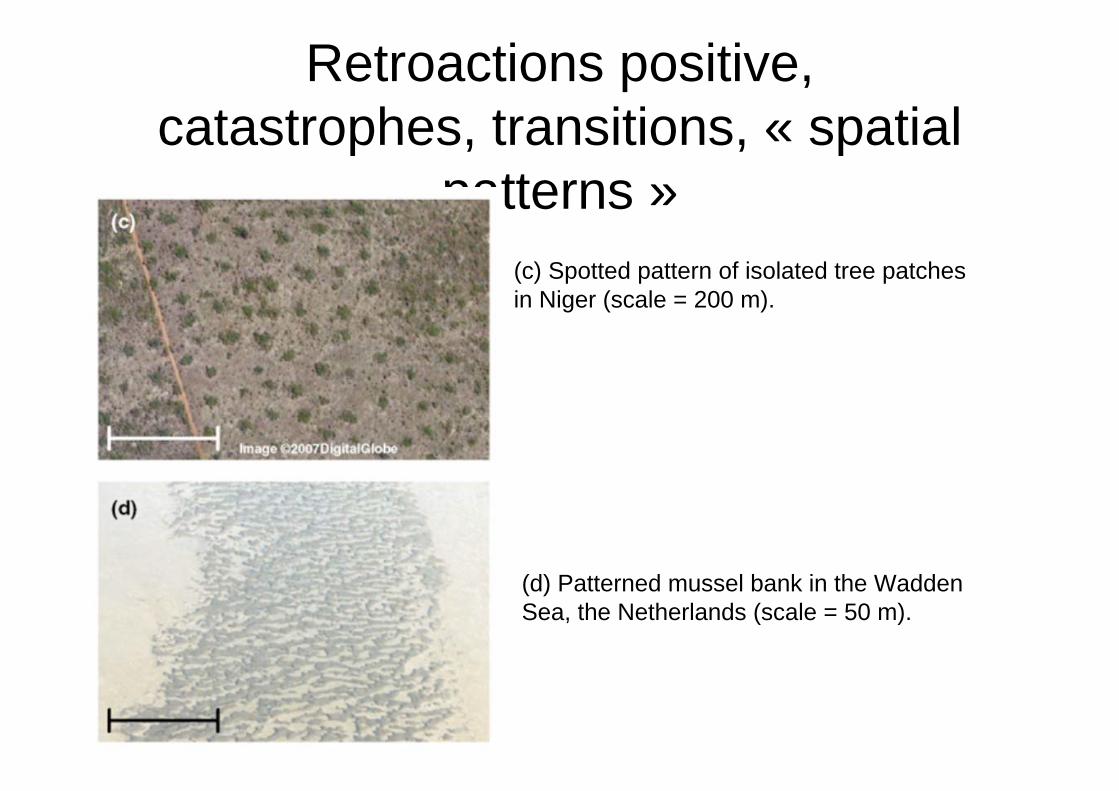
Retroactions positive, catastrophes, transitions, « spatial
patterns »(c) Spotted pattern of isolated tree patches in Niger (scale = 200 m).
(d) Patterned mussel bank in the Wadden Sea, the Netherlands (scale = 50 m).
Retroactions positive, catastrophes, transitions, « spatial
patterns »
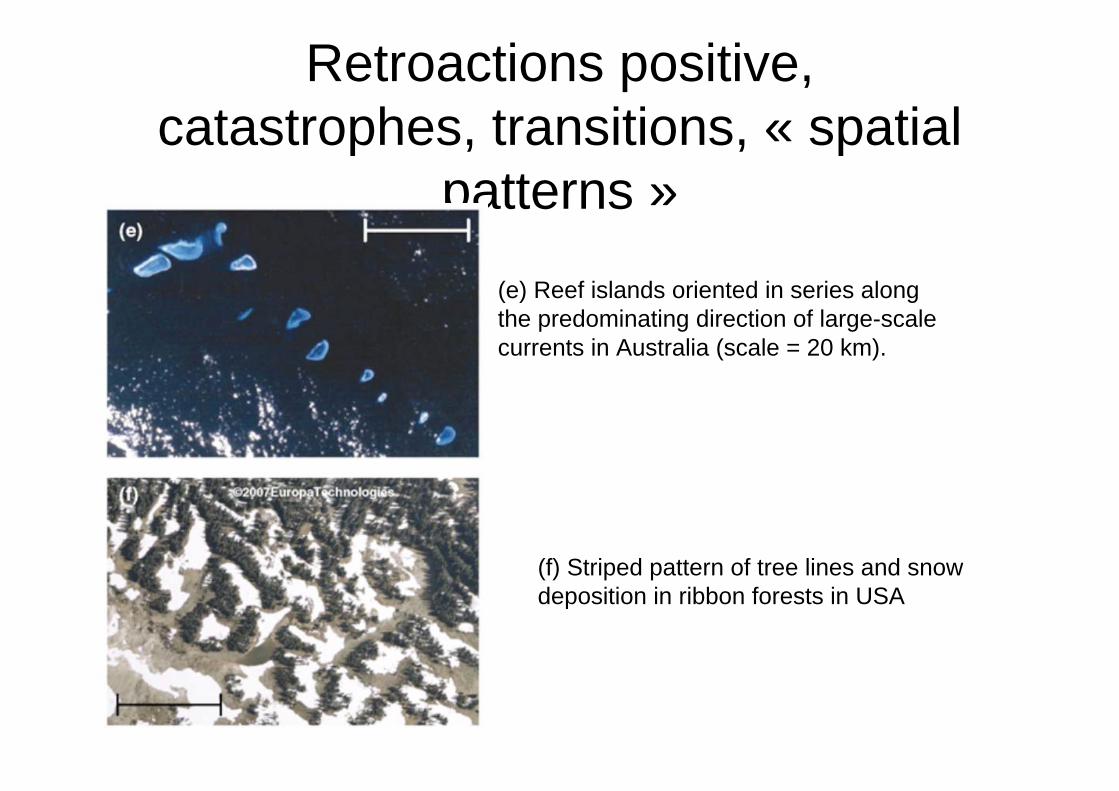
(e) Reef islands oriented in series along the predominating direction of large-scale currents in Australia (scale = 20 km).
(f) Striped pattern of tree lines and snow deposition in ribbon forests in USA
Retroactions positive, catastrophes, transitions, « spatial
patterns »
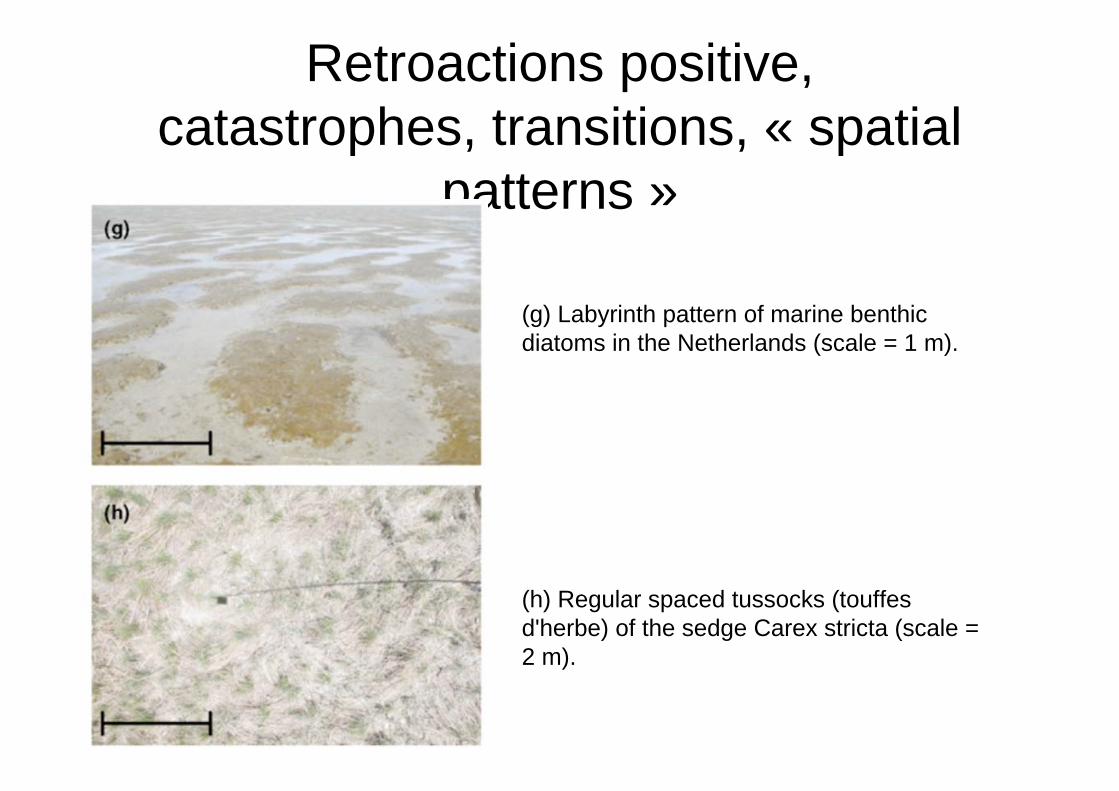
(g) Labyrinth pattern of marine benthic diatoms in the Netherlands (scale = 1 m).
(h) Regular spaced tussocks (touffes d'herbe) of the sedge Carex stricta (scale = 2 m).
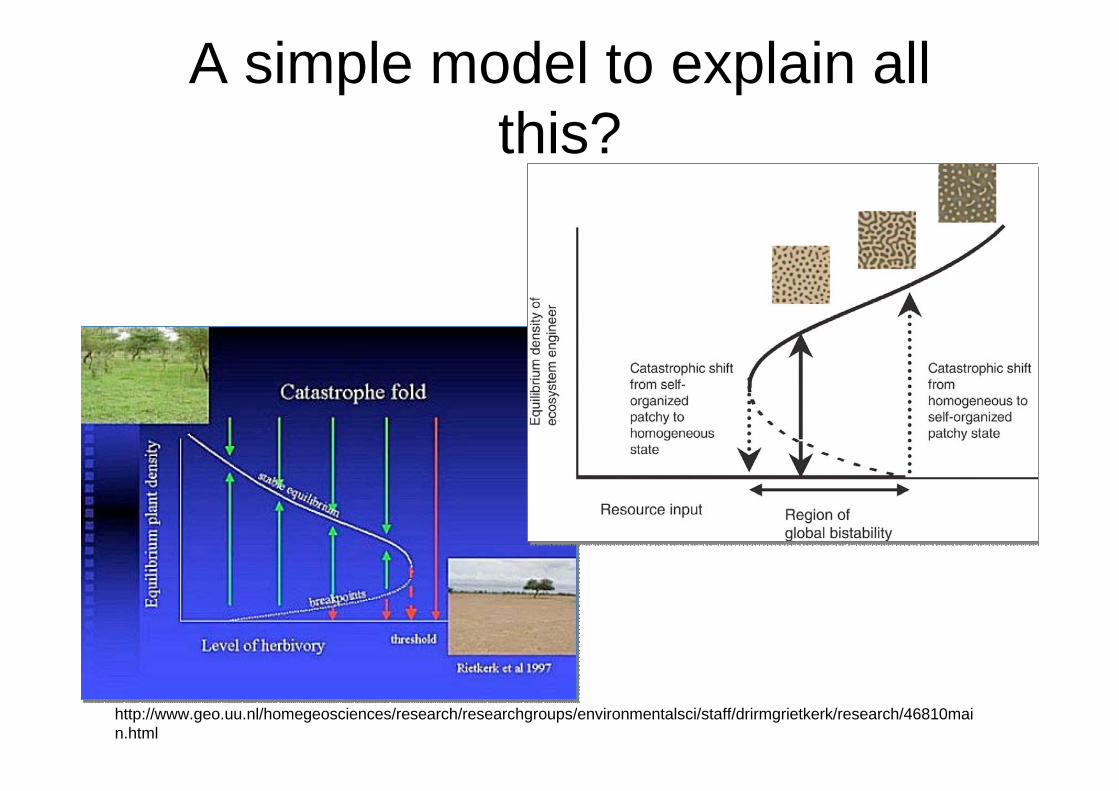
A simple model to explain all this?
http://www.geo.uu.nl/homegeosciences/research/researchgroups/environmentalsci/staff/drirmgrietkerk/research/46810main.html
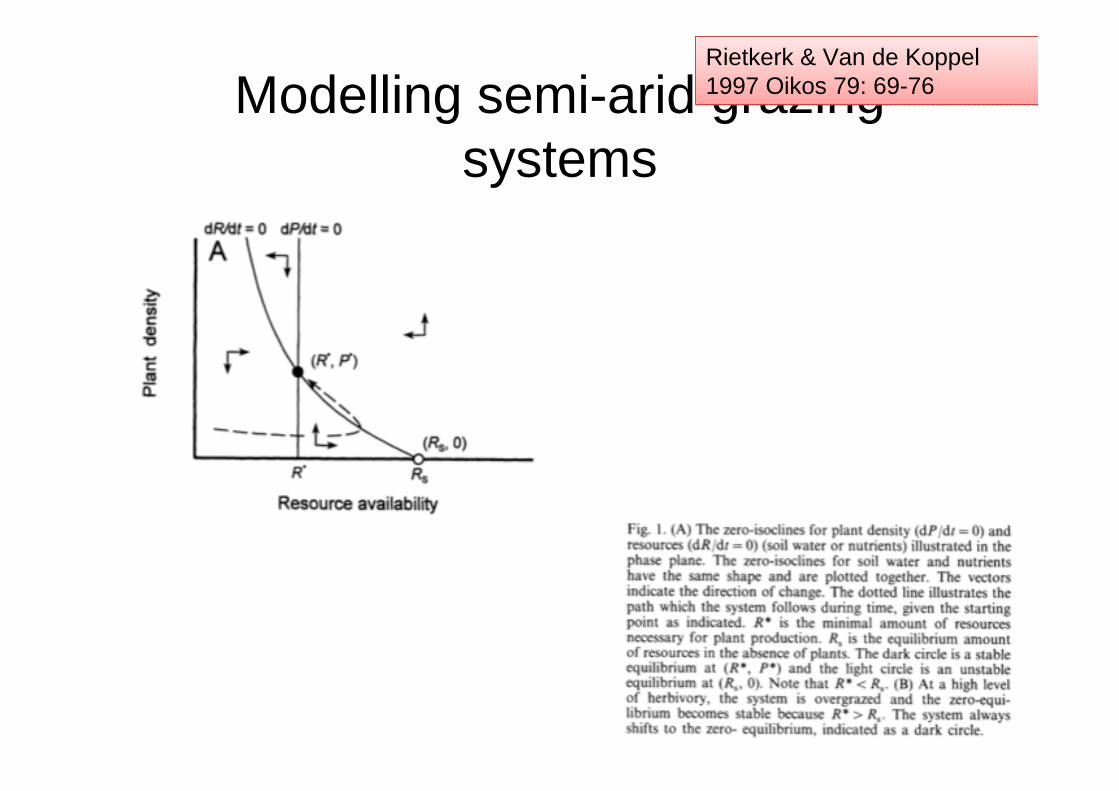
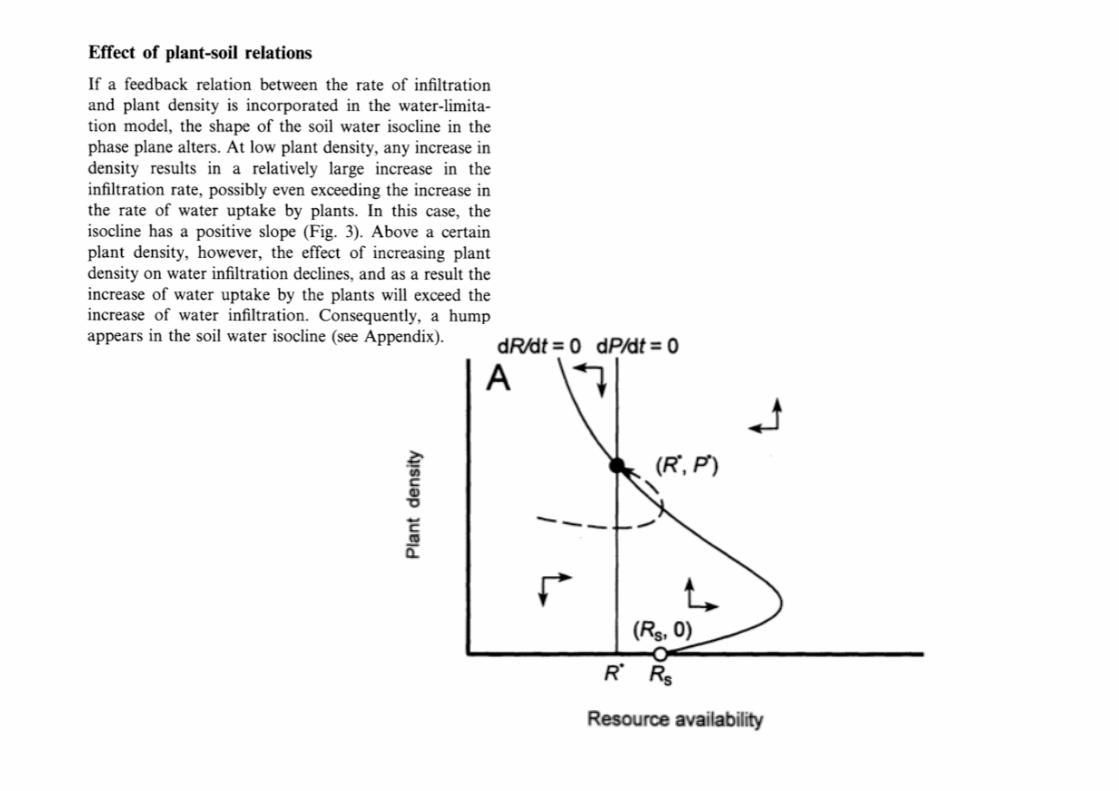
Modelling semi-arid grazing systems
Rietkerk & Van de Koppel 1997 Oikos 79: 69-76Rietkerk & Van de Koppel 1997 Oikos 79: 69-76
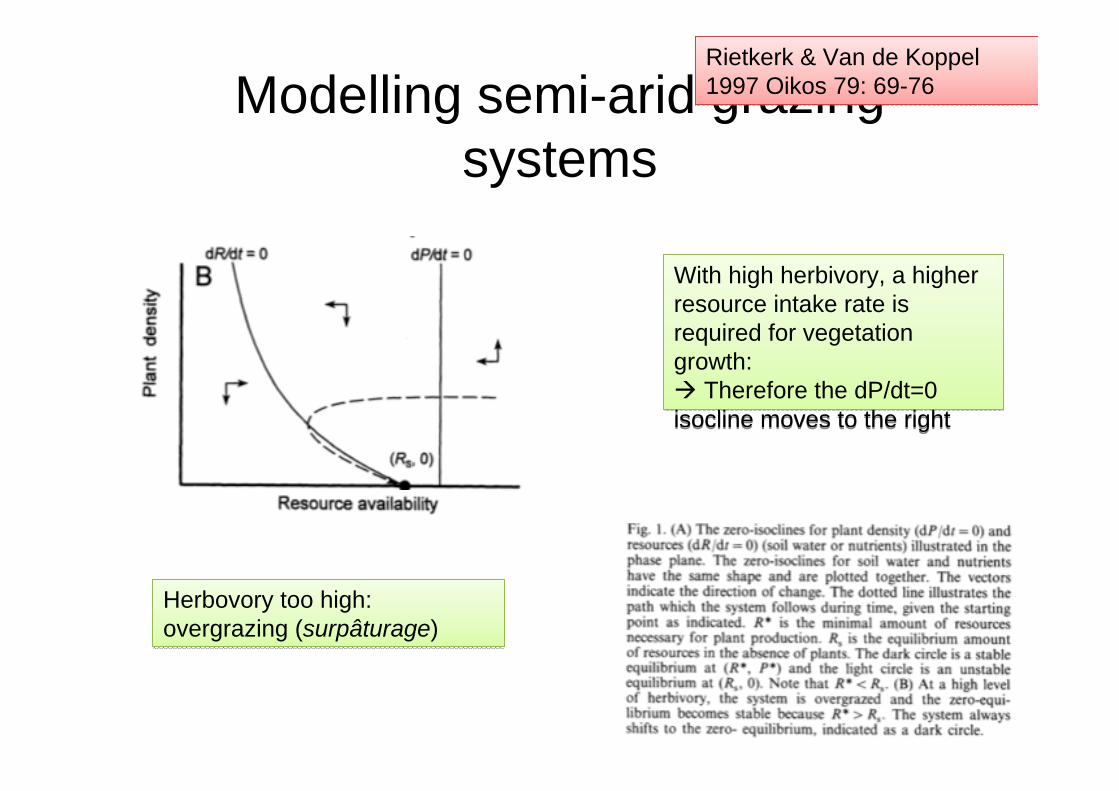
Modelling semi-arid grazing systems
Rietkerk & Van de Koppel 1997 Oikos 79: 69-76Rietkerk & Van de Koppel 1997 Oikos 79: 69-76
With high herbivory, a higher resource intake rate is required for vegetation growth:
Therefore the dP/dt=0 isocline moves to the right
With high herbivory, a higher resource intake rate is required for vegetation growth:
Therefore the dP/dt=0 isocline moves to the right
Herbovory too high: overgrazing (surpâturage)Herbovory too high: overgrazing (surpâturage)
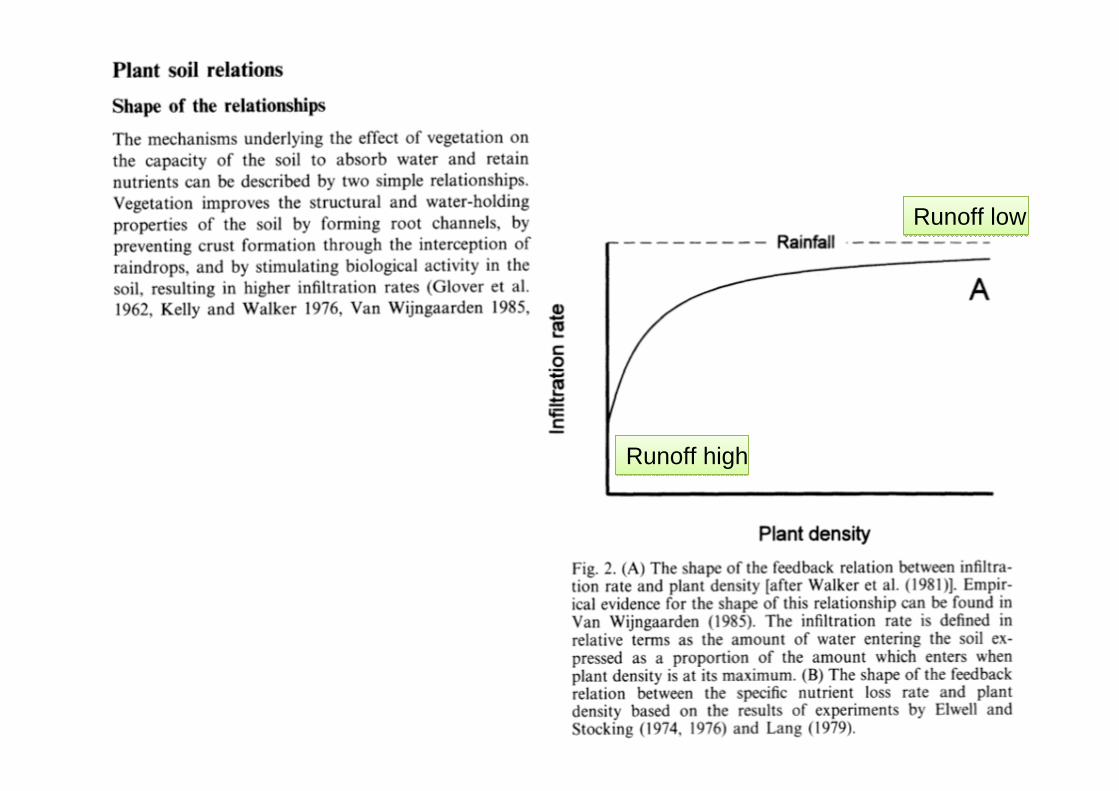
Runoff highRunoff high
Runoff lowRunoff low
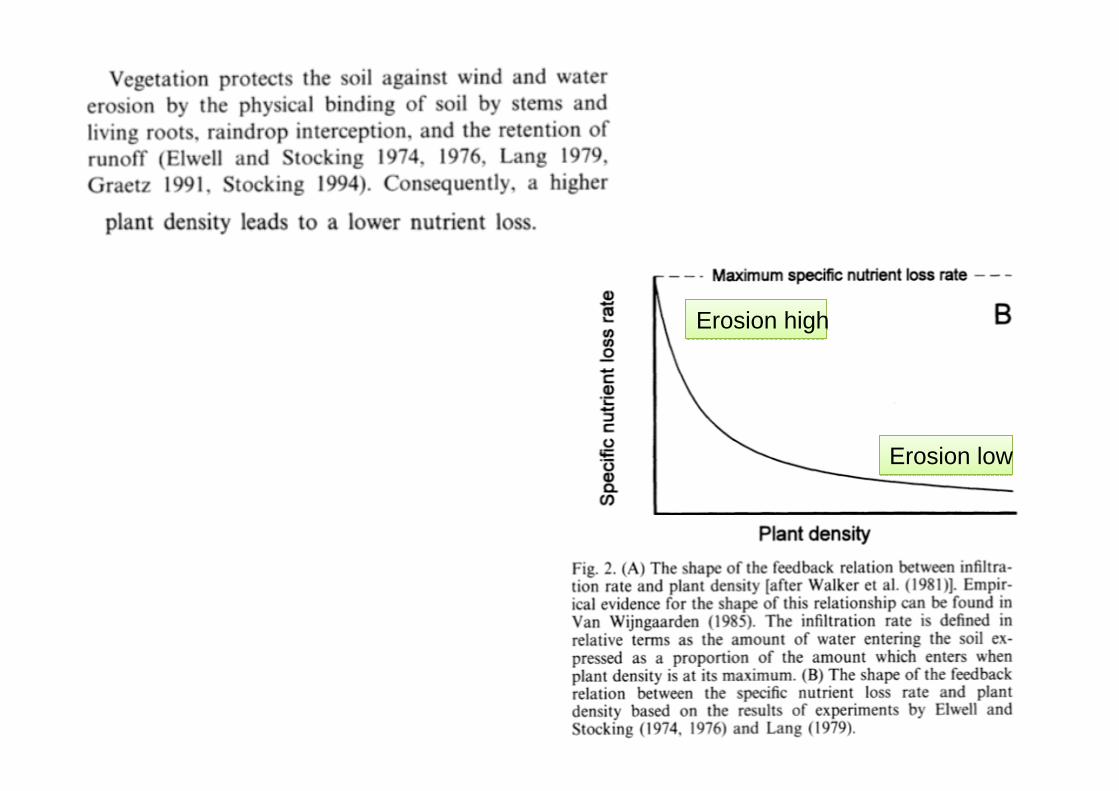
Erosion highErosion high
Erosion lowErosion low
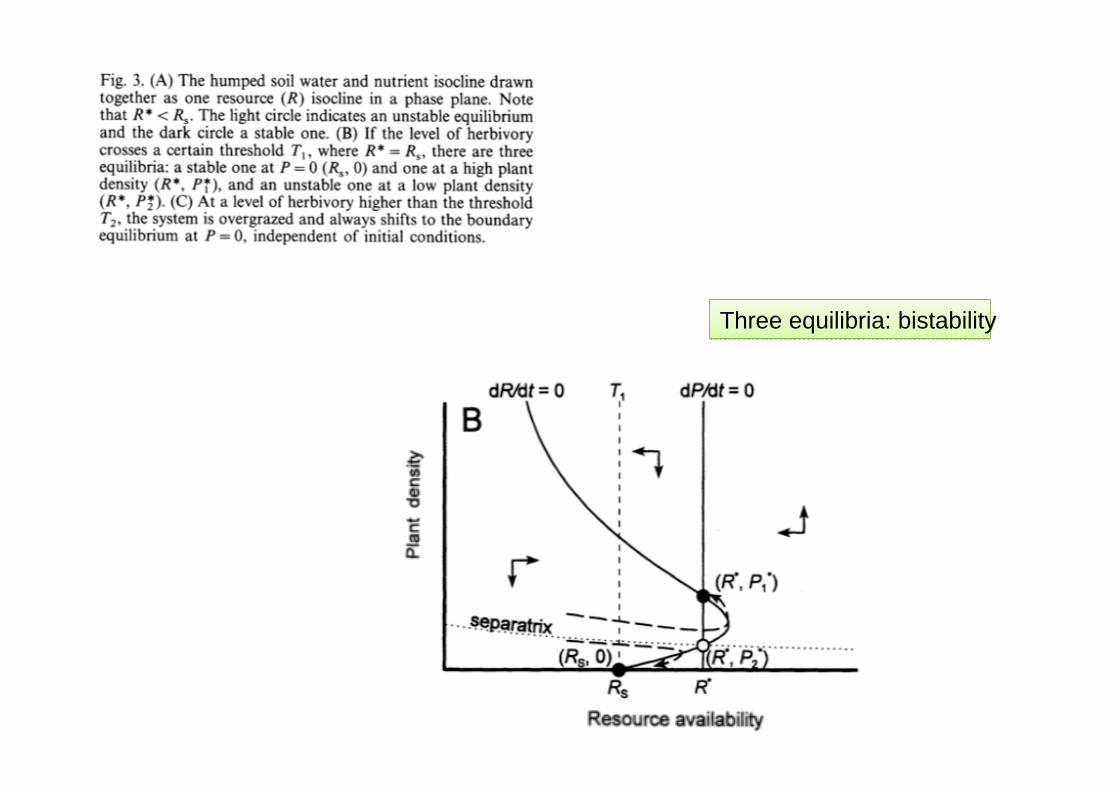
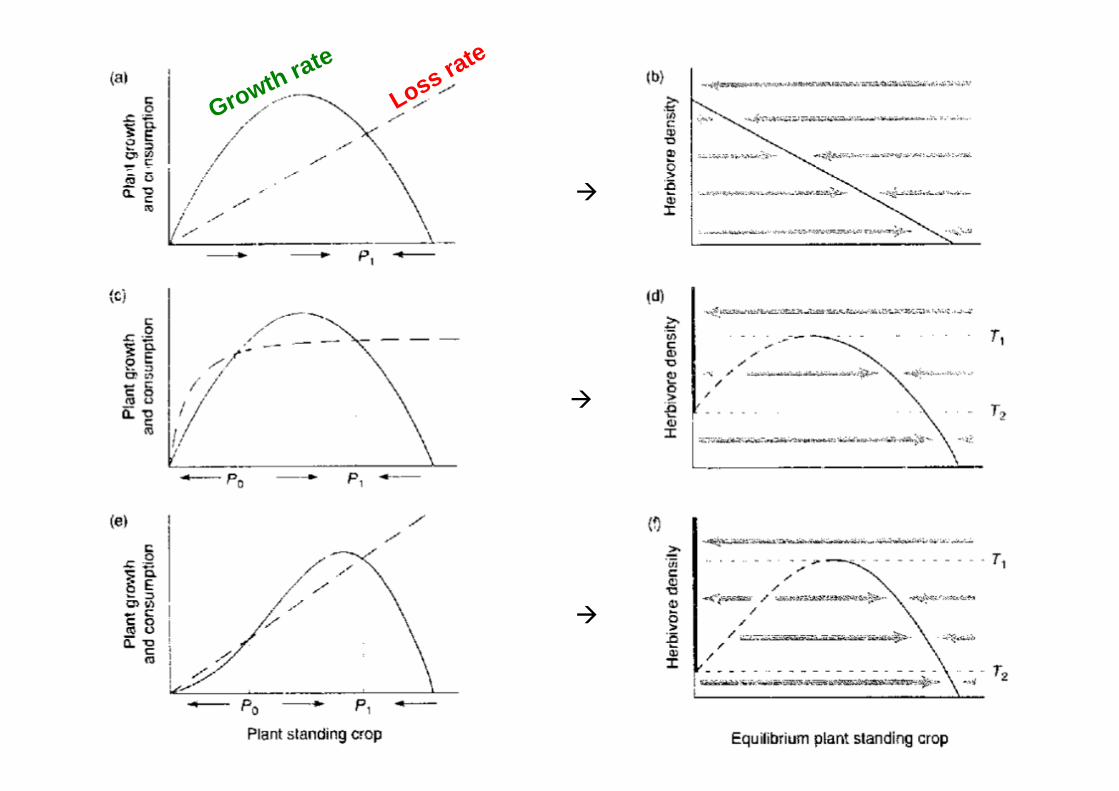
Three equilibria: bistabilityThree equilibria: bistability
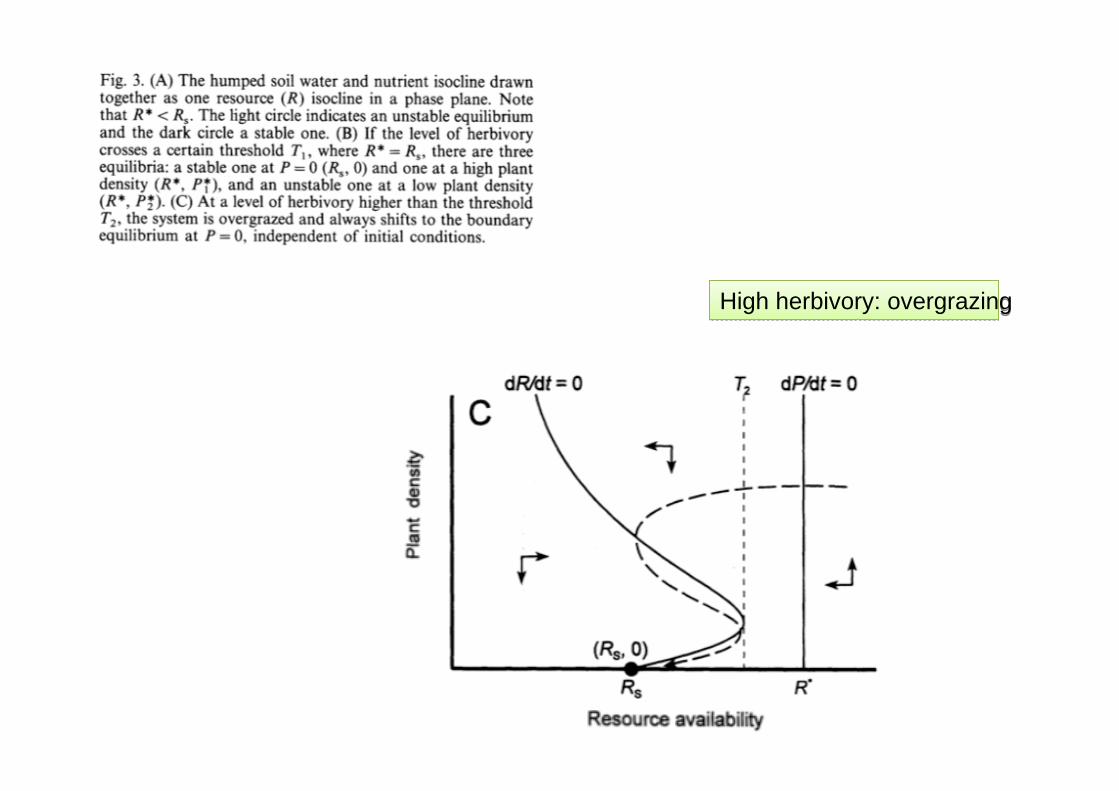
High herbivory: overgrazingHigh herbivory: overgrazing
• Van de Koppel, Rietkerk & Weissing (1997) TREE 12(9)
• Van de Koppel, Rietkerk & Weissing (1997) TREE 12(9)
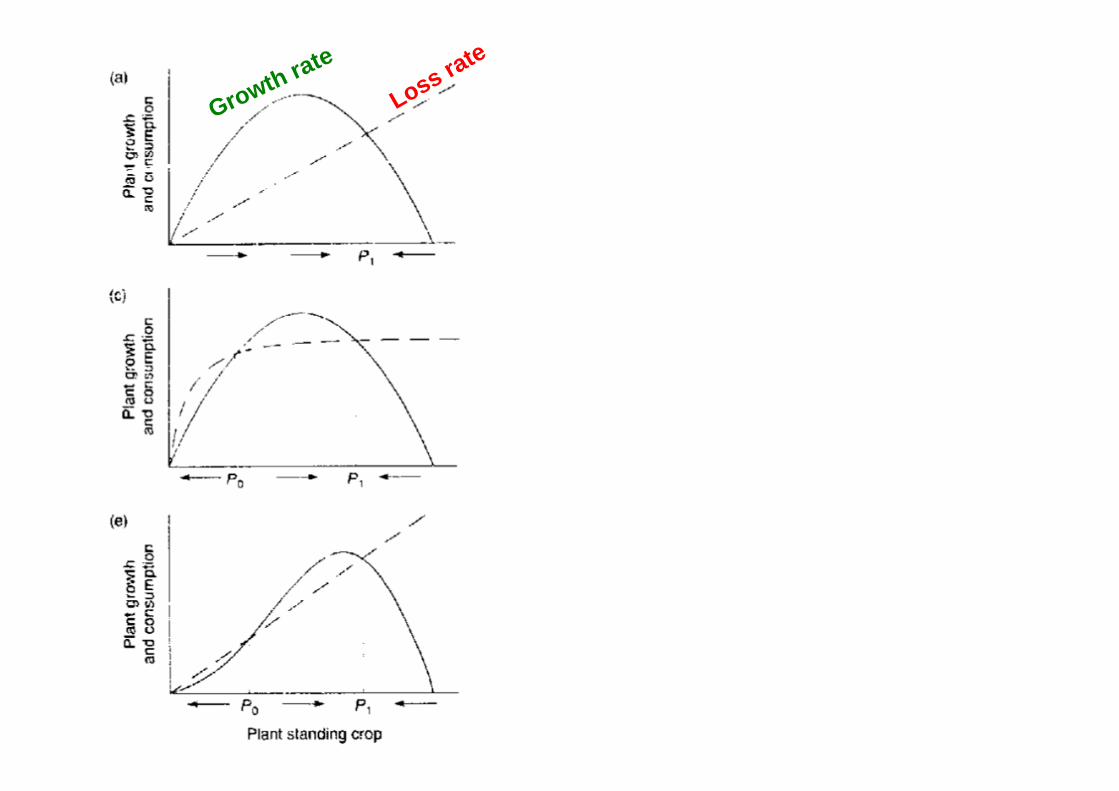
Loss rate
Growth rate
Loss rate
Growth rate
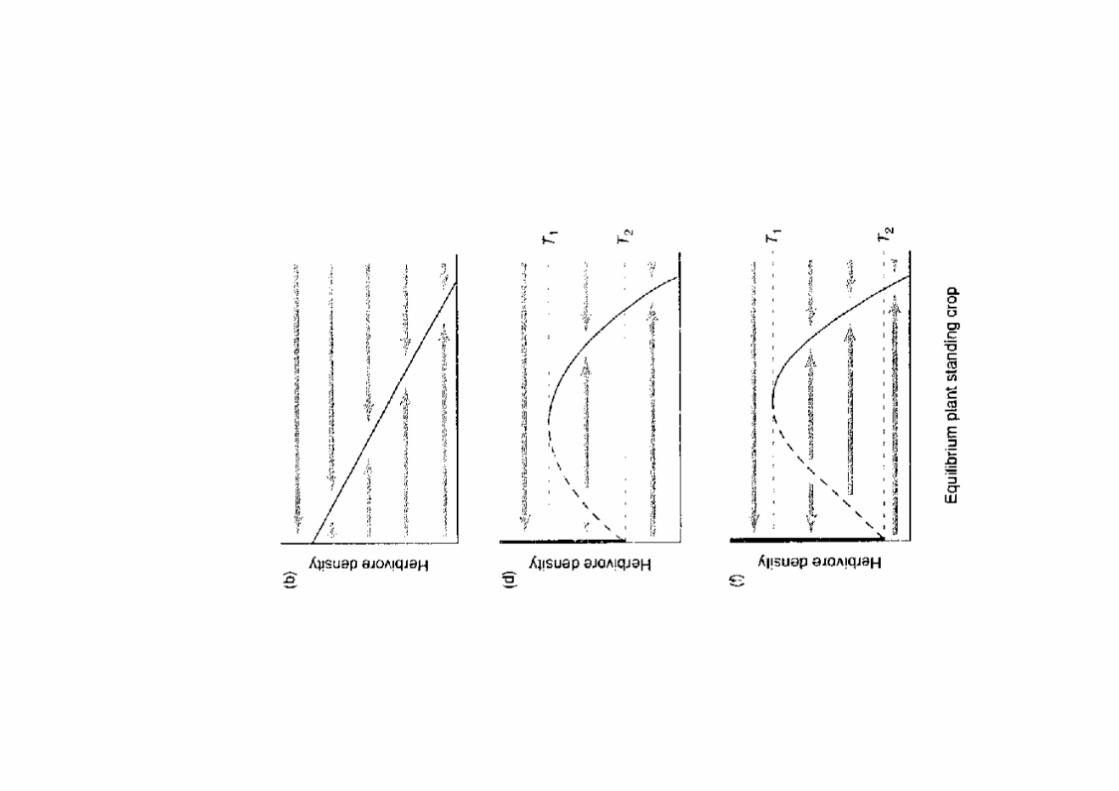
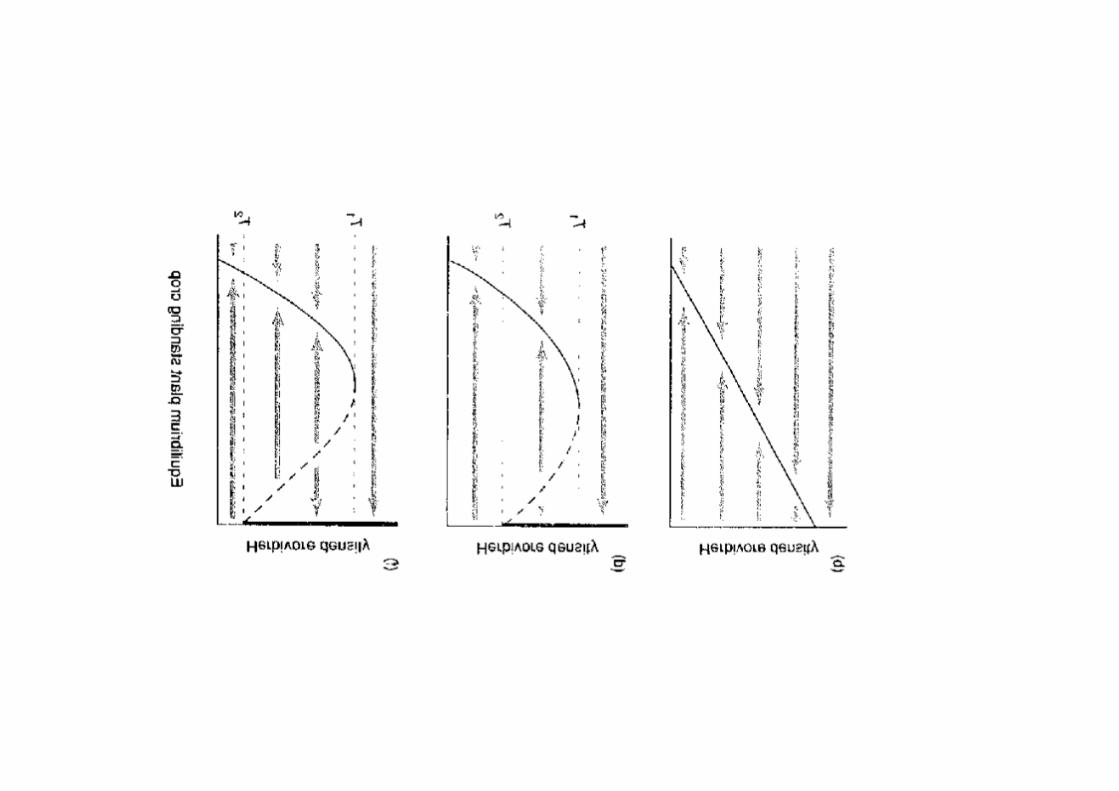
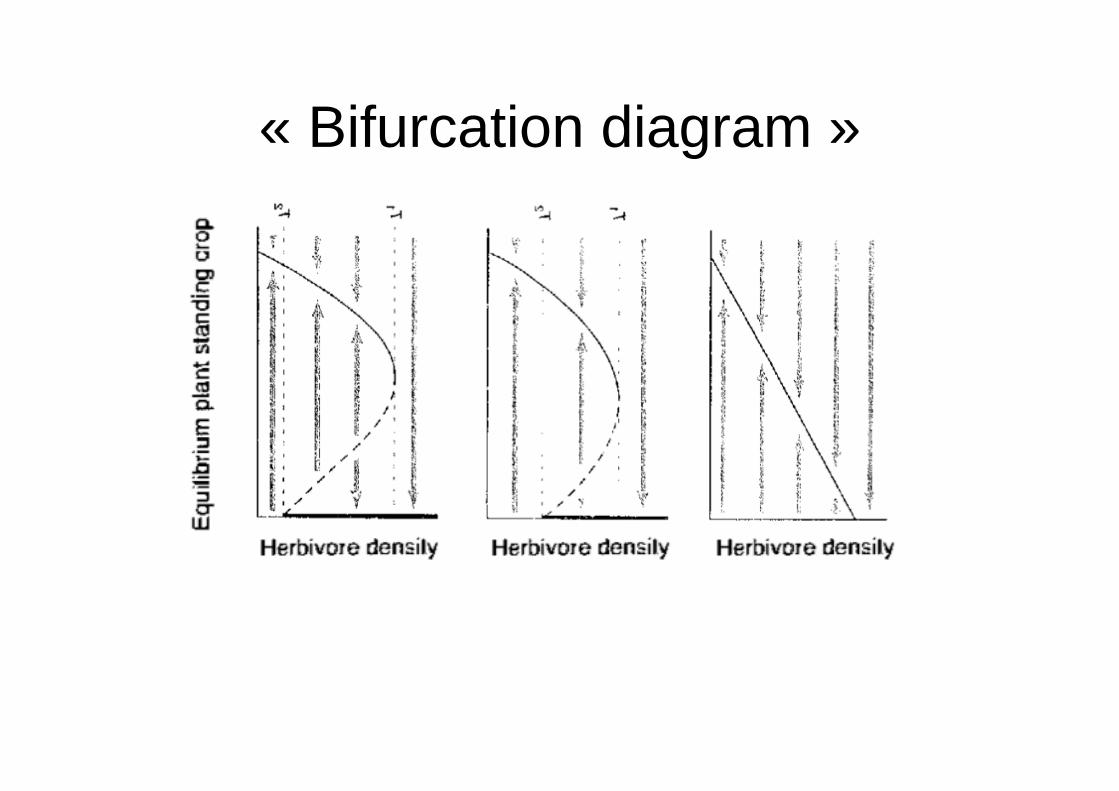
« Bifurcation diagram »
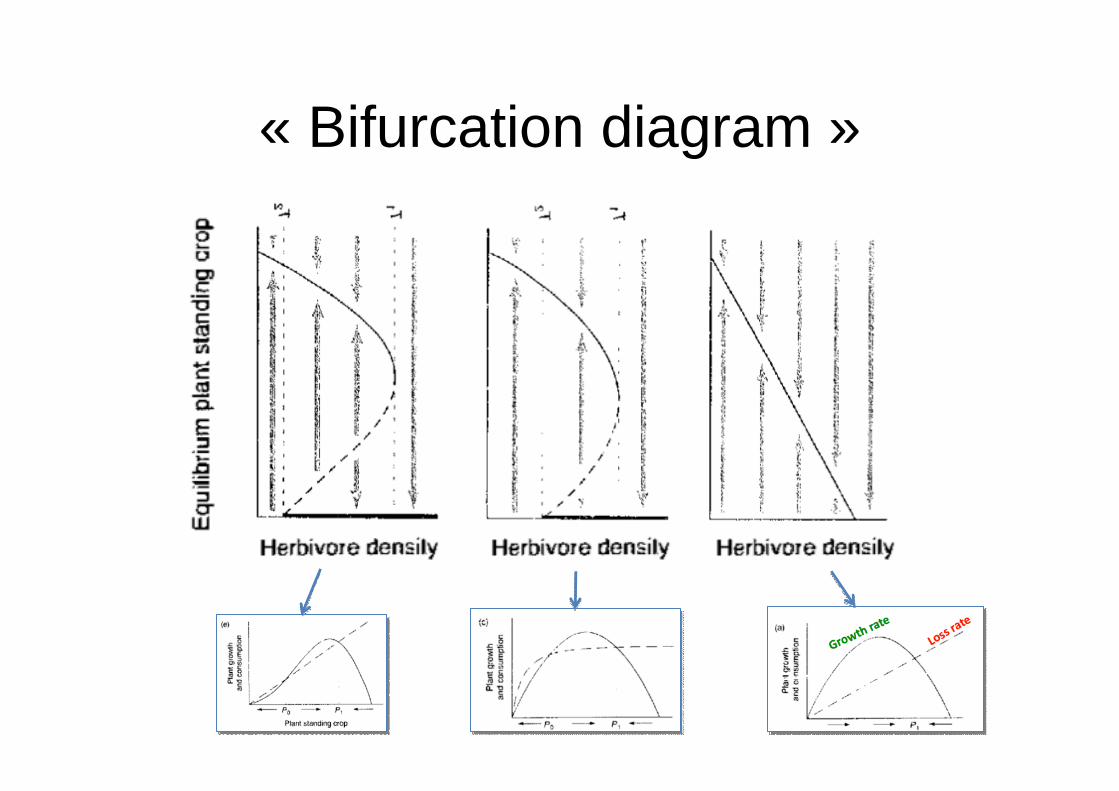
« Bifurcation diagram »