automatic characterization and segmentation of human skin using three-dimensional optical coherence...
TRANSCRIPT
Automatic characterization andsegmentation of human skin using
three-dimensional optical coherencetomography
Yasuaki Hori, Yoshiaki YasunoComputational Optics Group, Institute of Applied Physics, University of Tsukuba,
Tennodai 1-1-1, Ibaraki, Tsukuba, 305-8573, Japan
http://optics.bk.tsukuba.ac.jp/COG/
Shingo Sakai, Masayuki Matsumoto, Tomoko SugawaraKanebo Cosmetics Inc., 5-3-28 Kotobuki-Cho, Odawara, Kanagawa, Japan
Violeta Dimitrova Madjarova, Masahiro Yamanari, Shuichi MakitaComputational Optics Group, Institute of Applied Physics, University of Tsukuba,
Tennodai 1-1-1, Ibaraki, Tsukuba, 305-8573, Japan
Takeshi Yasui, Tsutomu ArakiDepartment of Mechanical Science and Bioengineering, Graduate School of Engineering
Science, Osaka University, Toyonaka, Osaka, 560-8531, Japan
Masahide Itoh, and Toyohiko YatagaiInstitute of Applied Physics, University of Tsukuba,Tennodai 1-1-1, Ibaraki, Tsukuba, 305-8573, Japan
Abstract: A set of fully automated algorithms that is specialized for ana-lyzing a three-dimensional optical coherence tomography (OCT) volume ofhuman skin is reported. The algorithm set first determines the skin surfaceof the OCT volume, and a depth-oriented algorithm provides the meanepidermal thickness, distribution map of the epidermis, and a segmentedvolume of the epidermis. Subsequently, an en face shadowgram is producedby an algorithm to visualize the infundibula in the skin with high contrast.The population and occupation ratio of the infundibula are provided by ahistogram-based thresholding algorithm and a distance mapping algorithm.En face OCT slices at constant depths from the sample surface are extracted,and the histogram-based thresholding algorithm is again applied to theseslices, yielding a three-dimensional segmented volume of the infundibula.The dermal attenuation coefficient is also calculated from the OCT vol-ume in order to evaluate the skin texture. The algorithm set examinesswept-source OCT volumes of the skins of several volunteers, and the re-sults show the high stability, portability and reproducibility of the algorithm.
© 2006 Optical Society of America
OCIS codes: (170.4500) Optical coherence tomography; (170.1870) Dermatology; (170.3880)Medical and biological imaging; (100.6950) Tomographic image processing; (110.4500) Opti-cal coherence tomography
#10151 - $15.00 USD Received 3 January 2006; revised 20 February 2006; accepted 27 February 2006
(C) 2006 OSA 6 March 2006 / Vol. 14, No. 5 / OPTICS EXPRESS 1862

References and links1. D. Huang and E. A. Swanson and C. P. Lin, J. S. Schuman, W. G. Stinson and W. Chang and M. R. Hee, T.
Flotte and K. Gregory and C. A. Puliafito and J. G. Fujimoto, “Optical coherence tomography,” Science 254,1178–1181 (1991).
2. J. Welzel, “Optical coherence tomography in dermatology: a review,” Skin. Res. Technol. 7, 1–9 (2001).3. J.M. Schmitt, M.J. Yadlowsky and R.F. Bonner., “Subsurface imaging of living skin with optical coherence
microscopy,” Darmatology 191, 93–98 (1995).4. J. Welzel, E. Lankenau, R. Birngruber and R. Engelhardt, “Optical coherence tomography of the human skin,” J.
Am. Acad. Dermatol. 37, 958–963 (1997).5. N.D. Gladkova, G.A. Petrova, N.K. Nikulin, S.G. Radenska-Lopovok, L.B. Snopova, Y.P. Chumakov, V.A. Na-
sonova, V.M. Gelikonov, G.V. Gelikonov, R.V. Kuranov, A.M. Sergee and F.I. Feldchtein, “In vivo optical coher-ence tomography imaging of human skin: norm and pathology,” Skin. Res. Technol. 6, 6–16 (2000).
6. A. Paginoni, A. Knuette, P. Welker, M. Rist, T. Stoudemaye, L. Kolbe, I. Sadiq and A.M. Kligman, “Opticalcoherence tomography in dermatology,” Skin. Res. Technol. 5, 83–87 (1999).
7. M.C. Pierce, J. Strasswimmer, B.H. Park, B. Cense, and J.F. de Boer, “Advances in optical coherence tomographyimaging for dermatology,” J. Invest. Dermatol. 123, 458–463 (2004).
8. J.F. de Boer, T.E. Milner, M.J.C. van Gemert and J.S. Nelson, “Two-dimensional birefringence imaging in bio-logical tissue by polarization-sensitive optical coherence tomography,” Opt. Lett. 22, 934–936 (1997).
9. J.F. de Boer, S.M. Srinivas, A. Malekafzali, Z. Chen and J. Nelson, “Imaging thermally damagedtissue by Polarization Sensitive Optical Coherence Tomography,” Opt. Express 3, 212–218 (1998),http://www.opticsexpress.org/abstract.cfm?URI=OPEX-3-6-212.
10. B.H. Park, C. Saxer, S.M. Srinivas, J.S. Nelson and J.F. de Boer, “In vivo burn depth determination by high-speedfiber-based polarization sensitive optical coherence tomography,” J. Biomed. Opt. 6, 474–479 (2001).
11. Z. Chen, T.E. Milner, S.Srinivas, X. Wang and A. Malekafzali, M.J.C. van Gemert, and J.S. Nelson, “Noninvasiveimagingof in vivo blood flow velocity usingoptical Doppler tomography,” Opt. Lett. 22, 1119–1121 (1997).
12. Y. Zhao, Z. Chen, C. Saxer, S. Xiang, J.F. de Boer and J. S. Nelson, “Phase-resolved optical coherence tomogra-phy and optical Doppler tomography for imaging blood f low in human skin with fast scanning speed and highvelocity sensitivity,” Opt. Lett. 25, 114–116 (2000).
13. Y. Zhao, Z. Chen, C. Saxer, Q. Shen, S. Xiang, J.F. de Boer and J.S. Nelson, “Doppler standard deviation imagingfor clinical monitoring of in vivo human skin blood flow,” Opt. Lett. 25, 1358–1360 (2000).
14. S. Inomata, Y. Matsunaga, S. Amano, K. Takada, K. Kobayashi, M. Tsunenaga, T. Nishiyama, Y. Kohno, and M.Fukuda, “Possible involvement of gelatinases in basement membrane damage and wrinkle formation in chroni-cally ultraviolet B-exposed hairless mouse,” J. Invest. Dermatol. 120, 128–134 (2003).
15. Y. Nishimori, C. Edwards, A. Pearse, K. Matsumoto, M. Kawai, and R. Marks, “Degenerative alterations ofdermal collagen fiber bundles in photodamaged human skin and UV-irradiated hairless mouse skin: possibleeffect on decreasing skin mechanical properties and appearance of wrinkles,” J. Invest. Dermatol. 117, 1458–1463 (2001).
16. M. Suehiro, S. Hirano, K. Ikenaga, N. Katoh, H. Yasuno and S. Kishimoto, “Characteristics of skin surfacemorphology and transepidermal water loss in clinically normal-appearing skin of patients with atopic dermatitis:a video-microscopy study,” J. Dermatol. 31, 78–85 (2004).
17. G.L. Grove, M.J. Grove, J.J. Leyden, L. Lufrano, B. Schwab, B.H. Perry and E.G. Thorne, “Skin replica analysisof photodamaged skin after therapy with tretinoin emollient cream,” J. Am. Acad. Dermatol. 25, 231–237 (1991).
18. M. Rajadhyaksha, M. Grossman, D. Esterowitz, R.H. Webb and R.R. Anderson, “In vivo confocal scanning lasermicroscopy of human skin: melanin provides strong contrast,” J. Invest. Dermatol. 104, 946–952 (1995).
19. M. Vogt, A. Knuttel, K. Hoffmann, P. Altmeyer and H. Ermert, “Comparison of high frequency ultrasound andoptical coherence tomography as modalities for high resolution and non invasive skin imaging,” Biomed. Tech.48, 116–121 (2003).
20. A. F. Fercher and C. K. Hitzenberger and G. Kamp and S. Y. El-Zaiat, “Measurement of intraocular distances bybackscattering spectral interferometry,” Opt. Commun. 117, 43–48 (1995).
21. Gerd Hausler and Michael Walter Lindner, “ “Coherence radar” and “spectral radar” —New tools for dermato-logical diagnosis,” J. Biomed. Opt. 3, 21–31 (1998).
22. M. Wojtkowski, T. Bajraszewski, P. Targowski, and A. Kowalczyk, “Real-time in vivo imag-ing by high-speed spectral optical coherence tomography,” Opt. Lett. 28, 1745–1747 (2003),http://www.opticsinfobase.org/abstract.cfm?URI=ol-28-19-1745.
23. N. Nassif, B. Cense, B. Park, M. Pierce, S. Yun, B. Bouma, G. Tearney, T. Chen, and J. de Boer, “In vivo high-resolution video-rate spectral-domain optical coherence tomography of the human retina and optic nerve,” Opt.Express 12, 367–376 (2004), http://www.opticsinfobase.org/abstract.cfm?URI=oe-12-3-367.
24. Takahisa Mitsui, “Dynamic range of optical reflectometry with spectral interferometry,” Jpn. J. Appl. Phys. 38,6133-6137 (1999).
#10151 - $15.00 USD Received 3 January 2006; revised 20 February 2006; accepted 27 February 2006
(C) 2006 OSA 6 March 2006 / Vol. 14, No. 5 / OPTICS EXPRESS 1863
25. R. A. Leitgeb, C. K. Hitzenberger, A. F. Fercher,” Performance of fourier domainvs. time domain optical coherence tomography,” Opt. Express 11, 889–894 (2003),http://www.opticsexpress.org/abstract.cfm?URI=OPEX-11-8-889.
26. Johannes F. de Boer, Barry Cense, B. Hyle Park, Mark C. Pierce, Guillermo J. Tearney and Brett E. Bouma,”“Improved signal-to-noise ratio in spectral-domain compared with time-domain optical coherence tomography,”Opt. Lett. 28, 2067–2069 (2003).
27. Michael A. Choma, Marinko V. Sarunic, Changhuei Yang and Joseph A. Izatt, “Sensitivity advantage ofswept source and Fourier domain optical coherence tomography,” Opt. Express 11, 2183–2189 (2003),http://www.opticsexpress.org/abstract.cfm?URI=OPEX-11-18-2183.
28. Maciej Wojtkowski, Rainer Leitgeb, Andrzej Kowalczyk, Tomasz Bajraszewski, and Adolf F. Fercher, “In vivohuman retinal imaging by Fourier domain optical coherence tomography,” J. Biomed. Opt. 7, 457–463 (2002).
29. S. H. Yun, G. J. Tearney, B. E. Bouma, B. H. Park, and J. F. de Boer, “High-speed spectral-domain optical coherence tomography at 1.3 μm wavelength,” Opt. Express 11, 3598–3604 (2003),http://www.opticsexpress.org/abstract.cfm?URI=OPEX-11-26-3598.
30. B. H. Park, M. C. Pierce, B. Cense, S. Yun, M. Mujat, G. J. Tearney, B. E. Bouma, and J. F. de Boer, “Real-time fiber-based multi-functional spectral-domain optical coherence tomography at 1.3 μm,” Opt. Express 13,3931–3944 (2005), http://www.opticsexpress.org/abstract.cfm?URI=OPEX-13-11-3931.
31. S. Chinn, E. Swanson, and J. Fujimoto, “Optical coherence tomography using a frequency-tunable optical source,” Opt. Lett. 22, 340–342 (1997).
32. S. H. Yun, G. J. Tearney, J. F. de Boer, N. Iftimia, and B. E. Bouma, “High-speed optical frequency-domain imag-ing,” Opt. Express 11, 2953–2963 (2003), http://www.opticsexpress.org/abstract.cfm?URI=OPEX-11-22-2953.
33. Jun Zhang, Woonggyu Jung, J. Stuart Nelson and Zhongping Chen, Full range polarization-sensitive Fourier domain optical coherence tomography, Opt. Express 12, 6033–6039 (2004),http://www.opticsexpress.org/abstract.cfm?URI=OPEX-12-24-6033.
34. Marinko V. Sarunic, Michael A. Choma, Changhuei Yang, and Joseph A. Izatt, “Instantaneous complex conjugateresolved spectral domain and swept-source OCT using 3x3 fiber couplers,” Opt. Express 13, 957–967 (2005),http://www.opticsexpress.org/abstract.cfm?URI=OPEX-13-3-957.
35. R. Huber, M. Wojtkowski, K. Taira, J. G. Fujimoto and K. Hsu, “Amplified, frequency swept lasers for frequencydomain reflectometry and OCT imaging: design and scaling principles,” Opt. Express 13 3513–3528 (2005),http://www.opticsexpress.org/abstract.cfm?URI=OPEX-13-9-3513.
36. Y. Yasuno, V.D. Madjarova, S. Makita, M. Akiba, A. Morosawa, C. Chong, T. Sakai, K. Chan, M.Itoh, and T. Yatagai, “Three-dimensional and high-speed swept-source optical coherence tomographyfor in vivo investigation of human anterior eye segments,” Opt. Express 13, 10652–10664 (2005),http://www.opticsinfobase.org/abstract.cfm?URI=oe-13-26-10652.
37. R. Huber, M. Wojtkowski, J. Fujimoto, J. Jiang, and A. Cable, “Three-dimensional and C-mode OCT imag-ing with a compact, frequency swept laser source at 1300 nm,” Opt. Express 13, 10523-10538 (2005),http://www.opticsinfobase.org/abstract.cfm?URI=oe-13-26-10523.
38. S. H. Yun, C. Boudoux, G. J. Tearney and B. E. Bouma, “High-speed wavelength-swept semiconductor laserwith a polygon-scanner-based wavelength filter,” Opt. Lett. 28, 1981–1983 (2003).
39. William J. Cunliffe, “Histology,” in Acne, (Martin Dunitz Ltd., London, UK, 1989), pp. 93–114.40. American National Standards institute, “American National Standard for the Safe Use of Lasers ANSI Z136.1-
2000,” American National Standards institute, New York (2000).41. J. Weissman, T. Hancewicz, and P. Kaplan, “Optical coherence tomography of skin for measure-
ment of epidermal thickness by shapelet-based image analysis,” Opt. Express 12, 5760–5769 (2004),http://www.opticsexpress.org/abstract.cfm?URI=OPEX-12-23-5760.
42. S. Jiao, R. Knighton, X. Huang, G. Gregori and C.A. Puliafito, “Simultaneous acquisition of sectional and fundusophthalmic images with spectral-domain optical coherence tomography,” Opt. Express 13, 444–452 (2005),http://www.opticsexpress.org/abstract.cfm?URI=OPEX-13-2-444.
43. Per-Erik Danielsson, “Euclidean distance mapping”, Computer Graphics and Image Processing 14 227–248(1980).
44. M. Mujat, C.R. Chan, B. Cense, B.H. Park, C. Joo, T. Akkin, T.C. Chen and J.F. de Boer, “Retinal nerve fiber layerthickness map determined from optical coherence tomography images,” Opt. Express 12, 9480–9491 (2005),http://www.opticsexpress.org/abstract.cfm?URI=OPEX-13-23-9480.
45. D. Cabrera Fernandez, H. Salinas, and C. Puliafito, “Automated detection of retinal layerstructures on optical coherence tomography images,” Opt. Express 13, 10200–10216 (2005),http://www.opticsinfobase.org/abstract.cfm?URI=oe-13-25-10200.
46. N. Kashibuchi, Y. Hirai, K. O’Goshi and H. Tagami, “Three-dimensional analyses of individual corneocytes withatomic force microscope: morphological changes related to age, location and to the pathologic skin conditions,”Skin. Res. Technol. 8, 203–211 (2002).
47. J. Welzel, M. Bruhns and H.H. Wolff, “Optical coherence tomography in contact dermatitis and psoriasis,” Arch.Dermatol. Res. 295, 50–55 (2003).
48. T. Gambichler, S. Boms, M. Stucker, G. Moussa, A. Kreuter, M. Sand, D. Sand, P. Altmeyer and K.M. Hoff-
#10151 - $15.00 USD Received 3 January 2006; revised 20 February 2006; accepted 27 February 2006
(C) 2006 OSA 6 March 2006 / Vol. 14, No. 5 / OPTICS EXPRESS 1864

mann, “Acute skin alterations following ultraviolet radiation investigated by optical coherence tomography andhistology,” Arch. Dermatol. Res. 297, 218–225 (2005).
1. Introduction
Histopathological study is an important part of dermatology, and optical coherence tomog-raphy (OCT) [1] has been widely employed in this field [2]. It has been reported that thestratum corneum and a dermal-epidermal junction are evident in OCT images [3–5]. Furtherappendages such as hair follicles, sebaceous glands, and sweat glands are also visible in theseimages [2, 6, 7]. Polarization-sensitive OCT [8], which may contrast the birefringence in hu-man skin, was also applied in fundamental dermatological studies such as the investigation ofthe burnt tissue of porcine and rat skin [9, 10], where the collagen fibers in skin are denatured,thereby the birefringence are changing. Doppler OCT was also applied to skin investigations inorder to visualize the blood flow under the skin [11,12]. Further, the variation of the blood flowof a port-wine stain skin was also investigated [13].
In cosmetic science, in contrast to dermatology, it is very important to investigate the relation-ship between surface morphology, e.g., wrinkles, skin texture, and facial pores, and the internalstructures of the skin. Wrinkles, for example, are considered to have a correlation with the struc-ture of the basement membrane [14] and collagen fibers [15]. Thus far, video-microscopes [16]and a replication method [17] have been employed for the observation of surface morphology,while confocal microscopes [18], ultrasound tomography, and OCT [19] have been applied fornoninvasive investigations of the internal structures. However, the depth measurement rangeof a confocal microscope, which has a higher spatial resolution than OCT, is limited. The res-olution and image contrast of ultrasound tomography are not sufficient to recognize the indi-vidual structures of the skin [19]. OCT has a higher depth measurement range than confocalmicroscopes, and has a higher resolution than ultrasound tomography. However, in reality, con-ventional time-domain (TD-) OCT is only capable of two-dimensional tomographic imagingand is not sufficient for the three-dimensional morphological investigations including surfacemorphology and internal tomography.
Fourier domain optical coherence tomography (FD-OCT), which is also referred to as spec-tral domain optical coherence tomography (SD-OCT) [20, 21], is a promising alternative toTD-OCT because of its higher measurement speed [22, 23] and sensitivity [24–27] than TD-OCT. While spectrometer-based 830 nm band SD-OCT is a booming technology for retinalimaging [23, 28], 1.3 μm band is more suitable for use in dermatology and cosmetic sciencebecause of its deeper penetration than 830 nm band. However, a spectrometer-based 1.3 μmSD-OCT [29, 30] requires a line detector array that is sensitive to this band, and this line de-tector array is expensive and the options are limited. Swept-source (SS-) OCT [31–37], whichis based on wavelength-resolved interferometry involving a wavelength scanning laser sourceand a point photo-detector, is emerging as an alternative to the spectrometer-based 1.3 μmSD-OCT. Recently, high-speed scanning light sources have been developed [33–35, 38], andSS-OCT systems employing these scanning light sources are applied to high-speed [32, 35, 36]and three-dimensional [36, 37] in vivo investigations. In this study, a custom built SS-OCTsystem [36] was employed for the three-dimensional tomographic imaging of in vivo humanskin.
For cosmetic studies, we have focused on the investigation of infundibula in human facialskin. An infundibulum is a part of the sebaceous follicle, which is a type of hair follicle, and isattached to the ducts of the sebaceous glands [39]. It has been reported that the morphology ofthe infundibulum of a sebaceous follicle in the human face is closely related to the size of thesebaceous glands and the growth of acne [39]. Hence, the evaluation of the size and distributionof infundibula is a fundamental topic in cosmetic studies. Although infundibula are visible in
#10151 - $15.00 USD Received 3 January 2006; revised 20 February 2006; accepted 27 February 2006
(C) 2006 OSA 6 March 2006 / Vol. 14, No. 5 / OPTICS EXPRESS 1865

90
10
50/50
HSL
BR C
C
OL
2D Galvano
RM
A-triggerDigital-in
Analog-inSignal Galvano-control
Sample
Fig. 1. A schematic of the SS-OCT system (left) and an example of the OCT volume offorehead skin in vivo (right). In the schematic, HSL is the high-speed wavelength scanninglight source; C, the circulator; RM, the reference mirror; OL, the objective; and BR, thebalanced photo-receiver.
OCT images [2], it is difficult to evaluate them morphologically because their two-dimensionalimages have a poor contrast. However, the morphological evaluation and screening study ofinfundibula are still interesting topics in the field of cosmetic science, and it is essential todevelop an objective and automated method to contrast the infundibula from the OCT images.
This paper presents an algorithm that extracts the characteristic parameters and morphologi-cal structures of infundibula from a three-dimensional OCT image. This algorithm provides themean thickness and thickness map of the epidermis, an en face shadowgram that enhances thecontrast of the infundibula, the population and occupation ratio of the infundibula, and the der-mal attenuation coefficient. The segmented volumes of the epidermis and infundibula are alsoprovided by the algorithm. This algorithm is applied to the OCT volumes of human foreheadskin and provides the characteristic parameters with regard to cosmetic science. The interpre-tations of these parameters with regard to cosmetic science are discussed. The algorithm is alsoapplied to human cheek and human forearm skin to evaluate the portability of the algorithm.The reproducibility of the algorithm and a comparison between this algorithm and a simplifiedalgorithm are also discussed.
2. Optical coherence tomography system
A schematic of the SS-OCT system used for human skin measurements in this study is shown inFig. 1 (left). The light source is a high-speed wavelength scanning light source (HSL-2000, Ver.1.0, Santec), which employs an external cavity with a polygon scanner for wavelength scanning.The light source has an A-scan rate of 20KHz, a central wavelength of 1.31 μm, and a scanningbandwidth of 110 nm. The interferometer is a fiber-based Mach-Zehnder interferometer with a10/90 coupler, two circulators, and a 50/50 coupler. A probe unit, which is attached to one ofthe circulators, consists of a fiber collimator lens (11 mm focal length, Thorlabs, Inc.), a two-axis galvano mirror (Cambridge Technology), and an achromatic doublet objective lens (60 mmfocal length, Thorlabs, Inc.). The maximum probe beam power is 3.0 mW, which is sufficientlybelow the ANSI safety standard [40]. A reference unit, which is attached to the other circulator,comprises a collimator lens, an achromatic doublet lens, and a static gold-protected mirror.The light beams reflected from the probe and the reference unit are combined by the 50/50coupler and detected by an InGaAs balanced photo-detector (PDA10BI, Thorlabs, Inc.). Asthe wavelength scanning of the light source, a spectral interferometric signal is obtained. Thisdetected spectral interference signal is amplified by an RF amplifier and sampled by an analog-
#10151 - $15.00 USD Received 3 January 2006; revised 20 February 2006; accepted 27 February 2006
(C) 2006 OSA 6 March 2006 / Vol. 14, No. 5 / OPTICS EXPRESS 1866
0.5 mm x 0.5 mm
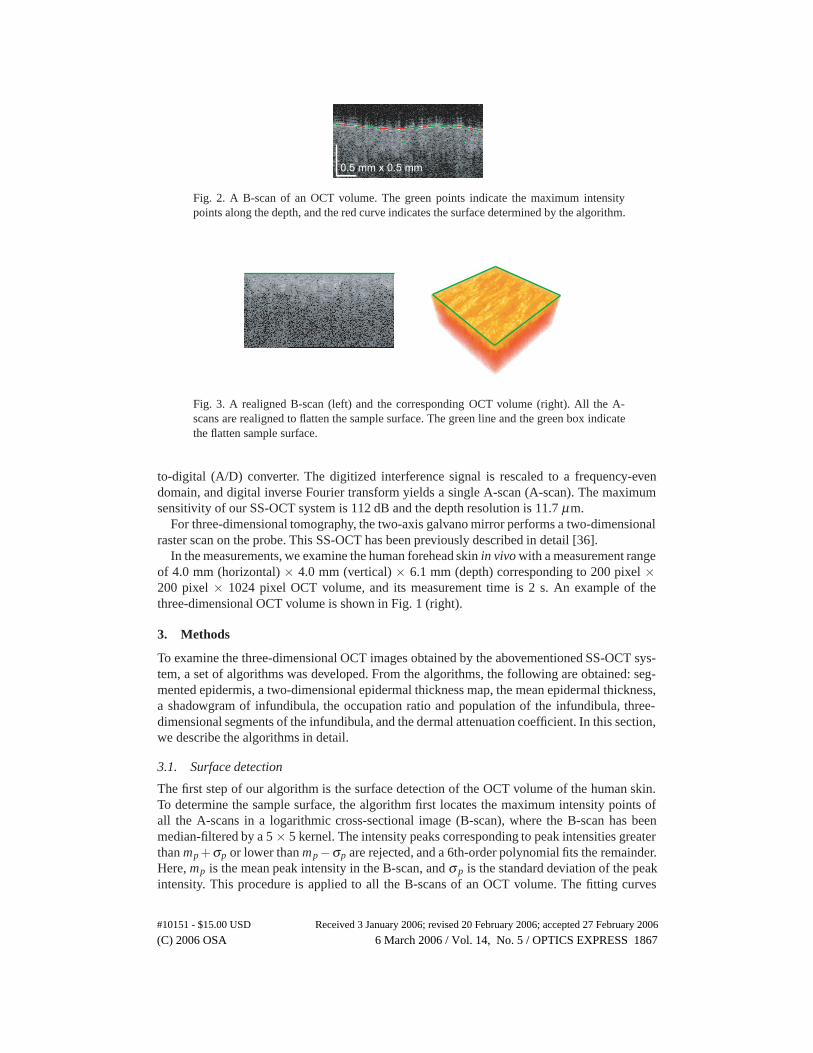
Fig. 2. A B-scan of an OCT volume. The green points indicate the maximum intensitypoints along the depth, and the red curve indicates the surface determined by the algorithm.
Fig. 3. A realigned B-scan (left) and the corresponding OCT volume (right). All the A-scans are realigned to flatten the sample surface. The green line and the green box indicatethe flatten sample surface.
to-digital (A/D) converter. The digitized interference signal is rescaled to a frequency-evendomain, and digital inverse Fourier transform yields a single A-scan (A-scan). The maximumsensitivity of our SS-OCT system is 112 dB and the depth resolution is 11.7 μm.
For three-dimensional tomography, the two-axis galvano mirror performs a two-dimensionalraster scan on the probe. This SS-OCT has been previously described in detail [36].
In the measurements, we examine the human forehead skin in vivo with a measurement rangeof 4.0 mm (horizontal) × 4.0 mm (vertical) × 6.1 mm (depth) corresponding to 200 pixel ×200 pixel × 1024 pixel OCT volume, and its measurement time is 2 s. An example of thethree-dimensional OCT volume is shown in Fig. 1 (right).
3. Methods
To examine the three-dimensional OCT images obtained by the abovementioned SS-OCT sys-tem, a set of algorithms was developed. From the algorithms, the following are obtained: seg-mented epidermis, a two-dimensional epidermal thickness map, the mean epidermal thickness,a shadowgram of infundibula, the occupation ratio and population of the infundibula, three-dimensional segments of the infundibula, and the dermal attenuation coefficient. In this section,we describe the algorithms in detail.
3.1. Surface detection
The first step of our algorithm is the surface detection of the OCT volume of the human skin.To determine the sample surface, the algorithm first locates the maximum intensity points ofall the A-scans in a logarithmic cross-sectional image (B-scan), where the B-scan has beenmedian-filtered by a 5 × 5 kernel. The intensity peaks corresponding to peak intensities greaterthan mp +σp or lower than mp−σp are rejected, and a 6th-order polynomial fits the remainder.Here, mp is the mean peak intensity in the B-scan, and σ p is the standard deviation of the peakintensity. This procedure is applied to all the B-scans of an OCT volume. The fitting curves
#10151 - $15.00 USD Received 3 January 2006; revised 20 February 2006; accepted 27 February 2006
(C) 2006 OSA 6 March 2006 / Vol. 14, No. 5 / OPTICS EXPRESS 1867
50
40
30
20Sig
nal i
nten
sity
[dB
]
6004002000Depth [μm]
The first intensity maximum
Epidermal thickness
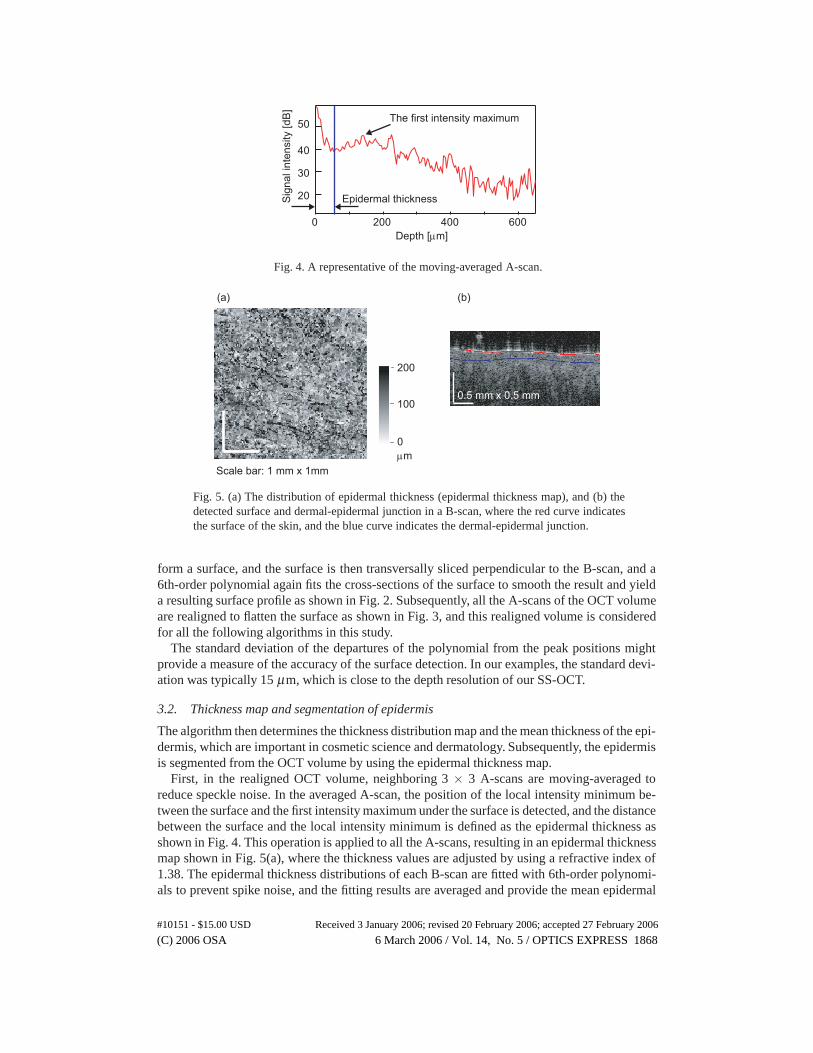
Fig. 4. A representative of the moving-averaged A-scan.
Scale bar: 1 mm x 1mm
(a) (b)
0.5 mm x 0.5 mm
200
100
0μm
Fig. 5. (a) The distribution of epidermal thickness (epidermal thickness map), and (b) thedetected surface and dermal-epidermal junction in a B-scan, where the red curve indicatesthe surface of the skin, and the blue curve indicates the dermal-epidermal junction.
form a surface, and the surface is then transversally sliced perpendicular to the B-scan, and a6th-order polynomial again fits the cross-sections of the surface to smooth the result and yielda resulting surface profile as shown in Fig. 2. Subsequently, all the A-scans of the OCT volumeare realigned to flatten the surface as shown in Fig. 3, and this realigned volume is consideredfor all the following algorithms in this study.
The standard deviation of the departures of the polynomial from the peak positions mightprovide a measure of the accuracy of the surface detection. In our examples, the standard devi-ation was typically 15 μm, which is close to the depth resolution of our SS-OCT.
3.2. Thickness map and segmentation of epidermis
The algorithm then determines the thickness distribution map and the mean thickness of the epi-dermis, which are important in cosmetic science and dermatology. Subsequently, the epidermisis segmented from the OCT volume by using the epidermal thickness map.
First, in the realigned OCT volume, neighboring 3 × 3 A-scans are moving-averaged toreduce speckle noise. In the averaged A-scan, the position of the local intensity minimum be-tween the surface and the first intensity maximum under the surface is detected, and the distancebetween the surface and the local intensity minimum is defined as the epidermal thickness asshown in Fig. 4. This operation is applied to all the A-scans, resulting in an epidermal thicknessmap shown in Fig. 5(a), where the thickness values are adjusted by using a refractive index of1.38. The epidermal thickness distributions of each B-scan are fitted with 6th-order polynomi-als to prevent spike noise, and the fitting results are averaged and provide the mean epidermal
#10151 - $15.00 USD Received 3 January 2006; revised 20 February 2006; accepted 27 February 2006
(C) 2006 OSA 6 March 2006 / Vol. 14, No. 5 / OPTICS EXPRESS 1868
(a) (b)
Scale bar: 1 mm x 1 mm
80
60
40
20
0
Num
ber o
f pix
els
-4 -2 0 2 4Normalized pixel intensity
(c)
(d) (e)
0.5 mm x 0.5 mm
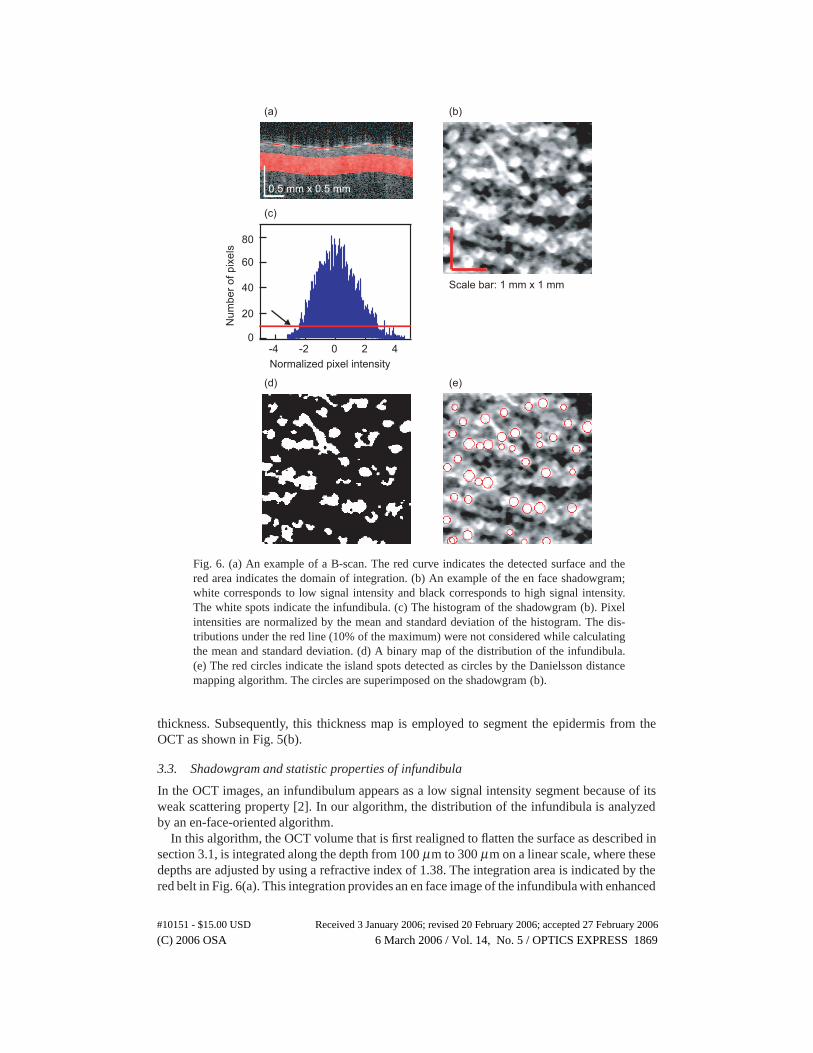
Fig. 6. (a) An example of a B-scan. The red curve indicates the detected surface and thered area indicates the domain of integration. (b) An example of the en face shadowgram;white corresponds to low signal intensity and black corresponds to high signal intensity.The white spots indicate the infundibula. (c) The histogram of the shadowgram (b). Pixelintensities are normalized by the mean and standard deviation of the histogram. The dis-tributions under the red line (10% of the maximum) were not considered while calculatingthe mean and standard deviation. (d) A binary map of the distribution of the infundibula.(e) The red circles indicate the island spots detected as circles by the Danielsson distancemapping algorithm. The circles are superimposed on the shadowgram (b).
thickness. Subsequently, this thickness map is employed to segment the epidermis from theOCT as shown in Fig. 5(b).
3.3. Shadowgram and statistic properties of infundibula
In the OCT images, an infundibulum appears as a low signal intensity segment because of itsweak scattering property [2]. In our algorithm, the distribution of the infundibula is analyzedby an en-face-oriented algorithm.
In this algorithm, the OCT volume that is first realigned to flatten the surface as described insection 3.1, is integrated along the depth from 100 μm to 300 μm on a linear scale, where thesedepths are adjusted by using a refractive index of 1.38. The integration area is indicated by thered belt in Fig. 6(a). This integration provides an en face image of the infundibula with enhanced
#10151 - $15.00 USD Received 3 January 2006; revised 20 February 2006; accepted 27 February 2006
(C) 2006 OSA 6 March 2006 / Vol. 14, No. 5 / OPTICS EXPRESS 1869
contrast as show in Fig. 6(b). This image is similar to the shadowgram demonstrated by Jiao etal. for contrasting retinal vessels [42]. Because the infundibula appear as low signal intensitysegments in the OCT image, the low intensity (white) spots in the shadowgram correspond tothe infundibula.
The histogram of the shadowgram with 2000 bins is then employed to determine the thresh-old in order to obtain a binary contrast of the infundibula. An example of the histogram isshown in Fig. 6(c). Because the infundibula exhibit weak scattering, the side lobe of the lowintensity pixels indicated by an arrow corresponds to the infundibula. The mean (m h) and stan-dard deviation (σh) of the histogram are then calculated; the side lobes below the 10% of themaximum of the histogram (the red line in the figure) are not considered to calculate the meanand the standard deviation. The threshold s for segmenting the infundibula is determined as
s = mh −ασh (1)
where α is a constant dependent on the region of measurement. For forehead skin, α is 1. Thisthreshold and the shadowgram provide an en face binary map of the infundibula as shown inFig. 6(d), and the binary map provides the occupation ratio of the infundibula.
Subsequently, the Danielsson distance mapping algorithm [43], which detects the island spotsin a binary image as circles, is applied to the binary map. The circles detected by the Danielssondistance mapping algorithm are superimposed on the shadowgram as shown in Fig. 6(e). Thelow intensity island spots (white spots) on the binary map correspond to the infundibula, hence,the given circles also correspond to the infundibula. Finally, the population of the infundibulais obtained by this mapping algorithm.
3.4. Three-dimensional segmentation of the infundibula
Recently, a B-scan-oriented segmentation algorithm was successfully demonstrated for reti-nal OCT [44, 45]. The important structures of the retina are mostly depth-oriented layers, andit is reasonable to apply such a B-scan-oriented segmentation algorithm. On the other hand,infundibula are immersed in the skin as isolated spots, hence, it is difficult to segment themby the B-scan-oriented algorithm. Furthermore, a B-scan-oriented thresholding segmentationalgorithm is not always suitable, although the infundibula exhibit a weaker scattering than oth-ers parts of skin, because the depth-dependent signal decay of an OCT image due to samplescattering disturbs this thresholding. Therefore, we employed an en-face-oriented thresholdingmethod to segment the infundibula, where each en face image is extracted from the realignedOCT volume, and has a constant depth from the surface.
In this segmentation, an en face image at a particular depth from the surface is extracted fromthe OCT volume. A histogram-based thresholding method, which is identical to the methoddescribed in section 3.3, is applied, and the threshold is obtained. From the threshold, a bi-nary mask to segment the infundibula at this depth is obtained. This thresholding algorithmis applied to the en face images at every depth of the OCT volume, and this finally yields athree-dimensional binary mask to extract the infundibula from the OCT volume.
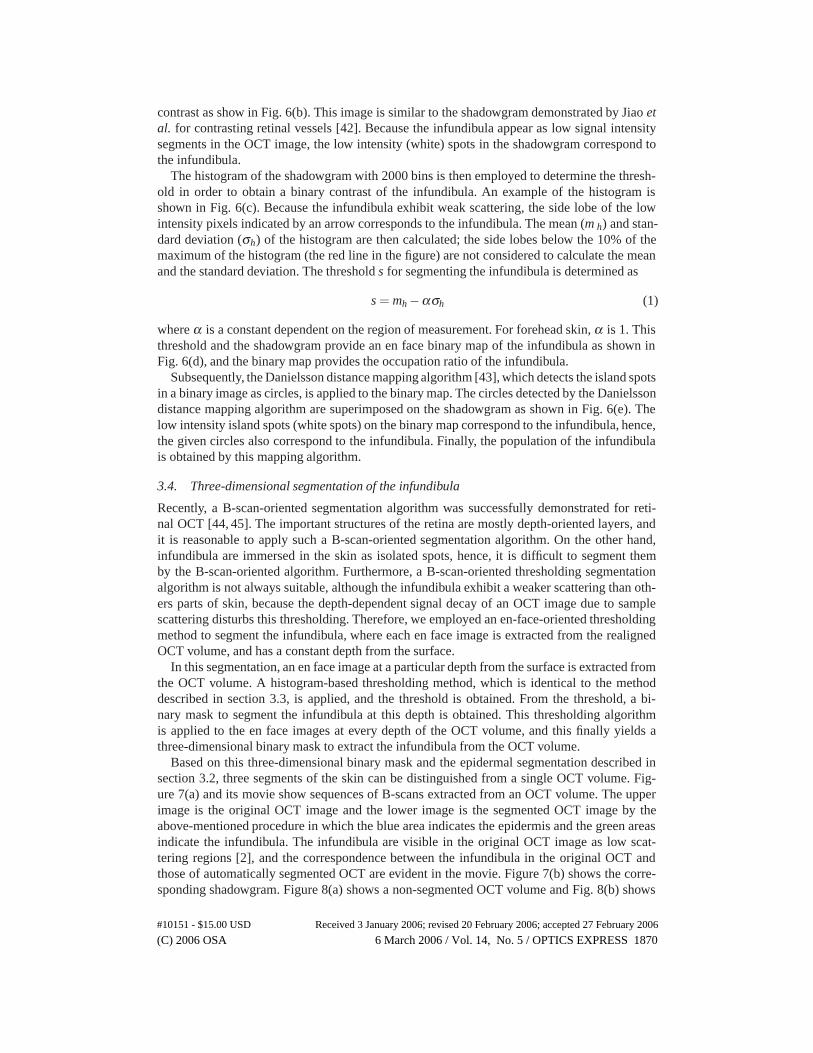
Based on this three-dimensional binary mask and the epidermal segmentation described insection 3.2, three segments of the skin can be distinguished from a single OCT volume. Fig-ure 7(a) and its movie show sequences of B-scans extracted from an OCT volume. The upperimage is the original OCT image and the lower image is the segmented OCT image by theabove-mentioned procedure in which the blue area indicates the epidermis and the green areasindicate the infundibula. The infundibula are visible in the original OCT image as low scat-tering regions [2], and the correspondence between the infundibula in the original OCT andthose of automatically segmented OCT are evident in the movie. Figure 7(b) shows the corre-sponding shadowgram. Figure 8(a) shows a non-segmented OCT volume and Fig. 8(b) shows
#10151 - $15.00 USD Received 3 January 2006; revised 20 February 2006; accepted 27 February 2006
(C) 2006 OSA 6 March 2006 / Vol. 14, No. 5 / OPTICS EXPRESS 1870
(a) (b)
Original OCT
Segmented OCT
Fig. 7. (a) A B-scan of the original OCT volume and that of the segmented OCT volume.The white arrows and the green spots indicate the infundibula. (b) Corresponding shadow-gram. Click the figure (a) to see a movie (2.4 MB).
(a) (b) (c)
Scale bar: 1 mm x 1 mm
(e)
RightLeft
(d)
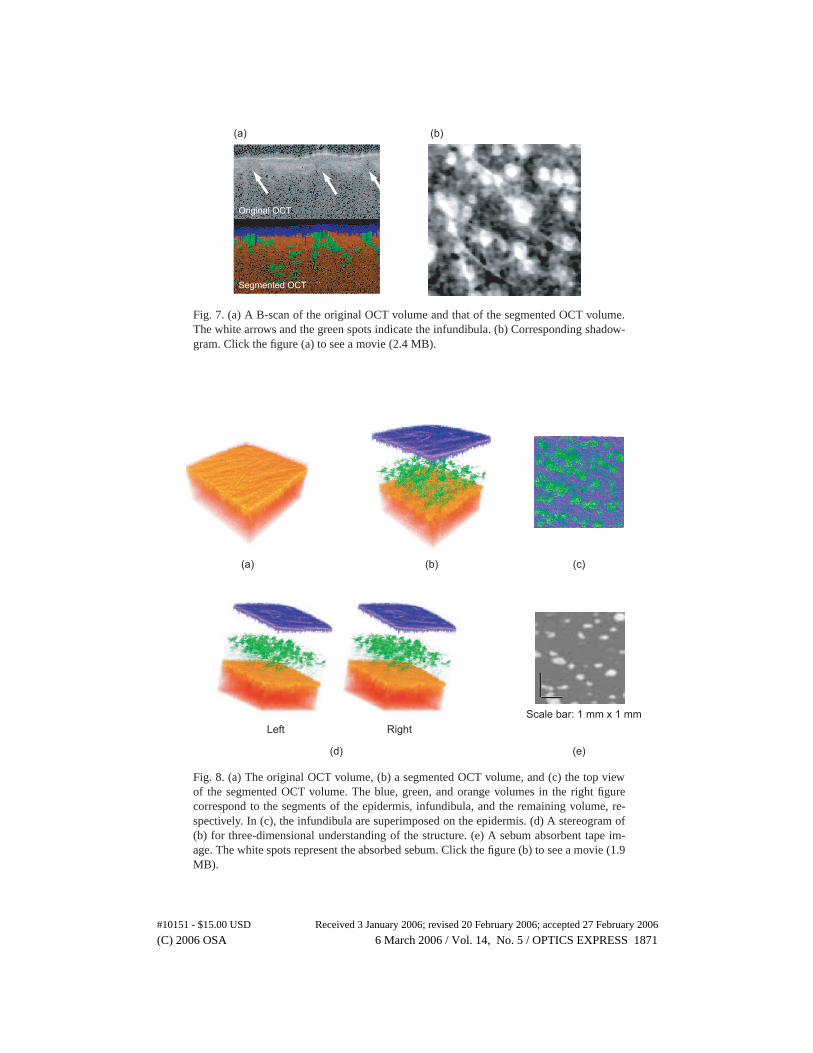
Fig. 8. (a) The original OCT volume, (b) a segmented OCT volume, and (c) the top viewof the segmented OCT volume. The blue, green, and orange volumes in the right figurecorrespond to the segments of the epidermis, infundibula, and the remaining volume, re-spectively. In (c), the infundibula are superimposed on the epidermis. (d) A stereogram of(b) for three-dimensional understanding of the structure. (e) A sebum absorbent tape im-age. The white spots represent the absorbed sebum. Click the figure (b) to see a movie (1.9MB).
#10151 - $15.00 USD Received 3 January 2006; revised 20 February 2006; accepted 27 February 2006
(C) 2006 OSA 6 March 2006 / Vol. 14, No. 5 / OPTICS EXPRESS 1871

Depth [μm] 600 400 200 0
Sig
nal i
nten
sity
[dB
]
Fitting area2nd maximum
Surface
-25
-20
-15
-10
-5
0
120 μm 200 μm
Papillary dermis
Reticular dermis
Fig. 9. An example of the attenuation curve. The portion of the curve between the blue linesis fitted by a linear line to obtain the attenuation coefficient.
the corresponding segmented OCT volume, where the epidermis (a blue volume), infundibula(green volumes), and remaining volume (an orange volume) are shown at different positionswith different color maps. Figure 8(c) is the top view of the volume of Fig. 8(b), where the in-fundibula are superimposed on the epidermis. Figure 8(d) is a stereogram of Fig. 8(b) for threedimensional understanding of the structure.
3.5. Dermal attenuation coefficient
We determined the dermal attenuation coefficient from the OCT volume. For this purpose, allthe A-scans of the realigned OCT volume are averaged on a linear scale. The averaged A-scan is represented by a logarithmic scale as shown in Fig. 9, and a linear line fits a portionof the A-scan. This portion has a depth of 200 μm and starts from a 120 μm in depth to thesecond maximum peak (see Fig. 9). This portion corresponds to the reticular dermis, whilethe superior 120 μm-thickness layer corresponds to papillary dermis, where the depth valuesare again adjusted by using a refractive index of 1.38. This fitting line provides the dermalattenuation coefficient μ as
I(z) ∝ e−2(μ+μOCT)z (2)
where z is the depth position and I(z) is the signal intensity of the averaged A-scan. μ OCT isa system attenuation coefficient dominated by the resolution of spectral sampling of SS-OCTand the instantaneous linewidth of the wavelength scanning light source, and is 1.7 cm −1 in ourSS-OCT [36]. The dermal attenuation coefficient is related with the absorption coefficient andthe scattering coefficient of the dermis, and can be considered as a measure of the translucencyof skin [47].
4. Measurements and results
4.1. Segments and shadowgrams
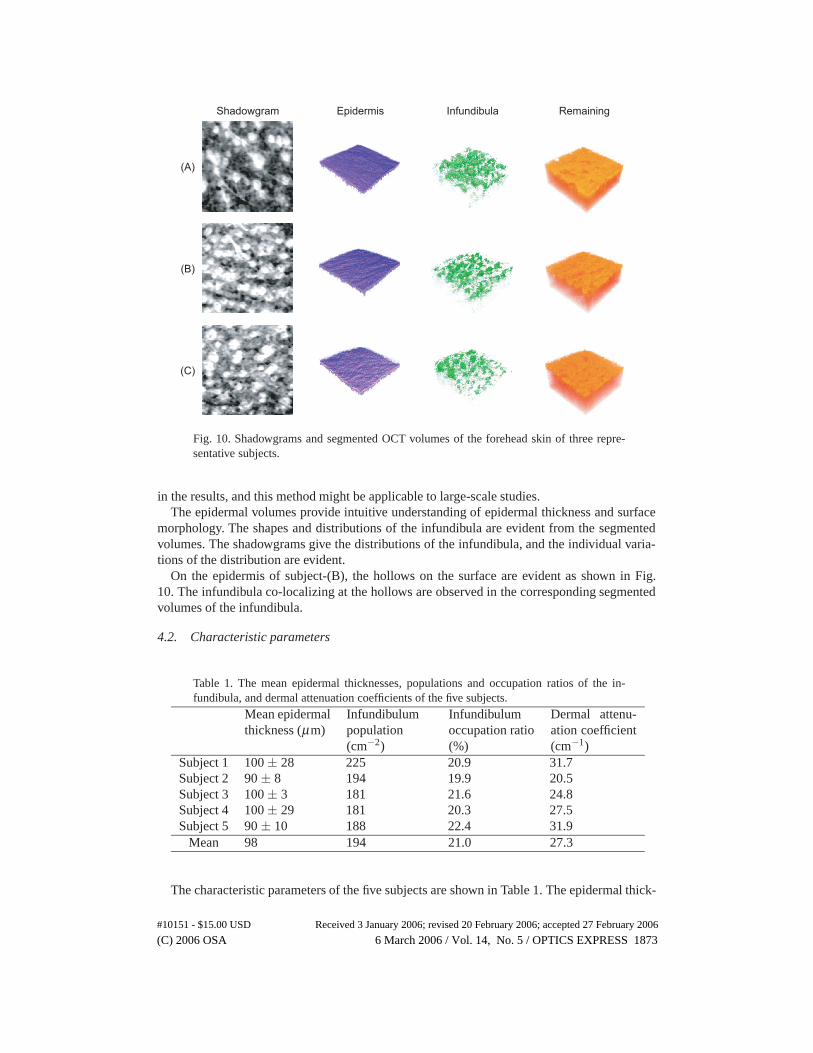
To validate this method, we examined five volunteers. The subjects are Asian males whose agesrange from 22 to 44, and the forehead skins of these subjects are measured by SS-OCT. Figure10 shows the shadowgrams, and the segmented volumes of the epidermis, the infundibula andthe remaining volumes of the three representative subjects. For all the calculations, the parame-ters of the algorithm do not change. The high stability of this automated algorithm is reflected
#10151 - $15.00 USD Received 3 January 2006; revised 20 February 2006; accepted 27 February 2006
(C) 2006 OSA 6 March 2006 / Vol. 14, No. 5 / OPTICS EXPRESS 1872
(A)
(B)
RemainingInfundibulaEpidermisShadowgram
(C)
Fig. 10. Shadowgrams and segmented OCT volumes of the forehead skin of three repre-sentative subjects.
in the results, and this method might be applicable to large-scale studies.The epidermal volumes provide intuitive understanding of epidermal thickness and surface
morphology. The shapes and distributions of the infundibula are evident from the segmentedvolumes. The shadowgrams give the distributions of the infundibula, and the individual varia-tions of the distribution are evident.
On the epidermis of subject-(B), the hollows on the surface are evident as shown in Fig.10. The infundibula co-localizing at the hollows are observed in the corresponding segmentedvolumes of the infundibula.
4.2. Characteristic parameters
Table 1. The mean epidermal thicknesses, populations and occupation ratios of the in-fundibula, and dermal attenuation coefficients of the five subjects.
Mean epidermalthickness (μm)
Infundibulumpopulation(cm−2)
Infundibulumoccupation ratio(%)
Dermal attenu-ation coefficient(cm−1)
Subject 1 100 ± 28 225 20.9 31.7Subject 2 90 ± 8 194 19.9 20.5Subject 3 100 ± 3 181 21.6 24.8Subject 4 100 ± 29 181 20.3 27.5Subject 5 90 ± 10 188 22.4 31.9
Mean 98 194 21.0 27.3
The characteristic parameters of the five subjects are shown in Table 1. The epidermal thick-
#10151 - $15.00 USD Received 3 January 2006; revised 20 February 2006; accepted 27 February 2006
(C) 2006 OSA 6 March 2006 / Vol. 14, No. 5 / OPTICS EXPRESS 1873
nesses are adjusted by using a refractive index of 1.38. The obtained epidermal thicknesses [41],the populations of the infundibula [39], and the dermal attenuation coefficients [47] are in goodagreement with previously reported values. The populations of the infundibula were also man-ually counted from the original OCT volumes, and the root-mean-square error between themanually counted values and the automatically counted values was 18.8%. Taking the errors ofthe manual count into account, it is reasonable to think that the automated algorithm correctlydetermines the population of infundibula.
5. Discussions
5.1. Dermatological interpretations of the segments and parameters
It is known that the size of an infundibulum is related to that of a sebaceous gland, and thestructural changes of an infundibulum accompany the growth of acne [39]. Thus, the structuralobservation of infundibula with segmented OCT volumes will be a useful tool for understandingthese dermatological dynamics.
Sebaceous glands are classified into two types: active and inactive. The active gland secretessebum while the inactive gland does not. The distribution of the infundibula measured by ourmethod is related to both active and inactive glands. This distribution and the distribution ofactive glands measured by other method, such as a sebum absorbent tape, will contribute tounderstanding the dynamics of sebum secretion. Figure 8(e) shows an example of the sebumabsorbent tape (Sebutape, CuDerm Corporation, Texas) image of human forehead skin of closearea of the OCT measurement in Figs. 8(a)-(c). The difference of the populations of the spotsbetween the sebum absorbent tape image and the segmented volume/shadowgram may accountfor the population difference between the active and inactive glands.
It is known that secreted sebum is stored in the ducts of sebaceous glands and the infundibula.Therefore, the infundibulum occupation ratio might have a relation with the rate at which sebumis re-formed on the face after washing.
It has been reported that due to cutaneous inflammatory diseases, the epidermis thickens [47]and the stratum corneum becomes abnormal [46]. Hence, the mean epidermal thickness canbe considered as a quantitative parameter for skin diagnosis, and two-dimensional epidermalthickness maps will help in understanding the mechanism of development of cutaneous inflam-matory diseases.
It has been reported that the scattering coefficient is altered by the exposure to ultravioletradiation [48]. Since the dermal attenuation coefficient obtained in section 3.5 is well relatedwith the scattering coefficient, it might be useful to study the photoaging of skin.
5.2. Portability of the algorithm
To examine the portability of this algorithm, we applied it to forearm skin and cheek skin. α inEq. (1) is selected as 2 for the forearm skin and 0.5 for the cheek skin.
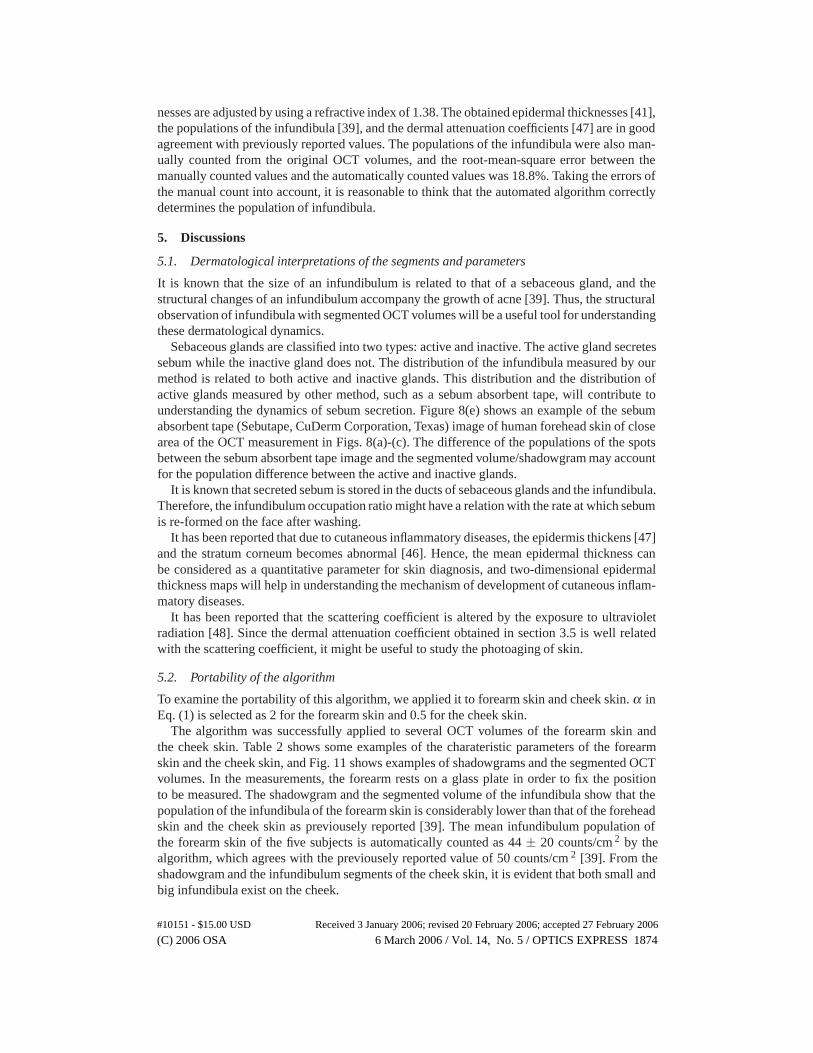
The algorithm was successfully applied to several OCT volumes of the forearm skin andthe cheek skin. Table 2 shows some examples of the charateristic parameters of the forearmskin and the cheek skin, and Fig. 11 shows examples of shadowgrams and the segmented OCTvolumes. In the measurements, the forearm rests on a glass plate in order to fix the positionto be measured. The shadowgram and the segmented volume of the infundibula show that thepopulation of the infundibula of the forearm skin is considerably lower than that of the foreheadskin and the cheek skin as previousely reported [39]. The mean infundibulum population ofthe forearm skin of the five subjects is automatically counted as 44 ± 20 counts/cm 2 by thealgorithm, which agrees with the previousely reported value of 50 counts/cm 2 [39]. From theshadowgram and the infundibulum segments of the cheek skin, it is evident that both small andbig infundibula exist on the cheek.
#10151 - $15.00 USD Received 3 January 2006; revised 20 February 2006; accepted 27 February 2006
(C) 2006 OSA 6 March 2006 / Vol. 14, No. 5 / OPTICS EXPRESS 1874
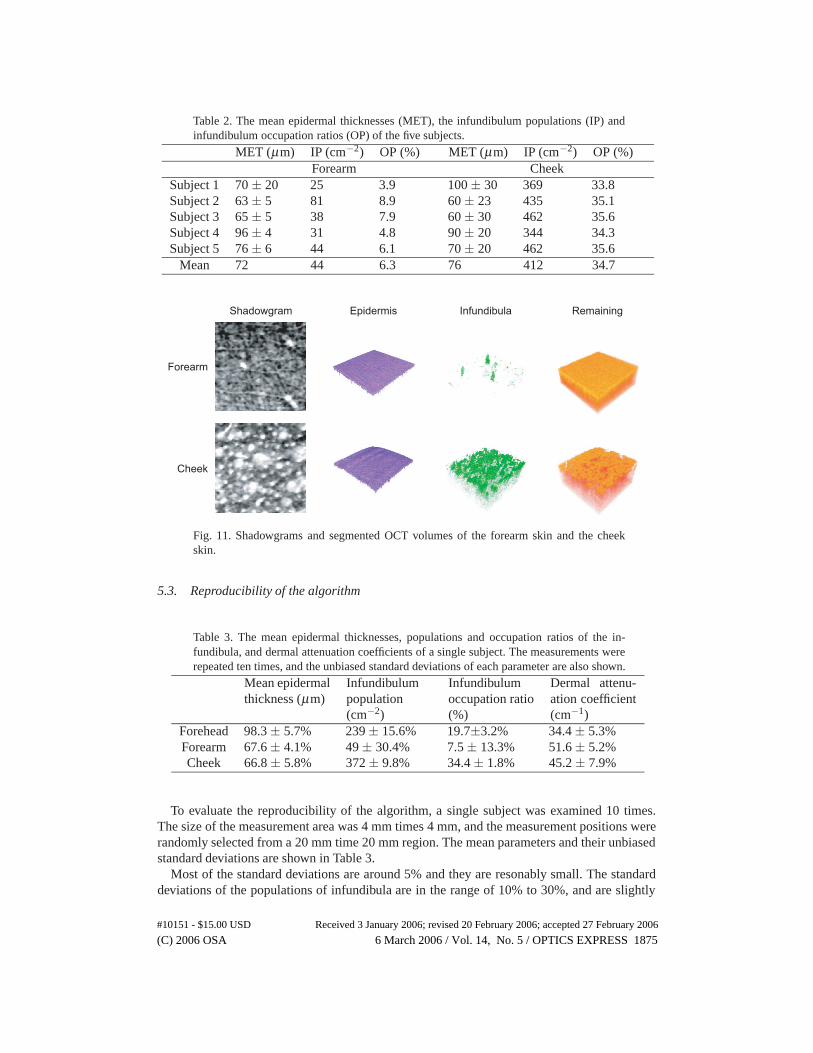
Table 2. The mean epidermal thicknesses (MET), the infundibulum populations (IP) andinfundibulum occupation ratios (OP) of the five subjects.
MET (μm) IP (cm−2) OP (%) MET (μm) IP (cm−2) OP (%)Forearm Cheek
Subject 1 70 ± 20 25 3.9 100 ± 30 369 33.8Subject 2 63 ± 5 81 8.9 60 ± 23 435 35.1Subject 3 65 ± 5 38 7.9 60 ± 30 462 35.6Subject 4 96 ± 4 31 4.8 90 ± 20 344 34.3Subject 5 76 ± 6 44 6.1 70 ± 20 462 35.6
Mean 72 44 6.3 76 412 34.7
Forearm
Cheek
RemainingInfundibulaEpidermisShadowgram
Fig. 11. Shadowgrams and segmented OCT volumes of the forearm skin and the cheekskin.
5.3. Reproducibility of the algorithm
Table 3. The mean epidermal thicknesses, populations and occupation ratios of the in-fundibula, and dermal attenuation coefficients of a single subject. The measurements wererepeated ten times, and the unbiased standard deviations of each parameter are also shown.
Mean epidermalthickness (μm)
Infundibulumpopulation(cm−2)
Infundibulumoccupation ratio(%)
Dermal attenu-ation coefficient(cm−1)
Forehead 98.3 ± 5.7% 239 ± 15.6% 19.7±3.2% 34.4 ± 5.3%Forearm 67.6 ± 4.1% 49 ± 30.4% 7.5 ± 13.3% 51.6 ± 5.2%Cheek 66.8 ± 5.8% 372 ± 9.8% 34.4 ± 1.8% 45.2 ± 7.9%
To evaluate the reproducibility of the algorithm, a single subject was examined 10 times.The size of the measurement area was 4 mm times 4 mm, and the measurement positions wererandomly selected from a 20 mm time 20 mm region. The mean parameters and their unbiasedstandard deviations are shown in Table 3.
Most of the standard deviations are around 5% and they are resonably small. The standarddeviations of the populations of infundibula are in the range of 10% to 30%, and are slightly
#10151 - $15.00 USD Received 3 January 2006; revised 20 February 2006; accepted 27 February 2006
(C) 2006 OSA 6 March 2006 / Vol. 14, No. 5 / OPTICS EXPRESS 1875
Forehead Cheek
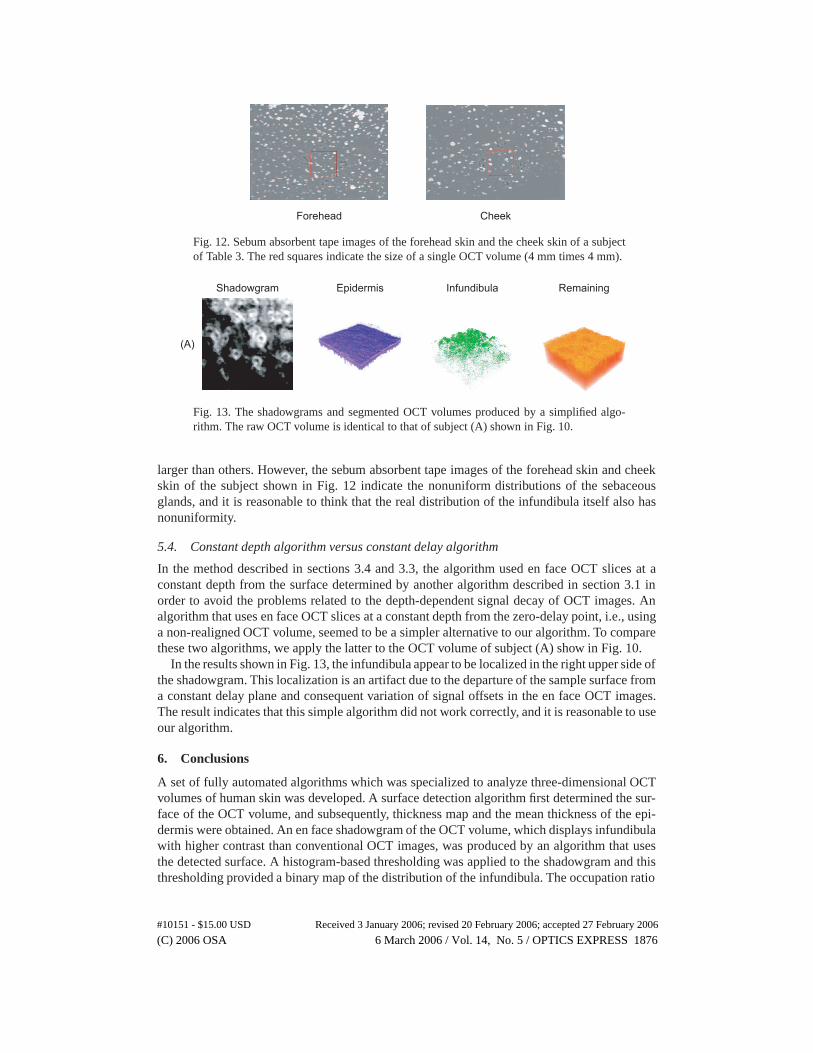
Fig. 12. Sebum absorbent tape images of the forehead skin and the cheek skin of a subjectof Table 3. The red squares indicate the size of a single OCT volume (4 mm times 4 mm).
(A)
RemainingInfundibulaEpidermisShadowgram
Fig. 13. The shadowgrams and segmented OCT volumes produced by a simplified algo-rithm. The raw OCT volume is identical to that of subject (A) shown in Fig. 10.
larger than others. However, the sebum absorbent tape images of the forehead skin and cheekskin of the subject shown in Fig. 12 indicate the nonuniform distributions of the sebaceousglands, and it is reasonable to think that the real distribution of the infundibula itself also hasnonuniformity.
5.4. Constant depth algorithm versus constant delay algorithm
In the method described in sections 3.4 and 3.3, the algorithm used en face OCT slices at aconstant depth from the surface determined by another algorithm described in section 3.1 inorder to avoid the problems related to the depth-dependent signal decay of OCT images. Analgorithm that uses en face OCT slices at a constant depth from the zero-delay point, i.e., usinga non-realigned OCT volume, seemed to be a simpler alternative to our algorithm. To comparethese two algorithms, we apply the latter to the OCT volume of subject (A) show in Fig. 10.
In the results shown in Fig. 13, the infundibula appear to be localized in the right upper side ofthe shadowgram. This localization is an artifact due to the departure of the sample surface froma constant delay plane and consequent variation of signal offsets in the en face OCT images.The result indicates that this simple algorithm did not work correctly, and it is reasonable to useour algorithm.
6. Conclusions
A set of fully automated algorithms which was specialized to analyze three-dimensional OCTvolumes of human skin was developed. A surface detection algorithm first determined the sur-face of the OCT volume, and subsequently, thickness map and the mean thickness of the epi-dermis were obtained. An en face shadowgram of the OCT volume, which displays infundibulawith higher contrast than conventional OCT images, was produced by an algorithm that usesthe detected surface. A histogram-based thresholding was applied to the shadowgram and thisthresholding provided a binary map of the distribution of the infundibula. The occupation ratio
#10151 - $15.00 USD Received 3 January 2006; revised 20 February 2006; accepted 27 February 2006
(C) 2006 OSA 6 March 2006 / Vol. 14, No. 5 / OPTICS EXPRESS 1876

of the infundibula is obtained from the binary map. Circular structures in the binary map wereobtained by the Danielsson distance mapping algorithm, and it provided the population of theinfundibula. The dermal attenuation coefficient was also provided from the OCT volume as ameasure of skin texture.
The OCT volume was sliced into en face OCT slices at constant depths from the samplesurface. The histogram-based thresholding was applied to each individual slice to provide athree-dimensional segmented volume of the infundibula, while the segmented volume of theepidermis was obtained by using the epidermal thickness map.
The algorithm set was applied to several OCT volumes of human forehead skin, and thehigh stability of the algorithm set was confirmed. The portability of the algorithm set was alsoconfirmed by its application to other parts of the human skin, such as forearm skin and andcheek skin. The reproducibility of the algorithm set was examined by repetitive measurementof a single subject, and the algorithm set showed reasonable reproducibility. A comparisonbetween our method and a simple method was also discussed, and this comparison showed theadvantages of our method.
The forehead skins of five volunteers were examined, and the their characteristic parametersof their skin were in agreement with the previous reports. Dermatological interpretations of thecharacteristic parameters were also discussed.
Acknowledgments
We would like to thank Masahiro Akiba, Atsushi Morosawa and Changho Chong for their dis-cussions with regard to the SS-OCT system. We also thank Gouki Aoki, Yoshifumi Nakamura,Youngjoo Hong, and Chia-Wei Sun for their technical and scientific contributions and helpfuladvices. Yasuaki Hori is visiting from the Department of Mechanical Science and Bioengineer-ing, Graduate School of Engineering Science, Osaka University, Osaka, Japan. This research ispartially supported by a Grant-in-aid for Scientific Research 15760026 from the Japan Societyfor the Promotion of Science (JSPS), Japan Science and Technology Agency, and the SpecialResearch Project of Nanoscience at University of Tsukuba. Masahiro Yamanari and ShuichiMakita are supported by JSPS through a contract under the Promotion of Creative Interdis-ciplinary Materials Science for Novel Functions, 21st Century Center of Excellence (COE)Program.
#10151 - $15.00 USD Received 3 January 2006; revised 20 February 2006; accepted 27 February 2006
(C) 2006 OSA 6 March 2006 / Vol. 14, No. 5 / OPTICS EXPRESS 1877