automatic detection of blood vessels from cta images ... · kyushu institute of technology, 1-1...
TRANSCRIPT

1
Automatic Detection of Blood Vessels from CTA Images
Employing Morphological Operation
Yoshinori Itai, Akiyoshi Yamamoto, Hyoungseop Kim, Joo Kooi Tan and Seiji Ishikawa
Kyushu Institute of Technology, 1-1 Sensui, Tobata, Kitakyushu 804-8550, Japan
(Tel : +81-93-884-3185; Fax : +81-93-861-1159)
(Email address: [email protected])

2
Abstract: Recently, the disease by arteriosclerosis increases rapidly. Especially, the one that originates in hands
and feet’s peripheral arterial is called arteriosclerosis obliterans (ASO). The ASO is one of the typical diseases that
cause a chronic ischemia of limbs and it leads to blood flow obstruction. In the diagnosis of ASO, lower contrast
enhanced computed tomography (CT) is useful to observe artery. However it is huge task for radiologists to segment
accurately only arteries, which they pay attention, from lower computed tomography angiography (CTA) by manual or
semi-automatic with proprietary software. In this paper, we have developed a new technique for detection of the
arteries from CTA images by use of a morphological operation. In this technique, the N-Quoit filter, that is a useful
filter for detection lung nodules, is applied to identify the arteries in CTA images. Some experimental results were
shown with a good performance of segmentation of arteries.
Keywords: contrast enhanced CT image, artery detection, segmentation, morphological filter

3
I. INTRODUCTION
Arteriosclerosis obliterans (ASO; it is also called PAD (peripheral arterial disease) or PVD (peripheral vascular
disease) in USA) is one of the typical diseases that cause a chronic ischemia of limbs and it leads to blood flow
obstruction. It is defined as an arteriosclerosis in which proliferation of the intima leads to occlusion of the lumen of the
arteries. The ASO commonly shows its effects first in the legs and feet. The narrowing of the arteries may progress to
total closure of the vessel. This disease is caused by diabetes, hyperlipemia, hypertension and smoking. Intermittent
claudicating is the most symptoms of ASO [1] and large experiment in the USA showed that the incidence of male and
female with the age of 50 to 70 is 5 to 8 per 1,000 populations for the year.
In the diagnosis of ASO, it is useful for detection of arteries by use of computed tomography angiography (CTA)
and magnetic resonance angiography (MRA). In Addition, fresh blood imaging (FBI) is a very useful imaging
diagnosis method which is obtained by magnetic resonance (MR) imaging without using contrast media. It is also can
be analyzed arteries on the anatomical structure in which are enhanced on the images [2]. Especially, three dimensional
(3-D) images reconstructed by using some rendering methods from two dimensional (2-D) medical images are needed
for observation and intervention of the arteries. On the other hand, detection and/or segmentation of the arteries from
CTA, MRA and MR image from FBI are important task for these scenes. It is, however, there is a considerable issue
that radiologists require much time for reconstruction as a 3D image or display it. Hence, it burdens to segment the
arteries from medical images manually or semi-automatically using some proprietary software.
To overcome this problem, many researchers have studied about automatic detection/segmentation techniques of
blood vessels from medical images and some result showed relatively good performance [3]. However the studies about

4
detection of arteries in lower CTA images have almost not reported. In this paper, we have developed a new technique
for detection of the arteries from contrast-enhanced lower CT images by use of a morphological operation. In this
technique, N-Quoit filter, which is widely introduced as a useful filter for detection lung nodules [4], is applied to
identify the arteries in CT images. In this paper, the technique has been evaluated by applying for actual two CTA
image sets. Some experimental results were shown with a good performance of detection of arteries. As we mentioned
above, this technique provided as one of the powerful CAD system in medical field. One of the benefits of using this
technique is that analyzing of arteries on the anatomical structure can be simplified. Also we believe the technique
make it possible to improve the detectability of arteries in order to diagnosis of ASO.
II. MATERIALS AND METHODS
Figure 1 shows the CTA images which is employed in this study. In Fig.1, some artery areas are indicated with
arrows. The aim in this study is to detect the region of arteries such as anterior tibial artery, posterior tibial artery, and
fibular artery in CTA images automatically. The computerized scheme of this study is shown in Fig. 2. At first,
preprocessing is performed to segment the bone regions. In the next step, we identify initial point as a location of the
artery on the top of image sets by using mouse point manually for tracing/detecting the artery areas in the next slices,
automatically. The trace of arteries are performed by search of maximum output value of the N-Quoit filter. This trace
is continued from the second number of slice to the end of slice. Finally the detected arteries areas are displayed as a
2-D or 3-D image.

5
1. N-Quoit filter
N-Quoit filter have been proposed as a filter which enhances lung nodules in multi-detector row CT [4]. The filter,
that is a kind of morphological filters, is sensitive for the distribution of pixels like a circle in the 2-D image. Figure 3
shows the basic concept of the N-Quoit filter. With shown in Fig.3, the N-Quoit filter consists of two kinds of filter, a
point filter and a disk filter. If these filters overlay an object like a circle, then only the ring filter falls and vertical
interval has large value. On the other hand, in the case of some objects not like a circle, the ring filter does not fall as
well the point filter and vertical interval has small value. The output value of the N-Quoit filter is subtracted value of
dilation operation with these filters. Following expressions show the output of the N-Quoit filter.
),(),(),(
),(),(),(),(),(
11
1111
yxRyxfyxf
yxRyxfyxPyxfyxq
⊕−=
⊕−⊕= (1)
)},(),({max),(),( 1111),(
1111
yxRyyxxfyxRyxfrKyx
+−−=⊕∈
(2)
Where q(x,y) and f(x,y) show an output and input image, respectively. P(x1,y1) and R(x1,y1) show a point and ring filter
function, respectively. Furthermore Kr shows the domain of these filters. “⊕ ” shows dilation operation in morphology.
Ring filter function R(x1,y1) is expressed as following.
otherwise
ryxrifyxR
2
2
2
1
2
1
2
111
0),(
≤+<
∞−= (3)
Where, r1 and r2 show the internal and external diameter of the ring filter. In the CTA images, artery areas are appeared
in the form of a circle. Appling the N-Quoit filter for CTA images, the location of the arteries should have higher value
of the output image (See in Fig.4 with the arrow).

6
2. Detection of arteries employing N-Quoit filter
It is possible to identify arteries by search of the maximum value of output of the N-Quoit filter. In this paper, some
arteries are detected from CTA images by following computerized scheme; first, initial location of an artery is identified
on the top of image sets, manually. In the next step, a search region is located on the selected location. In the search
region, a location having the maximum output value of the N-Quoit filter is identified as center of the artery. The
identified location is determined as the center of search region in the next slice. These processes are continued to the
end of slices or the subtracted value of output over the successive slices is less than threshold. However, it might be
difficult to identify a location as an artery adjacent to bone. It is because that there are no differences of voxel value
between the edge of bone and arteries. To overcome this problem, in this paper, bone regions are segmented from the
CTA images based on following steps previously to avoid mis-detection of the arteries.
3. Segmentation of bone region from CTA image
For segmentation of the bone region, threshold method and distance transformations are applied to CTA image.
Our segmentation method consists of two steps; rough segmentation of bone region based on threshold and fine
segmentation of bone region based on distance map. In the rough segmentation, at first, binarization is applied on
original CTA image (Fig.5(a)) with threshold which is determined empirically (Fig.5(b)). At this point, the threshold
is relatively higher value for segmentation of internal bone region from CTA images. In the next step, an inner region of
the binarized region is also segmented as bone region by using dilation processing (Fig.5(c)). To determine more
suitable boundary of bone region, we analyze voxel average on a distance map. Distance map is obtained from the
dilated image (Fig.5(c)) by using a distance transformation. At this point, voxel value on the border of bone region

7
should have almost same value for identical structures/object on the image. Moreover, at the border, the average of
voxel value would be decreased broadly (Fig.6). So, we can obtain thresholds of TH1 and TH2 for average value and
distance value, respectively. Finally, we can obtain bone mask M(x,y) from distance map D(x,y) from
otherwise
THyxDifyxM
2),(
0
1),(
<
= (4) .
III. EXPERIMENT
In this paper, the technique has been evaluated by applying for two CTA image sets. Image size is 512 x 512[pixels]
and the image sets consist of 181 and 156 slices images, respectively. The slice thickness is 2.0[mm] and pixel spacing
is 0.528 x 0.528[mm]. The mask size is 11 x 11[pixel] and the size of r1 and r2 in equation 3 are 3 and 4, respectively.
Threshold for binarization is 1000 [H.U.]. Threshold of termination condition for trace of arteries is determined -300
empirically.
Figure 7 shows experimental results of detection of arteries. In Fig. 7, each rectangle regions on the image are
shown the selected locations by manually and automatically. In Fig.7, it is apparent that some arteries adjusted by bone
regions accurately. Figure 8 shows the 3-D image of detected arteries enhanced by red color. In Fig.8, some arteries are
displayed accurately apart from other structures. Figure 9 shows the distribution of output of N-Quoit filter in the case
of segmentation or non-segmentation of bone region. As shown Fig.9, the output of N-Quoit filter dropped broadly in
the case of non-segmentation of bone region, because the bone regions were segmented accidentally. On the other hand,
in the case of segmentation of bone region, we could avoid mis-segmentation for bone region, shown Fig.9. For
evaluation of detection of arteries, we calculate the accuracy of arteries by using following expression.

8
100×∩
=standardGold
standardGoldarteriesDetectedAccuracy (5)
The accuracy of extracted arteries is shown in Table 1. The accuracy shows that artery in the 2-D image is exactly
identified. As shown in Table1, we achieved good results of segmentation of bone region. The average of the accuracy
was 91.5[%] and computational times was 30[sec/case]. However, in Table1, the accuracy is degraded in identification
of right artery fibular and right posterior artery. This false identification can be caused by mis-segmentation of bone and
for branch of arteries.
IV. CONCLUSION
In this paper, we have developed a new technique for detection of the arteries from contrast enhanced lower CT
image by use of morphological operation. Some experimental results were shown with a good performance of
segmentation of arteries. However, some cases include mis-detections of the arteries from CTA images. In general,
there is no difference of voxel value between the border of bones and arteries, and, therefore, we need to some models
of bones or artery to segment accurately from CTA. It still remains as one of future works.
In this paper, a morphological filter is applied to detect arteries on consideration for shape of arteries like as a circle.
It will be possible to apply for other parts of body, however, more accurate for detection algorithms are needed for the
branch of arteries. Solving some technical issues for detection arteries, it will be possible to reduce of burden of
radiologist and to develop a system for detection of constriction of arteries.

9
REFERENCES
[1] Meijer WT, Hoes AW, Rutgers DM, et al.: Peripheral Arterial Disease in the Elderly: The Rotterdam study,
Arteriosclerosis, Thormbosis, and Vascular Biology, Vol.18, pp.185-192, 1998.
[2] K. Nakamura, A. Yamamoto, M. Miyazaki, et al.: Clinical usefulness of non-contrast-enhanced MRDSA to
evaluate hemodynamics of arterial diseases –initial experience-, Proc. International Society of Magnetic Resonance in
Medicine, Vol.11, p.1356, 2003.
[3] S. Busayarat, T. Zrimec: Detection of bronchopulmonary segments on high-resolution CT preliminary results, Proc.
of the Twentieth IEEE International Symposium on Computer-Based Medical Systems, pp.199-204, 2007.
[4] T. Miwa, J. Kako, S. Yamamoto, et al.: Automatic detection of lung cancers in chest CT images by the variable
N-Quoit filter, Institute of Electronics, Information, and Communication Engineers, Vol.33, No.1, pp.53-63, 2002. (in
Japanese)

10
Table 1 Result of extraction of arteries. A, B and C shows the anterior tibial artery, posterior tibial artery and fibular
artery, respectively.
A B C
Left 100.0 100.0 69.2 Case 1
Right 75.8 100.0 71.4
Left 100.0 100.0 88.5 Case 2
Right 100.0 92.5 100.0

11
Fig.1. An example of CTA
Fig.2. The procedure in this study: n shows the number of slices and N shows maximum slice number.
Fig.3. The basic concept of the N-Quoit filter
Fig.4. Distribution of pixel value (a) and output value of N-Quoit filter (b).
Fig.5. Bone segmentation (a: Original CTA image, b: binarized image, c: dilated image, d: distance map, e: result of
segmentation of bone region)
Fig.6. Distribution of average of voxel value corresponding each distance.
Fig.7 Experimental results of CTA image. Each rectangle areas on the image show the extracted artery regions.
Fig.8.Detected some arteries in 3D image
Fig.9 Distribution of output of N-Quoit filter in the case of segmentation or non-segmentation of BR.

12
Fig.1. An example of CTA
Arteria fibularis
Arteria tibialis posterior
Arteria tibialis anterior

13
Fig.2. The procedure in this study: n shows the number of slices and N shows maximum slice number.
Manual identification (n=0)
Bone segmentation
Selection of search region
Identification of arteries
n=n+1
n=N ?
Displaying identified arteries
Yes
No
Stop
Start

14
Fig.3. The basic concept of the N-Quoit filter
q
Ring filter
Point filter

15
(a)
Fig.4. Distribution of pixel value (a) and output value of N-Quoit filter (b).

16
(b)
Fig.4. Distribution of pixel value (a) and output value of N-Quoit filter (b).

17
(a)
Fig.5. Bone segmentation (a: Original CTA image, b: binarized image, c: dilated image, d: distance map, e: result of
segmentation of bone region)

18
(b)
Fig.5. Bone segmentation (a: Original CTA image, b: binarized image, c: dilated image, d: distance map, e: result of
segmentation of bone region)

19
(c)
Fig.5. Bone segmentation (a: Original CTA image, b: binarized image, c: dilated image, d: distance map, e: result of
segmentation of bone region)
20
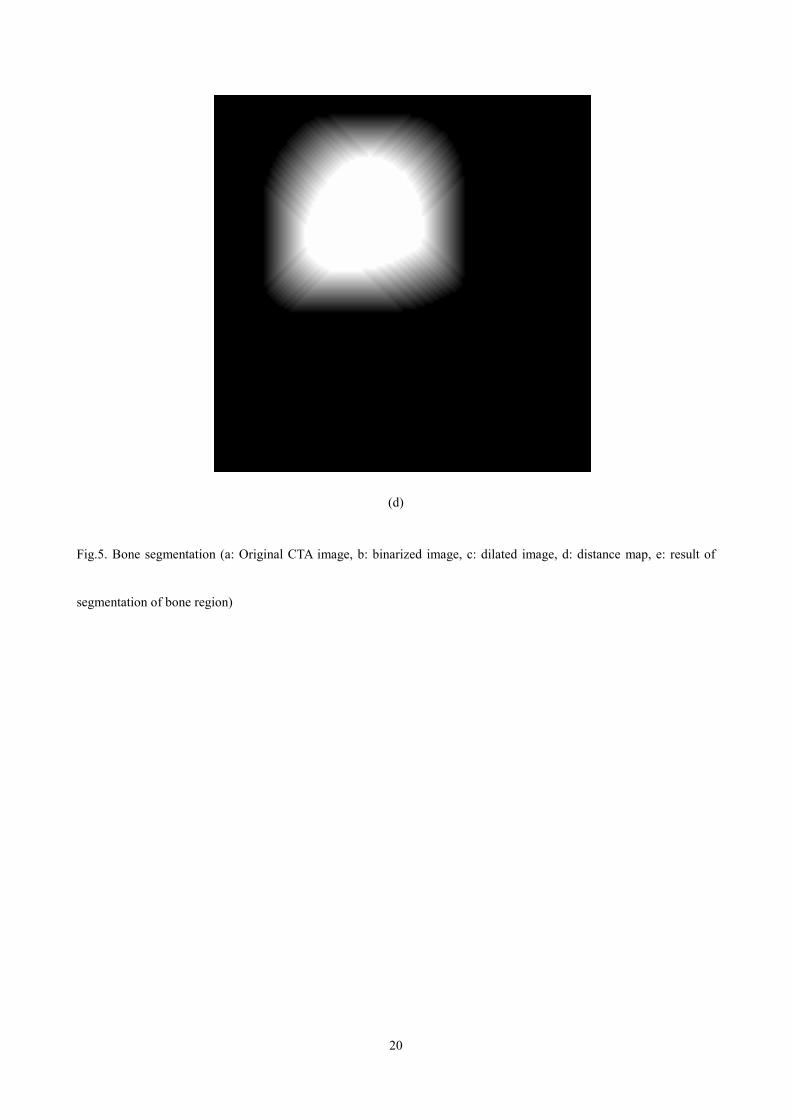
(d)
Fig.5. Bone segmentation (a: Original CTA image, b: binarized image, c: dilated image, d: distance map, e: result of
segmentation of bone region)

21
(e)
Fig.5. Bone segmentation (a: Original CTA image, b: binarized image, c: dilated image, d: distance map, e: result of
segmentation of bone region)

22
Fig.6. Distribution of average of voxel value corresponding each distance.
-800
-400
0
400
800
0 5 10 15
avera
ge
distance
TH1
TH2

23
Fig.7 Experimental results of CTA image. Each rectangle areas on the image show the extracted artery regions.

24
Fig.7 Experimental results of CTA image. Each rectangle areas on the image show the extracted artery regions.

25
Fig.7 Experimental results of CTA image. Each rectangle areas on the image show the extracted artery regions.

26
Fig.7 Experimental results of CTA image. Each rectangle areas on the image show the extracted artery regions.

27
Fig.8.Detected some arteries in 3D image

28
Fig.8.Detected some arteries in 3D image

29
Fig.8.Detected some arteries in 3D image

30
Fig.9 Distribution of output of N-Quoit filter in the case of segmentation or non-segmentation of BR.
-50
0
50
100
150
200
250
0 20 40 60 80 100 120
Number of slice
Outp
ut of N
-Quoit
fil
ter
Non-segmentation of BR Segmentation of BR