autoregressive-model-based fluorescence-lifetime measurements by phase-modulation fluorometry using...
TRANSCRIPT

Autoregressive-Model-Based Fluorescence-LifetimeMeasurements by Phase-Modulation Fluorometry Using aPulsed-Excitation Light Source and a High-GainPhotomultiplier Tube
TETSUO IWATA,* RITSUKI ITO, YASUHIRO MIZUTANI, and TSUTOMU ARAKIDivision of Energy System, Institute of Technology and Science, The University of Tokushima, 2-1 Minami-Jyosanjima, Tokushima 770-8506,
Japan (T.I., R.I., Y.M); and Department of Systems and Human Science, Graduate School of Engineering Science, Osaka University, Toyonaka,Osaka 560-8531 Japan (T.A.)
We propose a novel method for measuring fluorescence lifetimes by use of
a pulsed-excitation light source and an ordinary or a high-gain
photomultiplier tube (PMT) with a high-load resistor. In order to obtain
the values of fluorescence lifetimes, we adopt a normal data-processing
procedure used in phase-modulation fluorometry. We apply an autore-
gressive (AR)-model-based data-analysis technique to fluorescence- and
reference-response time-series data obtained from the PMT in order to
derive plural values of phase differences at a repetition frequency of the
pulsed-excitation light source and its harmonic ones. The connection of
the high-load resistor enhances sensitivity in signal detection in a certain
condition. Introduction of the AR-model-based data-analysis technique
improves precision in estimating the values of fluorescence lifetimes.
Depending on the value of the load resistor and that of the repetition
frequency, plural values of fluorescence lifetimes are obtained at one time
by utilizing the phase information of harmonic frequencies. Because the
proposed measurement system is simple to construct, it might be effective
when we need to know approximate values of fluorescence lifetimes
readily, such as in the field of biochemistry for a screening purpose.
Index Headings: Fluorescence lifetime; Autoregressive model; Phase
modulation fluorometry; Pulsed excitation method; Spectroscopic tech-
niques; Instrumentation.
INTRODUCTION
Recently, we proposed a mathematical method for analyzingdata obtained from a frequency-multiplexed phase-modulationfluorometer (FM-PMF) using an autoregressive (AR) modeland constructed the FM-PMF in order to derive plural values offluorescence lifetimes simultaneously from a multi-componentsample.1 The AR model is usually used for estimating a powerspectrum with high resolution from time-series data with ashort time of duration.2–4 We have shown that the AR model isapplicable to estimating a phase spectrum as well as the powerspectrum. As a result, we were able to apply the AR-model-based data-analysis technique to data obtained from the FM-PMF and to derive plural values of phase differences over theindividual frequency components of a reference waveform andas a result, the plural fluorescence lifetimes.
In the present article, we show that the AR-model-baseddata-analysis technique is also applicable to fluorescence-decaytime-series data obtained from the pulsed excitation method.The aim is to derive approximate values of fluorescencelifetimes in an analogue manner from fluorescent samples thathave moderately high quantum efficiencies without using the
conventional time-correlated single-photon counting instru-ment, which is somewhat expensive, sophisticated, and timeconsuming for measurements. The proposed method requiresonly a normal pulsed-excitation light source and a standarddigital oscilloscope with a frequency bandwidth around 100MHz at most, which is especially useful for obtainingapproximate values of fluorescence lifetimes readily in thefield of biochemistry or in its related fields for a screeningpurpose.
There has been extensive work done in this area sinceMerkelo and his co-workers5,6 first proposed and constructed aphase modulation fluorometer utilizing a high-repetition-frequency mode-locked laser and a direct-reading phase-delaymeter. A cross-correlation phase fluorometer using twomodulation frequencies has been reported by Spencer andWeber.7 A variable frequency instrument was described byHaar and Hauser.8 A continuously variable frequency cross-correlation phase fluorometer using a Pockels cell has beenreported by Gratton and his co-workers.9 A more sophisticatedreincarnation of this type of instrument has been reported byLakowicz and his co-workers.10–12 Although such systemswork quite well, they might require precise and carefuladjustment of high-frequency electronic circuits and detectors.They are somewhat complicated and expensive and might beinfluenced by high-frequency noise.
The focus of attention in the present article is to propose aconcept of a new and simple measurement scheme differentfrom the previously reported ones: one that has high sensitivityand precision in signal detection and is easy to construct. In theproposed scheme, we use a normal pulsed-excitation lightsource and an ordinary or a high-gain photomultiplier tube(PMT) attached to a high-value load resistor, where values offluorescence lifetimes are obtainable with the aid of the AR-model-based phase-estimation technique. The first key point isthat we intentionally set the value of the load resistor connectedto the output of the PMT used as a photodetector high, wherewe can use the high-gain PMT or the PMT equipped with alarge number of dynodes, instead of the conventional high-speed one, for measurements of fluorescence lifetimes. This isan advantage because it is usually difficult for the PMT to haveboth the high-speed and the high-gain property simultaneously.Although such a setup brings about distortion in thefluorescence decay waveform, large enhancement in thesensitivity of the signal detection is expected in a certaincondition. This is because the output of the PMT is consideredas an approximately constant current source (see Appendix). Inaddition, high-frequency noise is eliminated effectively
Received 25 March 2009; accepted 17 August 2009.* Author to whom correspondence should be sent. E-mail: [email protected].
1256 Volume 63, Number 11, 2009 APPLIED SPECTROSCOPY0003-7028/09/6311-1256$2.00/0
� 2009 Society for Applied Spectroscopy

because a cut-off frequency can be limited to a relatively lowvalue. As a result, the signal-to-noise ratio (SNR) in the signalmeasurement can be improved. If we assume that thefluorescence decay waveform is expressed by a singleexponential function, precision in estimating the value of thefluorescence lifetime is also improved by utilizing phaseinformation of harmonics of the repetition frequency of thepulsed-excitation light source. Furthermore, obtaining pluralvalues of fluorescence lifetimes of a multi-component sampleat the same time is possible like the conventional frequency-domain fluorometers. The second key point to be emphasized isthat the value(s) of the fluorescence lifetime(s) is (are)obtainable from a few periods of time-series data thanks tothe AR-model-based data-analysis technique. Unlike theconventional frequency-domain fluorometer, we do not alwaysneed a mode-locked laser with a high repetition frequency. Inour knowledge, no such idea has been proposed in the literaturenor has such an instrument been constructed commercially.
PRINCIPLE OF OPERATION
Figure 1 shows the principle of operation of the proposedmethod. Figure 1a shows an excitation-light pulse train, whoserepetition frequency is fR ¼ 1/T and the full width at half-maximum (FWHM) is tw, where T is a period. Figure 1b showsan impulse response waveform of the PMT. We assume that itis expressed by a single exponential function with a timeconstant sPMT¼ RC for simplicity, where R is the load resistorof the PMT and C is a capacitor connected to the load resistorin parallel to form a low-pass filter (LPF), if necessary. Byconnecting the large-value load resistor, the output voltageobtainable from the PMT becomes large because the PMT isconsidered as an approximately constant current source. Thisscheme, therefore, enhances the sensitivity in signal detectionand allows us to easily observe the signal. In addition, the LPFeliminates high-frequency noise, which improves the SNR insignal measurements. Figure 1c shows a reference waveformthat is given by a numerical convolution integral of thewaveforms shown in Figs. 1a and 1b. When we are going tomeasure a true fluorescence-decay waveform as shown in Fig.1d, which is assumed as a single-exponential decay waveformagain with a lifetime sF, the final fluorescence waveform to bemeasured becomes that shown in Fig. 1e, which is given by aconvolution integral of Figs. 1c and 1d. Therefore, if wemeasure the reference waveform shown in Fig. 1c and thefluorescence one shown in Fig. 1e, we are able to derive thetrue fluorescence-decay waveform by a numerical deconvolu-tion procedure13 in principle.
In the proposed method, however, we apply the AR-model-based data-analysis technique separately to the reference andthe fluorescence waveform, which are two sets of time-seriesdata with several periods: from which we derive phasedifferences at the repetition frequency fR and its harmonicones ifR (i ¼ 2, 3, 4, . . .) if necessary and finally obtain thevalues of fluorescence lifetimes. Here, we use the phasedifferences rather than modulation ratios to derive the values offluorescence lifetimes from the viewpoint of the SNR.1 In orderto derive the values of fluorescence lifetimes from the phasedifferences, we use the conventional procedure used in phase-modulation fluorometry. For the case of a single-componentsample that exhibits a single-exponential fluorescence-decaywaveform, we can obtain the same value of the fluorescencelifetime for the fundamental repetition frequency and its
harmonic ones. For the case of a multi-component sample,we can obtain plural values of fluorescence lifetimes and theirinitial amplitude ratios at the same time. For a two-componentsample, for example, we can obtain two fluorescence-lifetimevalues sF1 and sF2 and their initial amplitude ratio r¼ a1/a2, ifwe measure phase values at at least three frequencies.
The AR-model-based data-analysis technique can be usedfor estimating a phase spectrum as well as a power spectrum.1
Unlike the conventional Fourier transform that needs manyperiods of data, the AR-mode-based technique is applicable toa few periods of data. Because the data-processing procedurefor deriving the values of phases by the AR model1,14,15 andthat of fluorescence lifetimes1,16,17 have been reportedelsewhere in detail, we use them as a calculation tool in thepresent article.
NUMERICAL SIMULATION
Because the enhancement in sensitivity in signal detectiondue to using the high-value load resistor for the PMT is quiteobvious in principle, we focus on the AR-model-based phase-derivation technique in this section. We carried out twonumerical simulations: for the case of a single-componentsample and the case of a two-component sample.
For the Case of a Single-Component Sample. Weassumed that an excitation light pulse was expressed by asech-shaped function with a repetition frequency fR and theFWHM tw ¼ 60.0 ps. We also assumed that a fluorescencedecay waveform was given by a single-exponential decay
FIG. 1. Illustrative diagrams explaining the principle of the proposed method;(a) an excitation-light pulse train with a repetition frequency fR, (b) anexponential decay waveform with a time constant sPMT, (c) a referencewaveform to be measured, (d) a true fluorescence-decay waveform with alifetime sF, and (e) a fluorescence waveform to be measured.
APPLIED SPECTROSCOPY 1257

function with a lifetime sF ¼ 3.0 ns. Also, we fixed the totalnumber of data points to be N ¼ 3000. Then, we changed therepetition frequency fR between 1.0 and 10.0 MHz with aninterval of 1.0 MHz and varied the time constant sPMT between50 and 300 ns with a 25.0 ns step. Then we superimposedGaussian-distributed noise with a relative standard deviation r¼ 1.0% on the reference and the fluorescence waveform. Here,we defined a normalized frequency by X¼ fR/fS and fixed it tobe 0.001, where fS is a sampling frequency. In the simulation,we derived the value sF of the fluorescence lifetime from anequation 2pfmsF ¼ tan hi,
18 where hi (i ¼ 1, 2, and 3) was aphase difference of the modulation frequency component fm¼ifR of the fluorescence waveform over those of the reference
one. Then we calculated two kinds of estimation errors at thefollowing three modulation frequencies: fundamental repetitionfrequency fm¼ fR, the second harmonic repetition frequency fm¼2fR, and the third harmonic repetition frequency fm¼3fR: oneis a relative phase-estimation error Dhi/hi and the other arelative fluorescence-lifetime estimation error DsF/sF. Figures2a and 2b show two-dimensional plots of Dhi/hi and DsF/sF,respectively, as functions of the repetition frequency fR and thetime constant sPMT for a modulation frequency fm¼ fR, wherewe fixed the order of the AR model to be m¼ 1056. Figures 2cand 2d show those for fm¼ 2fR and Figs. 2e and 2f for fm¼ 3fR.
From these results, we found that the relative errors of Dhi/hi
and DsF/sF were not so much dependent on the value of sPMT.
FIG. 2. (a) A contour plot of the relative phase estimation error Dhi/hi (%) as functions of a repetition frequency fR and a time constant sPMT at fm¼ fR, where X¼0.001, N¼3000, m¼1056, and r¼ 1.0 %, and (b) that of the relative fluorescence-lifetime estimation error DsF/sF (%) as functions of fR and sPMT. (c, d) The sameas in (a) and (b), respectively, but calculated at fm ¼ 2fR. (e, f) The same as in (a) and (b), respectively, but calculated at fm ¼ 3fR.
1258 Volume 63, Number 11, 2009
This is because the ac amplitude of the waveform becomessmall for a large value of sPMT and a fixed value of T ¼ 1/f.When comparing those errors for fm ¼ fR with those for fm ¼2fR, the latter is a bit better than the former. However, those forfm¼ 3fR are almost the same as those for fm¼ fR. This is due tothe fact that the magnitude of the power spectrum at fm ¼ 3fRbecomes small and therefore the SNR is decreased. On the onehand, increase in the repetition frequency fR results in decreasein Dhi/hi and DsF/sF. This can be explained by the relationdDsF/sF ¼ �dfm þ 2dhi/sin 2hi, which is derived from theequation 2pfmsF¼ tan hi. For fm¼ fR¼ 7.0 MHz, DsF/sF is lessthan 1.5%. For fm ¼ 2fR ¼ 14.0 MHz, DsF/sF , 1.0% for theparameter setting of sF¼ 3.0 ns and r¼ 0%. For such a shortduration of time-series data, we could not use the conventionalfast-Fourier transform procedure to derive the true phasevalues. From these facts and the experimental results shown inthe next section, we found the effectiveness of the use of theAR-model-based data-analysis technique.
For the Case of a Two-Component Sample. Next, wesynthesized two fluorescence decay waveforms by addition oftwo single-exponential decay functions with their fluorescencelifetimes sF1 and sF2 and the ratio r¼ a1/a2: (a) sF1¼ 50.0 ns,sF2¼ 10.0 ns, and r¼ 0.5, and (b) sF1¼ 20.0 ns, sF2¼ 4.0 ns,
and r ¼ 0.5. Then, we superimposed the Gaussian-distributednoise with r¼ 1.0%. Other simulation parameters are the sameas those used in the previous section. First, we derived threevalues of the phase differences h1, h2, and h3 at the frequenciesfR, 2fR, and 3fR, respectively. Table I summarizes the finalestimated results for sF1, sF2, and r. From these results, wefound that the proposed procedure was applicable to a multi-component sample.
MEASUREMENT RESULTS AND DISCUSSION
In order to demonstrate the actual performance of theproposed method, we measured fluorescence lifetimes ofstandard samples: 10 ppm quinine sulfate in 0.1 N H2SO4,10 ppm rhodamine 6G in ethanol, and 10�4 M/L coumarin inethanol. The excitation light source used was an ultravioletlaser diode (PLP-10, Hamamatsu Photonics), whose centeremission wavelength was 372.0 nm, and the repetitionfrequency was fR ¼ 10.0 MHz. We used a type 1P28 PMT(Hamamatsu Photonics) with R ¼ 20 kX. The digitaloscilloscope used was a Model TES5054B (Tektronix) withfS¼5.0 GHz and the total number of data points was N¼3000.The reference and the fluorescence waveforms were separatelyaccumulated 10 000 times on the memory equipped in thedigital oscilloscope.
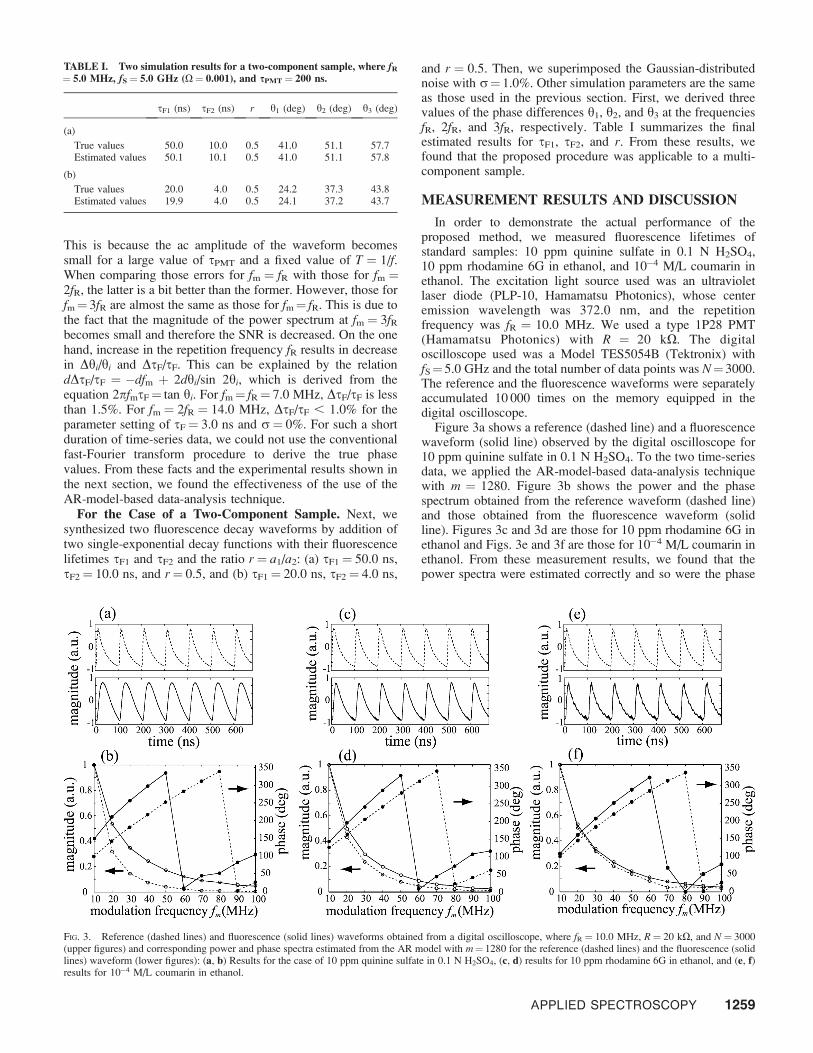
Figure 3a shows a reference (dashed line) and a fluorescencewaveform (solid line) observed by the digital oscilloscope for10 ppm quinine sulfate in 0.1 N H2SO4. To the two time-seriesdata, we applied the AR-model-based data-analysis techniquewith m ¼ 1280. Figure 3b shows the power and the phasespectrum obtained from the reference waveform (dashed line)and those obtained from the fluorescence waveform (solidline). Figures 3c and 3d are those for 10 ppm rhodamine 6G inethanol and Figs. 3e and 3f are those for 10�4 M/L coumarin inethanol. From these measurement results, we found that thepower spectra were estimated correctly and so were the phase
TABLE I. Two simulation results for a two-component sample, where fR
¼ 5.0 MHz, fS ¼ 5.0 GHz (X ¼ 0.001), and sPMT¼ 200 ns.
sF1 (ns) sF2 (ns) r h1 (deg) h2 (deg) h3 (deg)
(a)
True values 50.0 10.0 0.5 41.0 51.1 57.7Estimated values 50.1 10.1 0.5 41.0 51.1 57.8
(b)
True values 20.0 4.0 0.5 24.2 37.3 43.8Estimated values 19.9 4.0 0.5 24.1 37.2 43.7
FIG. 3. Reference (dashed lines) and fluorescence (solid lines) waveforms obtained from a digital oscilloscope, where fR¼ 10.0 MHz, R¼ 20 kX, and N¼ 3000(upper figures) and corresponding power and phase spectra estimated from the AR model with m¼ 1280 for the reference (dashed lines) and the fluorescence (solidlines) waveform (lower figures): (a, b) Results for the case of 10 ppm quinine sulfate in 0.1 N H2SO4, (c, d) results for 10 ppm rhodamine 6G in ethanol, and (e, f)results for 10�4 M/L coumarin in ethanol.
APPLIED SPECTROSCOPY 1259
spectra. Considering the magnitude of each power spectrum,we derived five values of fluorescence lifetimes at themodulation frequencies fm¼ fR, 2fR, 3fR, 4fR, and 5fR.
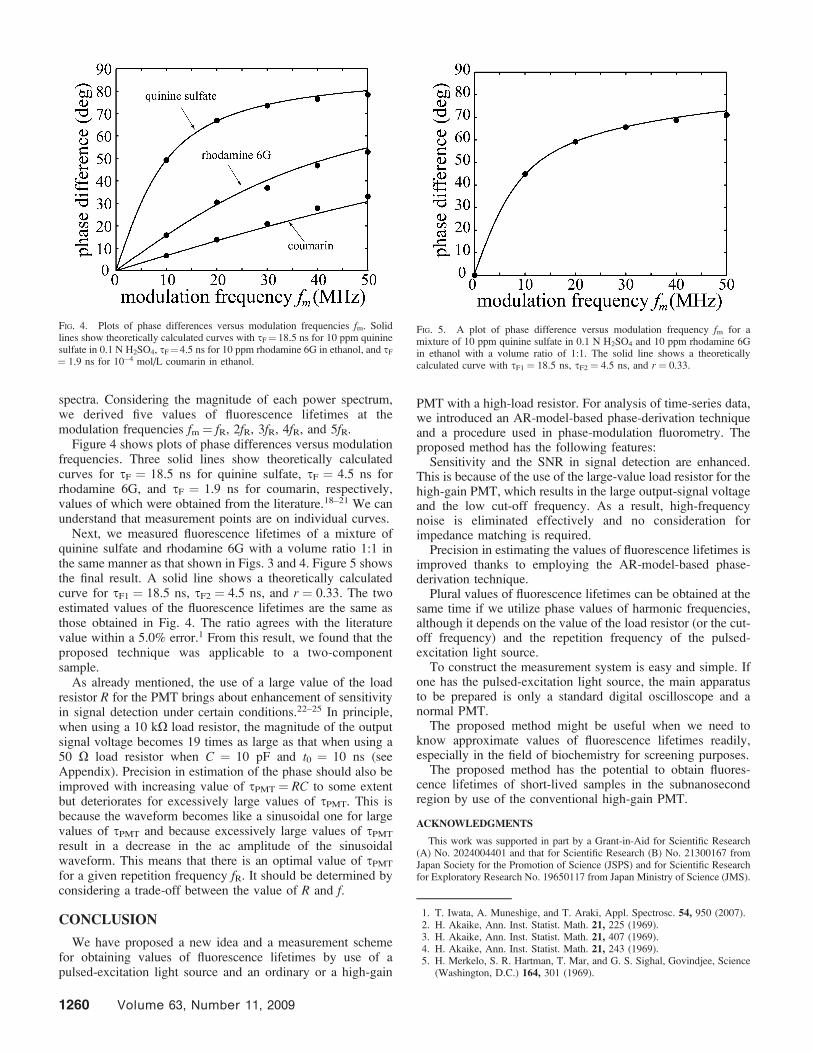
Figure 4 shows plots of phase differences versus modulationfrequencies. Three solid lines show theoretically calculatedcurves for sF ¼ 18.5 ns for quinine sulfate, sF ¼ 4.5 ns forrhodamine 6G, and sF ¼ 1.9 ns for coumarin, respectively,values of which were obtained from the literature.18–21 We canunderstand that measurement points are on individual curves.
Next, we measured fluorescence lifetimes of a mixture ofquinine sulfate and rhodamine 6G with a volume ratio 1:1 inthe same manner as that shown in Figs. 3 and 4. Figure 5 showsthe final result. A solid line shows a theoretically calculatedcurve for sF1 ¼ 18.5 ns, sF2 ¼ 4.5 ns, and r ¼ 0.33. The twoestimated values of the fluorescence lifetimes are the same asthose obtained in Fig. 4. The ratio agrees with the literaturevalue within a 5.0% error.1 From this result, we found that theproposed technique was applicable to a two-componentsample.
As already mentioned, the use of a large value of the loadresistor R for the PMT brings about enhancement of sensitivityin signal detection under certain conditions.22–25 In principle,when using a 10 kX load resistor, the magnitude of the outputsignal voltage becomes 19 times as large as that when using a50 X load resistor when C ¼ 10 pF and t0 ¼ 10 ns (seeAppendix). Precision in estimation of the phase should also beimproved with increasing value of sPMT ¼ RC to some extentbut deteriorates for excessively large values of sPMT. This isbecause the waveform becomes like a sinusoidal one for largevalues of sPMT and because excessively large values of sPMT
result in a decrease in the ac amplitude of the sinusoidalwaveform. This means that there is an optimal value of sPMT
for a given repetition frequency fR. It should be determined byconsidering a trade-off between the value of R and f.
CONCLUSION
We have proposed a new idea and a measurement schemefor obtaining values of fluorescence lifetimes by use of apulsed-excitation light source and an ordinary or a high-gain
PMT with a high-load resistor. For analysis of time-series data,we introduced an AR-model-based phase-derivation techniqueand a procedure used in phase-modulation fluorometry. Theproposed method has the following features:
Sensitivity and the SNR in signal detection are enhanced.This is because of the use of the large-value load resistor for thehigh-gain PMT, which results in the large output-signal voltageand the low cut-off frequency. As a result, high-frequencynoise is eliminated effectively and no consideration forimpedance matching is required.
Precision in estimating the values of fluorescence lifetimes isimproved thanks to employing the AR-model-based phase-derivation technique.
Plural values of fluorescence lifetimes can be obtained at thesame time if we utilize phase values of harmonic frequencies,although it depends on the value of the load resistor (or the cut-off frequency) and the repetition frequency of the pulsed-excitation light source.
To construct the measurement system is easy and simple. Ifone has the pulsed-excitation light source, the main apparatusto be prepared is only a standard digital oscilloscope and anormal PMT.
The proposed method might be useful when we need toknow approximate values of fluorescence lifetimes readily,especially in the field of biochemistry for screening purposes.
The proposed method has the potential to obtain fluores-cence lifetimes of short-lived samples in the subnanosecondregion by use of the conventional high-gain PMT.
ACKNOWLEDGMENTS
This work was supported in part by a Grant-in-Aid for Scientific Research(A) No. 2024004401 and that for Scientific Research (B) No. 21300167 fromJapan Society for the Promotion of Science (JSPS) and for Scientific Researchfor Exploratory Research No. 19650117 from Japan Ministry of Science (JMS).
1. T. Iwata, A. Muneshige, and T. Araki, Appl. Spectrosc. 54, 950 (2007).2. H. Akaike, Ann. Inst. Statist. Math. 21, 225 (1969).3. H. Akaike, Ann. Inst. Statist. Math. 21, 407 (1969).4. H. Akaike, Ann. Inst. Statist. Math. 21, 243 (1969).5. H. Merkelo, S. R. Hartman, T. Mar, and G. S. Sighal, Govindjee, Science
(Washington, D.C.) 164, 301 (1969).
FIG. 4. Plots of phase differences versus modulation frequencies fm. Solidlines show theoretically calculated curves with sF¼ 18.5 ns for 10 ppm quininesulfate in 0.1 N H2SO4, sF¼4.5 ns for 10 ppm rhodamine 6G in ethanol, and sF
¼ 1.9 ns for 10�4 mol/L coumarin in ethanol.
FIG. 5. A plot of phase difference versus modulation frequency fm for amixture of 10 ppm quinine sulfate in 0.1 N H2SO4 and 10 ppm rhodamine 6Gin ethanol with a volume ratio of 1:1. The solid line shows a theoreticallycalculated curve with sF1¼ 18.5 ns, sF2¼ 4.5 ns, and r ¼ 0.33.
1260 Volume 63, Number 11, 2009

6. J. H. Hammond, Govindjee, and H. Merkelo, Biophys. J. 12, 809 (1972).7. R. D. Spencer and G. Weber, Ann. N.Y. Acad. Sci. 158, 361 (1969).8. H. P. Haar and M. Hauser, Rev. Sci. Instrum. 49, 632 (1978).9. B. A. Fedderson, D. W. Piston, and E. Gratton, Rev. Sci. Instrum. 60, 2929
(1989).10. G. Laczko, I. Gryczynski, Z. Gryczynski, W. Wiczk, H. Malak, and J. R.
Lakowicz, Rev. Sci. Instrum. 61, 2331 (1990).11. K. W. Berndt and J. R. Lakowicz, Rev. Sci. Instrum. 61, 2557 (1990).12. J. R. Lakowicz, I. Gryczynski, Z. Gryczynski, E. Danielsen, and M. J.
Wirth, J. Phys. Chem. 96, 3000 (1992).13. T. Iwata, H. Shibata, and T. Araki, Meas. Sci. Technol. 19, 045601 (2008).14. K. Sasaki and H. Msuhara, Appl. Opt. 30, 977 (1991).15. K. Sasaki and H. Msuhara, Appl. Opt. 35, 5312 (1996).16. E. Gratton, M. Limkeman, J. R. Lakiwicz, B. P. Maliwal, H. Cherek, and
G. Laczko, Biophys. J. 46, 479 (1984).17. J. R. Lakowicz, G. Laczko, H. Cherek, E. Gratton, and M. Limkeman,
Biophys. J. 46, 463 (1984).18. T. Iwata, T. Kamada, and T. Araki, Opt. Rev. 7, 495 (2000).19. I. B. Berlman, Handbook of Fluorescence Spectra of Aromatic Molecules
(Academic Press, New York, 1971), 2nd ed.20. D. V. O’Connor, S. R. Meech, and D. Phillips, Chem. Phys. Lett. 88, 22
(1982).21. D. A. Barrow and B. R. Lentz, Chem. Phys. Lett. 104, 163 (1984).22. T. Iwata, T. Takasu, and T. Araki, Appl. Spectrosc. 57, 1145 (2003).23. T. Iwata, T. Inoue, and T. Araki, Opt. Rev. 11, 19 (2004).24. T. Iwata and T. Araki, Appl. Spectrosc. 59, 1049 (2005).25. T. Iwata, H. Ochi, and T. Araki, Meas. Sci. Technol. 20, 065901 (2009).
APPENDIX
Effect of the Value of the Load Resistor for thePhotomultiplier Tube on the Output Voltage. Although itis well known that the output characteristics of the PMT areconsidered as that of an approximately constant-current sourceand, therefore, its output voltage is dependent on the value ofthe load resistor R, we explain it quantitatively here. Let thetotal amount of electric charges obtainable from the PMT be Q¼ it0, where i is a constant output current from the PMT and t0is its equivalent pulse duration. The equivalent pulse durationis determined from a convoluted waveform by considering thetransit time spread of photoelectrons in the PMT, the rise timeof the PMT itself, and the pulse width of the incident light. Fora typical high-gain PMT, the transit time spread and the risetime are a few nanoseconds and around ten nanoseconds,
respectively, depending on the applied voltage to the PMT andon the type of PMT. Therefore, it is reasonable to set the valueof t0 in a range from 5 ns to 15 ns. If we connect the loadresistor to the PMT, the time constant of the output circuitry ofthe PMT is given by sPMT ¼ RC, where C is a capacitorconnected in parallel to the load resistor. Then the outputvoltage as a function of time t from such a PMT is given asfollows:
vðtÞ ¼ iR 1� exp � t
sPMT
� �� �; ð0 � t � t0Þ ðA1aÞ
vðtÞ ¼ iR 1� exp � t0sPMT
� �� �exp � t � t0
sPMT
� �; ðt0 � tÞ
ðA1bÞ
Then, the maximum value vmax of the output voltage isobtained when t¼ t0 as
vmax ¼ iR 1� exp � t0sPMT
� �� �¼ Q
C
1
x1� expð�xÞ½ � ¼ Q
Cf ðxÞ
ðA2Þ
where x ¼ t0/sPMT and f(x)¼ 1/x[1 � exp(�x)].The magnitude of f(x) is increased from zero to unity with
decreasing x from infinity to zero. Therefore, we canunderstand that vmax is increased with decreasing x for fixedvalues of Q and C: vmax is increased with the value of R. Forexample, if we increase the value of R from 50 X to 10 kX forC¼ 10 pF and t0¼ 10 ns, the value of x decreases from 20 to0.1 and the value of f(x) increases from 0.05 to 0.95; the valueof vmax is increased by 19 times. Even when t0¼5 ns, the valueof x decreases from 10 to 0.05 and the value of f(x) increasesfrom 0.10 to 0.98; the value of vmax is increased by 9.8 times.Therefore, the multiplication factor for vmax depends on aninstrumental condition. It is effective when the initial value of xis large: for a large t0 and a small C.
APPLIED SPECTROSCOPY 1261