bachelor thesis - zcu.cz
TRANSCRIPT

UNIVERSITY OF THE WEST BOHEMIA
Faculty of Mechanical Engineering
Study program: B 2301 Mechanical Engineering Strand of study: Transport and Handling Machinery
BACHELOR THESIS The equipment for biaxial examination
Autor: Parsa Hassasroudsari
Thesis supervisor: Doc. Ing. Václav Kubec, Ph.D.
Academic year 2019/2020


III
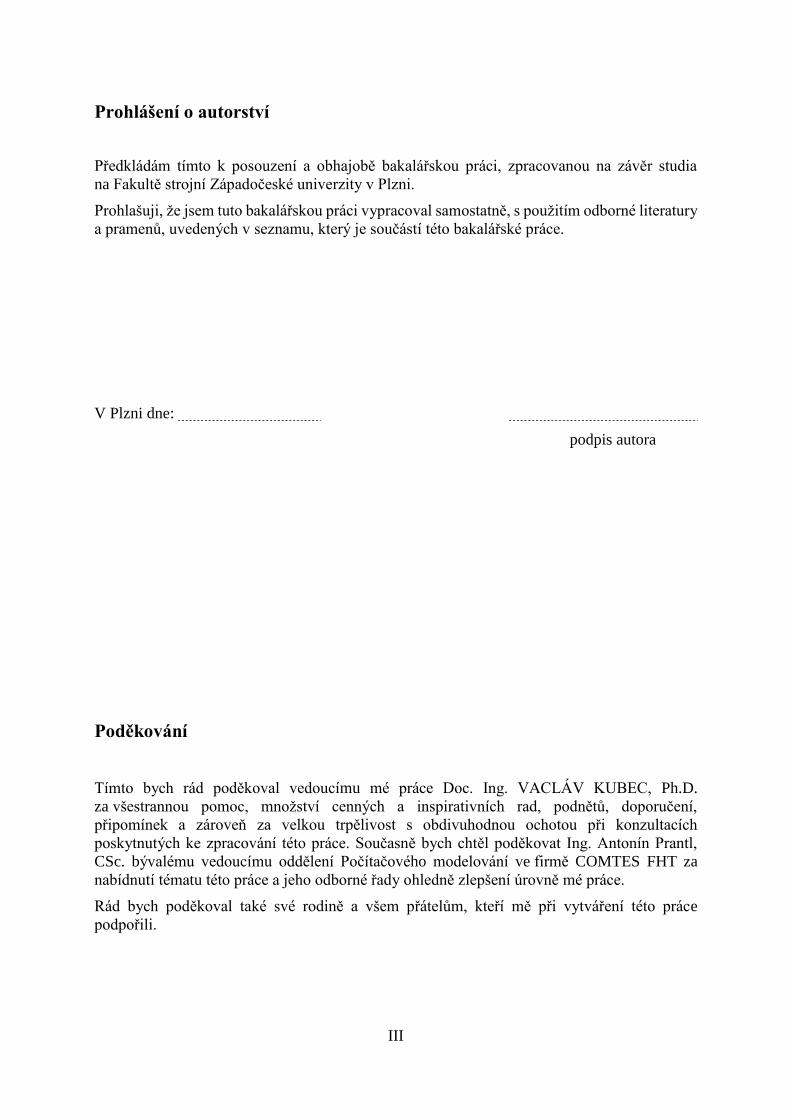
Prohlášení o autorství
Předkládám tímto k posouzení a obhajobě bakalářskou práci, zpracovanou na závěr studia
na Fakultě strojní Západočeské univerzity v Plzni.
Prohlašuji, že jsem tuto bakalářskou práci vypracoval samostatně, s použitím odborné literatury
a pramenů, uvedených v seznamu, který je součástí této bakalářské práce.
V Plzni dne:
podpis autora
Poděkování
Tímto bych rád poděkoval vedoucímu mé práce Doc. Ing. VACLÁV KUBEC, Ph.D.
za všestrannou pomoc, množství cenných a inspirativních rad, podnětů, doporučení,
připomínek a zároveň za velkou trpělivost s obdivuhodnou ochotou při konzultacích
poskytnutých ke zpracování této práce. Současně bych chtěl poděkovat Ing. Antonín Prantl,
CSc. bývalému vedoucímu oddělení Počítačového modelování ve firmě COMTES FHT za
nabídnutí tématu této práce a jeho odborné řady ohledně zlepšení úrovně mé práce.
Rád bych poděkoval také své rodině a všem přátelům, kteří mě při vytváření této práce
podpořili.

IV
ANOTAČNÍ LIST BAKALÁŘSKÉ PRÁCE
AUTOR Příjmení
Hassasroudsari
Jméno
Parsa
STUDIJNÍ OBOR 23-35-8 „Dopravní a manipulační technika“
VEDOUCÍ PRÁCE Příjmení (včetně titulů)
Doc. Ing. KUBEC, Ph.D.
Jméno
Václav
PRACOVIŠTĚ ZČU - FST - KKS
DRUH PRÁCE
DIPLOMOVÁ
BAKALÁŘSKÁ
Nehodící se
škrtněte
NÁZEV PRÁCE Přípravek pro biaxiální zkoušky
FAKULTA
Strojní
KATEDRA
KKS
ROK
ODEVZD.
2020
POČET STRAN (A4 a ekvivalentů A4)
CELKEM 59 TEXTOVÁ ČÁST 52 GRAFICKÁ
ČÁST 7
STRUČNÝ POPIS
ZAMĚŘENÍ, TÉMA, CÍL
POZNATKY A PŘÍNOSY
Cílem práce je navrhnout zařízení pro testování vzorků
typu motýlek. Na základě rešerše na téma biaxiální
zkoušky a analýzy současného stavu provést návrh řešení
přípravku pro zkoušení vzorků typu motýlek.
KLÍČOVÁ SLOVA
Biaxiální zkoušky, Tvarné porušování, Vzorky motýlek,
Simulace, CAD modelování, CAE, Biaxiální přípravky,
UBTD, Arcan apparatus, 3D skenování, Materiálové
zkoušky, MTS 810, Mechanické vedení.

V
SUMMARY OF BACHELOR SHEET
AUTHOR Surname
Hassasroudsari
Name
Parsa
FIELD OF STUDY 23-35-8 “Transport and handling machinery“
SUPERVISOR Surname (Inclusive of Degrees)
Doc. Ing. Kubec, Ph.D.
Name
Václav
INSTITUTION ZČU - FST - KKS
TYPE OF WORK DIPLOMA BACHELOR Delete when not
applicable
TITLE OF THE
WORK
The equipment for biaxial examination
FACULTY
Mechanical
Engineering
DEPARTMENT
Machine
Design
SUBMITTED
IN
2020
NUMBER OF PAGES (A4 and eq. A4)
TOTALLY 59 TEXT PART 52 GRAPHICAL
PART
7
BRIEF DESCRIPTION
TOPIC, GOAL,
RESULTS AND
CONTRIBUTIONS
The aim of this work is to design testing equipment for
butterfly specimens. Based on intensive research on the
topic of the biaxial testing devices, the present work,
provide improving of the design and founding efficient
solution for the current equipment.
KEY WORDS
Biaxial test, Butterfly specimens, 3D scanning, CAD design,
CAE, Material experiment, Simulation, Arcan apparatus,
Mechanical guiding elements, MTS 810, Fracture
characterization.
VI
Contents
1 Introduction ........................................................................................................................ 1
1.1 Thesis meaning ............................................................................................................ 1
1.2 Thesis aim .................................................................................................................... 2
2 Introduction to the problem ................................................................................................ 3
Why applying biaxial testing on butterfly samples ..................................................... 3
Butterfly shaped samples ............................................................................................. 5
Testing device .............................................................................................................. 7
Arcan apparatus [1] .............................................................................................. 7
Universal Biaxial Testing Device (UBTD) .......................................................... 9
Testing equipment ŠKODA JS for butterfly specimen ...................................... 11
3 Analysis of the current state ............................................................................................. 16
Description of loading conditions .............................................................................. 16
Equivalent butterfly shape specimens ....................................................................... 18
4 Experiment series no.1 ..................................................................................................... 23
MTS 810 Material Test System ................................................................................. 24
Dial gauge indicator ................................................................................................... 25
3D Scanner GOM ATOS capsule 12M ..................................................................... 26
Measurement results .................................................................................................. 28
Free-moving ....................................................................................................... 29
Specimens analysis and lateral deformation ...................................................... 30
Sample V2 and its influence on the reaction force ............................................. 32
3D Scanning result ............................................................................................. 33
Conclusion of experiment series no.1........................................................................ 33
5 Solution variants ............................................................................................................... 34
1st variant – ball bearing ............................................................................................ 34
2nd variant – Without the guide .................................................................................. 36
Comparison-MCDA .................................................................................................. 37
Solution of the upper nut ........................................................................................... 38
Nut modification ................................................................................................ 39
Ring modification ............................................................................................... 40
6 Applying the solution variants ......................................................................................... 41
Experiment series no.2 .............................................................................................. 41
ARAMIS DIC system ........................................................................................ 41
Testing specimens .............................................................................................. 42

VII
Testing steps ....................................................................................................... 44
Measurement results .................................................................................................. 44
Stage B vs stage A .............................................................................................. 44
Stage C ............................................................................................................... 47
7 Conclusion and outlook .................................................................................................... 48
8 List of symbols and abbreviations .................................................................................... 49
9 References ........................................................................................................................ 50
10 List Attachments .............................................................................................................. 52

Západočeská univerzita v Plzni. Fakulta strojní. Bakalářská práce, akad. rok 2019/20
Katedra konstruování strojů Parsa Hassasroudsari
1
1 Introduction
This bachelor thesis considers the issue of biaxial testing and design of biaxial testing
equipment for specimens that due to their special geometrical character are called ‘butterfly’.
The topic of this thesis was commissioned by the COMTES FHT firm in Dobřany, which owns
a custom made device for testing butterfly-type specimens. This equipment applies biaxial
testing on various materials, especially steel. During testings, the device is clamped into a
universal testing machine.
The equipment available in COMTES FHT firm is an originally testing device, specifically
designed and made to perform biaxial testing. After several testing attempts, during evaluation
and comparison of the current device’s results with other tests and computer numerical
simulations, it was found out that the available testing equipment was not accurate enough for
achieving the best results. This inaccuracy does not only affect the results
of experimental measurements but also particularly appears in virtual measurements using
numerical simulation called the FEM method.
Based on the analysis of the initial state of the equipment, it was evaluated that the main factor
influencing the magnitude of reaction forces is the friction value and insufficient stiffness in
the device’s guidance, consequently increases the measurement inaccuracy.
The main goal of the bachelor thesis is to analyse the current design of the equipment
for biaxial tests and based on FEM analyses, propose an optimal solution for the modified
device’s design.
1.1 Thesis meaning
Various mechanical examinations on different materials and specimens help us understand
their mechanical properties or, in other words, their behaviour under specific circumstances.
Mechanical testing is applied to a wide range of areas in mechanical engineering.
Ductile failure is mostly understood as a process of material’s body separation and subsequent
fracture of mainly metallic materials under conditions of monotonic loading. Ductile failure
is also known as plastic collapse, general yielding, or ductile overload, and is the failure mode
that occurs when a material is simply loaded to beyond its ultimate tensile strength [20].
The problem of ductile failure covers a wide area of technical applications. Nowadays, it
is increasing its importance due to the struggle of reducing production costs of individual
products or equipment by increasing their durability, lifetime, and safety. And in optimizing
technological processes such as cutting, drawing, extrusion, or machining has significant
importance. It is used in the design and optimization of production tools, etc. Nowadays due to
the wide range and importance of this phenomenon, a large number of commercial and
scientific workplaces are dealing with the issue of ductile failure/fracture.
It is well known that, in order to accurately characterize the failure properties of materials,
to formulate related constitutive and evolutionary damage laws, it is necessary to perform
an experimental analysis. One of the most important actions is the biaxial test of butterfly
specimen, which is also called multiaxial butterfly testing. Planar biaxial testing applies force
in both the x and y directions, allowing researchers to analyse the anisotropic behaviours
of materials. The main aim of biaxial loading is to analyse the stress state of the specimen and

Západočeská univerzita v Plzni. Fakulta strojní. Bakalářská práce, akad. rok 2019/20
Katedra konstruování strojů Parsa Hassasroudsari
2
thus determine whether the selected material is suitable for use in a particular case.
From this point of view, the issue of ductile failure and biaxial tests are applied to wide areas
in mechanical engineering, including, the automotive, aerospace, as well as the electrical
industry. Therefore, in order to select the suitable material for an application, it is very important
to perform a measurement correctly with minimum error or inaccuracy and thus
to select the right and optimal material for the application.
The disadvantage is that the experimental procedures and requirements used for this purpose,
due to the complexity of the test equipment and the production of test specimens which
are usually circular or thin-walled cylindrical specimens, are relatively expensive.
For biaxial loading, there are various measurement methods, distinguished mainly by the type
of testing equipment, the shape of a sample, and measurement conditions. Testing equipment
is one of the main keys to accomplishing successful biaxial testing of specimens. This essay
focuses on specific testing equipment that allows biaxial measurement on a butterfly shape
sample.
1.2 Thesis aim
This thesis aims to focus on the existence of frictional forces in the current equipment. The
evaluation is done according to the experiments. Based on the experiments, the reference FEM
calculation of the current device’s design is compiled. Thus based on the experiments and FEM
calculations, the solution variants were proposed to minimize the frictional forces and increase
the rigidity of the device’s guidance by improving the equipment’s design.

Západočeská univerzita v Plzni. Fakulta strojní. Bakalářská práce, akad. rok 2019/20
Katedra konstruování strojů Parsa Hassasroudsari
3
2 Introduction to the problem
First of all, in order to make a better understanding of the topic, the research on this chapter
is going to focus on biaxial equipment for butterfly specimens, their design, usage, and
construction.
The aim of this research on equipment for biaxial testing is to obtain information on:
How is the history of these devices and why they have been continually used until now
What is different between particular types of these devices and how they were designed,
Difference between their constructional solutions,
What are their advantages and disadvantages?
Why applying biaxial testing on butterfly samples
Generally, a fracture can be defined as a process, in which by the influence of loading
new faces are created, or in other words, solid will separate in two or more parts. The material
fraction can be divided from different points of view as a type of loading, energy
and fractographic aspects, etc.
When it is about loading isotropic elastic-plastic materials, typical of which are metals, new
stress states are developed that can generally lead to different responses such as elastic
deformation, plastic deformation, or even failure. Elastic behaviour of the material under the
tensile test is characterized by Hook’s law. Here stress and deformation depend only
on Poisson’s ratio and Young’s modulus. Plastic deformation is defined by hardening curves,
laws, and different plasticity models are expressed by equations.
In order to understand the fracture properties of materials, it is necessary to apply shear, single-
axis, planar, and planar biaxial testing. These tests provide different stress states.
To describe the problem of flexible bodies, a continuum model is widely used in mechanics,
which assumes that substances retain their properties for any small volume of material.
The indisputable advantage of this approach is its sophisticated mathematical theory.
This continuous environment model is sufficient in a common work, in which there is no need
to take the particle structure of real materials into account.
The state of stress at each point of the continuum can be described by symmetrical stress tensor
σij. It is a second-order tensor with only 6 independent components due
to its symmetry. Assuming that all material properties are identical in any direction (the material
is isotropic), the stress-strain effect in terms of material strength can be fully described using
the three principal stresses σ 1, σ 2, σ 3 [1].
Authors studying ductile damage often use special parameters to describe stress states.
One of the parameters is dimensionless hydrostatic pressure η, referred to as a triaxiality.
The stress states can be described by the stress triaxiality and the Lode parameter. Stress
triaxiality is the ratio of mean stress to equivalent stress.
𝜼 = −𝒑
𝒒=
𝝈𝒎
𝝈𝒆𝒌
(𝑰)
𝒑 = −𝝈𝒎 = −𝟏
𝟑(𝝈𝟏 + 𝝈𝟐 + 𝝈𝟑) = −
𝟏
𝟑 𝑱𝟏 (𝑰𝑰)

Západočeská univerzita v Plzni. Fakulta strojní. Bakalářská práce, akad. rok 2019/20
Katedra konstruování strojů Parsa Hassasroudsari
4
σ𝑚 is the mean hydrostatic stress, which corresponds to the negative value of the hydrostatic
pressure p. To express the definition of other quantities, it is necessary to express the invariants
of the stress deviator.
𝒒 = 𝝈𝒆𝒌 = √𝟏
𝟐[(𝝈𝟏 − 𝝈𝒎)𝟐 + (𝝈𝟐 − 𝝈𝒎)𝟐 + (𝝈𝟑 − 𝝈𝒎)𝟐] = √𝟑𝑱𝟐 (𝑰𝑰𝑰)
Other parameters include the normalized third invariant stress, the Lode parameter ξ, (in the
interval of (0 < ξ < (𝜋/3)) or the normalized Lode angle θ̅ (in the interval of -1 < θ̅ <1), which
is defined by the equations below. This parameter expresses the effect of shear stress
on damage initiation.
𝝃 = (𝒓
𝒒)𝟑 = 𝒄𝒐𝒔(𝟑𝜽) (𝑰𝑽) �̅� = 𝟏 − (
𝟔𝜽
𝝅) = 𝟏 −
𝟐
𝝅𝒂𝒓𝒄𝒄𝒐𝒔𝝃 (𝑽)
𝒓 = [𝟐𝟕
𝟐(𝝈𝟏 − 𝝈𝒎)(𝝈𝟐 − 𝝈𝒎)(𝝈𝟑 − 𝝈𝒎)]
𝟏/𝟑
= (𝟐𝟕
𝟐𝑱𝟑)𝟏/𝟑 (𝑽𝑰)
Here J1 is the first stress invariant, J2 and J3 are second and third invariants.
Based on these relationships, a graph of triaxiality and a Lode angle related to shape damage
can be defined (Fig 2). The fracture function thus becomes the surface ε̅f (η, θ̅).
One of the models describing the fracture function in this way is the criterion proposed by Bai
and Wierzbicki [1]. Its model can be expressed in its final form:
�̅�𝒇 (𝜼 , �̅�) = [𝟏
𝟐(𝒄𝟏𝒆−𝒄𝟐𝜼 + 𝒄𝟓𝒆−𝒄𝟔𝜼) − 𝒄𝟑𝒆−𝒄𝟒𝜼] �̅�𝟐 +
𝟏
𝟐(𝒄𝟏𝒆−𝒄𝟐𝜼 − 𝒄𝟓𝒆−𝒄𝟔𝜼)�̅� + 𝒄𝟑𝒆−𝒄𝟒𝜼 (𝑽𝑰𝑰)
The resulting shape of the fracture function is shown in Fig 1.
Fig 1- General 3D fracture locus Bai-Wierzbicki [1]

Západočeská univerzita v Plzni. Fakulta strojní. Bakalářská práce, akad. rok 2019/20
Katedra konstruování strojů Parsa Hassasroudsari
5
Indexes 𝑐1….6 (in equation VII) can be obtained based on material tests. One of these tests is a
test with butterfly-shaped samples (in Fig 2).
Fig 2- Position of simulated mechanical testings in (η, 𝜃) space
Butterfly shaped samples
The shape of the butterfly-shaped specimen was designed so that the fracture would occur
at a limited small point and at the same time, a wide stress area would be loaded
at the point of crack creation under different loading conditions. Another factor was
the possibility to describe the state of plane stress for a combination of different stresses which
in this sample is realized as tension, a combination of tension and shear, pressure,
a combination of shear and pressure, and only shear.
The first generation of the butterfly sample was designed in 2002, Mohr and Henn were
the first to design it. Then the second generation from Bao and Bai was designed and the third
generation was again designed by Mohr and Dunand.
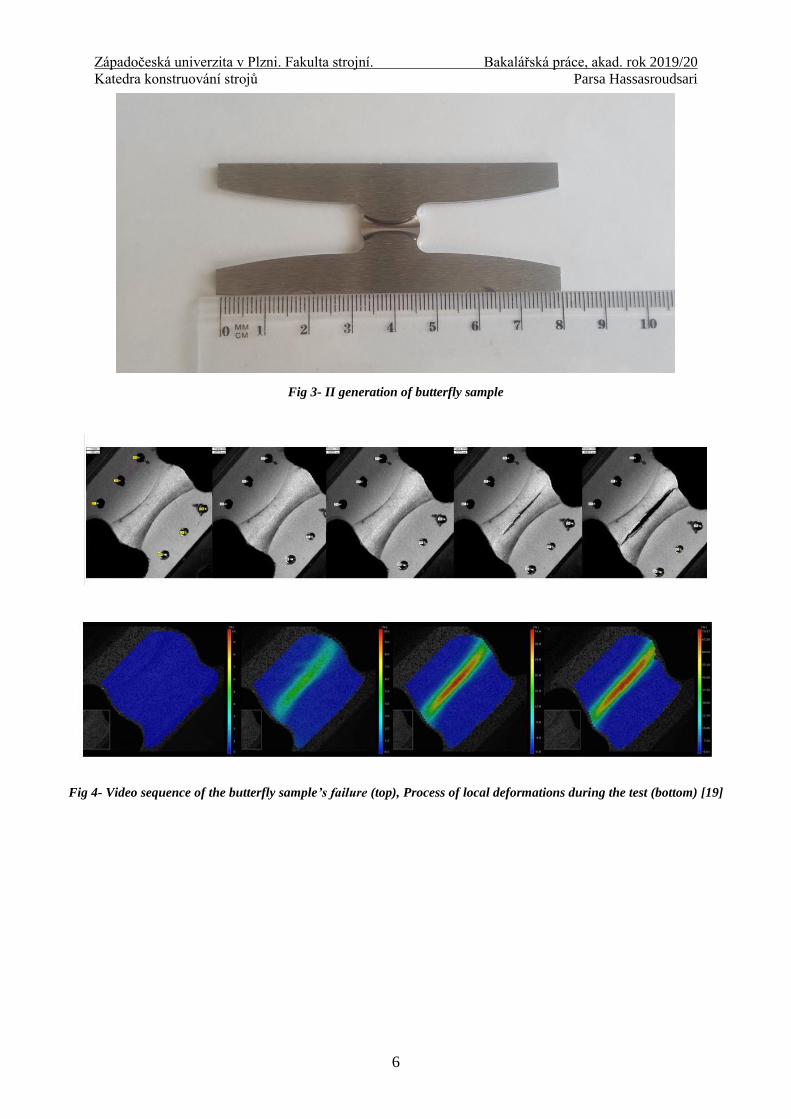
At the moment, the second generation of the designed sample is applied to the equipment
in COMTES FHT Company. In Fig 3 it is possible to observe that the measured part
of the sample includes two curves to ensure that the stress is located mainly in the centre
of the sample (in Fig 4). In order to significantly reduce the possibility of cracking at the body
boundary, the long specimen arms provide a sufficient grip area, which is important
for proper load transfer from testing equipment to the specimen. Another feature
of the sample is a significant change in thickness between the shoulder and the measuring
section, causing the arm to remain with minimal deformation during the loading process.
Západočeská univerzita v Plzni. Fakulta strojní. Bakalářská práce, akad. rok 2019/20
Katedra konstruování strojů Parsa Hassasroudsari
6
Fig 4- Video sequence of the butterfly sample’s failure (top), Process of local deformations during the test (bottom) [19]
Fig 3- II generation of butterfly sample

Západočeská univerzita v Plzni. Fakulta strojní. Bakalářská práce, akad. rok 2019/20
Katedra konstruování strojů Parsa Hassasroudsari
7
Testing device
For biaxial loading to butterfly-shaped specimens, in the framework of the project
identified as FR-TI2/279, between COMTES FHT, Skoda JS company and CVUT
University, custom made testing equipment was developed (Fig 5). This equipment was
designed to apply planar biaxial loading to the specimen during the uniaxial loading
of the equipment itself. The designed equipment allowed samples to rotate by 10 °
in the range of 0 ° to 90 ° and get different stresses stages.
Fig 5 - Example of a device’s loading method during (from the left side 0°-90°-110°) [7]
This device was designed according to the Universal Biaxial Testing Device (UBTD)
and the basic design of the UBTD is inspired by the so-called Arcan apparatus.
Further, in this chapter, the design and principles of known equipment will be presented.
Arcan apparatus [1]
The simple circular notched specimen was originally proposed by Arcan
to characterize the elastic properties of fiber-reinforced composites. Unfortunately,
its optimized geometry does not allow to measure with reasonable accuracy both the material
shear strength and the conditions of failure under a generic biaxial stress state, since
the effects of stress concentration on the fillets of the two V-grooves and the inner circular
edges are responsible for premature fractures due to the uniaxial stress states of the notches
edges.
The methodology originally proposed by Arcan provides for using either circular notched
specimens subjected to diametrical compression or doubly V-notched specimens, also named
butterfly-shaped specimens, on which testing loads are transferred using a special fixture
(Arcan fixture). Both kinds of the specimen can achieve in the region closest to the minimum
transversal section a quasi-uniform stress field with principal stresses of opposite sign.
Until now, this type of testing has been used for measuring the elastic shear moduli of linear
orthotropic materials for the analysis of the non-linear shear response of thick-section pultruded
FRP composites beams for the study of mixed or mode II fracture toughness
of materials and joints, or to analyse the strain localization phenomena in cellular materials.
The geometry of Arcan’s equipment was defined by the following parameters: thickness, t, the
radius of the external circular edge R, radius of the internal circular edge, r,
the semi-opening angle of the notch in degrees, the notch fillet radius, and the half-height, h,
that the minimum strength section would have if notch fillet radius was zero (Fig 6). The
original geometry proposed by Arcan is defined by the following values:

Západočeská univerzita v Plzni. Fakulta strojní. Bakalářská práce, akad. rok 2019/20
Katedra konstruování strojů Parsa Hassasroudsari
8
h/R = 0.1, r/R = 0.2, r/R = 0.028, q = 45°.
Fig 6- Original geometry of Arcan’s specimen [1]
Equipment designed by Arcan has been changed over time for various reasons.
The first initial test setup has been shown to be appropriate, and in some cases, there have been
some undesirable factors affecting testing performance and results. For example, because the
specimen is not supported in the lateral direction, a small deviation
from alignment to the plane can lead to instability problems, so one of the reasons
for the modification was to improve the device for better planar shear control.
Regarding the general shape of the device, generally, to form a test configuration, the Arcan
device is made of two identical parts. Between these two halves, either a butterfly-shaped
sample is glued or they are joined by connecting of a screw connection in an anti-symmetrical
sense.

Západočeská univerzita v Plzni. Fakulta strojní. Bakalářská práce, akad. rok 2019/20
Katedra konstruování strojů Parsa Hassasroudsari
9
Fig 7- Modified Arcan apparatus (left) [17] and its method of loading (right)[1]
Universal Biaxial Testing Device (UBTD)
The basic design of the Universal Biaxial Testing Device is inspired by the so-called
Arcan apparatus, mentioned in the previous chapter.
UBTD multiaxial testing machines are more expensive than uniaxial machines, mainly due
to their complexity of the device’s frame requiring more actuators and associated devices
to accomplish the testing.
UBTD was designed to improve the instability and control problems of the Arcan’s Apparatus.
It has also been adapted later for different types of testing such as the biaxial testing of
aluminium honeycomb. On Fig 8, picture along with a sketch of the testing device are shown[4].
The testing apparatus consists of a movable and a fixed portion. The movable portion
of the apparatus [parts #1a, #2a, #3a in Fig 8] slides vertically along two fixed guidance rods
(part #4, the second rod is on the back of the apparatus); whereas the fixed portion
of the apparatus (parts #1b, #2b, #3b, #4) is rigidly connected to the table of a universal testing
machine. Thus, the only motion allowed by the design of the apparatus
is the translation of the movable portion along the vertical axis. By placing the specimen
(part #5) between the movable and fixed portions, a controlled displacement can be applied to
the specimen shoulders.
The direction of the displacement loading is defined by the orientation of the specimen
concerning the vertical axis of the apparatus. This orientation, the so-called biaxial loading
angle α [Fig 8], is set before testing by rotating the specimen holders (parts #2a, #2b, #3a, #3b).
Tests can be performed at any loading angle between 0 and 90 degrees.
The specimen is attached to the apparatus using a set of clamps (parts #2a, #2b). A total
clamping force of about 100 kN is applied by seven cap screws (type M5-12.8).
Along with a 200 μm deep hatch pattern on the specimen clamps, any relative motion between
the specimen and the specimen grips could be successfully prevented.
The vertical force is measured by the 200 kN load cell of the universal testing machine.
A linear voltage displacement transducer (LVDT) has been attached to the back of the moving

Západočeská univerzita v Plzni. Fakulta strojní. Bakalářská práce, akad. rok 2019/20
Katedra konstruování strojů Parsa Hassasroudsari
10
specimen holder [not shown in Fig 8] to measure the vertical displacement. The experimental
measurements are summarized by a plot of the vertical force against the vertical displacement
of the moving specimen holder [4].
Fig 8- Example of UBTD and its loading method [4]
Different types of universal biaxial testing devices have very similar designs and they differ
only in small details. In order to illustrate another type of similar device, here's an example
of UBTD, which, unlike the previous testing device, has a visible LVDT and a different type
of butterfly specimen holder.
Butterfly shaped specimen are mounted in a custom made testing device (UBTD) in a very
similar way as the previous equipment. However, like the previous one, it is designed to work
with the same amount of universal loaded kinematically driving machine (see Fig 9).
By suitably changing orientation of the specimen with respect to the loading direction, one can
obtain various stress states from pure tension through tension/shear, shear, shear/compression,
and all the way to axial compression. The setup shown in Fig 9 corresponds to = 10°, which
represents either a shear/tension or shear/compression condition. One LVDT (Linear Variable
Displacement Transducer) and two load cells were built into the UBTD to measure the travel
of the left part of the UBTD and horizontal forces acting on the device, respectively [5].

Západočeská univerzita v Plzni. Fakulta strojní. Bakalářská práce, akad. rok 2019/20
Katedra konstruování strojů Parsa Hassasroudsari
11
Fig 9- II example of UBTD [5]
Testing equipment ŠKODA JS for butterfly specimen
As in previous cases, this custom made equipment in COMTES FHT was designed
to apply planar biaxial loading to the specimen during the uniaxial loading of the equipment
itself (see Fig 5). It applies biaxial loading to the specimen and by changing the orientation
of the specimen, the device allows us to change stress states in different loading cases which
are described in the table below (Table 1).
Mr Růžička, who in his dissertation dealt with material testing on this equipment
and he reports this statement from the experiment: „During testing, however, it was found
that the measured data were greatly distorted due to friction in the guiding elements (columns)
of the fixture“ [1].
Table 1- Stress states according to the sample’s mounting degree [7]
Specimen orientation Stress state
Butterfly 0° Tension / Compression
Butterfly 30° Tension + Shear
Butterfly 45° Tension + Shear
Butterfly 70° Tension + Shear
Butterfly 90° Shear
Butterfly 100° Compression + Shear
Butterfly 110° Compression + Shear
Západočeská univerzita v Plzni. Fakulta strojní. Bakalářská práce, akad. rok 2019/20
Katedra konstruování strojů Parsa Hassasroudsari
12
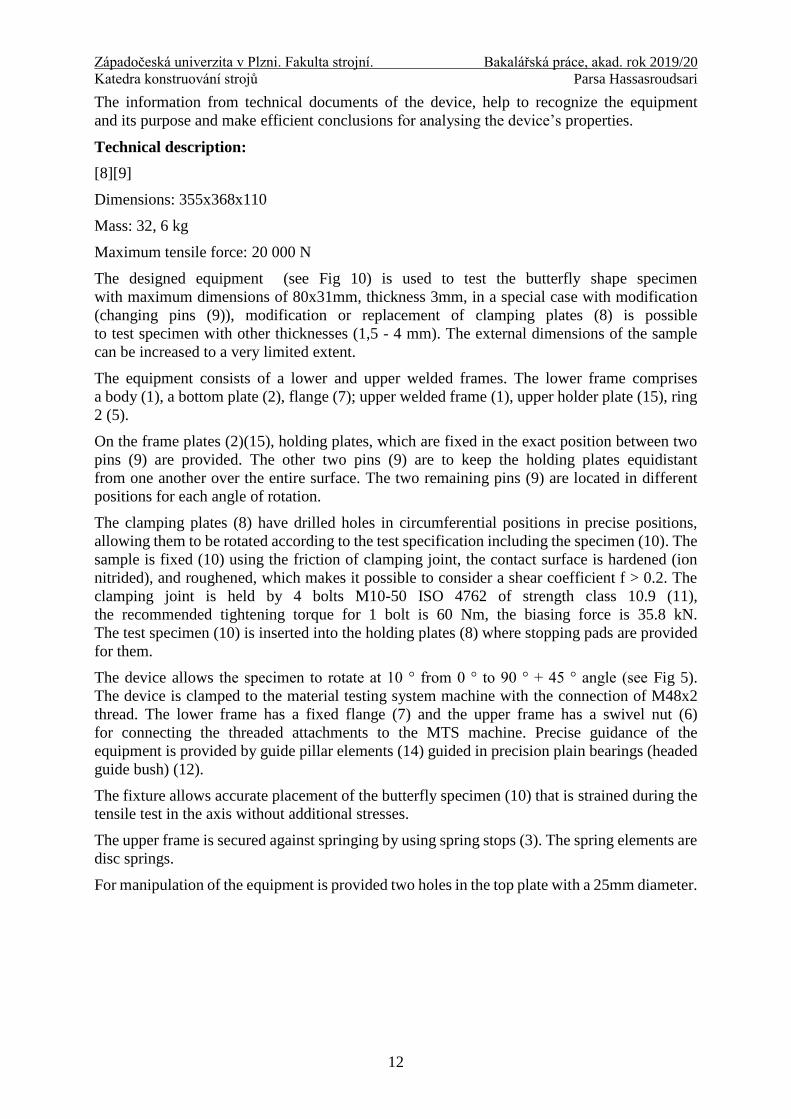
The information from technical documents of the device, help to recognize the equipment
and its purpose and make efficient conclusions for analysing the device’s properties.
Technical description:
[8][9]
Dimensions: 355x368x110
Mass: 32, 6 kg
Maximum tensile force: 20 000 N
The designed equipment (see Fig 10) is used to test the butterfly shape specimen
with maximum dimensions of 80x31mm, thickness 3mm, in a special case with modification
(changing pins (9)), modification or replacement of clamping plates (8) is possible
to test specimen with other thicknesses (1,5 - 4 mm). The external dimensions of the sample
can be increased to a very limited extent.
The equipment consists of a lower and upper welded frames. The lower frame comprises
a body (1), a bottom plate (2), flange (7); upper welded frame (1), upper holder plate (15), ring
2 (5).
On the frame plates (2)(15), holding plates, which are fixed in the exact position between two
pins (9) are provided. The other two pins (9) are to keep the holding plates equidistant
from one another over the entire surface. The two remaining pins (9) are located in different
positions for each angle of rotation.
The clamping plates (8) have drilled holes in circumferential positions in precise positions,
allowing them to be rotated according to the test specification including the specimen (10). The
sample is fixed (10) using the friction of clamping joint, the contact surface is hardened (ion
nitrided), and roughened, which makes it possible to consider a shear coefficient f > 0.2. The
clamping joint is held by 4 bolts M10-50 ISO 4762 of strength class 10.9 (11),
the recommended tightening torque for 1 bolt is 60 Nm, the biasing force is 35.8 kN.
The test specimen (10) is inserted into the holding plates (8) where stopping pads are provided
for them.
The device allows the specimen to rotate at 10 ° from 0 ° to 90 ° + 45 ° angle (see Fig 5).
The device is clamped to the material testing system machine with the connection of M48x2
thread. The lower frame has a fixed flange (7) and the upper frame has a swivel nut (6)
for connecting the threaded attachments to the MTS machine. Precise guidance of the
equipment is provided by guide pillar elements (14) guided in precision plain bearings (headed
guide bush) (12).
The fixture allows accurate placement of the butterfly specimen (10) that is strained during the
tensile test in the axis without additional stresses.
The upper frame is secured against springing by using spring stops (3). The spring elements are
disc springs.
For manipulation of the equipment is provided two holes in the top plate with a 25mm diameter.

Západočeská univerzita v Plzni. Fakulta strojní. Bakalářská práce, akad. rok 2019/20
Katedra konstruování strojů Parsa Hassasroudsari
13
Fig 10- 3D model of the current equipment
Figure’s explanations:
1) Frame body for mounting the bearings 9) Pin
2) Bottom plate 10) Butterfly testing specimen
3) Stopping supplement 11) Screw M10x50
4) Ring1 12) Headed guide bush
5) Ring 2 13) Clamping chuck
6) Nut 14) Guide pillar element
7) Flange 15) Upper plate
8) Clamping plate
Západočeská univerzita v Plzni. Fakulta strojní. Bakalářská práce, akad. rok 2019/20
Katedra konstruování strojů Parsa Hassasroudsari
14
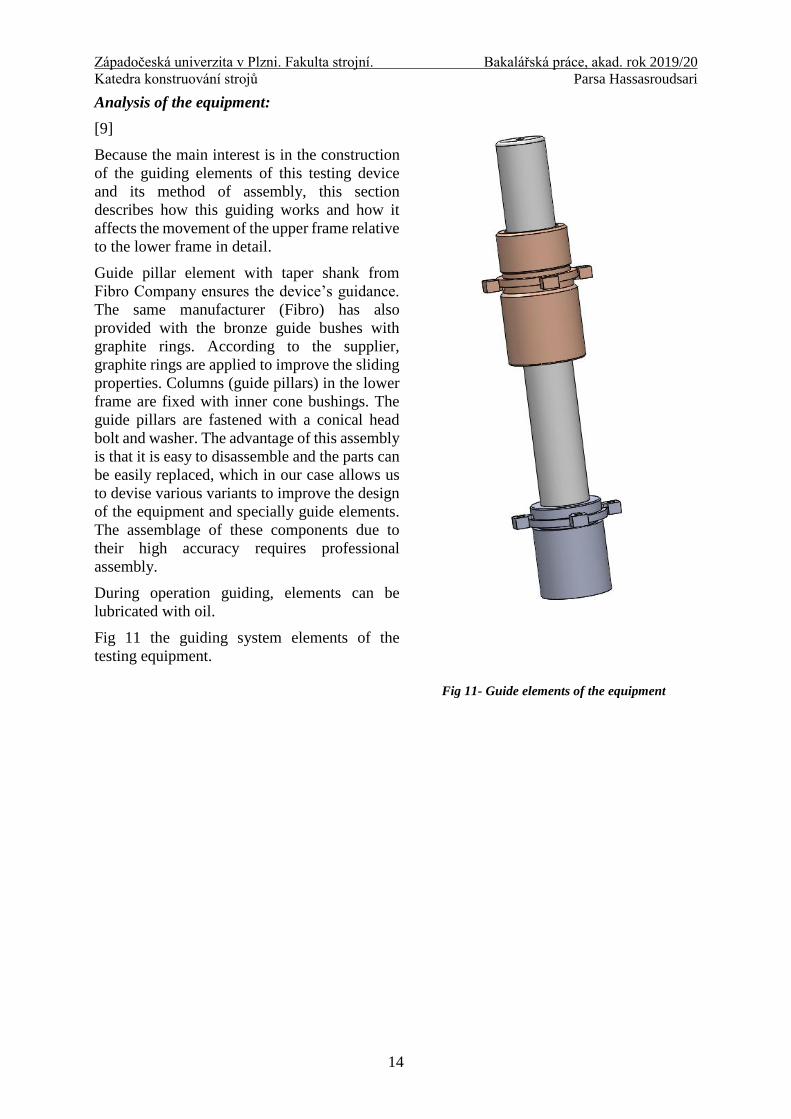
Analysis of the equipment:
[9]
Because the main interest is in the construction
of the guiding elements of this testing device
and its method of assembly, this section
describes how this guiding works and how it
affects the movement of the upper frame relative
to the lower frame in detail.
Guide pillar element with taper shank from
Fibro Company ensures the device’s guidance.
The same manufacturer (Fibro) has also
provided with the bronze guide bushes with
graphite rings. According to the supplier,
graphite rings are applied to improve the sliding
properties. Columns (guide pillars) in the lower
frame are fixed with inner cone bushings. The
guide pillars are fastened with a conical head
bolt and washer. The advantage of this assembly
is that it is easy to disassemble and the parts can
be easily replaced, which in our case allows us
to devise various variants to improve the design
of the equipment and specially guide elements.
The assemblage of these components due to
their high accuracy requires professional
assembly.
During operation guiding, elements can be
lubricated with oil.
Fig 11 the guiding system elements of the
testing equipment.
Fig 11- Guide elements of the equipment

Západočeská univerzita v Plzni. Fakulta strojní. Bakalářská práce, akad. rok 2019/20
Katedra konstruování strojů Parsa Hassasroudsari
15
In the upper part, there are elastic stops to prevent the upper frame from rolling out. The stops
are fixed directly to the guide pillars with an M8-25 screw. Disc springs are used to secure
the soft stop (
Fig 12).
Fig 12- Detail of mounted guide elements

Západočeská univerzita v Plzni. Fakulta strojní. Bakalářská práce, akad. rok 2019/20
Katedra konstruování strojů Parsa Hassasroudsari
16
3 Analysis of the current state
This chapter aims to verify the form and origin of frictional forces when testing
a specimen by the equipment.
In order to analyse the current state of the existing device, an experiment was conducted, aimed
at measuring the displacement of the equipment in both axial and radial directions (lateral
deformation) and the resistance of the device when measuring a butterfly shape specimen.
Description of loading conditions
In the first step for designing the experiment, loading condition of the specimen during
its testing must be defined. The holes in the clamping plates allow us to rotate the plates
and load specimen from 0 ° to 90 ° to 10 ° with an additional 45 ° case.
The main goal of this experiment is to obtain the value of lateral forces when moving the
equipment’s guiding during the experiment. Therefore a loading condition was chosen,
in which the sample causes greatest reaction force in a radial direction to the guide pillars
(columns) of the equipment. According to the geometry and design of the device, it can
be seen that the guidance of this equipment ensures rigidity and uniform movement
of the plates in relation to each other.
FEM analysis has been carried out based on this consideration. Equivalent geometry
of a butterfly shape specimen was designed to perform numerical simulations at different
angles. During the numerical simulation, the specimen is fixed in all directions beyond the
lower part, in the same time force is applied to the upper part while the centre of the sample is
free (see Fig 13). This boundary condition is applied to the sample at different angles, as shown
in the graph below (see Fig 15).
Fig 13- Boundry condition for the numerical simulation
Západočeská univerzita v Plzni. Fakulta strojní. Bakalářská práce, akad. rok 2019/20
Katedra konstruování strojů Parsa Hassasroudsari
17
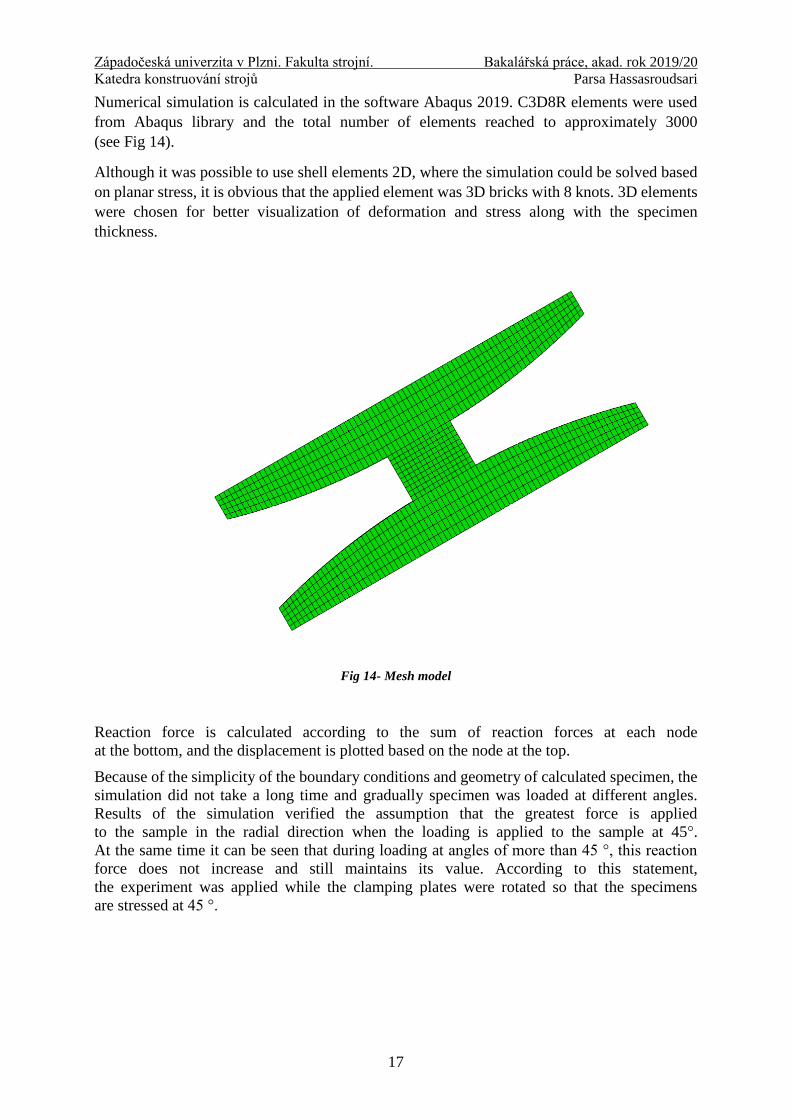
Numerical simulation is calculated in the software Abaqus 2019. C3D8R elements were used
from Abaqus library and the total number of elements reached to approximately 3000
(see Fig 14).
Although it was possible to use shell elements 2D, where the simulation could be solved based
on planar stress, it is obvious that the applied element was 3D bricks with 8 knots. 3D elements
were chosen for better visualization of deformation and stress along with the specimen
thickness.
Fig 14- Mesh model
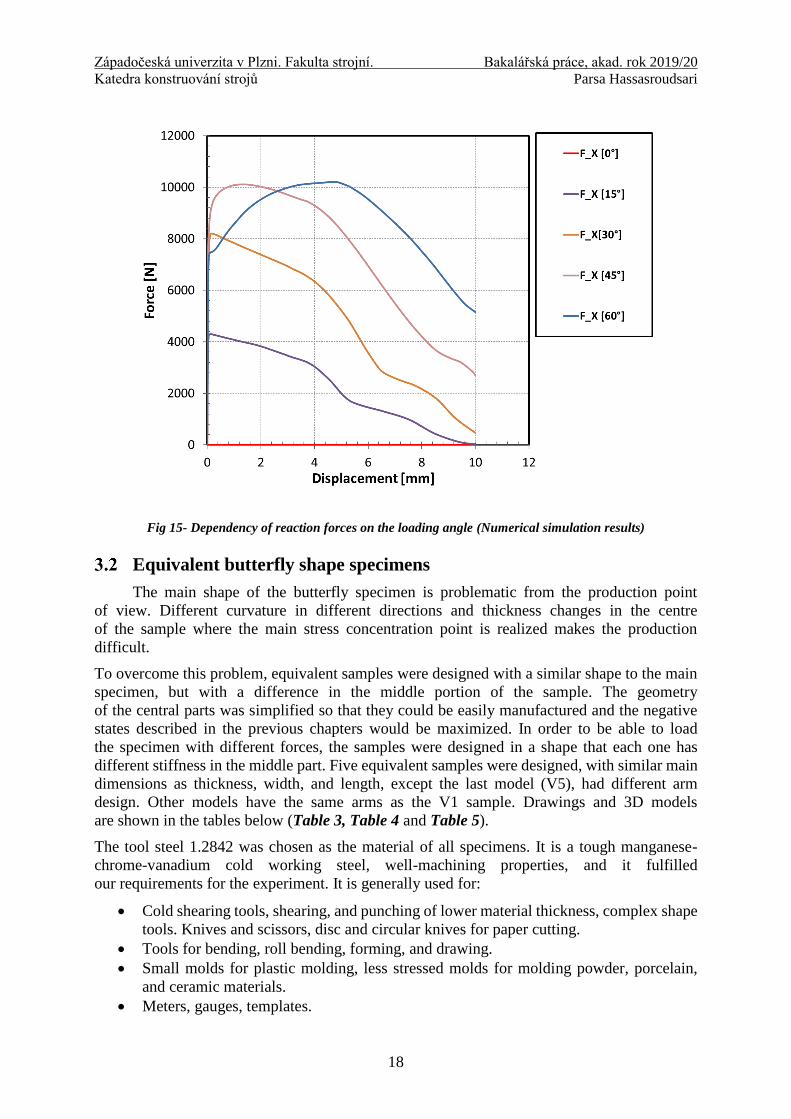
Reaction force is calculated according to the sum of reaction forces at each node
at the bottom, and the displacement is plotted based on the node at the top.
Because of the simplicity of the boundary conditions and geometry of calculated specimen, the
simulation did not take a long time and gradually specimen was loaded at different angles.
Results of the simulation verified the assumption that the greatest force is applied
to the sample in the radial direction when the loading is applied to the sample at 45°.
At the same time it can be seen that during loading at angles of more than 45 °, this reaction
force does not increase and still maintains its value. According to this statement,
the experiment was applied while the clamping plates were rotated so that the specimens
are stressed at 45 °.
Západočeská univerzita v Plzni. Fakulta strojní. Bakalářská práce, akad. rok 2019/20
Katedra konstruování strojů Parsa Hassasroudsari
18
Fig 15- Dependency of reaction forces on the loading angle (Numerical simulation results)
Equivalent butterfly shape specimens
The main shape of the butterfly specimen is problematic from the production point
of view. Different curvature in different directions and thickness changes in the centre
of the sample where the main stress concentration point is realized makes the production
difficult.
To overcome this problem, equivalent samples were designed with a similar shape to the main
specimen, but with a difference in the middle portion of the sample. The geometry
of the central parts was simplified so that they could be easily manufactured and the negative
states described in the previous chapters would be maximized. In order to be able to load
the specimen with different forces, the samples were designed in a shape that each one has
different stiffness in the middle part. Five equivalent samples were designed, with similar main
dimensions as thickness, width, and length, except the last model (V5), had different arm
design. Other models have the same arms as the V1 sample. Drawings and 3D models
are shown in the tables below (Table 3, Table 4 and Table 5).
The tool steel 1.2842 was chosen as the material of all specimens. It is a tough manganese-
chrome-vanadium cold working steel, well-machining properties, and it fulfilled
our requirements for the experiment. It is generally used for:
Cold shearing tools, shearing, and punching of lower material thickness, complex shape
tools. Knives and scissors, disc and circular knives for paper cutting.
Tools for bending, roll bending, forming, and drawing.
Small molds for plastic molding, less stressed molds for molding powder, porcelain,
and ceramic materials.
Meters, gauges, templates.
Západočeská univerzita v Plzni. Fakulta strojní. Bakalářská práce, akad. rok 2019/20
Katedra konstruování strojů Parsa Hassasroudsari
19
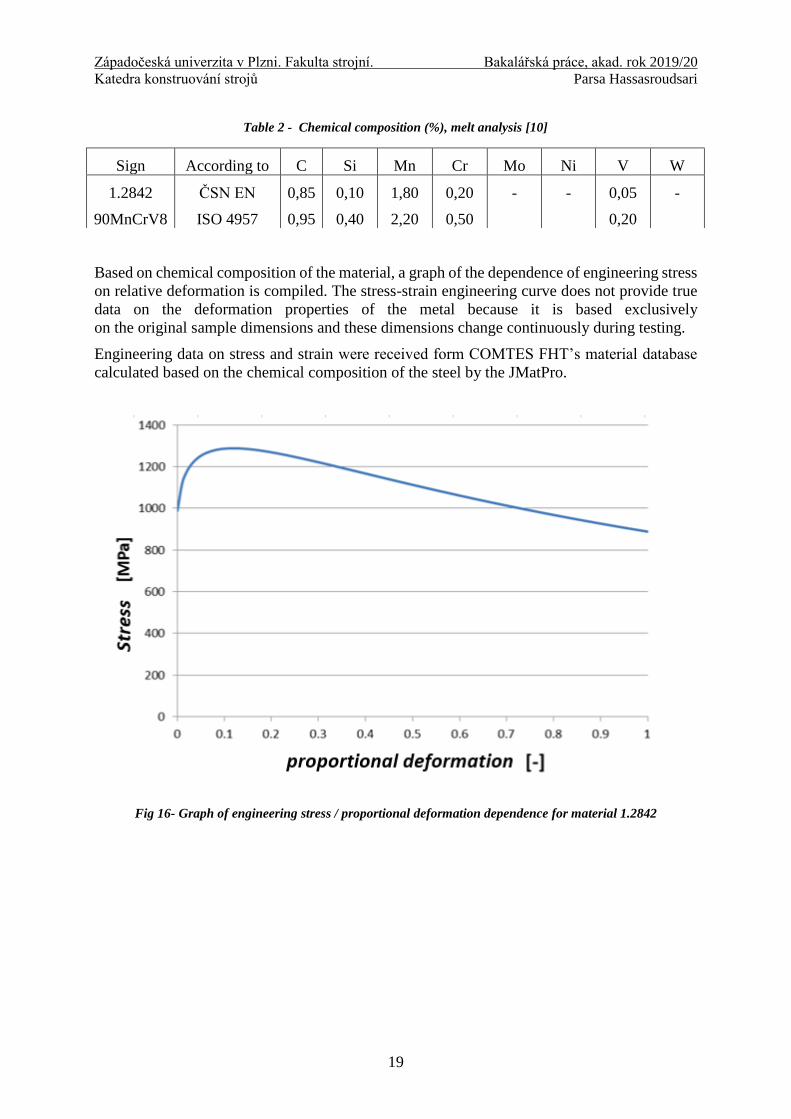
Based on chemical composition of the material, a graph of the dependence of engineering stress
on relative deformation is compiled. The stress-strain engineering curve does not provide true
data on the deformation properties of the metal because it is based exclusively
on the original sample dimensions and these dimensions change continuously during testing.
Engineering data on stress and strain were received form COMTES FHT’s material database
calculated based on the chemical composition of the steel by the JMatPro.
Fig 16- Graph of engineering stress / proportional deformation dependence for material 1.2842
Table 2 - Chemical composition (%), melt analysis [10]
Sign According to C Si Mn Cr Mo Ni V W
1.2842
90MnCrV8
ČSN EN
ISO 4957
0,85
0,95
0,10
0,40
1,80
2,20
0,20
0,50
- - 0,05
0,20
-

Západočeská univerzita v Plzni. Fakulta strojní. Bakalářská práce, akad. rok 2019/20
Katedra konstruování strojů Parsa Hassasroudsari
20
Table 3- 3D model and drawings of the samples V1 , V2
V1
V2

Západočeská univerzita v Plzni. Fakulta strojní. Bakalářská práce, akad. rok 2019/20
Katedra konstruování strojů Parsa Hassasroudsari
21
Table 4- 3D model and drawings of the samples V3 , V4
V3
V4

Západočeská univerzita v Plzni. Fakulta strojní. Bakalářská práce, akad. rok 2019/20
Katedra konstruování strojů Parsa Hassasroudsari
22
Table 5-3D model and drawings of the sample V5
V5

Západočeská univerzita v Plzni. Fakulta strojní. Bakalářská práce, akad. rok 2019/20
Katedra konstruování strojů Parsa Hassasroudsari
23
4 Experiment series no.1
The first series of experiments (no.1) were designed to analyse the equipment
with current guidance. In this series, the main goal was to find the reason behind the device’s
inaccuracy and determine the amount of the device’s deformation and the reaction force which
applies during its movement. By analysing the results, it will be possible to decide whether it is
necessary to modify the equipment and which specific parts should be modified in case of
necessity.
The experiment was applied under the following conditions:
On the different samples with different stiffnesses mentioned in chapter 3.2.
Under the maximum loading state of 45° mentioned in chapter 3.1.
On a Material test system machine mentioned in chapter 4.1.
During the experiment, basic operating data from the machine which are; the force required
to move the working piston and movement of the working piston were recorded. These basic
data were supplemented by other methods of measuring the deformation of the equipment.
Using the 3D scanner the total deformation of the device was measured and the dial distance
indicator measured the lateral deformations in the left side of the device. Oil was added
to the pillar guides during measurement.
Fig 17- Mounted equipment on the MTS machine
The experiment was performed on an MTS 810 (Material Test System) machine.
The equipment was clamped onto the machine with a connection of two nuts located at the
lower and upper parts of the fixture. Two-bolt heads were clamped on the testing machine and
connected to the testing equipment.

Západočeská univerzita v Plzni. Fakulta strojní. Bakalářská práce, akad. rok 2019/20
Katedra konstruování strojů Parsa Hassasroudsari
24
MTS 810 Material Test System
The MTS 810 provides a wide range of testing
capabilities for low and high power static and dynamic
testing. The MTS 810 rack system can be easily
configured for specific material needs or component
testing. By choosing from different strengths,
performance characteristics, pump capacity, software
and accessories, the system can be easily adapted to
a variety of static and dynamic tests, from fatigue life
and fracture growth studies to tensile, bending
and compression tests.
A complete load frame assembly requires the selection
of the frame, actuator size, actuator rod/load cell
thread, and hydraulic service manifold. The servo
valve(s) and other options are selected separately.
The 810 system employs MTS Model 318, their load
unit force could reach up to 500 kN. This floor-
mounted frame has high axial and lateral stiffness that
improves test accuracy and system performance. This
load frame is available in a variety of sizes and can be
easily configured for many different applications.
Crosshead mounted load cell provides an accurate
force reading for measurement and control. The
displacement transducer is integral to the actuator for
position measurement and control. Other possible
configurations are available, such as crosshead
mounted actuators, actuator anti-rotate, hydrostatic
bearing actuators, and air isolator pads. Integral actuator design shortens the force train
providing higher lateral stiffness. Low friction actuator ensures the best possible test control
and resolution.
Fig 18- Connection nuts of the equipment
Fig 19- MTS 810 [11]

Západočeská univerzita v Plzni. Fakulta strojní. Bakalářská práce, akad. rok 2019/20
Katedra konstruování strojů Parsa Hassasroudsari
25
Dial gauge indicator
[12]
Dial gauge indicators are measuring instruments that
convert measuring contact stroke to the dial gauge scale
(degrees).
Analogue gauges have two main scales around
the circumference:
The main scale, around the circumference of the
dial indicator, has an amount of 0.01 mm
or 0.001 mm- a large needle
The secondary scale is used to display whole
millimetres - a small needle
The rotary dial allows resetting in any position. Moving
tolerance marks on the dial are used to indicate the
permitted tolerance.
Measuring range for hundredths dial gauges is usually 10
mm, thousandths gauges have 1 mm or 3 mm.
The measuring contacts are interchangeable according to
the purpose of the measurement. During
the measurement, the dial indicator is clamped into
the stand (clamping diameter 8 mm).
During the measurement, the measuring contact must
be perpendicular to the measuring axis.
Dial gauges are generally used for the following activities:
measuring deviations of the controlled dimension from the adjusted dimension
Measurement of shape and position deviations, especially circumferential and face
runout
Aligning parts to the specified position during machining or measurement
In our experiment, an analogue dial indicator was used (Fig 20) to measure lateral deformation
of the equipment during measurement.
Fig 20- Dial gauge

Západočeská univerzita v Plzni. Fakulta strojní. Bakalářská práce, akad. rok 2019/20
Katedra konstruování strojů Parsa Hassasroudsari
26
3D Scanner GOM ATOS capsule 12M
Fig 21- 3D scanner GOM [13]
The ATOS Capsule is a 3D optical precision measuring machine (OPMM) for full-field
digitization of contoured part geometries. It is based on the principle of projecting streaks of
light onto a scanned object. The fringe projection system of the ATOS series
is used for the production quality assurance of small to medium-sized parts and excels by
its high precision for fine details. For the experiment, COMTES FHT had a model 12M.
Its parameters are described in the table below.
Table 6- 3D scanner’s properties [14]
Camera Pixels 2 x 12 000 000
Minimum Measuring Area 70 x 50 mm
Maximum Measuring Area 320 x 240 mm
Working Distance 290 mm
Operating Temperature 5 – 35˚C
Sensor Dimensions 310 x 220 x 150 mm
Weight 7kg
Total deformation of the fixture was measured using a 3D scanner. The 3D scanning process is
performed in three sequential steps:

Západočeská univerzita v Plzni. Fakulta strojní. Bakalářská práce, akad. rok 2019/20
Katedra konstruování strojů Parsa Hassasroudsari
27
1) Object preparation – The reference points are glued to the object, which has
to be scanned or they are placed around the object, on the fixture on which the object is
placed, in order to ensure that the photo shots are correctly oriented during several scans
and then they are joined correctly. The antireflection coating is applied
to the parts with shiny surfaces to avoid their glare, which in our case it was not
necessary.
Fig 22- Reference points for 3D scanning
2) 3D scanning – Series of photo shots (scanned images) are performed by rotating around
the object until the relevant data is captured. All that is needed is a stable, stationary
object with enough space for the scanning system.
3) Data processing – The software generates high-quality 3D mesh from scans
in a measurement series. This 3D mesh can be controlled and repaired if it would
be needed, inside GOM Inspect software for quality control purposes or exported
to other applications such as reverse engineering and 3D printing.
The result of the Total deformation is presented in the following chapter 4.4.4 3D Scanning
result

Západočeská univerzita v Plzni. Fakulta strojní. Bakalářská práce, akad. rok 2019/20
Katedra konstruování strojů Parsa Hassasroudsari
28
Measurement results
The experiment was carried out in the two main phases:
Free-moving analysis
With equivalent specimens analysis
The device’s movement was driven by input force from the MTS machine. The amount
of the input force was calculated so that the experiment will occur only in the elastic area. This
strategy was chosen because of the linear behaviour of materials in the elastic area.
By knowing this fact it is possible to accurately analyse whether the device negatively affects
the experiment and how it affects the results. Due to the experimental mistakes it was not
possible to apply this strategy for all the specimens.
The following figure shows the method of the result analysis.
Fig 23- Mounted equipment on the MTS machine with experiment Details

Západočeská univerzita v Plzni. Fakulta strojní. Bakalářská práce, akad. rok 2019/20
Katedra konstruování strojů Parsa Hassasroudsari
29
Free-moving
Using the universal testing device the displacement rate of the equipment was adjusted
so that the equipment moved within the range of +5 and -5 mm in the vertical direction during
one cycle. The displacement value in the plus direction is realized as a movement
of the columns of the device up and the minus value is the movement against the positive
direction. These measurements were applied to analyse the behaviour of the equipment
in case of repeated measurements or loading. Results of the measurements defined
as the hysteresis curve, which is described by the dependence of the resistance force against the
moving of the equipment on its axial displacement.
Fig 24- Graph of force dependence on displacement during free-movement of the equipment
Furthermore, in order to analyse this behaviour better, the hysteresis curve for the first cycle of
movement has shown separately from the graph above.

Západočeská univerzita v Plzni. Fakulta strojní. Bakalářská práce, akad. rok 2019/20
Katedra konstruování strojů Parsa Hassasroudsari
30
Fig 25- I.Cycle of the free-movement
From the graph in Fig 25, can be seen that at the beginning of the experiment, during stretching,
the equipment forces a resistive force of up to 1000N, then during compressing,
its amount reduces to 600N, and finally, using the hysteresis curves in
Fig 24, it can be seen that a constant reaction force stays around 300N, which can be referred
to as the resistance force in the guidance of the equipment against the movement.
Specimens analysis and lateral deformation
In the next step of the experiment, samples were clamped between the clamping plates
of the equipment. In this section, the samples were divided according to the machine control
method. As defined in the previous chapter, the main aim of the experiment, was
to test the rigidity of the device under different loads, and therefore, the butterfly specimen
was designed with different stiffnesses.
Further, to expand possible information from the experiment, two types of machine control
were deliberately chosen, depending on force or displacement.
Samples V1 and V2 were force-controlled. A maximum force of 5kN has been entered.
The displacement of the machine was specified on the other samples. It can be seen from
the results that samples with greater stiffness have shown greater resistance.
During the device’s movement, the lateral deformation of the fixture was measured under
maximum force and stroke for each sample and it was measured by the dial gauge.
The force-displacement dependency was measured from the MTS machine.

Západočeská univerzita v Plzni. Fakulta strojní. Bakalářská práce, akad. rok 2019/20
Katedra konstruování strojů Parsa Hassasroudsari
31
Fig 26- Experiment results
The values from the device’s free-moving in Fig 25 and the specimen analysis in Table 7 show
that the device has a significant negative influence on the measurement results.
It is caused by the device's resistance against the movement which called as a reaction force.
Table 7- Recorded deformation from the experiment
Sample name
Force
[kN]
Input force to the
MTS machine
displacement
[mm]
Recorded from
MTS machine
Lateral displacement
[mm]
Recorded from dial
distance indicator
V1 5 Not measured 0,03
V2 3 3,7 0,1
V3 6 1,1 0,03
V4 2 0,5 0,01
V5 0,75 Not measured 0,3
The main reason for this displacement could be both the reaction force in the guidance
of the equipment and the improper connection to the frame that caused the movement
in the perpendicular plane to loading direction of the equipment. For this reason, it is not

Západočeská univerzita v Plzni. Fakulta strojní. Bakalářská práce, akad. rok 2019/20
Katedra konstruování strojů Parsa Hassasroudsari
32
possible to fully concentrate on the values, the problem was also in the contact area under
the dial gauge, which was with greater roughness.
The movement affecting the accuracy of the measurement was probably due to the upper nut
of the equipment (number 6 in Fig 10). The upper nut is connected to the connection flange
of the measuring machine and should only move the fixture in the axial direction, but already
during the first experiment, it was noted that it is very unstable and there is a large clearance
between this nut and the ring (number 4 in Fig 10).
Sample V2 and its influence on the reaction force
Sample V2 cracked during the experiment due to the large force that was applied
to it. Because the specified loading amount for sample V1, was applied to sample V2 as well,
but this sample had less stiffness due to its geometry (Table 3). In Fig 26 only the partial result
(elastic area) of this specimen was shown but the complete values obtained from this
measurement greatly helped us to validate the consideration that was described based on the
free-moving analysis of the equipment.
Sample V2, as shown in Fig 27, reached a maximum force of 3kN. Because of using a 3D
scanner, it was not possible to use the DIC (video-extensometer) device for analysis
of deformation from the measurement record, therefore the point at which the sample cracked
is not precisely defined. According to the graph in Fig 27, we can surely claim that in the area
marked with a red rectangle in this figure, the sample was cracked and therefore there
it stopped applying any force inside the equipment. It follows that the axial force recorded
in this region is the clear resistive force of the equipment and this coincides with the behaviour
of the fixture during free-moving (Fig 24).
Both values are around 300N. This value is in some cases 10% of the maximum force value
and therefore the influence of this frictional resistance cannot be neglected.
Fig 27- Complete experimental results of sample V2 and its 3D model

Západočeská univerzita v Plzni. Fakulta strojní. Bakalářská práce, akad. rok 2019/20
Katedra konstruování strojů Parsa Hassasroudsari
33
3D Scanning result
From the five samples, the data from the measurement of sample V1 was selected as
a reference. First series of scans took place before the loading began when the specimen was
clamped to the fixture. The second series was scanned during the experiment when the
maximum load was applied to the sample. Comparison of these two states was performed
in GOM Inspect software, where Scans of both series were imported and then compared with
each other. The overall displacement of the equipment could be evaluated from
the comparison (Fig 28). The values obtained show that the equipment’s deformations
were relatively small and the device is sufficiently rigid. The only significant displacement was
recorded for the parts in the direction of axial displacement, which corresponds
to the function of the equipment.
Conclusion of experiment series no.1
From the performed measurements it was possible to analyse the current state
of the equipment and understand the problem of this device. The equipment’s behaviour during
free-moving and the magnitude reaction force in the device’s guide when the sample V2 was
cracked and therefore did not exert any force, verified that a 1kN reaction force
was applied during movement of the equipment’s guiding system and then its amount dropped
to 300N. This amount of reaction force from the guiding system is not appropriate and not even
negligible. Another fact that emerged in the experiment was the large clearance of the upper
nut of the equipment. Based on these results it is necessary to modify
the equipment’s parts which caused the negative effects during the experiment.
The next chapter suggests variants for solving and improving the design of the existing device.
Fig 28- Magnitude deformation of the equipment
Západočeská univerzita v Plzni. Fakulta strojní. Bakalářská práce, akad. rok 2019/20
Katedra konstruování strojů Parsa Hassasroudsari
34
5 Solution variants
Based on the considerations obtained in the previous chapter, it was attempted to suggest
variations that improve the construction of this product. The main aim of these variants
is to eliminate or reduce frictional forces in the guide elements of the equipment. One variant
separately focuses on the upper nut of the equipment and its method of connection to the test
devices. Further, the variants are compared with each other due to the main criteria
to determine an optimal solution.
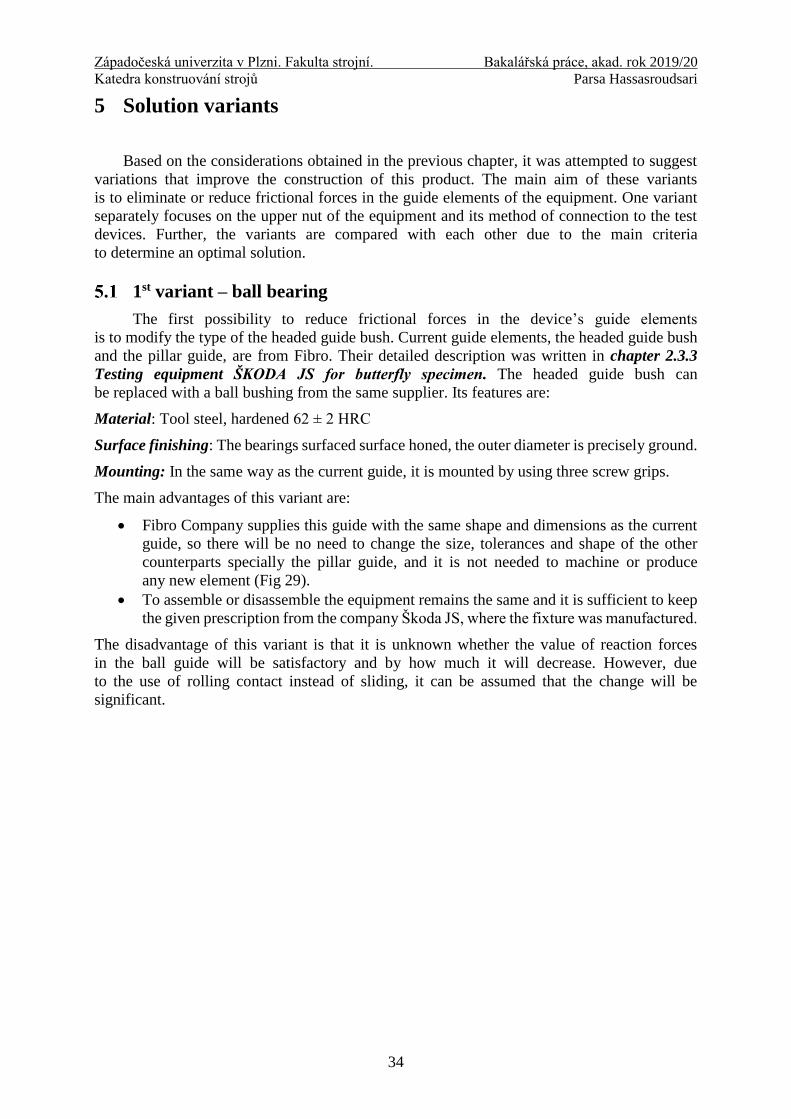
1st variant – ball bearing
The first possibility to reduce frictional forces in the device’s guide elements
is to modify the type of the headed guide bush. Current guide elements, the headed guide bush
and the pillar guide, are from Fibro. Their detailed description was written in chapter 2.3.3
Testing equipment ŠKODA JS for butterfly specimen. The headed guide bush can
be replaced with a ball bushing from the same supplier. Its features are:
Material: Tool steel, hardened 62 ± 2 HRC
Surface finishing: The bearings surfaced surface honed, the outer diameter is precisely ground.
Mounting: In the same way as the current guide, it is mounted by using three screw grips.
The main advantages of this variant are:
Fibro Company supplies this guide with the same shape and dimensions as the current
guide, so there will be no need to change the size, tolerances and shape of the other
counterparts specially the pillar guide, and it is not needed to machine or produce
any new element (Fig 29).
To assemble or disassemble the equipment remains the same and it is sufficient to keep
the given prescription from the company Škoda JS, where the fixture was manufactured.
The disadvantage of this variant is that it is unknown whether the value of reaction forces
in the ball guide will be satisfactory and by how much it will decrease. However, due
to the use of rolling contact instead of sliding, it can be assumed that the change will be
significant.

Západočeská univerzita v Plzni. Fakulta strojní. Bakalářská práce, akad. rok 2019/20
Katedra konstruování strojů Parsa Hassasroudsari
35
Headed guid bush Fibro 2081.71 Ball bushing 2081.48
Fig 29- Drawings of the bearings provided by Fibro [16]

Západočeská univerzita v Plzni. Fakulta strojní. Bakalářská práce, akad. rok 2019/20
Katedra konstruování strojů Parsa Hassasroudsari
36
2nd variant – Without the guide
Another possibility for reducing reaction forces is to remove the guide elements
of the device completely. With this option, the friction that significantly affects the test
on this product is totally eliminated.
Removing the entire guide requires disassembling all guide bushes, guide pillars and further
cutting the four frame bodies for bearing mounting (number 1 in Fig 10).
Fig 30- Equipment without the guide
This variant is challenging because it changes overall shape of the existing device, requiring
disassembly of the elements and at the same time cutting off parts of the fixture. It is expected
that for using the equipment, it has to be mounted on a sufficiently rigid testing system
and guide of the testing system replaces whole the guide of the existing equipment.
As it will greatly depend on the rigidity of the entire system, it must be tested to see
if the clamping plates remain motionless during the experiment or not.
Furthermore, in this variant, to assemble the sample inside the device is more difficult
and the operator must be aware to mount the device on the machine correctly.

Západočeská univerzita v Plzni. Fakulta strojní. Bakalářská práce, akad. rok 2019/20
Katedra konstruování strojů Parsa Hassasroudsari
37
Comparison-MCDA
[21]
In this section, the comparison is made by multi-criteria decision analysis or so-called
MCDA method. Due to its simplicity and logical approach, MCDA is a useful method
that can be applied in both simple and complex situations. It is an applicable method among all
alternatives to solve problems that are characterized as an optimum choice.
At the beginning for analysing, MCDA requires to define five main terms: [21]
1. Goal: Reducing the amount of device’s frictional force and improving its stiffness.
2. Decision-makers: COMTES FHT and the author.
3. Evaluation criteria: Reaction force, stiffness, mounting assembly/disassembly, price.
4. Outcome: Optimum solution that fulfils the goals.
By defining the mentioned terms, MCDA generally uses the next 3 steps: [21]
Dividing the decision into smaller and more understandable parts (Table 8)
Analyzing each part (Table 9)
Integrating the parts to produce a meaningful solution. (Table 10)
The basic principle of this method is to compare multiple criteria. In the case of a criterion
preference in a row, the value 1 is selected, otherwise, the selected value is 0. The number
of its preferences is subsequently determined for each criterion, which is equal to the sum
of units in the row of the considered criterion. Based on the sum of preferences, the weights of
each criterion are determined according to the relationship: 𝑉𝑖 =𝐾𝑖
∑ 𝑘𝑖𝑛𝑖=1
, when the sum of
the weights is always equal to 1 :
𝑉𝑖 - the standard weight of the i-th criterion [-]
𝐾𝑖 - the non-standard weight of the i-th criterion [-]
n - number of criteria
Subsequently, for all criteria, the evaluation is determined for individual variants in the range
of 1-3, where 1 is the worst, 2 is the average and 3 is the best. In the last step, the weight
and evaluation of the individual criteria are multiplied and the values for all variants are added
together to obtain the final evaluation.
Table 8- Table of criteria and values
Criteria Reaction forces
stiffness Assembly/disassembly Price Sum Value[%]
Reaction forces X 1 1 1 3 0.375
stiffness 1 X 1 0 2 0.25
Assembly/disassembly 0 1 X 1 2 0.25
Price 0 0 1 X 1 0.125

Západočeská univerzita v Plzni. Fakulta strojní. Bakalářská práce, akad. rok 2019/20
Katedra konstruování strojů Parsa Hassasroudsari
38
Solution of the upper nut
According to the drawing of the assembly, there is a 1mm clearance between the upper
nut and upper ring of the equipment. The real amount of this clearance reaches up to 1.5mm.
This clearance causes vibration and instability of the equipment when it’s connected
to the testing system. As it was discussed in the previous chapter, this instability can cause
an additional reaction force during the experiment making results inaccurate.
Fig 31- Nut assembled in the upper ring
To improve this connection and solve its problem, two main variants were designed.
The two main parts which can be modified are the upper nut and the upper ring
of the equipment. The upper nut connects the equipment to the testing system while the upper
ring should maintain its position and stability.
Table 9- Value analysis
Variants/Criteria Reaction forces stiffness Assembly/disassembly Price
V1 2 3 2 1
V2 3 1 1 3
Value [%] 0.375 0.25 0.25 0.125
Table 10- Final comparison
Variants/Criteria Reaction forces
stiffness Assembly/disassembly Price SUM Order
V1 0.75 0.75 0.50 0.125 2.125 1
V2 1.125 0.25 0.25 0.375 2 2

Západočeská univerzita v Plzni. Fakulta strojní. Bakalářská práce, akad. rok 2019/20
Katedra konstruování strojů Parsa Hassasroudsari
39
Nut modification
A new nut with greater accuracy was designed with simple construction and easy to
produce. Furthermore, it is necessary to apply these modifications:
Using exact tolerances H7 / g6 for the fit diameter
Increasing the nut shoulder length to clamp the nut.
This would prolong to assemble the equipment to the testing machine since the operator would
first have to loosen the clamping connection of the nut shoulder, screw the equipment onto the
testing machine’s linkage and then retighten the clamping connection.
Fig 32- Modified dimensions and tolerance
Západočeská univerzita v Plzni. Fakulta strojní. Bakalářská práce, akad. rok 2019/20
Katedra konstruování strojů Parsa Hassasroudsari
40
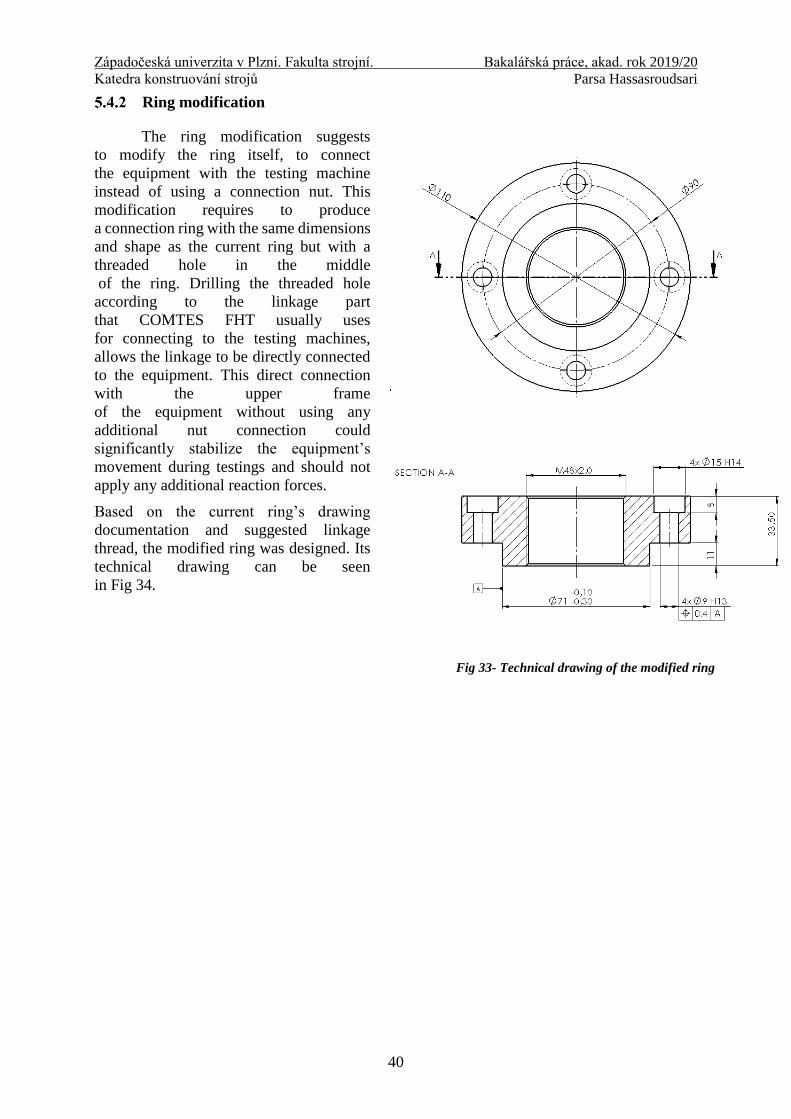
Ring modification
The ring modification suggests
to modify the ring itself, to connect
the equipment with the testing machine
instead of using a connection nut. This
modification requires to produce
a connection ring with the same dimensions
and shape as the current ring but with a
threaded hole in the middle
of the ring. Drilling the threaded hole
according to the linkage part
that COMTES FHT usually uses
for connecting to the testing machines,
allows the linkage to be directly connected
to the equipment. This direct connection
with the upper frame
of the equipment without using any
additional nut connection could
significantly stabilize the equipment’s
movement during testings and should not
apply any additional reaction forces.
Based on the current ring’s drawing
documentation and suggested linkage
thread, the modified ring was designed. Its
technical drawing can be seen
in Fig 34.
Fig 33- Technical drawing of the modified ring

Západočeská univerzita v Plzni. Fakulta strojní. Bakalářská práce, akad. rok 2019/20
Katedra konstruování strojů Parsa Hassasroudsari
41
6 Applying the solution variants
After designing the mentioned solution variants for the biaxial equipment,
the COMTES FHT firm tended to apply them on the current device. The company’s interest in
applicating the device’s changes and modifications made a great opportunity to assay, whether
the variants behave according to the expectations mentioned in the previous chapter or not.
Experiment series no.2
Various experiments were designed to analyse the variants. The main aim of this series
of measurements (n.2) was to assume the difference of each variant with the current state
of the existing equipment and analyse their impact on the device. Therefore, in the first step,
the testing was applied to the device with current guidance and after that, the same testing was
repeated on the equipment which was modified according to the chosen solution variant.
New series of experiments were performed in a similar style as the experiments described
in chapter 4 Experiment series no.1, with a few differences. For preforming the new
experiments, COMTES FHT firm provided an Allroundline Z250 Zwick/Roell materials testing
machine. The Z250 Zwick/Roell machine is Driven via maintenance-free, digitally controlled
AC drive technology, which in combination
with the innovative motor feedback system
ensures excellent constant velocity properties,
even at very low speeds. The main advantages
of this machine are [22]:
Robust component dimensioning
precise crosshead guidance with high
stiffness
High level of operator convenience
Highest safety standards
additional height-adjustable
crosshead or mounting platform
Mounting and clamping of the equipment
stayed in the same way as the previous
experiments, with a connection of two nuts.
The basic operation data from the machine
are the force required to move the equipment
and the deformation was measured by the
testing machine.
ARAMIS DIC system
The recording method of analysing the
device’s total deformation was different
in the experiment series no.2. This time
instead of the 3D scanner, the Digital Image Correlation (DIC) system (Fig 35) measured the
total deformation of the device during each measurement. ARAMIS consists of high-precision
motion sensors and deformation analyses. ARAMIS product portfolio comprises sensors for
dynamic measurements of 3D coordinates, 3D displacements and 3D surface strain. Based on
triangulation, the systems provide precise 3D coordinates for full-field and point-based
Fig 35- Zwick/Roell Z250 machine [22]

Západočeská univerzita v Plzni. Fakulta strojní. Bakalářská práce, akad. rok 2019/20
Katedra konstruování strojů Parsa Hassasroudsari
42
measurements. ARAMIS sensors measure statically or dynamically loaded specimens and parts
by using a contact-free and material-independent method based on the principle of digital image
correlation (DIC) – without time-consuming and expensive preparations of the test object [23].
In general 3d scanner works with a similar principle as the DIC system, but the 3d scanner
analyses the deformation by comparing the two sets of scans in different time stages
of the experiment (eg. Before and after testing) when the DIC system records the data during
the testing. Therefore the DIC system could be very helpful to analyse the behaviour of the
equipment and its specific parts when the force is applied on them. DIC system cameras can
measure 2D and 3D displacement fields of the material during the testing. For the measurements
and evaluations, the COMTES FHT firm provided the DIC system ARAMIS by GOM. Pattern
made by reference points is applied to the testing equipment, which is captured by two 3D
cameras. The DIC software then monitors pattern changes in the individual images of the record
according to the reference image. With this method, it is possible to accurately measure
deformations and displacements, both on the whole sample and locally in individual areas.
Fig 36- Mounted equipment on Zwick/Roell machine, measured by Aramis
Testing specimens
Three types of samples were chosen for experimenting. The experiment can be
categorized by the type and geometry of the specimens to the Table below:

Západočeská univerzita v Plzni. Fakulta strojní. Bakalářská práce, akad. rok 2019/20
Katedra konstruování strojů Parsa Hassasroudsari
43
Table 11- Samples properties
SPECIMEN Type Stiffness Geometry
𝐕𝐓𝟏 𝒕𝒐 𝟑
Thick
butterfly-
shaped
specimen
Low
V3 3.23.2
Equivalent
butterfly
shape
specimens]
Equivalent
butterfly-
shaped
specimen
Medium
VS
Robust
rectangle-
shaped
specimen
High
Outer dimensions (width-height) of all specimen types are the same (80x30) and they differ
only by their thicknesses. Specimen VT is cut shaped sheet metal specimen that presents
the least stiff sample. The special specimen VS was designed to be considered as the rigid
sample. This so-called rigidity helps to analyse the device’s pure stiffness and behaviour during
application of greater forces without risk of the specimen’s cracking.

Západočeská univerzita v Plzni. Fakulta strojní. Bakalářská práce, akad. rok 2019/20
Katedra konstruování strojů Parsa Hassasroudsari
44
These three types of specimens were chosen to analyse the rigidity of the equipment in three
different levels: Low, Medium, High.
Testing steps
The experiment was divided into three main stages of testing:
A. Testing the equipment with current guidance
B. Testing the modified equipment according to the 1st solution variant
C. Testing the modified equipment according to the 2nd solution variant
Each stage of the experiment included the following steps:
I. Free-moving of the equipment
II. Testing the VT specimen in three orientation: 180°, 90°, 45°. (see Table 1)
III. Testing the V3 specimen in the 45°orientation.
IV. Testing the VS specimen in the 45°orientation.
In order to analyse the stages and precisely compare them together, the same experimental steps
were repeated for each stage and they were performed in equal conditions. Each step
of the stage was recorded separately with Aramis DIC system.
Measurement results
For every stage of each step, the results were recorded. Due to the thesis length limit, only
a few critical results and their comparison with the current state were chosen.
Complete results are added to the thesis as an attachment (see chapter 10 List Attachments).
Stage B vs stage A
Fig 37 - Comparison of the Free-movement results between stages A and B
The graph in Fig 37 characterizes free-moving of the equipment in two steps A and B.
It can be seen that the modified guide element with ball bearings have significantly reduced
the number of reaction forces in the equipment about 100%.
The instability and small jumps of the equipment with new guide element can be caused
by the gap in the connection nut.
From analyzing the results with testing samples it appears that during testing the current
guidelines of the equipment, each time exists a nonlinear path starting from the point
-400
-200
0
200
400
600
800
-2 -1 0 1 2
Forc
e [N
]
Deformation [mm]
Free-moving, 1st cycle
B
A
-8
-6
-4
-2
0
2
4
6
8
-2 -1 0 1 2
Forc
e [N
]
Deformation [mm]
Free-moving, 1st cycle
B

Západočeská univerzita v Plzni. Fakulta strojní. Bakalářská práce, akad. rok 2019/20
Katedra konstruování strojů Parsa Hassasroudsari
45
that measurement begins to the point that the equipment starts to test the specimen.
The nonlinearity is marked by red dashes in the following graphs in figures Fig 38, Fig 39, Fig
40 and Fig 41.
Fig 38- Experiment results of the sample VT with a 180 ° angle of loading
Fig 39- Experiment results of the sample VT with a 45 ° angle of loading
-200
-100
0
100
200
300
400
500
600
-0,02 0 0,02 0,04 0,06 0,08 0,1
Forc
e [N
]
Deformation[mm]
VT-180°
A
B
-200
0
200
400
600
800
1000
1200
-0,05 0 0,05 0,1 0,15 0,2 0,25 0,3
Sila
[N
]
Deformace [mm]
VT-45°
A
B

Západočeská univerzita v Plzni. Fakulta strojní. Bakalářská práce, akad. rok 2019/20
Katedra konstruování strojů Parsa Hassasroudsari
46
Fig 40- Experiment results of the sample V3 with a 45 ° angle of loading
Fig 41- Experiment results of the sample Vs with a 45 ° angle of loading
As all the measurements and testing were meant to stay in the elastic zone,
this nonlinearity can be mainly realized as the current guide’s resistance to the movement
it so-called; the reaction force applied by guide elements. By testing the different samples
in different angles it can be concluded that the samples with greater stiffness cause greater force.
By comparing the results between these two stages, it is obvious that the modified guide
increases undesirable reaction force and the previous results from the current design were not
reliable for any research application.
-500
0
500
1000
1500
2000
2500
-0,05 0 0,05 0,1 0,15 0,2 0,25 0,3
Forc
e [N
]
Deformation [mm]
V3-45°
A
B
-1000
0
1000
2000
3000
4000
5000
6000
7000
-0,1 0 0,1 0,2 0,3 0,4 0,5 0,6 0,7
Forc
e [N
]
Deformation [mm]
VS-45°
B
A

Západočeská univerzita v Plzni. Fakulta strojní. Bakalářská práce, akad. rok 2019/20
Katedra konstruování strojů Parsa Hassasroudsari
47
Stage C
After removing guide elements from the equipment and mounting the device
on the Zwick machine, it was observed that the upper frame of the equipment can freely rotate
(see Fig 42).
Fig 42- Mounted equipment without guide elements
Due to this problem, it was not possible to apply experiment stages on this step but it can
confirm the mentioned conclusion from previous analysis that without modifying the nut
connection and minimizing the gap clearance between the device and the testing machine,
it is not possible to apply 2nd solution variant.
Also due to the difficulty of the assembly and the inaccuracies which the equipment could easily
cause when the guide elements are removed, it is concluded that the equipment must have guide
elements to support its movement.

Západočeská univerzita v Plzni. Fakulta strojní. Bakalářská práce, akad. rok 2019/20
Katedra konstruování strojů Parsa Hassasroudsari
48
7 Conclusion and outlook
Biaxial testing equipment for butterfly-shaped specimens fixture performs biaxial tests on
various materials, mainly steel types. The special geometry of this sample is very useful for
describing the characterization of the stress states of a material.
Significant friction value in the guide elements of the current equipment, prevents it to be fully
functional and restrain measurement to be sufficiently accurate. This work aimed to find
problem points based on the experiment and analysis of the current state, then
to determine its value and verify the existence of unsuitable reaction forces that may arise
during the test. Subsequently, variants were proposed for solving problematic nodes.
Based on an experiment conducted at COMTES FHT, it has determined that the guidance
of this device, which allows the clamping plates to move in relation to each other, causes
an undesirable reaction force. Another adverse effect was the instability of the upper nut
of the device. This instability mainly affected the continuity and eventual jumps, which was
recorded during measurement. By using a 3D scanner, it was verified that the rigidity
of the entire existing fixture is sufficient and there is no need (contrary to the original
assumptions) to change the main concept of design in this fixture.
Two variants were proposed to minimize frictional forces in guide elements of the equipment.
1st variant focuses on changing the headed guide bush, and 2nd variant aims at changing
the design of the entire fixture by removing the entire guide from the chain. As the second
option reduces the rigidity of the equipment while the first option is easier to operate, the 1st
variant is selected as the sufficient one.
Also in order to remove the instability of the equipment, another two variants were designed to
modify the connection of the equipment with universal testing systems. Those variants focus
on the modification of connection nut and an upper ring of the device. Between those variants,
modification of the ring (2nd variant) was chosen due to its design simplicity
and direct connection of the equipment with testing machine.
Because of COMTES FHT’s interest in the solution variants, the company decided to apply
them. Various new tests were also designed to analyse the new variants. The results achieved
from testing with the modified bearings from Fibro showed that by this modification total
amount of reaction force was reduced approximately about 100% which proved the author's
expectation. Testing the second variant proved that without modifying the connection nut
is not possible to apply this variant whereas the clearance gap in the device’s connection must
be removed. At last, it concluded that due to the devices inaccuracies when the guide elements
are removed, the device must have the guidance support so this variant is not suitable for the
equipment.
SolidWorks 2018 program was used to create CAD models and drawings, and Abaqus program
was used for FEM analysis.

Západočeská univerzita v Plzni. Fakulta strojní. Bakalářská práce, akad. rok 2019/20
Katedra konstruování strojů Parsa Hassasroudsari
49
8 List of symbols and abbreviations
Symbol Unit Key
ε [-] Logarithmic strain
ε̅f , ε̅f (… ) [-] fracture strain (fracture locus)
η [-] Triaxial stress
θ [-] Lode angle
θ̅ [-] Normalized Lode angle
ξ [-] Lode parameter
σ ij [MPa] Stress tensor
σm [MPa] Hydrostatic stress
σeq [MPa] Equivalent von mises stress
σ1, σ2, σ3 [MPa] Main stress
J1,2,3 [MPa1,2,3] Invariants of the stress deviator
l,L [mm] Distance/ Deformation
T [mm] Thickness
r,R [mm] Radius
t [s] Time
F [N] Force
p [MPa] Hydrostatic pressure
E [MPa] Young's tensile modulus
UBTD - Universal Biaxial Testing Device
LVDT - Linear Variable Differential Transformer
MTS - Material Test System

Západočeská univerzita v Plzni. Fakulta strojní. Bakalářská práce, akad. rok 2019/20
Katedra konstruování strojů Parsa Hassasroudsari
50
9 References
[1] RŮŽIČKA, Jan. Metodika kalibrace nesvázaných modelů a stochastický přístup v
problematice tvárného porušování. Praha, 2015. Disertační práce. České vysoké učení
technické v Praze. Vedoucí práce Doc. Ing. Miroslav Španiel, CSc.
[2] Pucillo, J.; Grasso, M.; Penta, F.; Pinto, P. Specimen for fracture characterization of
material under biaxial stress fields. 9th International Conference on Multiaxial Fatigue
& Fracture. 2010, 2010, 707-714.
[3] KUNZ, J. Aplikovaná lomová mechanika. Vyd. 4., přeprac. Praha: nakladatelství
ČVUT,2005, c1991, 272 s. ISBN 80-010-3306-6.
[4] HENN, S.; MOHR, D. Calibration of Stress-triaxiality Dependent Crack Formation
Criteria: A New Hybrid Experimental–Numerical Method. Experimental Mechanics.
2007, , 805-820. DOI: 10.1007/s11340-007-9039-7.
[5] WIERZBICKI, T.; BAI, J.; BAO, Y. A New Experimental Technique for
Constructing a Fracture Envelope of Metals under Multi-axial loading. Proceedings of
the 2005 SEM Annual Conference and Exposition on Experimental and Applied
Mechanics. 2005.
[6] JIŘÍ, HŮLKA. VÝPOČTOVÁ PREDIKCE TVÁRNÉHO PORUŠOVÁNÍ. BRNO,
2014. DIZERTAČNÍ PRÁCE. VYSOKÉ UČENÍ TECHNICKÉ V BRNĚ. Vedoucí
práce Prof. Ing. JINDŘICH PETRUŠKA, CSc.
[7] Španiel, M.; Prantl, A.; Džugan, J.; Růžička, J.; Moravec, M.; Kuželka, J. Calibration
of fracture locus in scope of uncoupled elastic–plastic-ductile fracture material
models. Advances in Engineering Software. 2014, 95-108. DOI:
10.1016/j.advengsoft.2013.05.007.
[8] Suchý, Jiří. PŘÍPRAVEK PRO ZKOUŠKY VZORKU TYPU MOTÝLEK:
Ae13835/Dok Rev. 0. české. ŠKODA JS a.s., 2011.
[9] Suchý, Jiří. TECHNICKÝ POPIS PŘÍPRAVKU, POKYNY PRO MONTÁŽ:
Ae13911/Dok Rev. 0. české. ŠKODA JS a.s., 2011.
[10] Nástrojová ocel 1.2842, informativní list [online]. Kladno: Bohdan Bolzano [cit. 2020-
05-15]. Dostupné z: http://www.bolzano.cz/assets/files/NO/1.2842_cesky.pdf
[11] MTS 810 & 858 Material Testing Systems [online]. USA: MTS Systems Corporation,
2006 [cit. 2020-05-15]. Dostupné z :
https://www.upc.edu/sct/ca/documents_equipament/d_77_id-412.pdf
[12] Úchylkoměry [online]. česke: ELUC [cit. 2020-05-15]. Dostupné z: https://eluc.kr-
olomoucky.cz/verejne/lekce/2588
[13] ATOS Capsule [online]. česke: MCAE Systems [cit. 2020-05-15]. Dostupné z:
https://www.mcae.cz/cs/produkty/atos-capsule/
[14] ATOS Capsule – Optical Blue Light 3D Scanner [online]. AUS: Scan-Xpress [cit.
2020-05-15]. Dostupné z: https://www.scan-xpress.com.au/products/3d-
measurement/atos-capsule/
[15] NON-CONTACT 3D SCANNING [online]. AUS: Scan-Xpress [cit. 2019-05-15].
Dostupné z: https://www.scan-xpress.com.au/services/non-contact-3d-scanning/
[16] Guide Elements [online]. Germany: FIBRO, 2017 [cit. 2019-05-15]. Dostupné z:
https://www.fibro.de/fileadmin/FIBRO/EN/02_NORMALIEN/Kapitel_D/PDF/B2_H
K_GB_Kapitel_D.pdf
[17] Hasanpour, R.; Choupani, N. Rock fracture characterization using the modified Arcan
test specimen. International Journal of Rock Mechanics and Mining Sciences. 2009, ,
346-354. DOI: 10.1016/j.ijrmms.2008.07.004.

Západočeská univerzita v Plzni. Fakulta strojní. Bakalářská práce, akad. rok 2019/20
Katedra konstruování strojů Parsa Hassasroudsari
51
[18] Kortenaar, Lukas ten. Failure Characterization of Hot Formed Boron Steels with
Tailored Mechanical Properties. Waterloo, Ontario, Canada, 2016. Thesis requirement
for the degree of Master. University of Waterloo.
[19] Prantl, A.; Džugan, J.; Konopík, P. DUCTILE DAMAGE PARAMETERS
IDENTIFICATION. COMAT. Plzeň, Czech Republic, EU, 2012.
[20] MOORE, Philippa a Geoff BOOTH. The Welding Engineer's Guide to Fracture and
Fatigue: chapter 8 Failure modes and analysis in metals. Elsevier, 2015. ISBN 978-1-
78242-370-6.
[21] Natural Resources Leadership Institute: Multi-Criteria Decision Analysis [online].
2011 [cit. 2020-07-10]. Dostupné z: https://projects.ncsu.edu/nrli/decision-
making/MCDA.php
[22] Product Information: AllroundLine Z250 SN/SW/SH/SE materials testing machines.
Zwickroell [online]. [cit. 2020-07-13]. Dostupné z: https://www.zwickroell.com/-
/media/files/sharepoint/vertriebsdoku_pi/02_757_allroundline_z250_materials_testing
_machine_pi_en.pdf
[23] ARAMIS. Gom [online]. [cit. 2020-07-13]. Dostupné z:
https://www.gom.com/metrology-systems/aramis.html

Západočeská univerzita v Plzni. Fakulta strojní. Bakalářská práce, akad. rok 2019/20
Katedra konstruování strojů Parsa Hassasroudsari
52
10 List Attachments
Attachement no.1- Complete results of the experiment series no.2

Attachment no. 1
Complete results of the experiment series no.2

1
This attachment contains complete results of the testing from experiment no.2.
The following graphs and results are recorded values from the Universal testing machine.
Fig 43, shows the difference in complete free-moving results of the equipment before and after
modifying the 1st solution variant. From the figure on the left side, when the equipment has its
Fig 43- Free-moving complete result
-400
-200
0
200
400
600
800
-2 -1,5 -1 -0,5 0 0,5 1 1,5 2
Foce
[N
]
Deformation [mm]
Free-moving
A
B
-10
-8
-6
-4
-2
0
2
4
6
8
-2 -1,5 -1 -0,5 0 0,5 1 1,5 2
Foce
[N
]
Deformation [mm]
Free-moving
B

Západočeská univerzita v Plzni. Fakulta strojní. Bakalářská práce, akad. rok 2019/20
Katedra konstruování strojů Parsa Hassasroudsari
2
default guide element, it can be concluded that in the first cycle of the movement, the device
applies the maximum reaction force about 700N. After repeating some cycles this amount will
stabilize around 400N. This unwanted reaction force reduced about 100% by modifying the
device’s guide elements with using ball bearings. The figure on the right side shows that the
maximum reaction force on the modified equipment with the 1st solution variant is about 4N.
The nonlinearity in the results could be caused by the gap in the connection nut.
The tick samples VT were made to test the device when the specimen has the minimum stiffness
in three main loading angles. Due to the sample’s small thickness, 0.8 mm, it will apply the
minimum reaction force to the equipment while testing and it makes possible
to be as close as possible to the device’s pure stiffness. In the thesis, the elastic part of the results
was mentioned to stay in the elastic state. Regarding the fact that in this state the results should
have a linear shape, it was possible to precisely compare these two stages. The results from
stage A do not follow this law they each one of them has nonlinearity from the starting point.
As it was predicted, the results from stage B follow the linear pattern which shows that the
device’s design has improved and the results are more reliable now. The complete results are
shown in the following graphs (Fig 44, Fig 45, Fig 46)
Fig 44- VT specimen complete results by loading angle of 45°
0
200
400
600
800
1000
1200
-0,2 0 0,2 0,4 0,6 0,8 1
Forc
e [
N]
Deformation [mm]
VT-45°
A
B

Západočeská univerzita v Plzni. Fakulta strojní. Bakalářská práce, akad. rok 2019/20
Katedra konstruování strojů Parsa Hassasroudsari
3
Fig 45- VT specimen complete results by loading angle of 90°
Fig 46- VT specimen complete results by loading angle of 180°
-500
0
500
1000
1500
2000
2500
-0,1 0 0,1 0,2 0,3 0,4 0,5 0,6
Sila
[N
]
Deformace [mm]
VT-90°
A
B
-500
0
500
1000
1500
2000
2500
-0,02 0 0,02 0,04 0,06 0,08 0,1
Forc
e [
N]
Deformation [mm]
VT-180°
A
B

Západočeská univerzita v Plzni. Fakulta strojní. Bakalářská práce, akad. rok 2019/20
Katedra konstruování strojů Parsa Hassasroudsari
4
Detail information about the nonlinearity is described in the thesis, chapter 6.2.1 Stage B vs
stage A.
The same strategy was chosen for the sample V3 with medium stiffness and the robust sample
VS with the highest stiffness among other specimens. These specimens were tested only in the
loading angle of 45° which was defined as the state with maximum stress in the thesis, chapter
3 Analysis of the current state. The results shown in Fig 47 and Fig 48 shows that the greater
is the stiffness of the specimen the greater reaction force is applied from the equipment.
Fig 47- V3 specimen complete results by loading angle of 45°
-500
0
500
1000
1500
2000
2500
3000
3500
4000
4500
-0,05 0 0,05 0,1 0,15 0,2 0,25 0,3 0,35 0,4 0,45
Forc
e [
N]
Deformation [mm]
V3-45°
A
B

Západočeská univerzita v Plzni. Fakulta strojní. Bakalářská práce, akad. rok 2019/20
Katedra konstruování strojů Parsa Hassasroudsari
5
Fig 48- VS specimen complete results by loading angle of 45°
Results from ARAMIS (see Fig 49 and Fig 50) were generated as the deformation (movement)
of one point (glued on the upper holding plate) relative to the second point (glued on the bottom
holding plate). This recording method was applied on selected sample VS, under loading angle
of 45° in both testing stages; stage A and stage B. This results also confirmed the improvement
in the device’s stability in all three axes (x, y and z).
-1000
0
1000
2000
3000
4000
5000
6000
7000
-0,1 0 0,1 0,2 0,3 0,4 0,5 0,6 0,7
Forc
e [
N]
Deformation [mm]
VS-45°
A
B
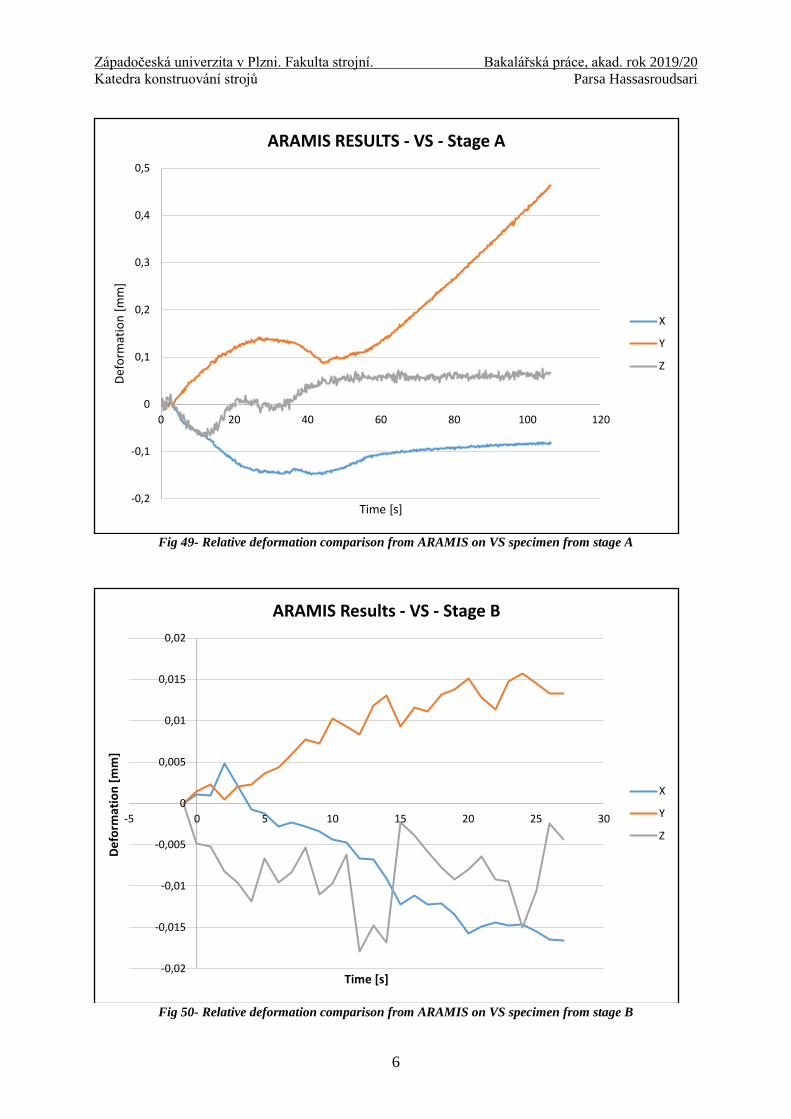
Západočeská univerzita v Plzni. Fakulta strojní. Bakalářská práce, akad. rok 2019/20
Katedra konstruování strojů Parsa Hassasroudsari
6
Fig 49- Relative deformation comparison from ARAMIS on VS specimen from stage A
Fig 50- Relative deformation comparison from ARAMIS on VS specimen from stage B
-0,2
-0,1
0
0,1
0,2
0,3
0,4
0,5
0 20 40 60 80 100 120
Def
orm
atio
n [
mm
]
Time [s]
ARAMIS RESULTS - VS - Stage A
X
Y
Z
-0,02
-0,015
-0,01
-0,005
0
0,005
0,01
0,015
0,02
-5 0 5 10 15 20 25 30
De
form
atio
n [
mm
]
Time [s]
ARAMIS Results - VS - Stage B
X
Y
Z