badak rcm
TRANSCRIPT
7/29/2019 Badak RCM
http://slidepdf.com/reader/full/badak-rcm 1/17
PS2-6.1
RELIABILITY IMPROVEMENT IN BADAK LNG PLANT
AMELIORATION DE LA FIABILITE DE L’USINE
BADAK LNG
Bambang S. Santoso, Sr. Reliability Engineer Rahmat Safruddin, Process Engineer Ranto Manullang, Inspection Engineer
PT Badak NGL, Bontang - East Kalimantan - Indonesia
ABSTRACT
To keep maintain the position as the worlds’ leading LNG supplier, PT Badak NGLimplements various programs to improve the reliability of its LNG plant located in Bontang,
East Kalimantan.
The effectiveness of PT Badak reliability improvement programs increased significantlyafter the set up of the Reliability Improvement Team (RIT) in 1996. This team identified thetop ten reliability issues and continuously monitors the results of the strategy implemented to
eliminate each issue.
As a result, the Load Factor or uptime has improved from 90 (1996) to 92.5 % (1999),
approaching the World Class level of 95 %. The ratio between the Maintenance Cost and theCurrent Replacement Value (CRV) has improved from 0.76 to 0.68 %, exceeding the World
Class level of 1-3 %.
The objective of this paper is to share PT Badak experience in implementing PTB
reliability improvement programs with the LNG 13 Conference attendees in order to improve
the reliability of the world LNG supply in general.
RESUME
Afin de maintenir sa position de leader mondial en fourniture de LNG, PT Badak NGL amis en œuvre plusieurs programmes visant à améliorer la fiabilité de son usine de
liquéfaction de gas située à Bontang, Kalimantan Est.
La mise en place d’une Task-Force RIT (Reliability Improvement Team) en 1996 a
nettement augmenté l’efficacite des programmes d’amelioration de fiabilite.Cette équipe
identifie les Dix Problemes Prioritaires en matières de fiabilité et observe continuellement lesrésultats des stratégies appliquées pour les éliminer.
En conséquence le facteur de charge est passé de 90% (1996) à 92.5 % (1999) en direction des
meilleurs niveaux internationaux de 95%. Le ratio Coûts de Maintenance / Valeur de
Remplacement est passé de 0,76 % á 0,68% dépassant les niveaux mondiaux de 1-3%.
La présentation a pour objectif de partager avec les autres participants de ‘LNG13’l’expérience acquise par PT Badak en réalisant les programmes précédents, afin d’améliorer
la fiabilité de la fourniture mondiale de GNL.

7/29/2019 Badak RCM
http://slidepdf.com/reader/full/badak-rcm 2/17
PS2-6.2
RELIABILITY IMPROVEMENT IN BADAK LNG PLANT
1. INTRODUCTION
PT Badak NGL operates a LNG plant in Bontang - East Kalimantan, which has the
highest LNG production capacity in the world. The company, a joint venture between the
Indonesian Government (Pertamina), TOTAL Indonesie, BP, UNOCAL and Jilco, startedwith two process trains A and B in 1977. Currently, the total LNG production capacity of
the eight process trains (A, B, C, D, E, F, G and H) is 24.1 mtpa or 53 million m3 per
year. This ideal capacity is based on a condition that all process trains always operate attheir current Maximum Sustainable Rate (MSR). The more reliable the plant and the feed
gas supply the closer the actual capacity to this ideal capacity.
To systematically improve the plant reliability, PT Badak formed the Reliability
Improvement Team (RIT) in 1996 and the fully dedicated Reliability Engineering Group
(REG) in 1999. Their function is to assess plant reliability, identify top ten reliabilityissues, monitor action program required to address each issue and evaluate the result.
2. RELIABILITY PERFORMANCE INDICATORS
Until 1997, the main indicator used by PT Badak to assess the plant reliability, is the
Plant Availability (PAV) which is defined as:
PAV = (Actual Train Running Hours / Total Train Hours Entire Year) X 100 %
When the RIT started to work, the Plant Availability (PAV) for 1988 - 1997 is as
follows:
Year '89 '90 '91 '92 '93 '94 '95 '96 '97PAV (%) 94.9 91.8 95.3 93.8 95.5 95.3 94.2 94.7 93.4
During this 10 years the precentages of the total LNG production loss associated with
plant equipment problems are as follows :
- Mechanical : 21.0 %
- Instrument : 2.9 %
- Rotating Equipment : 1.8 %- Electrical : 0.6 %
The PAV calculation is simple but does not count the difference in the individual traincapacity, the transition and the part load production losses. Therefore, to provide a better
method to quantify and categorize LNG production losses the RIT developed a Load
Factor Reporting System in 1997 which uses the following definitions:
7/29/2019 Badak RCM
http://slidepdf.com/reader/full/badak-rcm 3/17
PS2-6.3
♦ Maximum Sustainable Rate (MSR) :The official individual Train LNG production rates in m3/hr as used in the annual
LNG capacity projection
♦ MSR LNG Production :MSR X actual total hours in the evaluated month or year
♦ LNG Production Losses :Train LNG production losses in m3, calculated from the diference between the MSR
and the measured actual production rate, multiplied with the duration in hours.
♦ Load Factor (LF) or Uptime :
LF = (Actual LNG Prod / MSR LNG Production) * 100%
The LF is a measure of individual train Reduced LNG Production due to all causes
(Plant Related and Outside Related). The LF is a direct measure of all factors that
impact LNG production.
♦ Production Reliability Factor (PRF):
PRF = [1 - Plant Related Losses / (Actual Production + All Losses)] * 100%
The PRF is an indicator of Reduced LNG Production due to Plant Related losses
only. The PRF is used to measure individual Train reliability performance relative tothe annual reliability targets.
Badak LNG Plant overall LF and PRF are calculated using the sums of all trains: MSR LNG production, actual LNG production, plant related losses and all losses. The overall
LF and PRF statistics for 1997-1999 is displayed and discussed later in Chapter 7.
There are 2 Major Categories and 13 Sub Categories of Production Loss defined and
recorded in the PT Badak online Plant Operation Data System (PODS):
A. Plant Related - Loss elements that are under the direct control and responsibility of PTBadak :
1. Scheduled Shutdown
2. Train Trip, Train Related )3. Train Trip, Utilities Related )
4. Unscheduled Shutdown )
5. On-line Repair ) Unscheduled Plant Related Production Loss
6. Mechanical Problem )7. Processing Problem )
8. Utilities Problem )
9. Export Derime Gas )
B. Outside Related - Loss elements that are under direct control and responsibility of
Outside parties (such as, feed gas supply and LNG cargo shipping):

7/29/2019 Badak RCM
http://slidepdf.com/reader/full/badak-rcm 4/17
PS2-6.4
10. Inventory Control
11. Idle Shutdown
12. Reduced Feed Gas13. Other
The RIT/REG uses the PODS and the Load Factor Reporting System to identify theequipment or systems which cause the most production losses for determination of the
appropriate counter measure.
Figure 2.1. below shows the various production loss categories, transition losses and
part load.
Figure 2.1 : Category of production losses
The difference between PAV and LF is shown in the calculation example on Table 2.1.
The actual LF values always lower than the actual PAV because of the transition and partload losses.
To improve the PRF, PT Badak performs all effort to reduce the Plant Related losses. TheRIT/REG facilitates discussions between departments responsible for the identified
reliability issues. The reliability issues discussed include: finding and eliminating the root
causes of the Plant Related problems, PM/PdM optimization through pilot projects,reduction of scheduled shut down duration, extending time between overhaul, improving
logistics practices, setting up reliability data base etc.
Two of the top issues and the Pilot Projects will be discussed in Chapters 3 and 4.
0
200
400
600
800
0 1000 2000 3000 4000 5000 6000 7000 8000
OPERATING HOURS
P R O D U C T I O N R A
T E ( M 3 / H
I D L E S / D
S C H E D U L E D S / D
U N S C H E D U
L E D S / D
P L A N T T R I P PLANT
PROBLEMINVENTORY
CONTROLFEED GASPROBLEM
MSR
PLANT RELATED OUTSIDE RELATED

7/29/2019 Badak RCM
http://slidepdf.com/reader/full/badak-rcm 5/17
PS2-6.5
Table 2.1 : Calculation example of PAV, LF and PRF
Data (Example) Calculation
MSR Production Rate :
700,000 m3/hr
MSR Production (in 1 year) : 700,000 X 8760 =
6,132,000,000 m3Down time (excluded idle s/d):
200 hrs
PAV = 8560 / 8760 =
97.7 %
Actual production :
5,850,000,000 m3
LF = 5850,000,000 / 6,132,000,000 =
95.4 %
All losses :
283,000,000 m3
Plant Related Losses :
200,000,000 m3
PRF =
[1-(200,000,000/5,850,000,000+283,000,000)]X100%=
96.7 %
Unscheduled: 50,000,000 m3 Unscheduled : 50,000,000 / 6,132,000,000=
0.8 % of the MSR Production
Scheduled : 150,000,000 m3 Scheduled : 2.4 % of the MSR Production
3. TOP RELIABILITY ISSUES
3.1. CO2 Removal Unit
The problem in CO2 Removal Unit (Amine Unit) is one of the major cause of the
Plant Related Losses in 1989 – 1999. The major problem in this plant is erosioncorrosion that several times caused PT Badak to partially shut down the CO2
Removal Unit or the whole Train. In 1995, for example, PT Badak lost potential production equivalent to 243,000 m
3of LNG due problem in CO2 Removal Unit of
Train E. In general, the losses are caused by lowering LNG production due to lower amine circulation rate when one bank of the cross exchanger was isolated for repair,
shutdown amine and dehydration units while other units were still in operation by
utilizing cross lean gas from other train, and extended downtime for equipmentrepair.
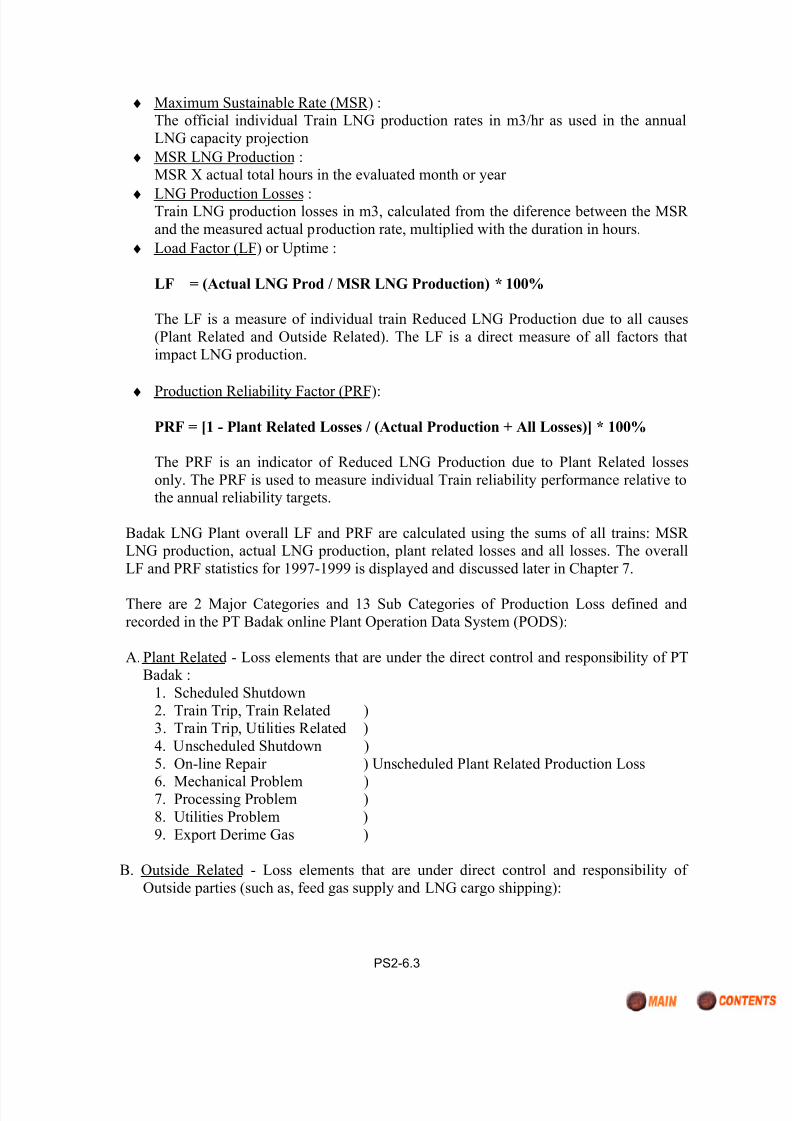
Modifications of equipment were done by partial upgrading of piping material fromcarbon steel to stainless steel, especially reducers and enlargers around control
valves. Some parts of carbon steel pipe on the rich amine side susceptible to erosion
corrosion were also replaced with 304 stainless steel, which eliminated pipingleaks. Modification of the inlet distributor to the perforated pipe type in AmineFlash Drum prevents the incoming solution from falling freely. The new inlet
distributor, a standpipe with perforations located below the liquid level, prevents
the solution from directly impinging the vessel wall (see Figure 3.1). The new inletdistributor design eliminated the erosion corrosion problem related to the inlet
liquid
7/29/2019 Badak RCM
http://slidepdf.com/reader/full/badak-rcm 6/17
PS2-6.6
Figure 3.1 : Amine Flash Drum inlet distributor modification to perforated
pipe.
In Amine Stripper, the inlet distributor was modified from to H-type to Open
Gallery-Type. This gallery-type inlet distributor reduced the vibration at the inlet
distributor by readily releasing the CO2 vapor from the amine solution inside theamine stripper column. With the H-type inlet distributor, the two-phase flow caused
by the release of CO2 inside the pipe creates vibration due to impingement effect
induced by the shape of the inlet distributor. The shell and Tube Amine/AmineCross Exchangers were also replaced with Plate and Frame type in Trains D and F
to overcome the erosion corrosion problem experienced in the first MDEA solventuse. However, the replacement has been stopped due to improved condition after
solvent replacement.
In addition to equipment modification, the amine solvent was also converted
from formulated MDEA to activated MDEA. Both are MDEA-based solvents butthey are different in activator. The solvent conversion took place in the period of
1997-1999 following the good results of 18-month test period in Train C. After
being operated with the new amine solvent for three years, the erosion corrosion of the system has been reduced significantly.
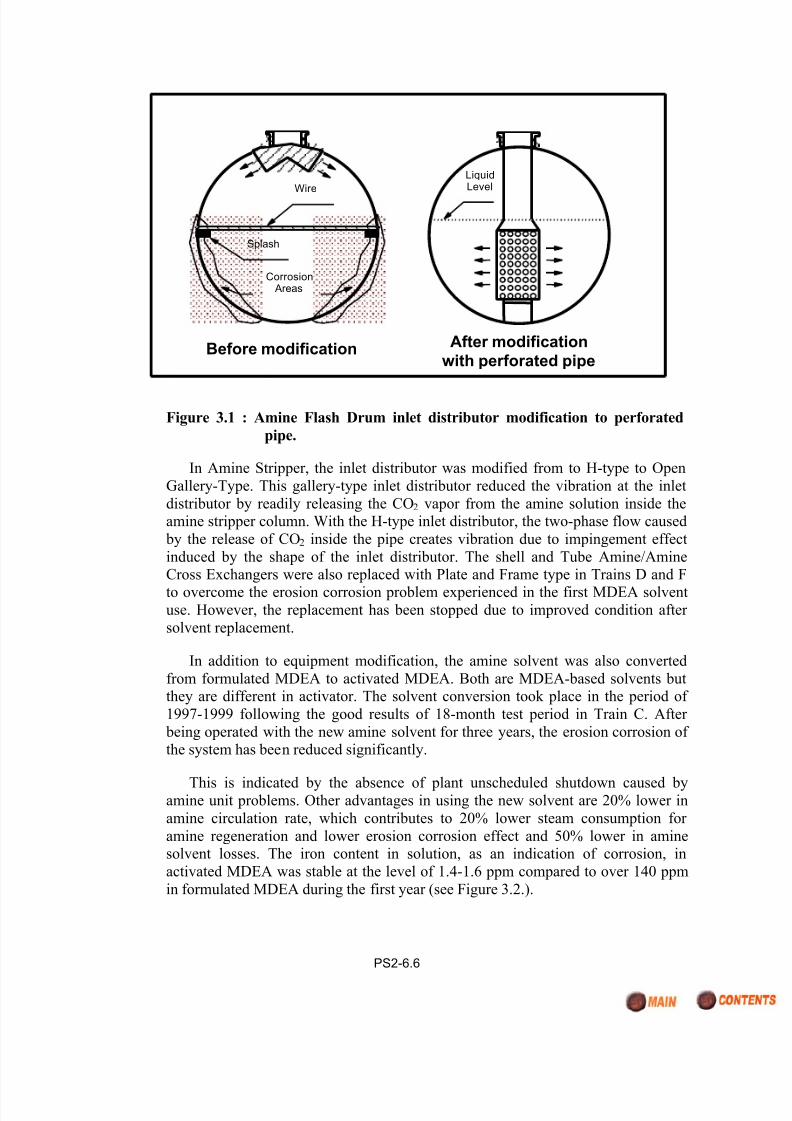
This is indicated by the absence of plant unscheduled shutdown caused byamine unit problems. Other advantages in using the new solvent are 20% lower in
amine circulation rate, which contributes to 20% lower steam consumption for
amine regeneration and lower erosion corrosion effect and 50% lower in aminesolvent losses. The iron content in solution, as an indication of corrosion, in
activated MDEA was stable at the level of 1.4-1.6 ppm compared to over 140 ppm
in formulated MDEA during the first year (see Figure 3.2.).
Before modification After modification
with perforated pipe
Wire
Splash
LiquidLevel
Corrosion Areas
7/29/2019 Badak RCM
http://slidepdf.com/reader/full/badak-rcm 7/17
PS2-6.7
Figure 3.2 : Comparison of iron content in solution during the first one year
operating with Formulated MDEA and Activated MDEA.
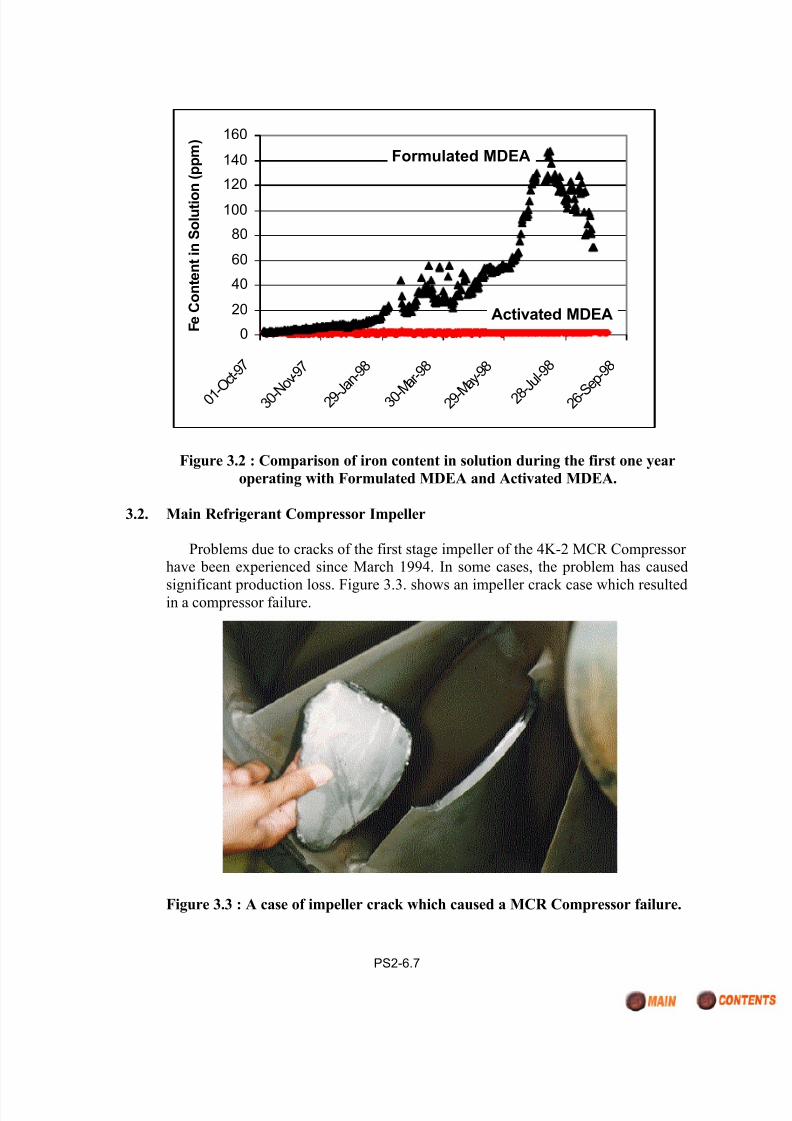
3.2. Main Refrigerant Compressor Impeller
Problems due to cracks of the first stage impeller of the 4K-2 MCR Compressor have been experienced since March 1994. In some cases, the problem has caused
significant production loss. Figure 3.3. shows an impeller crack case which resultedin a compressor failure.
Figure 3.3 : A case of impeller crack which caused a MCR Compressor failure.
0
20
40
60
80
100
120
140
160
0 1 - O
c t - 9 7
3 0 - N o v
- 9 7
2 9 - J a n
- 9 8
3 0 - M a r -
9 8
2 9 - M a y
- 9 8
2 8 - J
u l - 9 8
2 6 - S e p
- 9 8
F e C o n t e n t i n S o l u t i o
n ( p p m )
Formulated MDEA
Activated MDEA
7/29/2019 Badak RCM
http://slidepdf.com/reader/full/badak-rcm 8/17
PS2-6.8
Analysis of the problem root cause is very difficult due to the problem
complexity and disputes between PT Badak and the compressor manufacturer. PT
Badak tried to convince the manufacturer that the original 15 vanes - 3 pieceimpeller needs to be totally redesigned. The manufacturer tried to collect data with
special data acquisition equipment to support their argument that the failure cause is
not the design. In any case the acquired data did not show any evidence of operational error.
Several impeller design configuration, including the latest 17 vanes - 2 piececonfiguration, have been tested, installed and proposed by the manufacturer as the
final solution. PT Badak accept it as a temporary solution until another failure
pushed the manufacturer to come with a better solution.
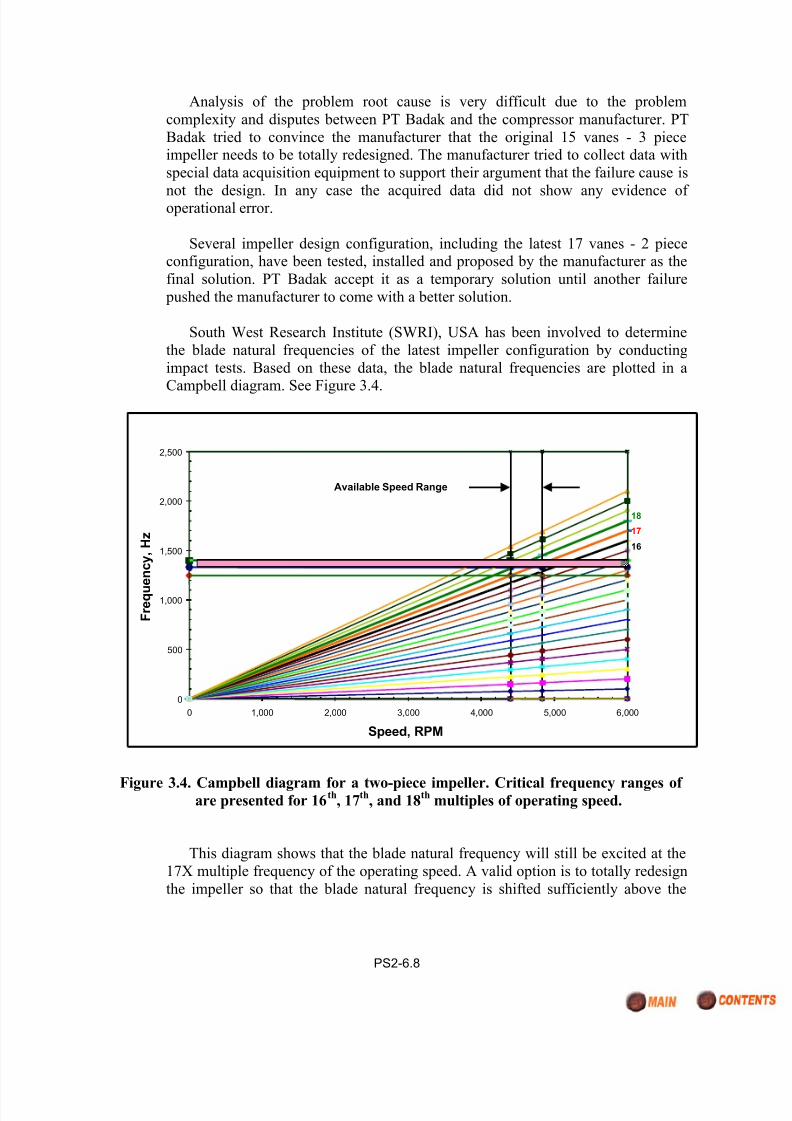
South West Research Institute (SWRI), USA has been involved to determine
the blade natural frequencies of the latest impeller configuration by conducting
impact tests. Based on these data, the blade natural frequencies are plotted in a
Campbell diagram. See Figure 3.4.
0
500
1,000
1,500
2,000
2,500
0 1,000 2,000 3,000 4,000 5,000 6,000
Speed, RPM
F r e q u
e n c y , H z
16
17
18
Available Speed Range
Figure 3.4. Campbell diagram for a two-piece impeller. Critical frequency ranges of are presented for 16
th, 17
th, and 18
thmultiples of operating speed.
This diagram shows that the blade natural frequency will still be excited at the
17X multiple frequency of the operating speed. A valid option is to totally redesign
the impeller so that the blade natural frequency is shifted sufficiently above the
7/29/2019 Badak RCM
http://slidepdf.com/reader/full/badak-rcm 9/17
PS2-6.9
influence of the operating speed. For some reasons, the manufacturer was for long
time reluctant to accept this option.
In the last 2 years, careful monitoring, planning and opportunity inspection
conducted on the trains, have prevented unnecessary unscheduled shut down due to
the 4K-2 impeller cracks.
During the October 2000 warranty shut down of the new train H, the MCR
compressor was inspected. Again, cracks are found in the vane-to-back weld area of the first stage impeller which has the latest 17 vanes - 2 piece configuration.
With this latest finding, finally the manufacturer agrees to design a newimpeller with a higher impeller natural frequency, increased about 11 % from the
previous design.
This increase will eliminate the resonance in the compressor operating speed
range up to 4835 RPM. As short term measure, to reduce the possibility of cracks inother trains, the compressors speed is limited to a maximum of 4,620 RPM until the
new design impeller is available. This speed reduction will have no impact on thetrains LNG production capacity.
4. RCM AND RBI PILOT PROJECTS
4.1. RCM Pilot Project
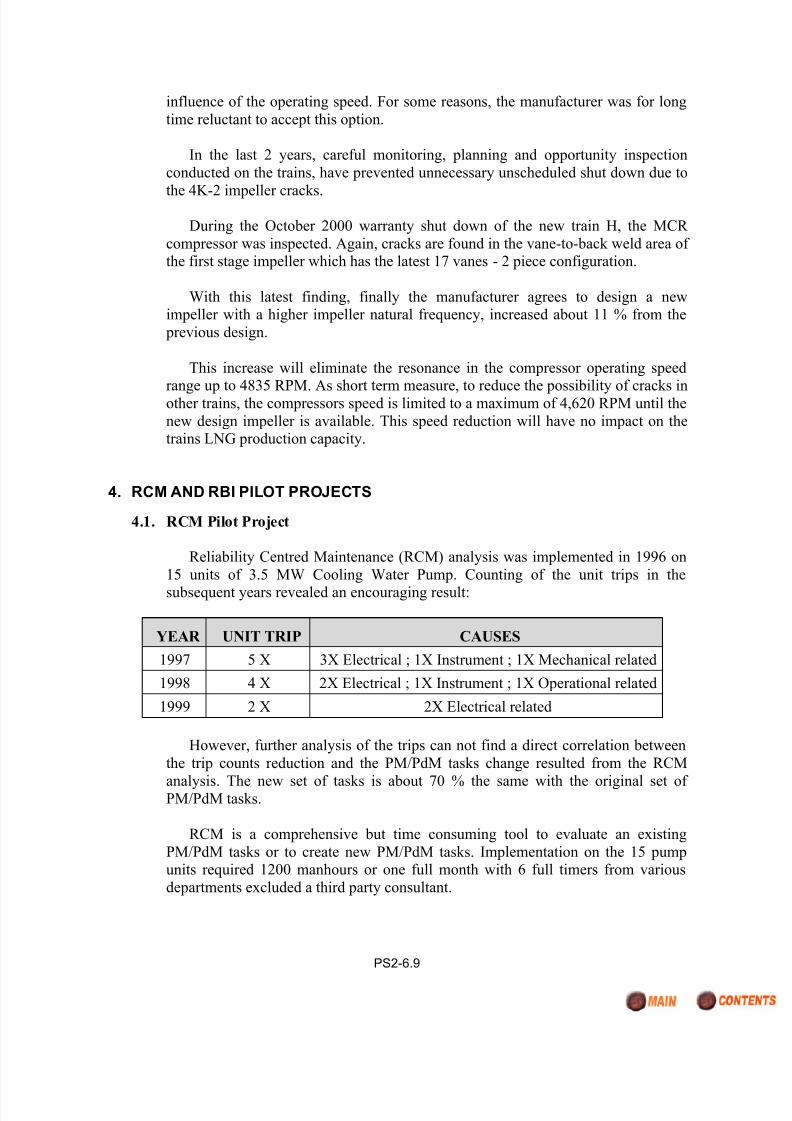
Reliability Centred Maintenance (RCM) analysis was implemented in 1996 on
15 units of 3.5 MW Cooling Water Pump. Counting of the unit trips in the
subsequent years revealed an encouraging result:
YEAR UNIT TRIP CAUSES
1997 5 X 3X Electrical ; 1X Instrument ; 1X Mechanical related
1998 4 X 2X Electrical ; 1X Instrument ; 1X Operational related
1999 2 X 2X Electrical related
However, further analysis of the trips can not find a direct correlation between
the trip counts reduction and the PM/PdM tasks change resulted from the RCM
analysis. The new set of tasks is about 70 % the same with the original set of PM/PdM tasks.
RCM is a comprehensive but time consuming tool to evaluate an existing
PM/PdM tasks or to create new PM/PdM tasks. Implementation on the 15 pumpunits required 1200 manhours or one full month with 6 full timers from various
departments excluded a third party consultant.

7/29/2019 Badak RCM
http://slidepdf.com/reader/full/badak-rcm 10/17
PS2-6.10
Within 3 years of RCM implementation, the maintenance cost per unit
decreased significantly. This is mainly because the pump motor overhaul interval is
extended from 5 to 7 years. Actually the same decision can be made withoutfollowing the RCM method. The decision only requires a judgement of the person
who has a good knowledge of the motor overhaul process and the motor condition
before and after the overhaul. The second source of cost reduction is the strategychange on the pump impeller replacement: from time based to condition based and
implementation of an open bid purchasing rather than sole source. This decision can
also be taken without RCM.
The most benefit of the RCM is as a training tool for PT Badak plant personnel
to work together at a fixed schedule to improve understanding on system approach(instead of equipment approach) and failure analysis.
The RCM method is currently used by PT Badak only as a knowledge, for
PM/PdM task improvement when there is a PM/PdM related equipment failure.
4.2. RBI Pilot Project
Analysing inspection interval requirement of all plant equipment can be time
consuming. The Risk Based Inspection (RBI) method could be used to minimise the
analysis work and to focus on the high-risk items. As we know, RBI is a method to plan inspection based on an analysis of Risk of events whose probability or
consequence can be affected by the inspection.
The prime concern is physical damaged caused by corrosion, erosion, fatigue,etc., rather than malfunctions due to improper operation or human error. It is also
pertinent to note that Risk is a function of both failure probability and the
consequences of failure. In its simple form: Risk = Probability x Consequence.
PT Badak has implemented this RBI method on stationary equipment of CO2
Removal Unit of a Process Train as a pilot project. This unit consists of 93stationary equipment (pressure vessels) and 283 piping items. Tables 4.1. and 4.2
show the Risk distribution for stationary equipment and piping items resulted from
the RBI assessment.
The Risk Distribution for Stationary Equipment Component items indicate that
2 items (2.15%) fall within the High Consequence/High Probability area (Criticality
1) and 10 (10.75%) items fall in the Medium/High and High/Medium area(Criticality 2). This distribution reflects the spread of the majority of the stationary
items in the Low Probability and Medium Consequence (Criticality 4).

7/29/2019 Badak RCM
http://slidepdf.com/reader/full/badak-rcm 11/17
PS2-6.11
Table 4.1 : Stationary Equipment Risk Distribution
PROBABILITY
CONSEQUENCES LOW
(59.14%)
MEDIUM
(30.39%)
HIGH
(9.67%)
HIGH
(5.38%)
-
(0%)
3
(3.23%)
2
(2.15%)
MEDIUM
(93.82%)
55
(59.14%)
26
(27.16%)
7
(7.52%)
LOW
(0%)
-
(0%)
-
(0%)
-
(0%)
Table 4.2 : Piping Items Risk Distribution
PROBABILITY
CONSEQUENCESLOW
(67.84%)
MEDIUM
(24.38%)
HIGH
(7.77%)
HIGH
(0.35%)
1
(0.35%)
-
(0%)
-
(0%)
MEDIUM
(96.81%)
183
(64.66%)
69
(24.38%)
22
(7.77%)
LOW
(2.83%)
8
(2.83%)
-
(0%)
-
(0%)
The Risk Distributions for piping indicate that no items fall within the High
Consequence/High Probability area (Criticality 1) and 22 items (7.77%) fall in the
Medium/High and High/Medium are (Criticality 2). This distribution reflects thespread of the majority of piping items in the Medium Consequence and Low
Probability area (Criticality 4).
The interval of inspections can be determined through a scheduling tool that
uses grade (confidence factor), probability (likelihood) and consequences of failure.
The Inspection Grade indicates the inspection interval depending on PT Badak
7/29/2019 Badak RCM
http://slidepdf.com/reader/full/badak-rcm 12/17
PS2-6.12
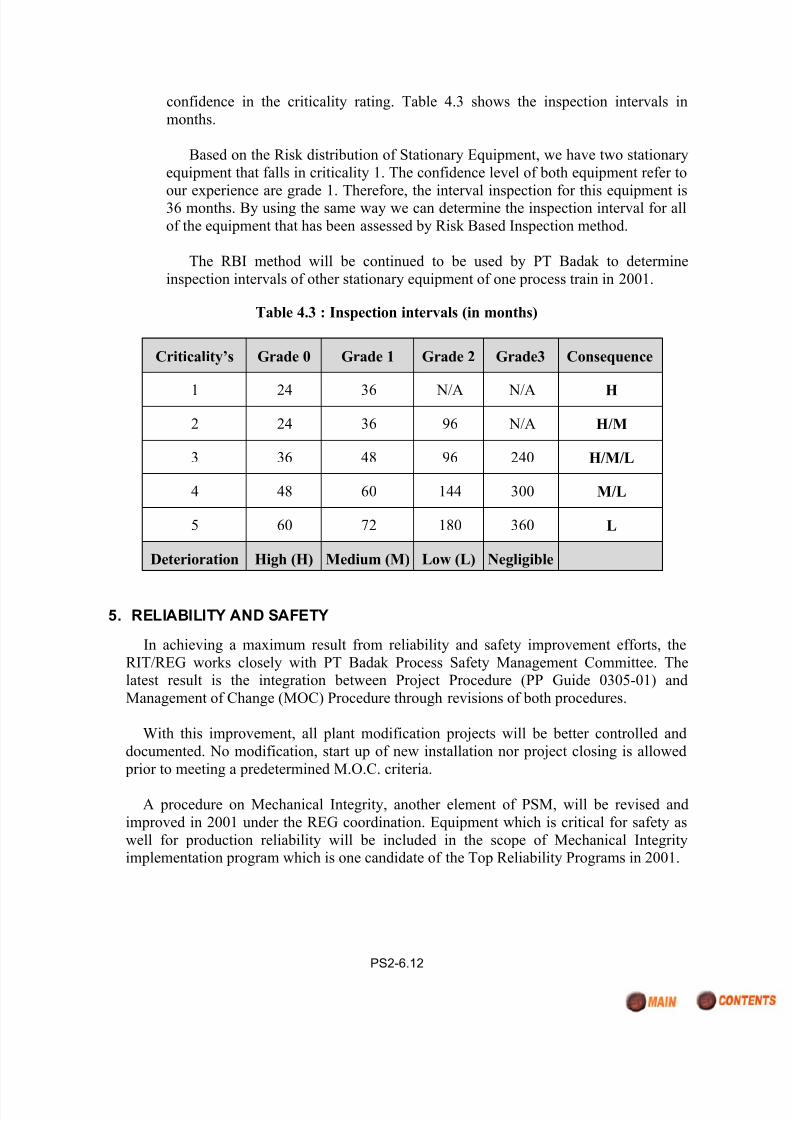
confidence in the criticality rating. Table 4.3 shows the inspection intervals in
months.
Based on the Risk distribution of Stationary Equipment, we have two stationary
equipment that falls in criticality 1. The confidence level of both equipment refer to
our experience are grade 1. Therefore, the interval inspection for this equipment is36 months. By using the same way we can determine the inspection interval for all
of the equipment that has been assessed by Risk Based Inspection method.
The RBI method will be continued to be used by PT Badak to determine
inspection intervals of other stationary equipment of one process train in 2001.
Table 4.3 : Inspection intervals (in months)
Criticality’s Grade 0 Grade 1 Grade 2 Grade3 Consequence
1 24 36 N/A N/A H
2 24 36 96 N/A H/M
3 36 48 96 240 H/M/L
4 48 60 144 300 M/L
5 60 72 180 360 L
Deterioration High (H) Medium (M) Low (L) Negligible
5. RELIABILITY AND SAFETY
In achieving a maximum result from reliability and safety improvement efforts, the
RIT/REG works closely with PT Badak Process Safety Management Committee. Thelatest result is the integration between Project Procedure (PP Guide 0305-01) and
Management of Change (MOC) Procedure through revisions of both procedures.
With this improvement, all plant modification projects will be better controlled and
documented. No modification, start up of new installation nor project closing is allowed
prior to meeting a predetermined M.O.C. criteria.
A procedure on Mechanical Integrity, another element of PSM, will be revised and
improved in 2001 under the REG coordination. Equipment which is critical for safety as
well for production reliability will be included in the scope of Mechanical Integrityimplementation program which is one candidate of the Top Reliability Programs in 2001.

7/29/2019 Badak RCM
http://slidepdf.com/reader/full/badak-rcm 13/17
PS2-6.13
6. LIFE CYCLE COST
A survey quoted by Ron Moore [1] found, while expenditures for plant and equipment
occur later in the acquisition process, most of the life-cycle cost of a plant is committed at
the preliminary stages of the design and acquisition process. The survey also reported thatabout 60-75 % of the life cycle cost is associated with maintenance and support. This
means that design and installation efforts can have a dramatic effect on maintenance costand therefore on life cycle cost. The life cycle cost concept is shown in Figure 6.1. Thedotted line shows the life cycle cost curve characteristics when the maintenance cost is
high relative to the initial cost.
Figure 6.1 : Phases of Life-Cycle Cost Commitment
Being concern with this life-cycle concept, PT Badak engineers have been proactively
involved in every Badak Plant Expansion Projects, using their experience to provide input
on maintenance and operational aspects. The engineers have been involved in the FrontEnd Engineering & Design (FEED), Detail Design, Factory Acceptance Tests (FAT),
Construction, Commissioning and Operational Acceptance of Badak LNG Plant
Expansion Projects.
An example result of the involvement is the installation and expansion of the on line
Machinery Monitoring Systems (MMS) for critical Rotating Equipment of train E throughH. By having this system installed, the severity of problems such as the 4K-2 Compressor Impeller cracks can be assessed on line, before planning a train shut down.
PT Badak engineers also involved in Life Extension Project, Debottlenecking of trainsA through F and DCS retrofit project.
0
10
20
30
40
50
60
70
80
90
100
LIFE CYCLE PHASE
L I F E C Y C L E C O S T
( % )
C O N C E P T U A L
D E S I G
P R E L I M I N A R Y
D E S I G N
F I N A L D E S I G N
C O N S T R U C T I O N
O P E R A T I O N &
M A I N T E N A N C E
66 %
95 %
85 %
LOW COST
HIGH COST
7/29/2019 Badak RCM
http://slidepdf.com/reader/full/badak-rcm 14/17
PS2-6.14
7. BENCHMARKING AND STATISTICS
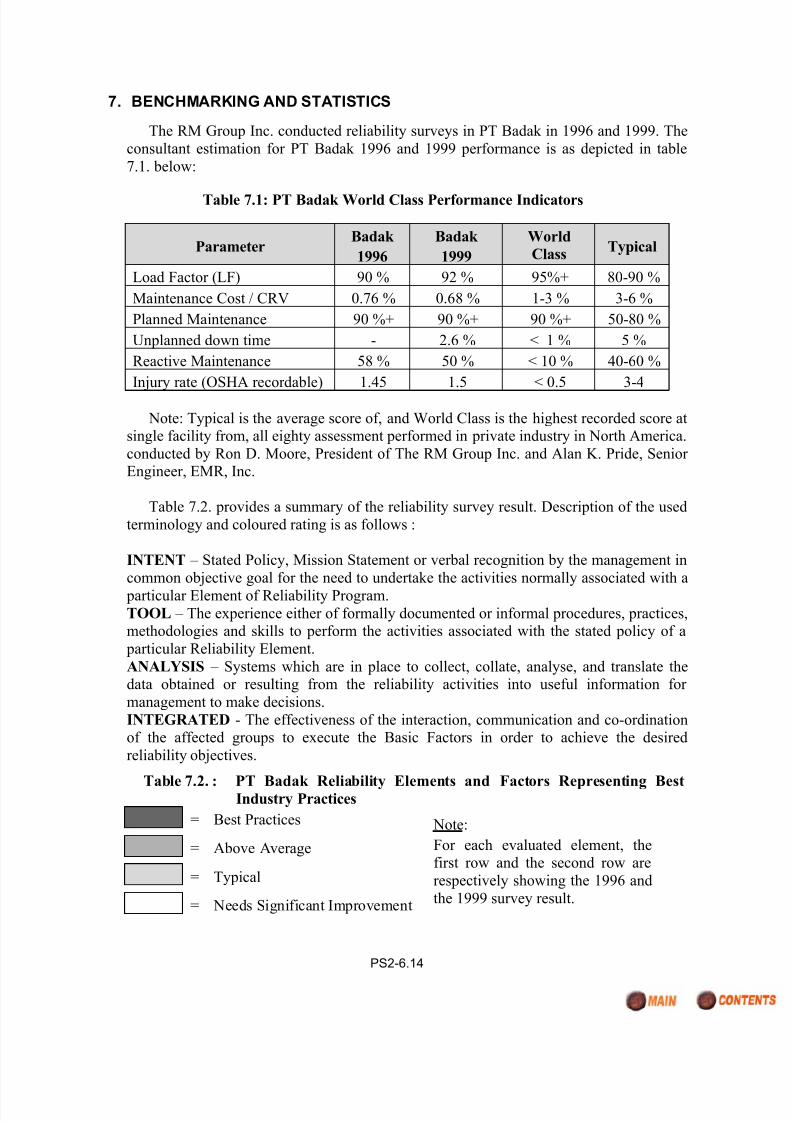
The RM Group Inc. conducted reliability surveys in PT Badak in 1996 and 1999. The
consultant estimation for PT Badak 1996 and 1999 performance is as depicted in table
7.1. below:
Table 7.1: PT Badak World Class Performance Indicators
ParameterBadak
1996
Badak
1999
World
ClassTypical
Load Factor (LF) 90 % 92 % 95%+ 80-90 %
Maintenance Cost / CRV 0.76 % 0.68 % 1-3 % 3-6 %
Planned Maintenance 90 %+ 90 %+ 90 %+ 50-80 %
Unplanned down time - 2.6 % < 1 % 5 %
Reactive Maintenance 58 % 50 % < 10 % 40-60 %
Injury rate (OSHA recordable) 1.45 1.5 < 0.5 3-4
Note: Typical is the average score of, and World Class is the highest recorded score atsingle facility from, all eighty assessment performed in private industry in North America.
conducted by Ron D. Moore, President of The RM Group Inc. and Alan K. Pride, Senior Engineer, EMR, Inc.
Table 7.2. provides a summary of the reliability survey result. Description of the used
terminology and coloured rating is as follows :
INTENT – Stated Policy, Mission Statement or verbal recognition by the management in
common objective goal for the need to undertake the activities normally associated with a
particular Element of Reliability Program.
TOOL – The experience either of formally documented or informal procedures, practices,methodologies and skills to perform the activities associated with the stated policy of a
particular Reliability Element.
ANALYSIS – Systems which are in place to collect, collate, analyse, and translate thedata obtained or resulting from the reliability activities into useful information for
management to make decisions.
INTEGRATED - The effectiveness of the interaction, communication and co-ordinationof the affected groups to execute the Basic Factors in order to achieve the desired
reliability objectives.
Table 7.2. : PT Badak Reliability Elements and Factors Representing BestIndustry Practices
= Best Practices
= Above Average
= Typical
= Needs Significant Improvement
Note:
For each evaluated element, thefirst row and the second row are
respectively showing the 1996 and
the 1999 survey result.

7/29/2019 Badak RCM
http://slidepdf.com/reader/full/badak-rcm 15/17
PS2-6.15
ELEMENT INTENT TOOLS ANALYSIS FEEDBACK INTEGRATED
1996COMPANY RELIABILITY
PHILOSOPHY PRACTICES 1999
RELIABILITY CONTINUOUS
IMPROVEMENT PLAN
RELIABILITY AUDITS
PRACTICES
ORGANIZATIONAL STRUCT.
FOR RELIABILITY PRACTICES
STAFF LEVELS & EXPERTISE
FOR RELIABILITY PRACTISE
TEAMWORK, CULTURE
PRACTICES
PM
PRACTICES
PREDICTIVE MAINTENANCE
PRACTICES
PROACTIVE (RCFA, ETC)
PRACTICES
OVERHAUL & SHUTDOWN
PRACTICES
INSTALLATION &
COMMISSIONING PRACTICES
ENGINEERING
PRACTICES
QUALITY ASSURANCE (QA/QC)
PRACTICES
OPERATIONS
PRACTICES
INVENTORY
PRACTICES
RELIABILITY DATA BASE
(MMMS, EQUIP. HISTORY, ETC)
TRAINING
PRACTICES
Recent benchmarking survey among LNG plants by Shell Global Solution (SGS)
confirms the following results for 1999:
1. Badak LNG plant is one of the best in asset utilization (which is for all practical purpose the same as Load Factor).
2. PT Badak NGL has one of the lowest operating cost index.
7/29/2019 Badak RCM
http://slidepdf.com/reader/full/badak-rcm 16/17
PS2-6.16
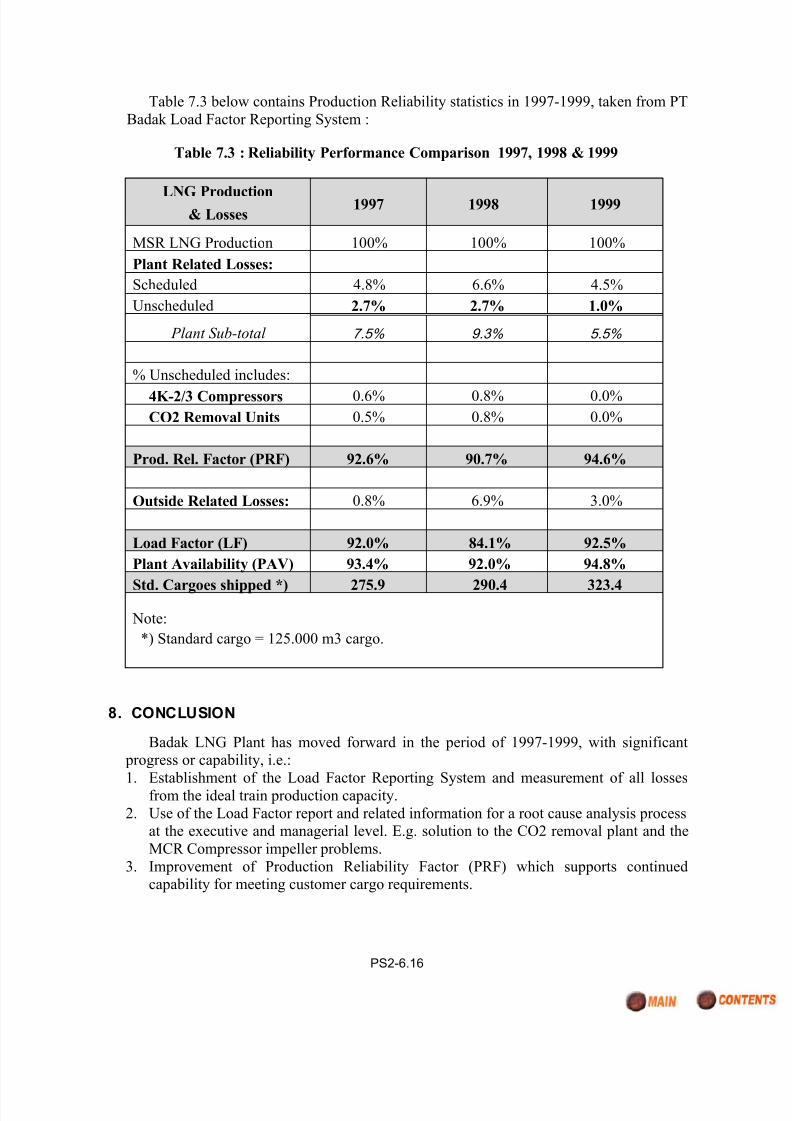
Table 7.3 below contains Production Reliability statistics in 1997-1999, taken from PT
Badak Load Factor Reporting System :
Table 7.3 : Reliability Performance Comparison 1997, 1998 & 1999
LNG Production& Losses
1997 1998 1999
MSR LNG Production 100% 100% 100%
Plant Related Losses:
Scheduled 4.8% 6.6% 4.5%
Unscheduled 2.7% 2.7% 1.0%
Plant Sub-total 7.5% 9.3% 5.5%
% Unscheduled includes:
4K-2/3 Compressors 0.6% 0.8% 0.0%
CO2 Removal Units 0.5% 0.8% 0.0%
Prod. Rel. Factor (PRF) 92.6% 90.7% 94.6%
Outside Related Losses: 0.8% 6.9% 3.0%
Load Factor (LF) 92.0% 84.1% 92.5%
Plant Availability (PAV) 93.4% 92.0% 94.8%
Std. Cargoes shipped *) 275.9 290.4 323.4
Note:
*) Standard cargo = 125.000 m3 cargo.
8. CONCLUSION
Badak LNG Plant has moved forward in the period of 1997-1999, with significant progress or capability, i.e.:
1.
Establishment of the Load Factor Reporting System and measurement of all lossesfrom the ideal train production capacity.
2. Use of the Load Factor report and related information for a root cause analysis processat the executive and managerial level. E.g. solution to the CO2 removal plant and the
MCR Compressor impeller problems.
3. Improvement of Production Reliability Factor (PRF) which supports continuedcapability for meeting customer cargo requirements.

7/29/2019 Badak RCM
http://slidepdf.com/reader/full/badak-rcm 17/17
PS2-6.17
REFERENCE CITED
[1] Moore, Ron. "Making Common Sense Common Practice: models for manufacturing
excellence" , Gulf Publishing Company, Houston - Texas, 1999.