big data in env. sc. in australia
DESCRIPTION
A good presentationTRANSCRIPT
It’s not just about big data for the Earth and Environmental Sciences: it’s now about High Performance Data (HPD)
Lesley Wyborn – Geoscience Australia
New Petascale Raijin Computer at NCI
Outline of the ‘Big Data’ Problem in Earth and Environmental Sciences
• We know we have a ‘Big Data’ problem
• But have we nailed what the ‘Big Data’ problem is?
• Until we do, we could waste a lot of resources
• This presentation is about trying to nail what the ‘Big Data’ problem is for the Earth and Environmental Sciences
• And showing exemplars of how we are addressing it
UTAS “Big Data” Workshop, Hobart, September 2013
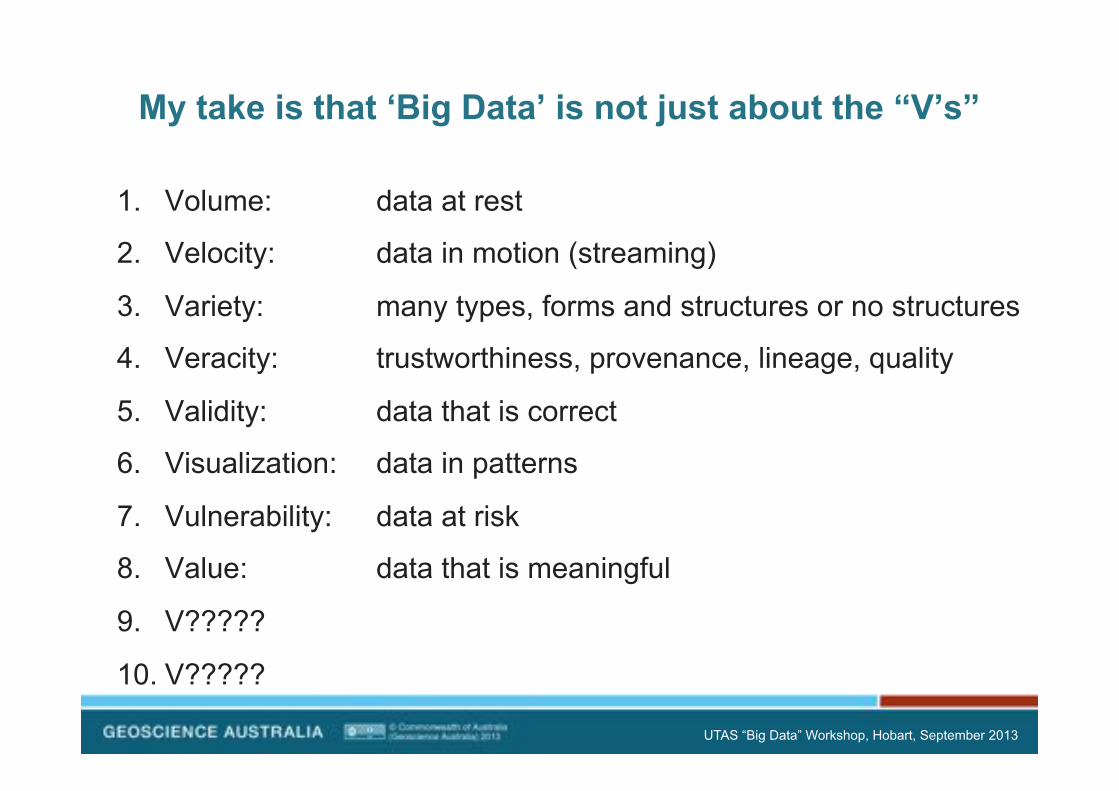
My take is that ‘Big Data’ is not just about the “V’s”
1. Volume: data at rest
2. Velocity: data in motion (streaming)
3. Variety: many types, forms and structures or no structures
4. Veracity: trustworthiness, provenance, lineage, quality
5. Validity: data that is correct
6. Visualization: data in patterns
7. Vulnerability: data at risk
8. Value: data that is meaningful
9. V?????
10. V?????
UTAS “Big Data” Workshop, Hobart, September 2013
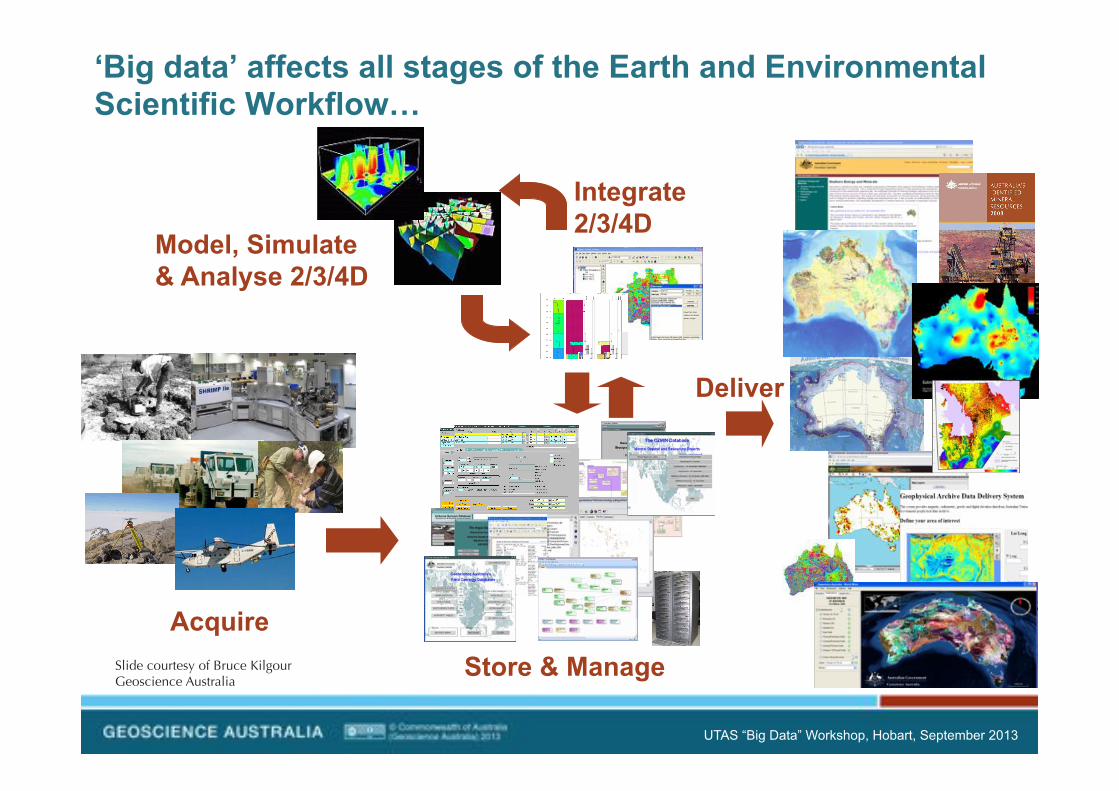
‘Big data’ affects all stages of the Earth and Environmental Scientific Workflow…
Acquire Store & Manage
Deliver
Integrate 2/3/4D
Model, Simulate & Analyse 2/3/4D
Slide courtesy of Bruce Kilgour!Geoscience Australia
UTAS “Big Data” Workshop, Hobart, September 2013
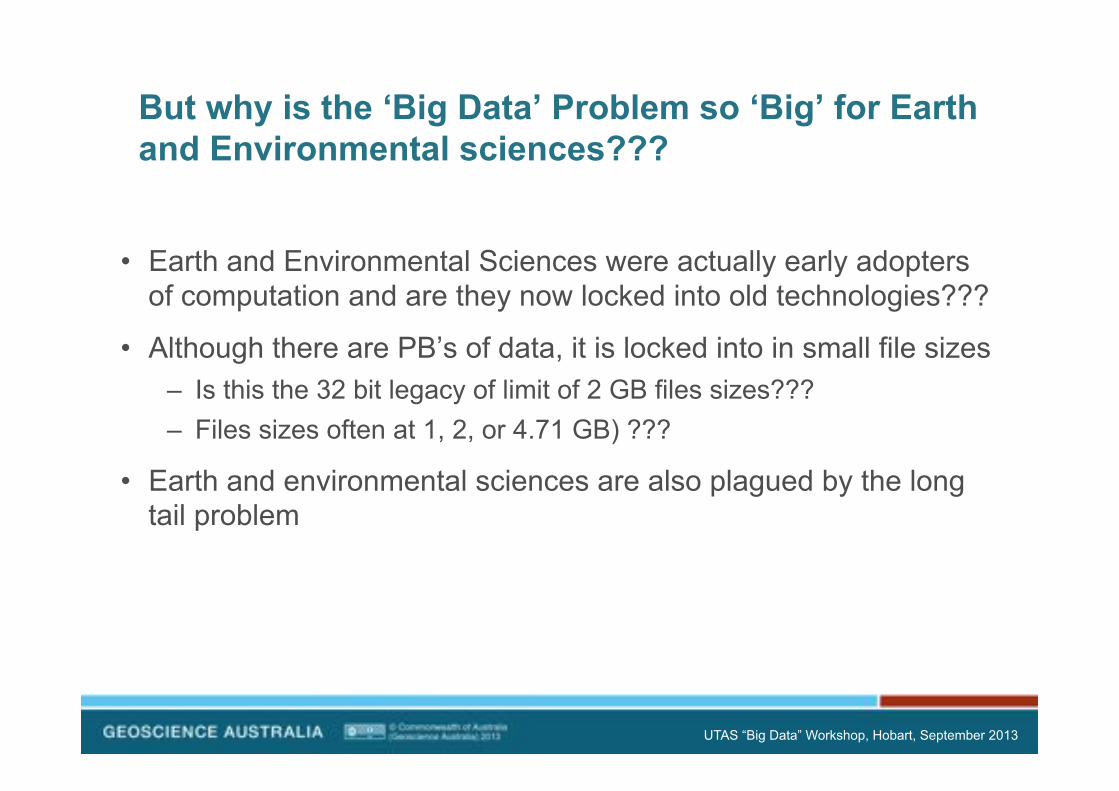
But why is the ‘Big Data’ Problem so ‘Big’ for Earth and Environmental sciences???
• Earth and Environmental Sciences were actually early adopters of computation and are they now locked into old technologies???
• Although there are PB’s of data, it is locked into in small file sizes – Is this the 32 bit legacy of limit of 2 GB files sizes??? – Files sizes often at 1, 2, or 4.71 GB) ???
• Earth and environmental sciences are also plagued by the long tail problem
UTAS “Big Data” Workshop, Hobart, September 2013

Environmental and Earth Sciences do have high proportions of Long Tail Data
Long Tail Characteristics
• More specialised • Low volume • On C drives • Hard to find • Heterogeneous • Collected by large
numbers of people • Citizen science • Etc • Etc
http://juliegood.wordpress.com/tag/long-tail/
The Long Tail: !Environmental and !Earth sciences
The Head: !Astronomy, Climate,!High Energy Physics, Genomics
UTAS “Big Data” Workshop, Hobart, September 2013
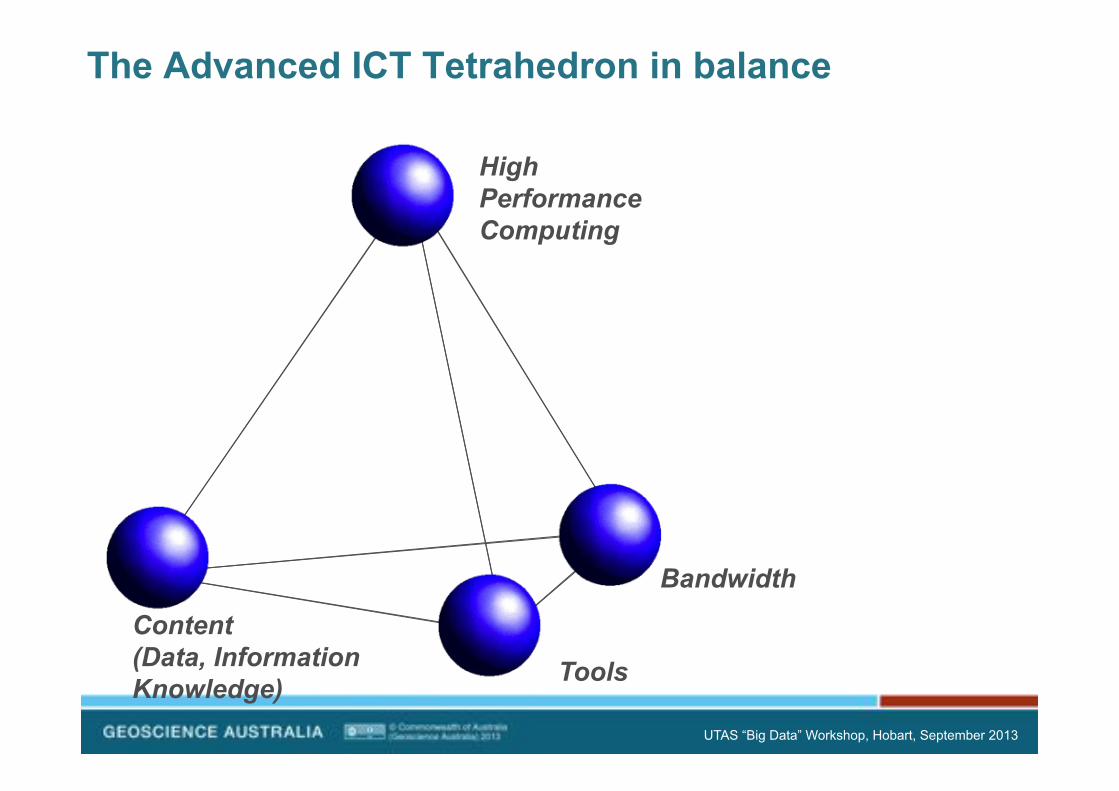
The Advanced ICT Tetrahedron in balance
Content (Data, Information Knowledge) Tools
Bandwidth
High Performance Computing
UTAS “Big Data” Workshop, Hobart, September 2013

Content: Data, Information, Knowledge Tools, Codes
Bandwidth
High Performance Computing
The Advanced ICT Tetrahedron in 2013
UTAS “Big Data” Workshop, Hobart, September 2013
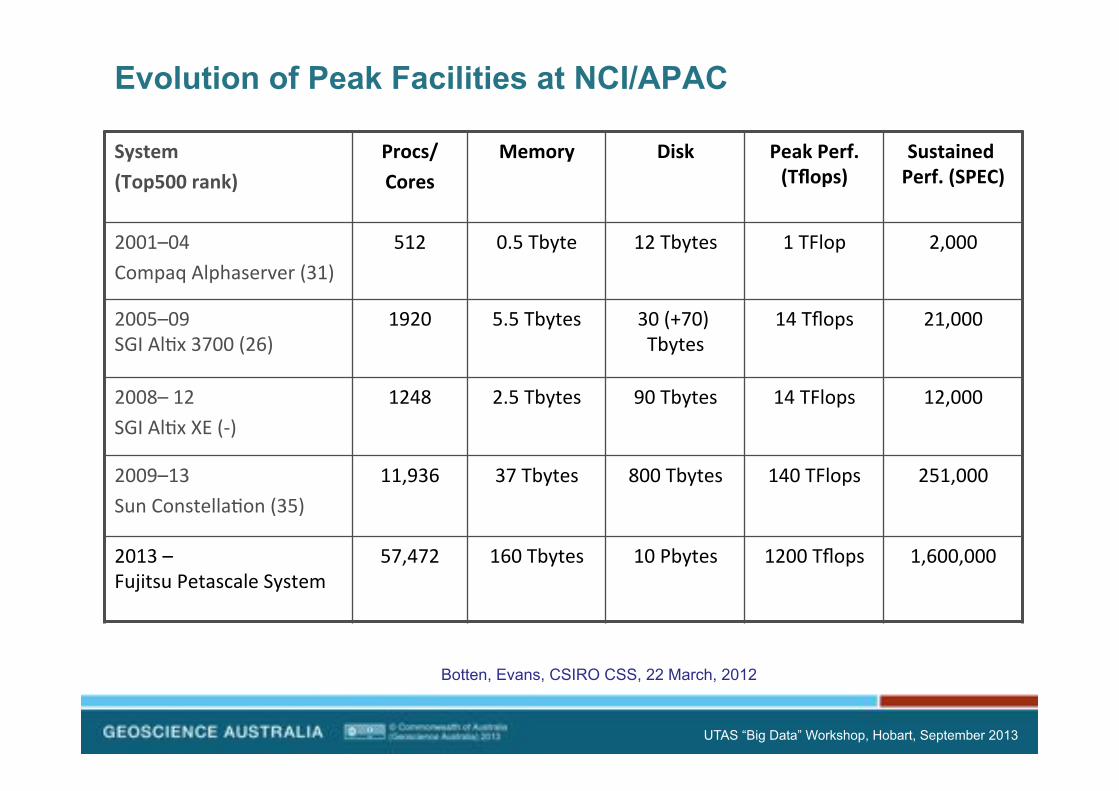
Evolution of Peak Facilities at NCI/APAC
System'(Top500'rank)'
Procs/'Cores'
Memory' Disk' Peak'Perf.'(Tflops)'
Sustained'Perf.'(SPEC)'
2001–04&Compaq&Alphaserver&(31)&&
512& 0.5&Tbyte& 12&Tbytes& 1&TFlop& 2,000&
2005–09&SGI&AlCx&3700&(26)&
1920& 5.5&Tbytes& 30&(+70)&Tbytes&
14&Tflops& 21,000&
2008–&12&SGI&AlCx&XE&(L)&
1248& 2.5&Tbytes& 90&Tbytes& 14&TFlops& 12,000&
2009–13&Sun&ConstellaCon&(35)&
11,936& 37&Tbytes& 800&Tbytes& 140&TFlops& 251,000&
2013&–&&Fujitsu&Petascale&System&
57,472& 160&Tbytes& 10&Pbytes& 1200&Tflops& 1,600,000&
Botten, Evans, CSIRO CSS, 22 March, 2012
UTAS “Big Data” Workshop, Hobart, September 2013
0
1000
2000
3000
4000
5000
6000
Q4 Q1 Q2 Q3 Q4 Q1 Q2 Q3 Q4 Q1 Q2 Q3 Q4
kSU
GA Share Request Usage2011 2012 2013
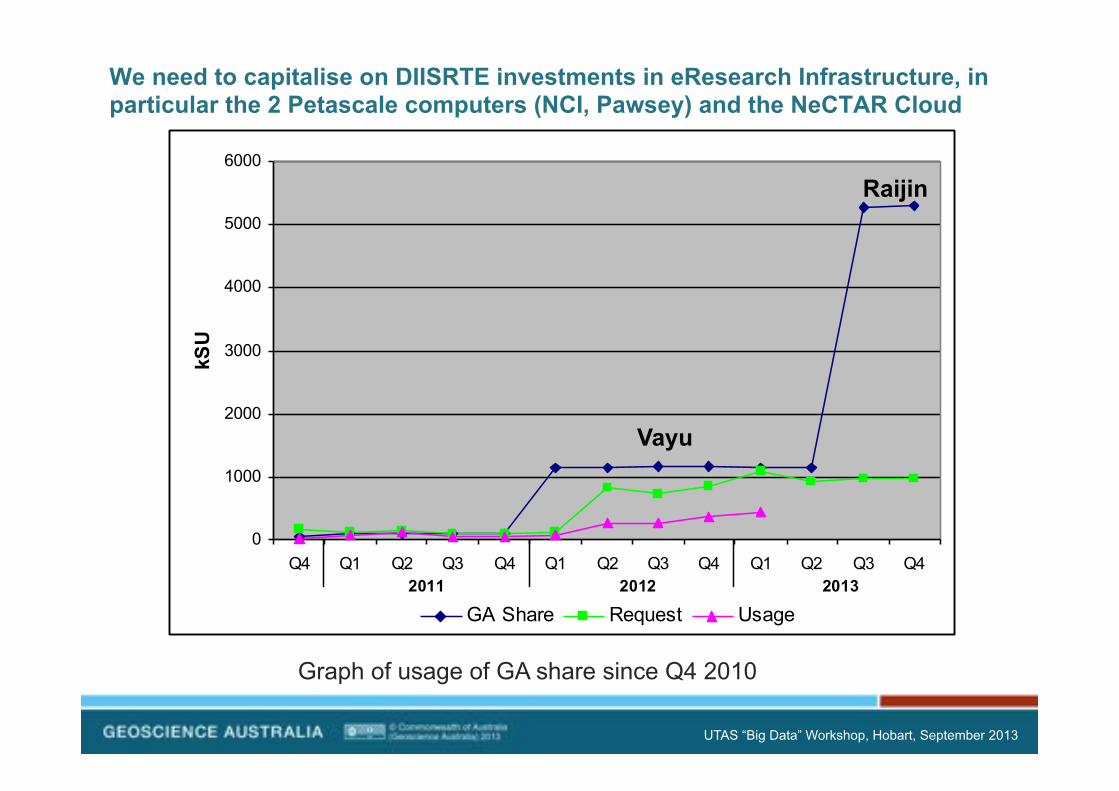
We need to capitalise on DIISRTE investments in eResearch Infrastructure, in particular the 2 Petascale computers (NCI, Pawsey) and the NeCTAR Cloud
Vayu
Raijin
Graph of usage of GA share since Q4 2010
UTAS “Big Data” Workshop, Hobart, September 2013

Australian HPC in Top 500: June 2013
Tier 1 !(Top 500)!
Tier 2
Tier 3 Local Machines and Clusters
Local Condor!Pools
Based on European Climate Computing Environments, Bryan Lawrence (http://home.badc.rl.ac.uk/lawrence/blog/2010/08/02 ) and Top 500 list November 2011 (http://www.top500.org)
Petascale:! >100,000 cores
Inte
rnal
Terascale:! >10,000 cores !!
Ext
ernal
GA usage!!
No 27: NCI (979 TFlops No 39: LS Vic (715 TFlops) !
No 289: CSIRO (133 TFlops) !No 320: NCI Vayu (126 TFlops) !No 460: Defence (102 Tflops)
Institutional Facilities
Grid,!Cloud
Local Machines and Clusters
Local Condor!Pools
Gigascale:! >1,000 cores !!
No 500 (96.62 TFLOPS)
Tier 0 !(Top 10) !
Megascale:! >100 cores
Desktop:!2 – 8 cores
No 10: 2.90 PFLOPS
No 1: 33.86 PFLOPS
No 27
UTAS “Big Data” Workshop, Hobart, September 2013

Given GA has 4 PB’s of data, what behavioural characteristics do camels and GA have in common?
The Camel Geoscience Australia https://5ab62d6b-a-e9757c5c-s-sites.googlegroups.com/a/clipartonline.net/camel-cartoon-images/home/Camel-Cartoon-Clipart_5.png?attachauth=ANoY7cr529zA7FYM8iwIbd5ifG7YJo_mJuKMYhuibIMYGBGxg1aJWn4wdpN39znJUOKvDbf2-NTpp9GKcRpsk-ePPm2rqQLrOwGp0KhxdcbVEJyTd5sDxKjPatb-6StgoAT6kQTDP3t32jjmjJnVZ42AOjX2R5ksGozw0p2-Wwl5iIxZSktqxXbc1aLg1Clu6jsl0Iz75fvtUvs8FZNW5fPODhbeg-_S_UJRlYwpr3AnTShEE1Y_h2r5Ec-aHRJ1kesURmDbo7MB&attredirects=0
UTAS “Big Data” Workshop, Hobart, September 2013
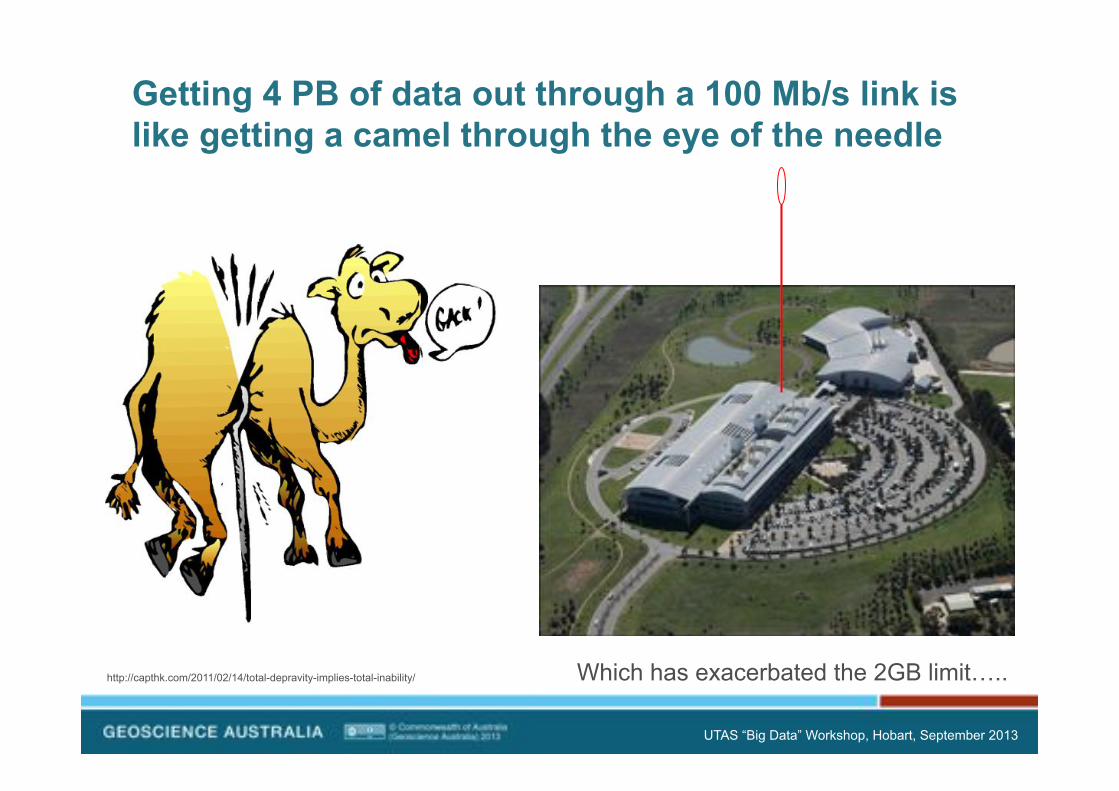
http://capthk.com/2011/02/14/total-depravity-implies-total-inability/
Getting 4 PB of data out through a 100 Mb/s link is like getting a camel through the eye of the needle
Which has exacerbated the 2GB limit…..
UTAS “Big Data” Workshop, Hobart, September 2013
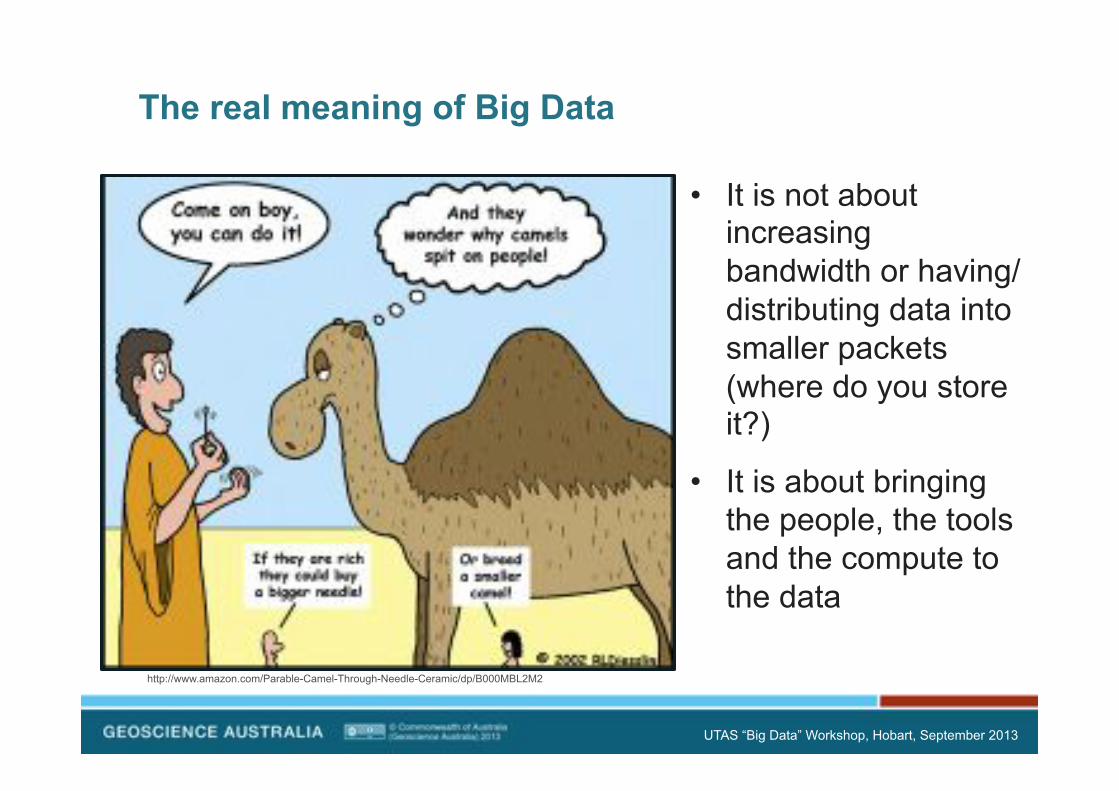
http://www.amazon.com/Parable-Camel-Through-Needle-Ceramic/dp/B000MBL2M2
The real meaning of Big Data
• It is not about increasing bandwidth or having/distributing data into smaller packets (where do you store it?)
• It is about bringing the people, the tools and the compute to the data
UTAS “Big Data” Workshop, Hobart, September 2013
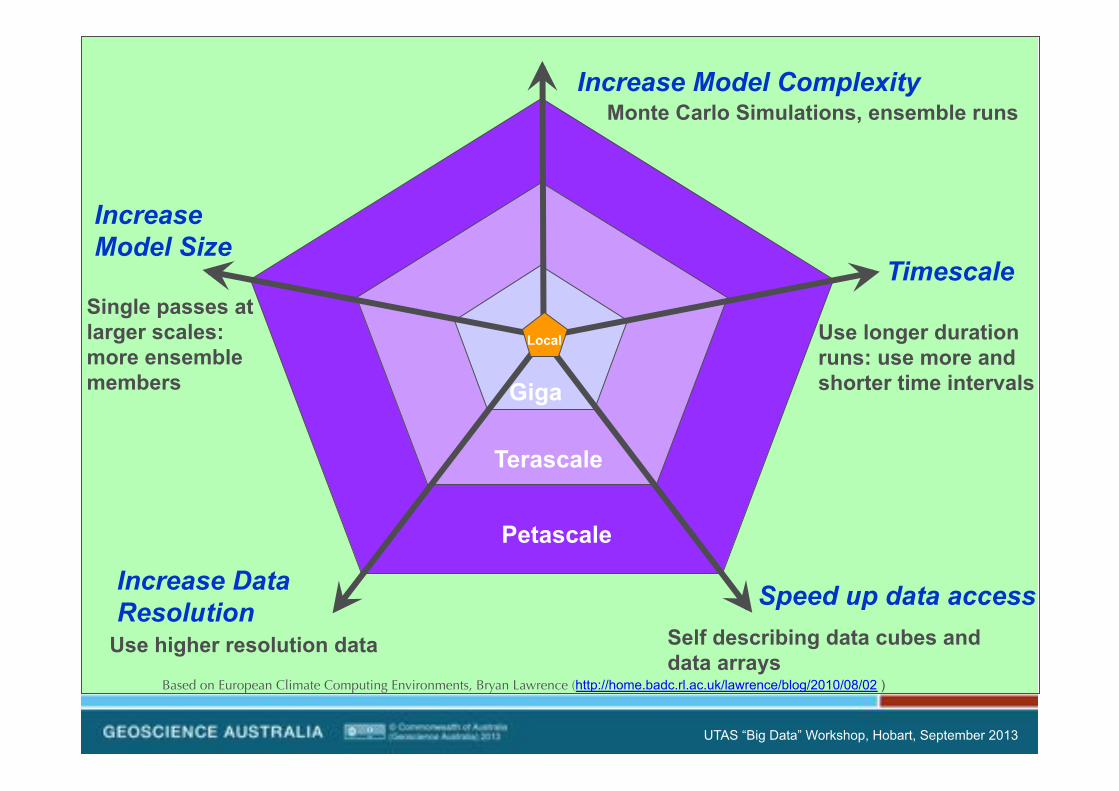
Local
Increase Model Complexity
Timescale
Speed up data access
Increase Data Resolution
Increase Model Size
Self describing data cubes and data arrays
Use higher resolution data
Monte Carlo Simulations, ensemble runs
Petascale
Terascale
Giga
Single passes at larger scales: more ensemble members
Use longer duration runs: use more and shorter time intervals
Based on European Climate Computing Environments, Bryan Lawrence (http://home.badc.rl.ac.uk/lawrence/blog/2010/08/02 )
UTAS “Big Data” Workshop, Hobart, September 2013

The data aggregation problem in climate
3rd assessment 2001
4th assessment 2007
5th assessment 2013
6th assessment 2020
Slide Courtesy of Andy Pitman!COE Climate System Science
UTAS “Big Data” Workshop, Hobart, September 2013
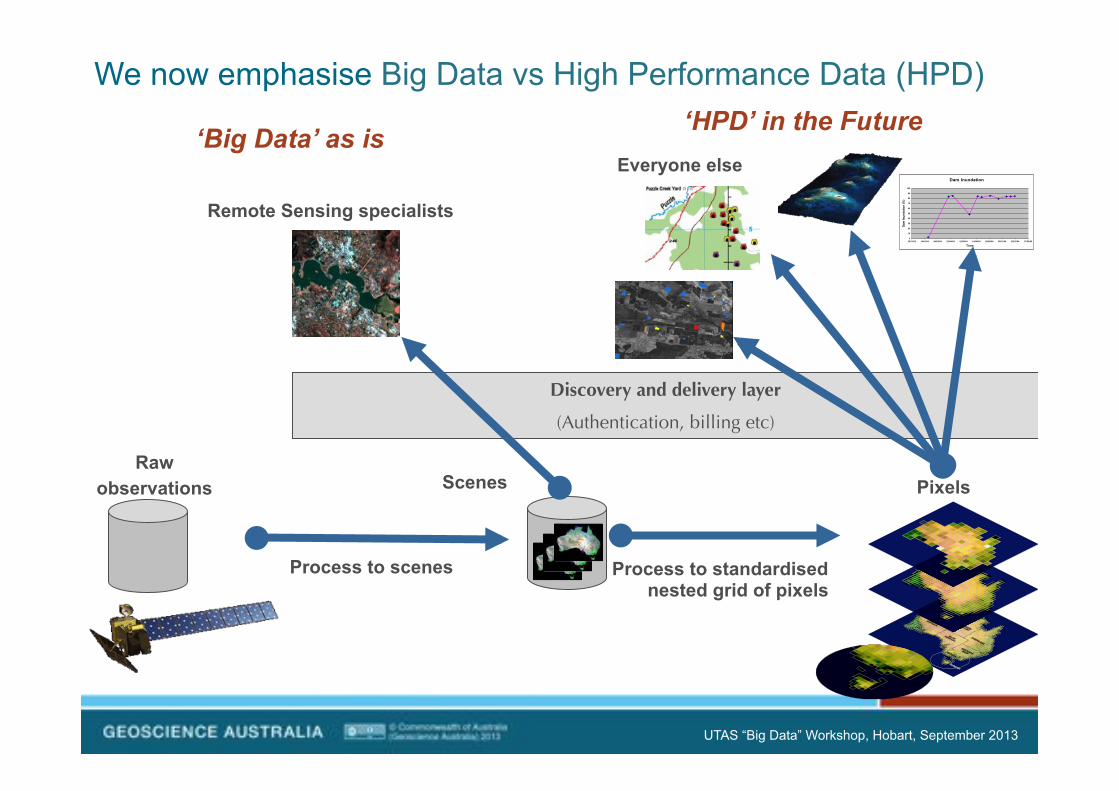
We now emphasise Big Data vs High Performance Data (HPD)
Raw observations
Dam Inundation
0
10
20
30
40
50
60
70
80
90
100
25/11/03 14/01/04 04/03/04 23/04/04 12/06/04 01/08/04 20/09/04 09/11/04 29/12/04 17/02/05
Time
Dam
Inun
datio
n (%
)
Everyone else
Process to scenes Process to standardised nested grid of pixels
Scenes Pixels
Discovery and delivery layer
(Authentication, billing etc)
Remote Sensing specialists
UTAS “Big Data” Workshop, Hobart, September 2013
‘Big Data’ as is ‘HPD’ in the Future
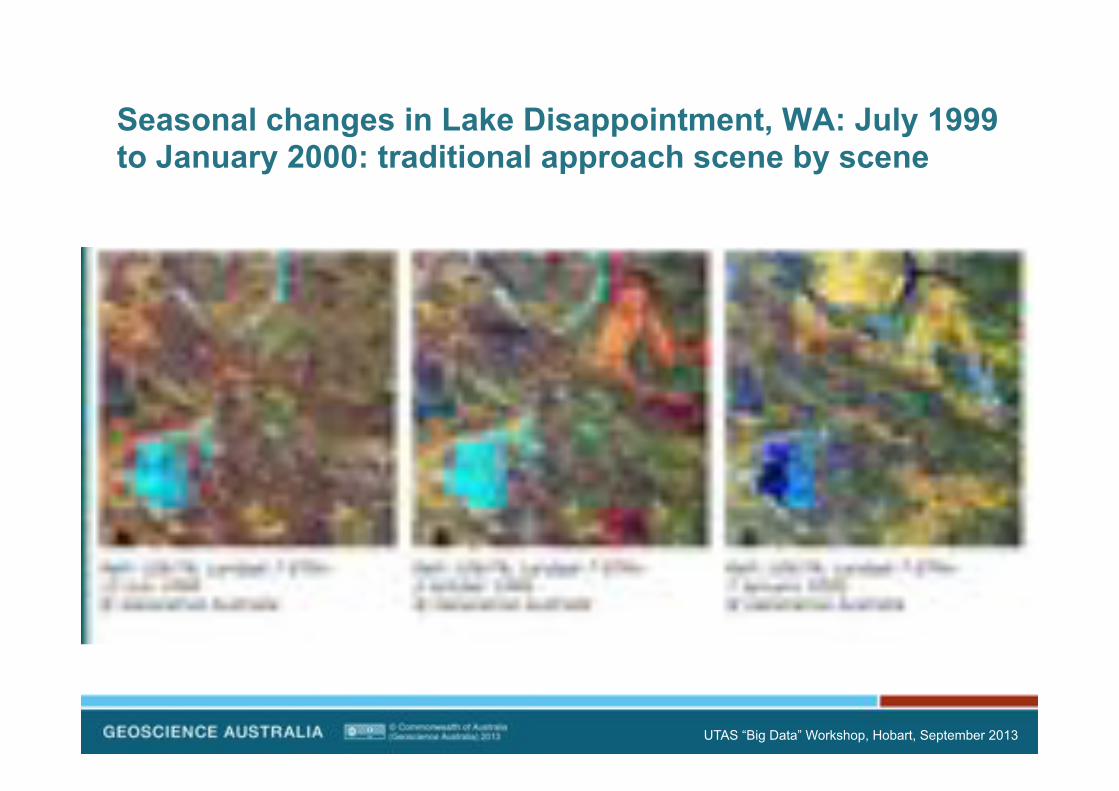
Seasonal changes in Lake Disappointment, WA: July 1999 to January 2000: traditional approach scene by scene
UTAS “Big Data” Workshop, Hobart, September 2013
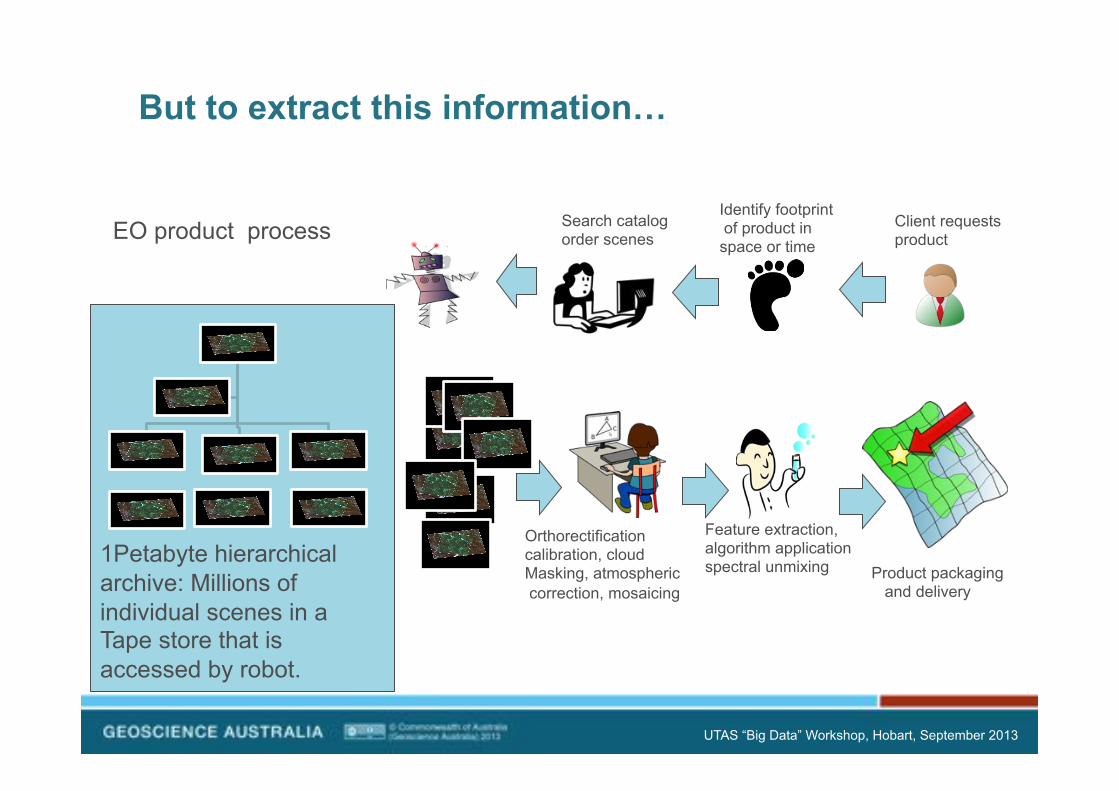
1Petabyte hierarchical archive: Millions of individual scenes in a Tape store that is accessed by robot.
Orthorectification calibration, cloud Masking, atmospheric correction, mosaicing
Feature extraction, algorithm application spectral unmixing Product packaging
and delivery
Identify footprint of product in space or time
Client requests product
Search catalog order scenes
EO product process
But to extract this information…
UTAS “Big Data” Workshop, Hobart, September 2013
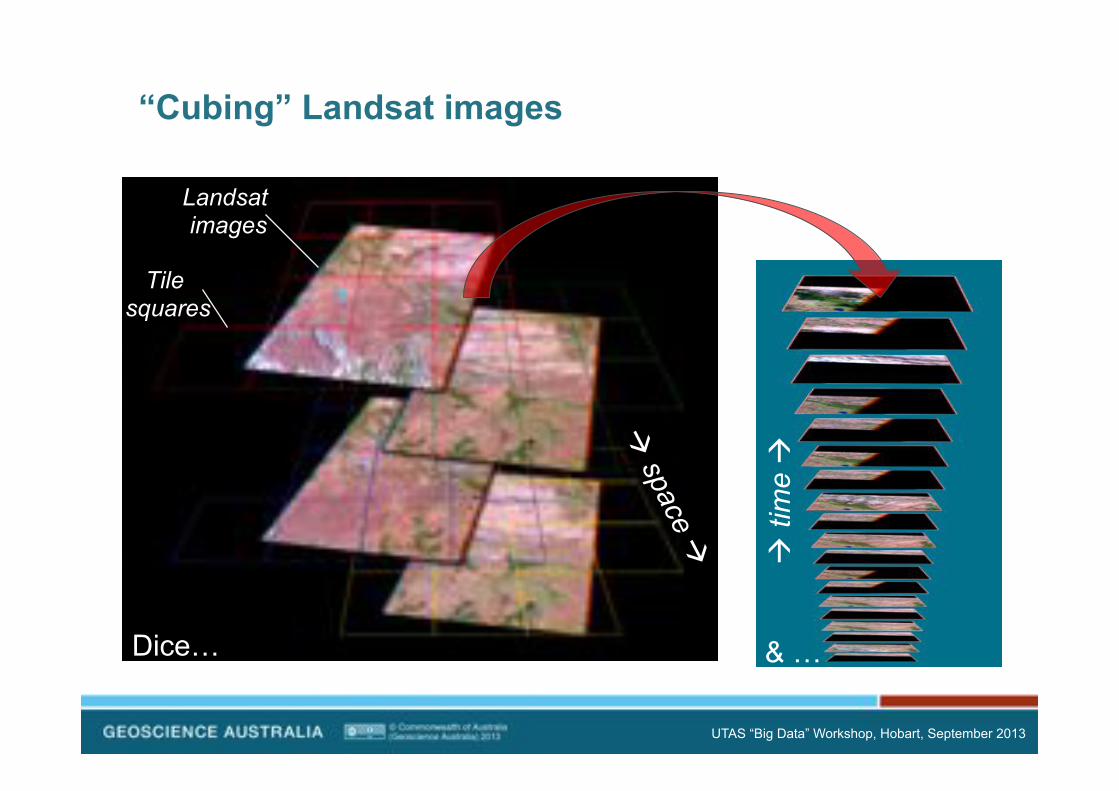
“Cubing” Landsat images
Dice… & …
! ti
me !
Landsat images
Tile squares
UTAS “Big Data” Workshop, Hobart, September 2013
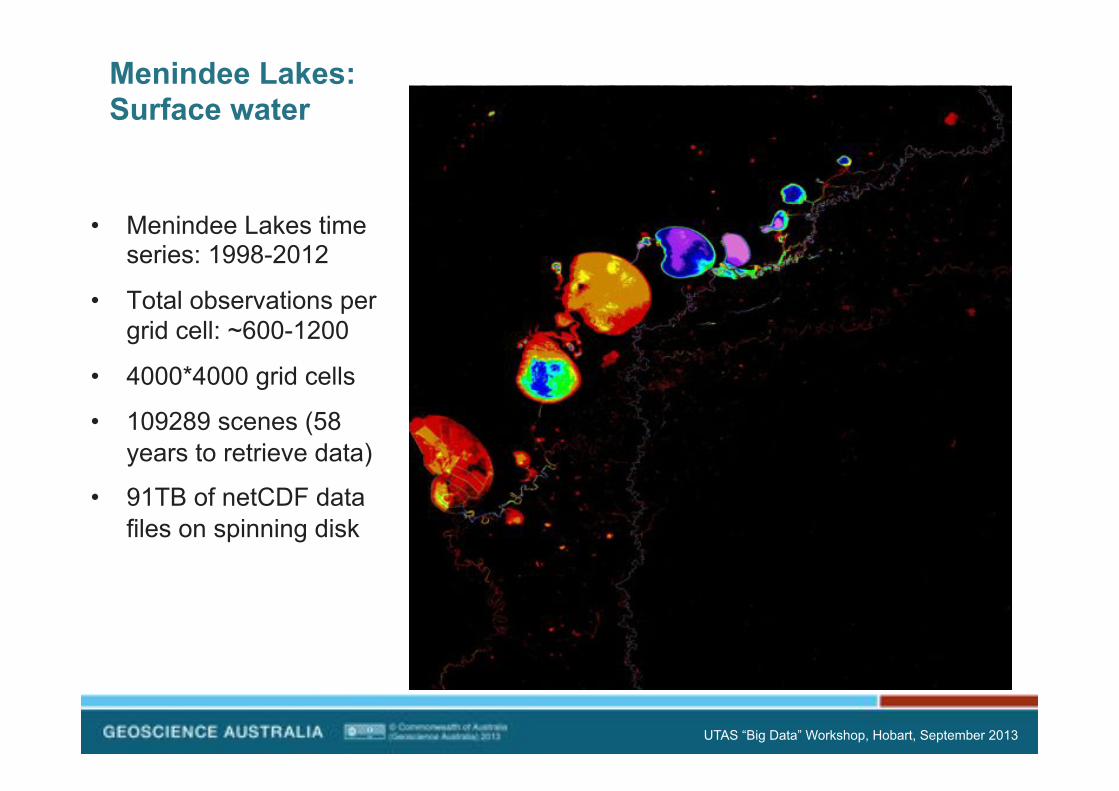
Menindee Lakes: Surface water
• Menindee Lakes time series: 1998-2012
• Total observations per grid cell: ~600-1200
• 4000*4000 grid cells
• 109289 scenes (58 years to retrieve data)
• 91TB of netCDF data files on spinning disk
UTAS “Big Data” Workshop, Hobart, September 2013

The Aster HPD Array: Facilitating Online Data Analysis
• Seamless coverage of 3500 scenes each 60km*60km
• Selected from an archive of 35,000 scenes
• Available at national and local scales on the AuScope portal
• 17 layers * 60 GB = 1.2 TB
UTAS “Big Data” Workshop, Hobart, September 2013
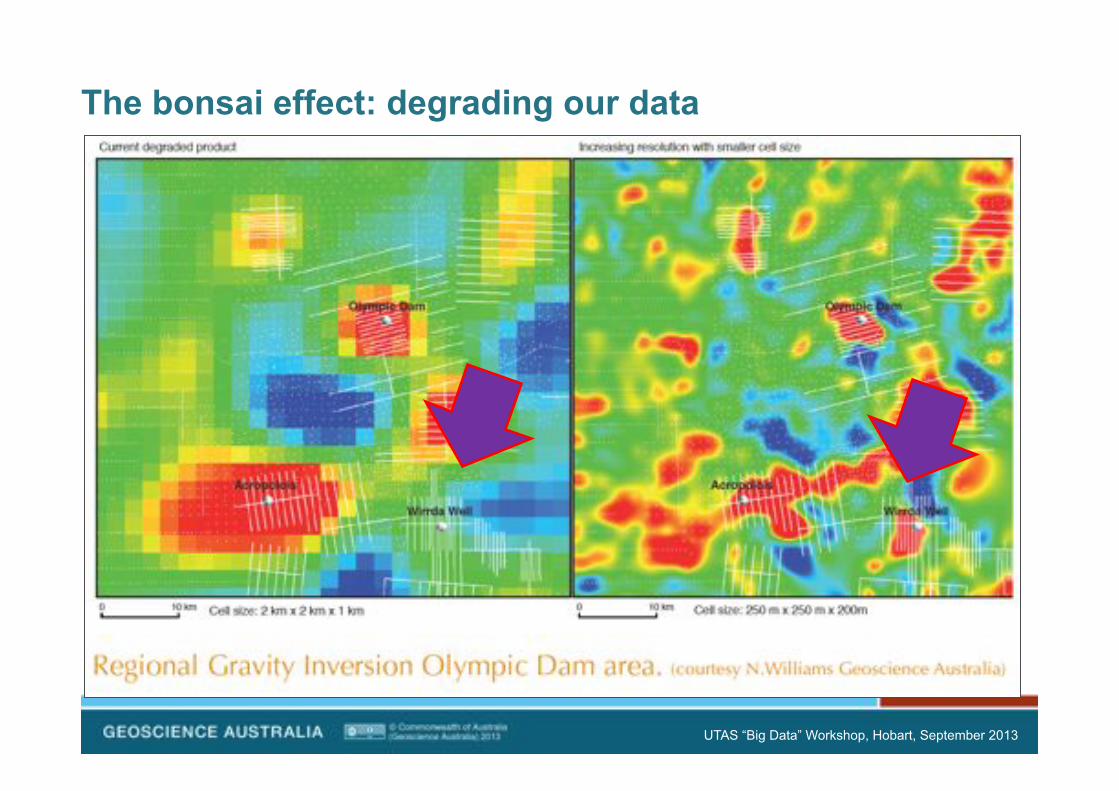
The bonsai effect: degrading our data
UTAS “Big Data” Workshop, Hobart, September 2013

We don’t degrade photographic images so why do we do this to our science?
UTAS “Big Data” Workshop, Hobart, September 2013

High Performance Point Data Sets
UTAS “Big Data” Workshop, Hobart, September 2013

Version Year Grid cell size
Data file size
3 1999 400m 0.49 GB
4 2004 250m 0.94 GB
5 2010 80m 9.73 GB
6 2013 (?) <80m 3 TB
2004
1999
2010 (Slide courtesy of Murray Richardson )
Resolution impacts on file size: eg Magnetics
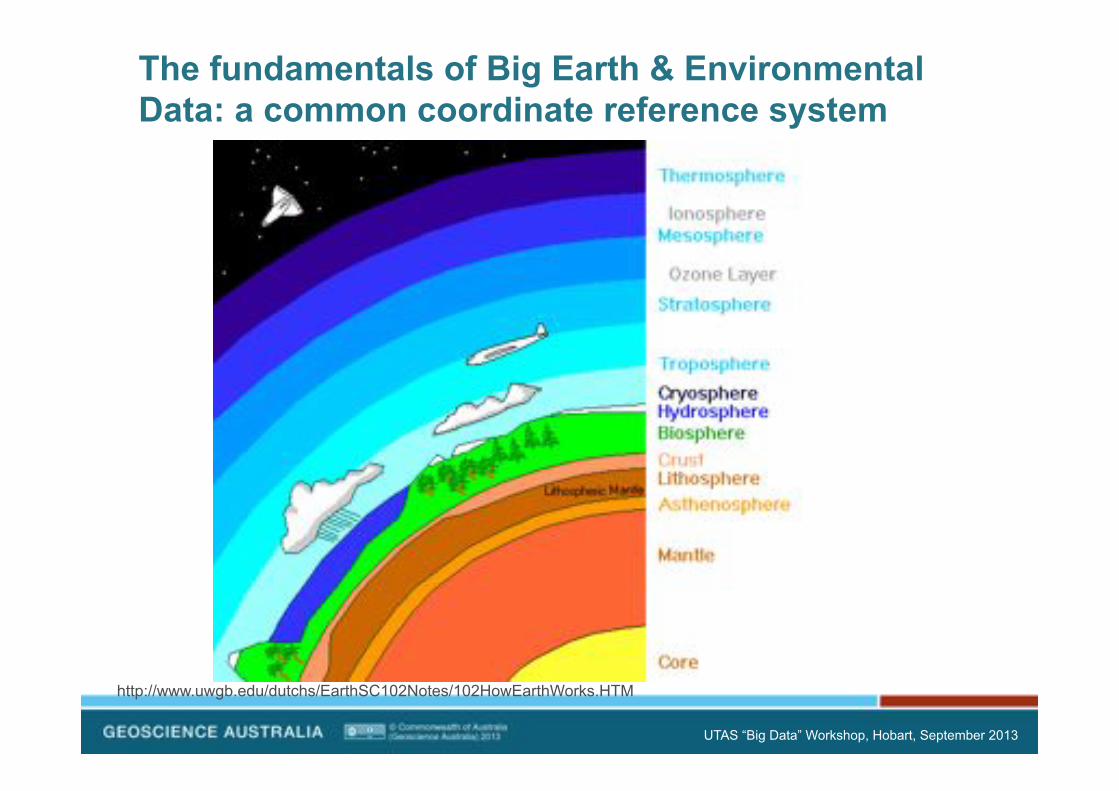
http://www.uwgb.edu/dutchs/EarthSC102Notes/102HowEarthWorks.HTM
The fundamentals of Big Earth & Environmental Data: a common coordinate reference system
UTAS “Big Data” Workshop, Hobart, September 2013
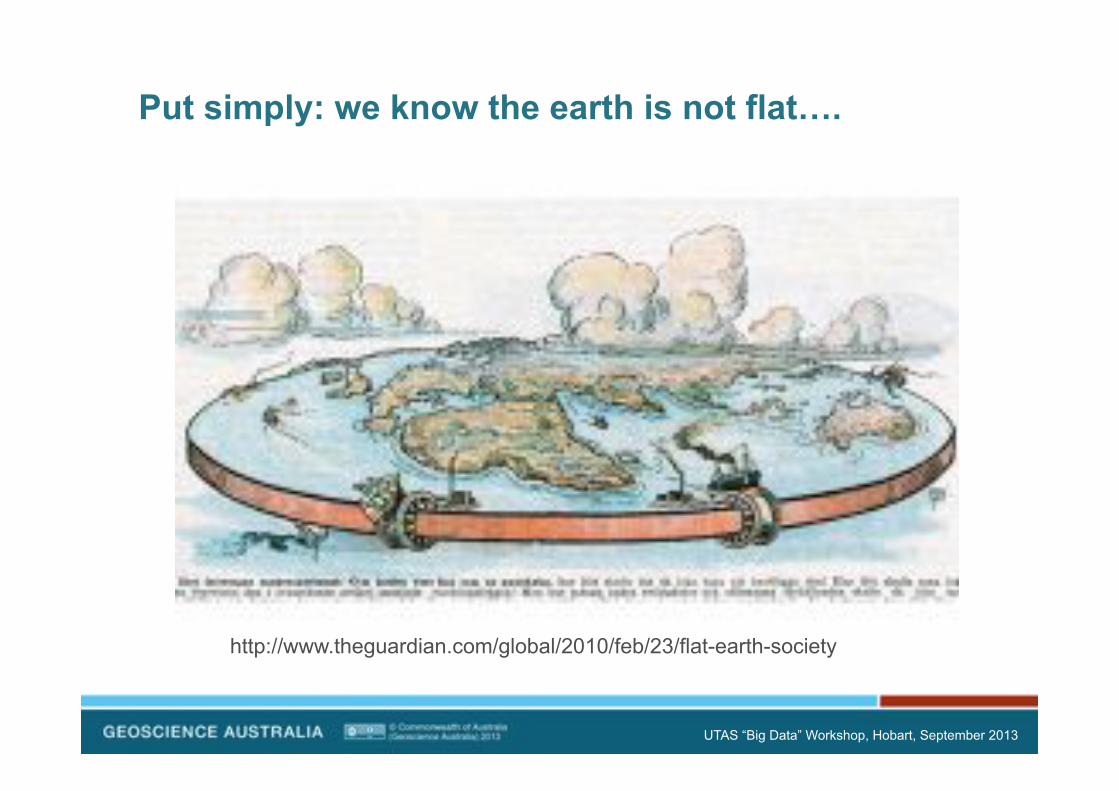
http://www.theguardian.com/global/2010/feb/23/flat-earth-society
Put simply: we know the earth is not flat….
UTAS “Big Data” Workshop, Hobart, September 2013
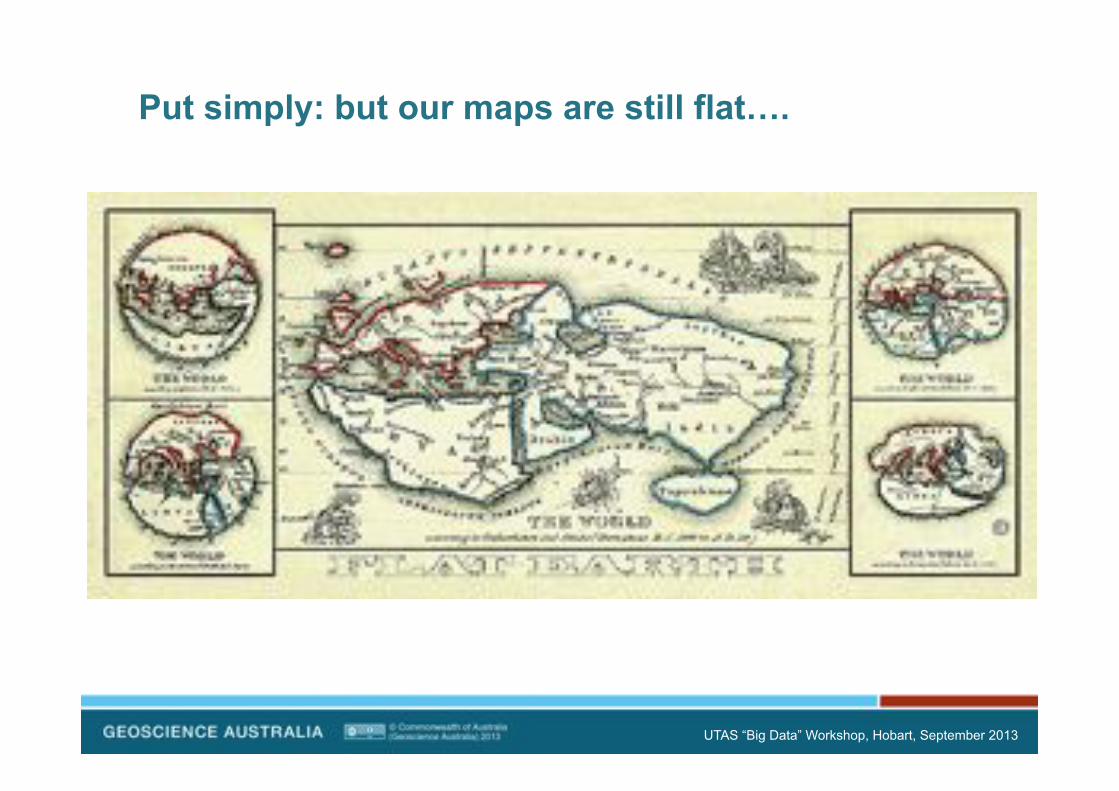
Put simply: but our maps are still flat….
UTAS “Big Data” Workshop, Hobart, September 2013
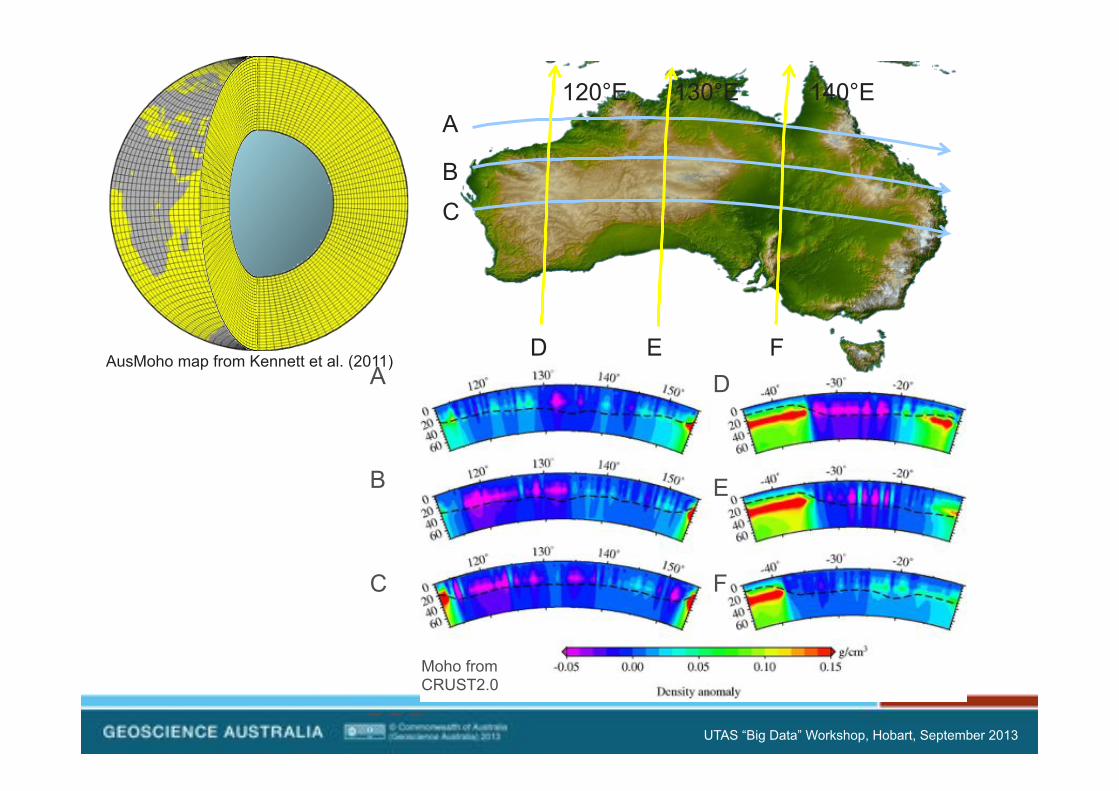
A
B
C
D
E
F
A
B
C
D E F
20°S
25°S
30°S
120°E 130°E 140°E
Moho from CRUST2.0
AusMoho map from Kennett et al. (2011)
UTAS “Big Data” Workshop, Hobart, September 2013

rHEALPix: A discrete global grid system
• HEALPix = Hierarchical Equal Area isoLatitudinal Pixelisation of a sphere
• rHEALPix = Hierarchical Equal Area isoLatitudinal Pixelisation on an ellipsoid of revolution
UTAS “Big Data” Workshop, Hobart, September 2013
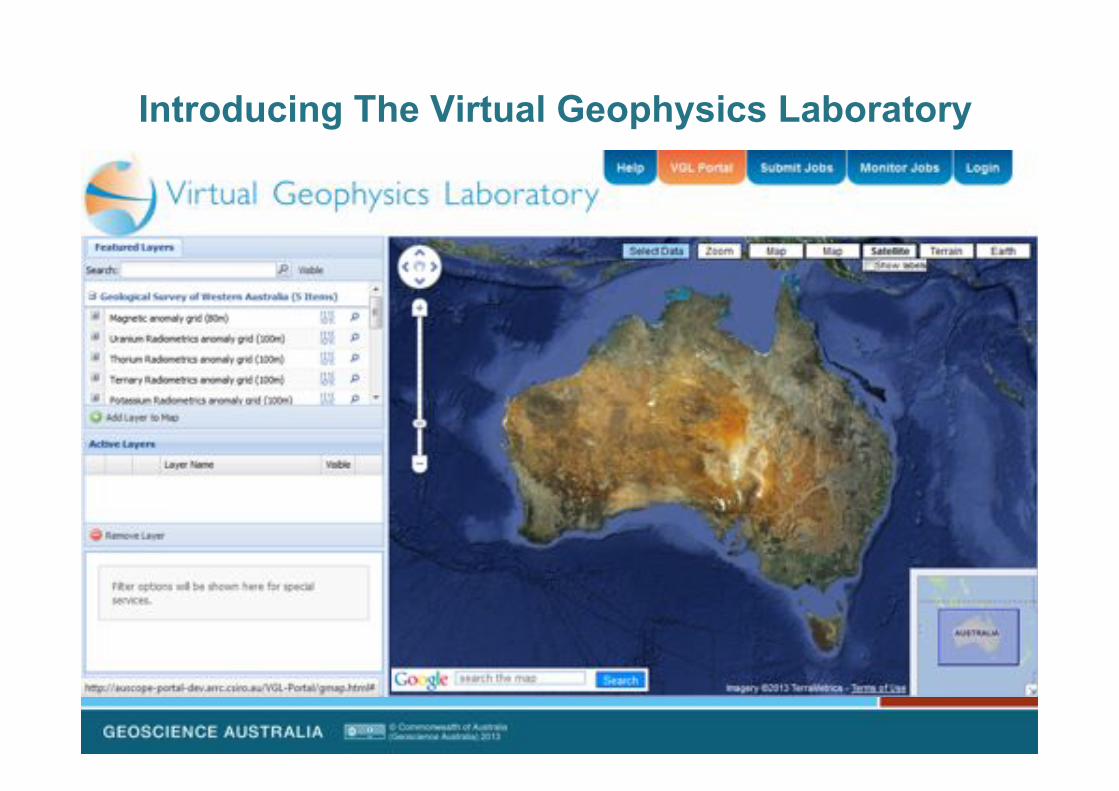
Introducing The Virtual Geophysics Laboratory
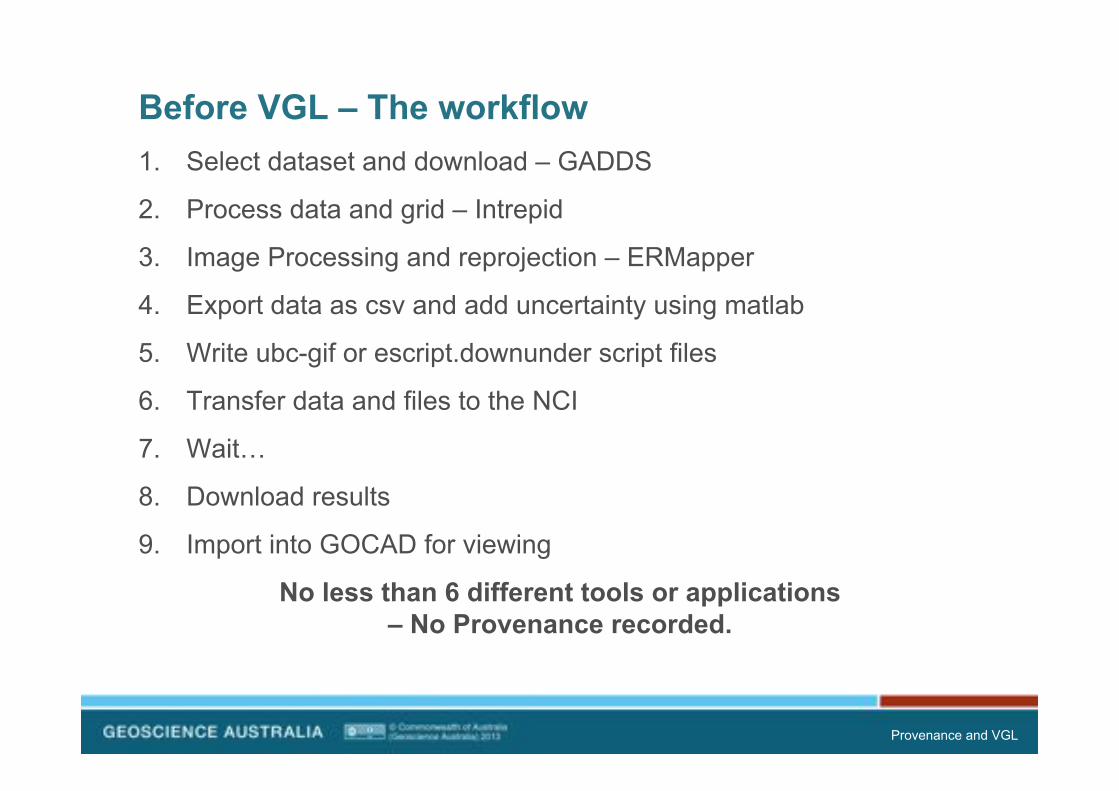
Before VGL – The workflow 1. Select dataset and download – GADDS
2. Process data and grid – Intrepid
3. Image Processing and reprojection – ERMapper
4. Export data as csv and add uncertainty using matlab
5. Write ubc-gif or escript.downunder script files
6. Transfer data and files to the NCI
7. Wait…
8. Download results
9. Import into GOCAD for viewing
No less than 6 different tools or applications – No Provenance recorded.
Provenance and VGL

The Computational Science Workflow
Data + Methods + Resources
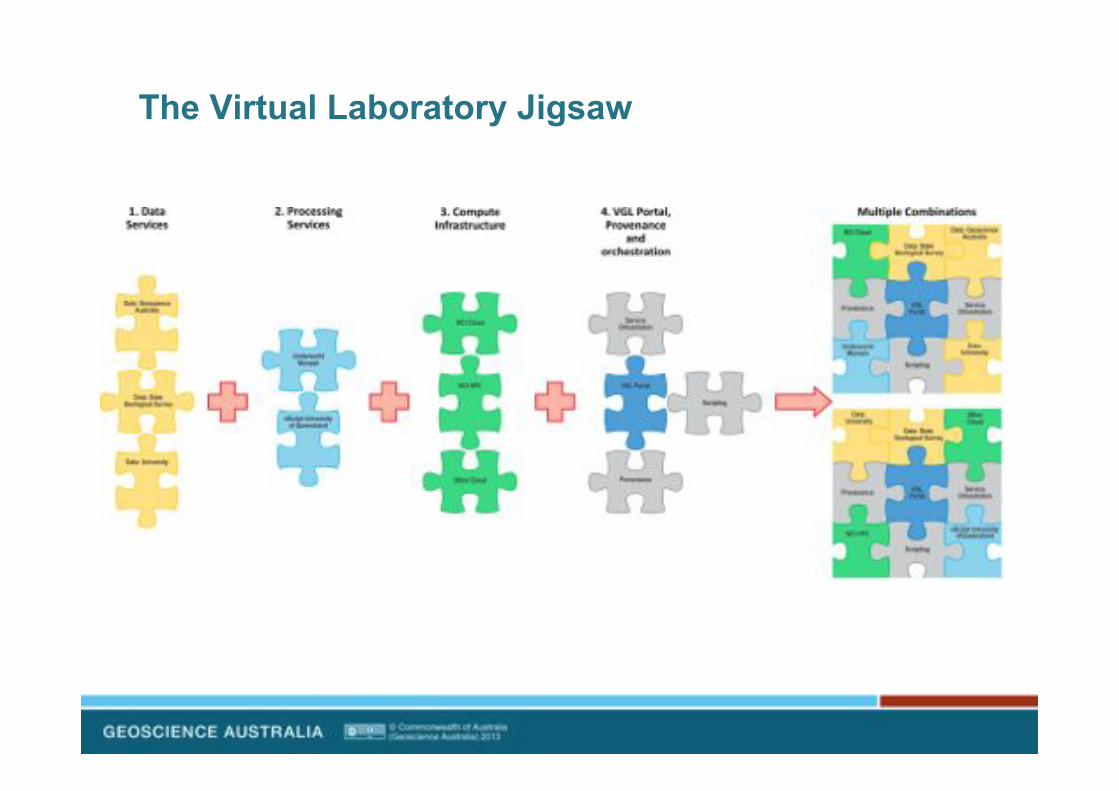
The Virtual Laboratory Jigsaw

Data discovery
Layers discovered via remote registries
Layers consist of numerous remote data services
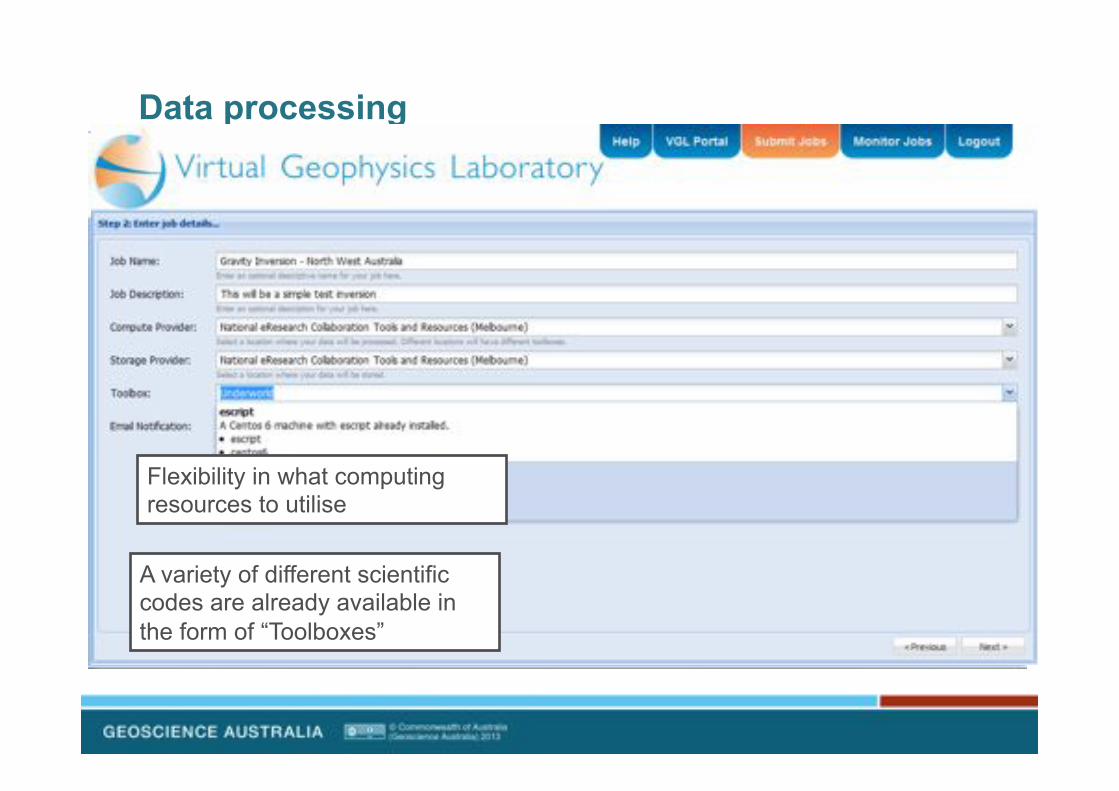
Data processing
A variety of different scientific codes are already available in the form of “Toolboxes”
Flexibility in what computing resources to utilise

Data processing
Further input files can be uploaded.
Input files are passed directly into the cloud

Data processing
The steps so far have been building an environment to run a processing script
...or build from existing templates
Either write your own...

Managing results - provenance
PresentaCon&Ctle&&|&&Presenter&name&
All of a job’s outputs are also accessible
Each job has a lifecycle that can be managed
A job’s console log can be inspected

Managing results - provenance
Successful jobs can have their entire process captured in a ISO 19115 ‘provenance record’
Each provenance record tracks all inputs, outputs, processing scripts and other metadata.... Spatial bounds...
Input/output data...

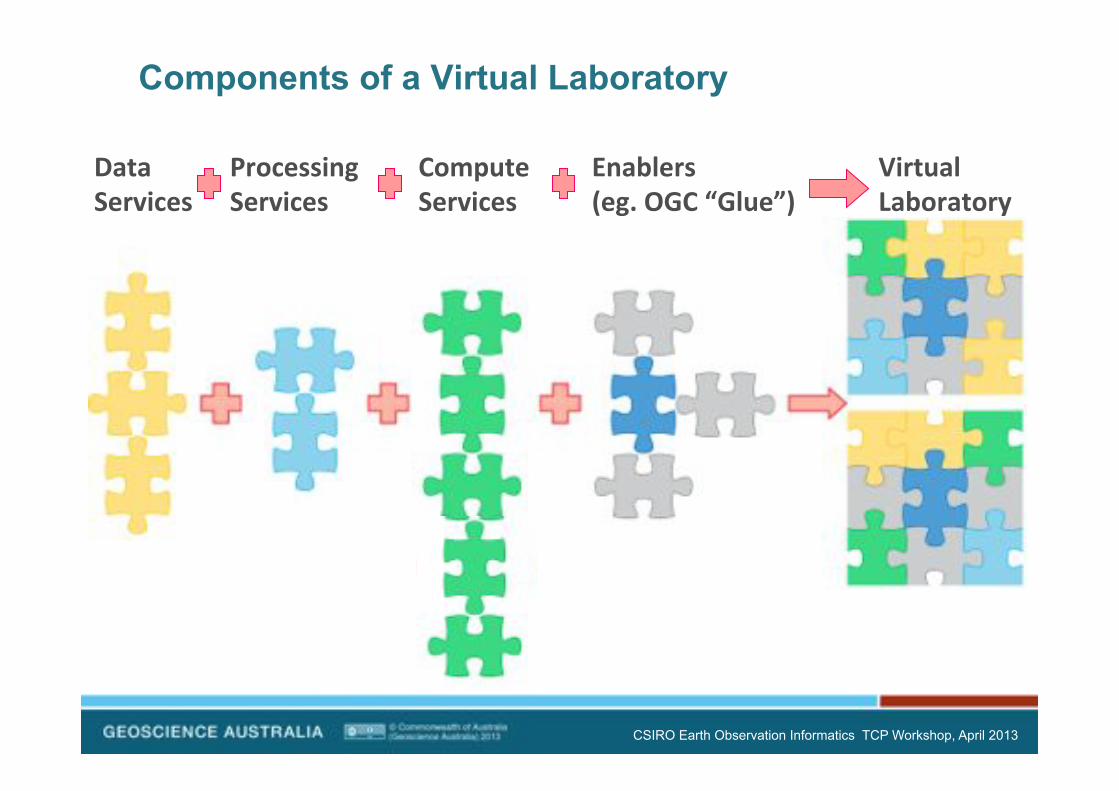
Components of a Virtual Laboratory
CSIRO Earth Observation Informatics TCP Workshop, April 2013
Data'Services'
Processing'Services'
Compute'Services'
Enablers'(eg.'OGC'“Glue”)'
Virtual'Laboratory'
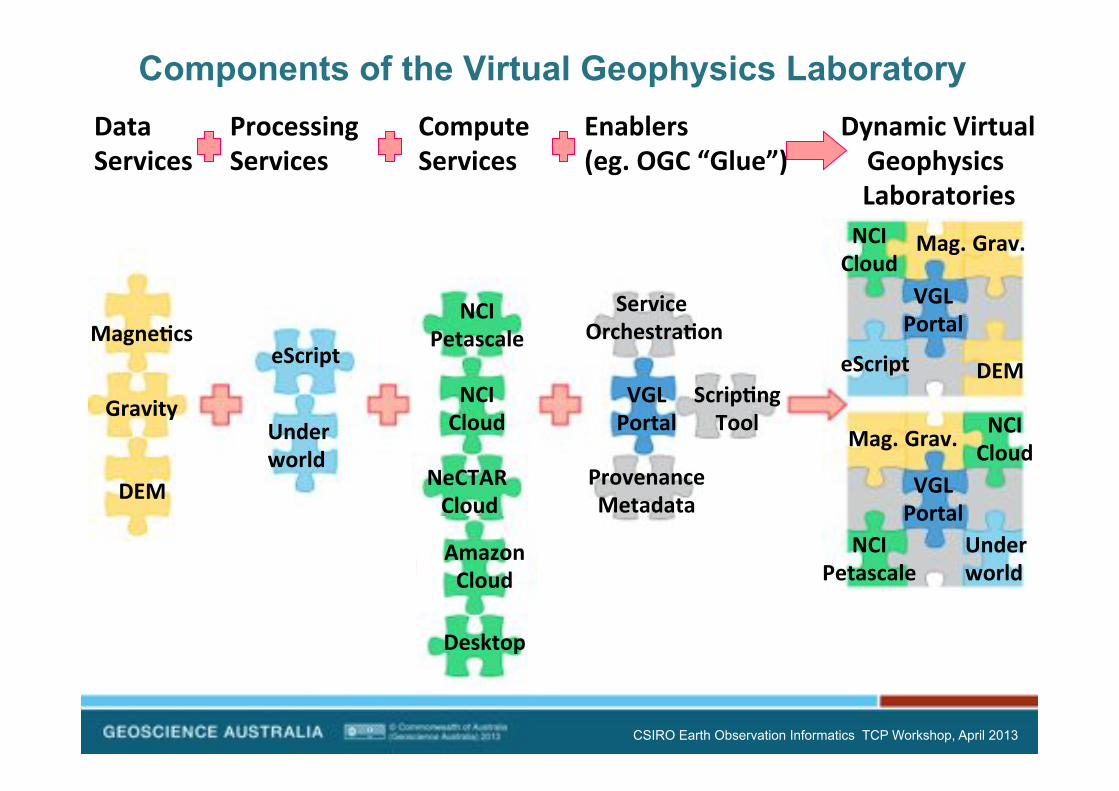
Components of the Virtual Geophysics Laboratory
CSIRO Earth Observation Informatics TCP Workshop, April 2013
Data'Services'
Processing'Services'
Compute'Services'
Dynamic'Virtual'Geophysics'Laboratories'
MagneKcs'
Gravity'
DEM'
eScript'
Underworld'
NCI'Petascale'
NCI'Cloud'
NeCTAR'Cloud'
Amazon'Cloud'
Desktop'
Service''OrchestraKon'
VGL'Portal'
Provenance'Metadata'
ScripKng'Tool'
eScript'
Mag.'Grav.'NCI'Cloud'
VGL'Portal'
VGL'Portal'
DEM'
Mag.'Grav.'
NCI'Petascale'
NCI'Cloud'
Underworld'
Enablers'(eg.'OGC'“Glue”)'
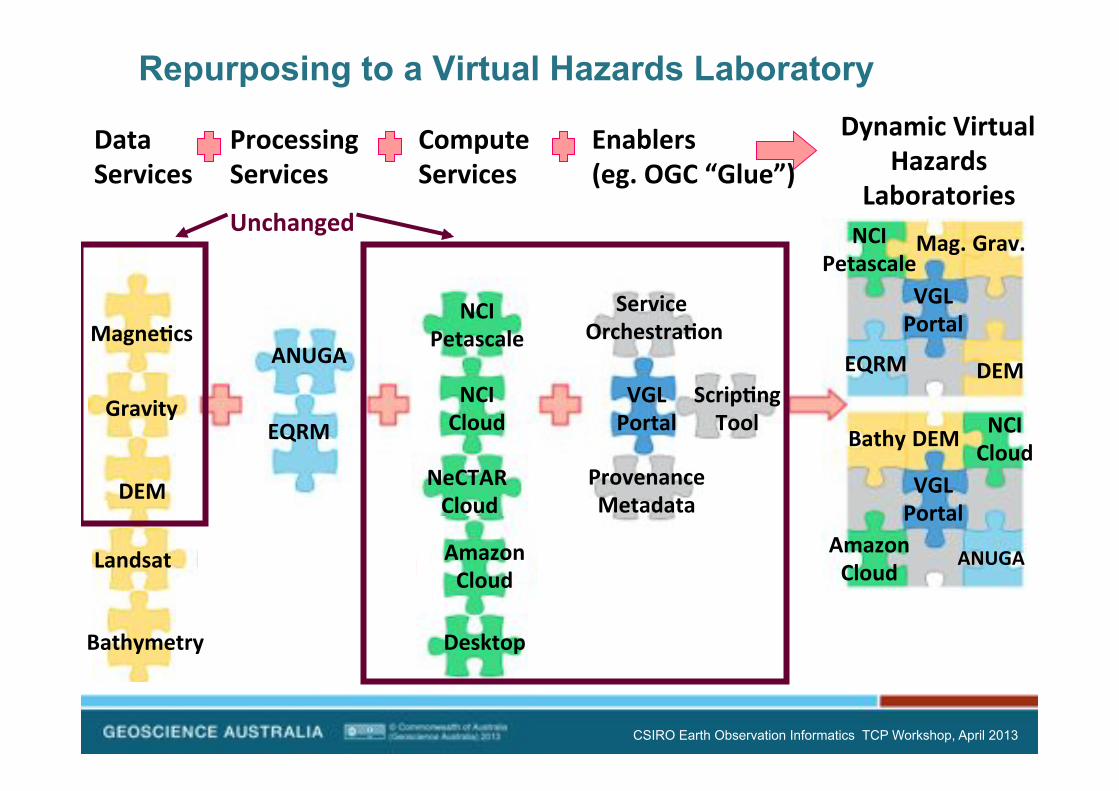
Repurposing to a Virtual Hazards Laboratory
CSIRO Earth Observation Informatics TCP Workshop, April 2013
Data'Services'
Processing'Services'
Compute'Services'
Dynamic'Virtual'Hazards'
Laboratories'
MagneKcs'
Gravity'
DEM'
ANUGA'
EQRM'
NCI'Petascale'
NCI'Cloud'
NeCTAR'Cloud'
Amazon'Cloud'
Desktop'
Service''OrchestraKon'
VGL'Portal'
Provenance'Metadata'
ScripKng'Tool'
ANUGA'
Mag.'Grav.'NCI'Petascale'
VGL'Portal'
VGL'Portal'
DEM'
Bathy'DEM'
Amazon'Cloud'
NCI'Cloud'
Landsat'
Bathymetry'
EQRM'
Unchanged'
Enablers'(eg.'OGC'“Glue”)'
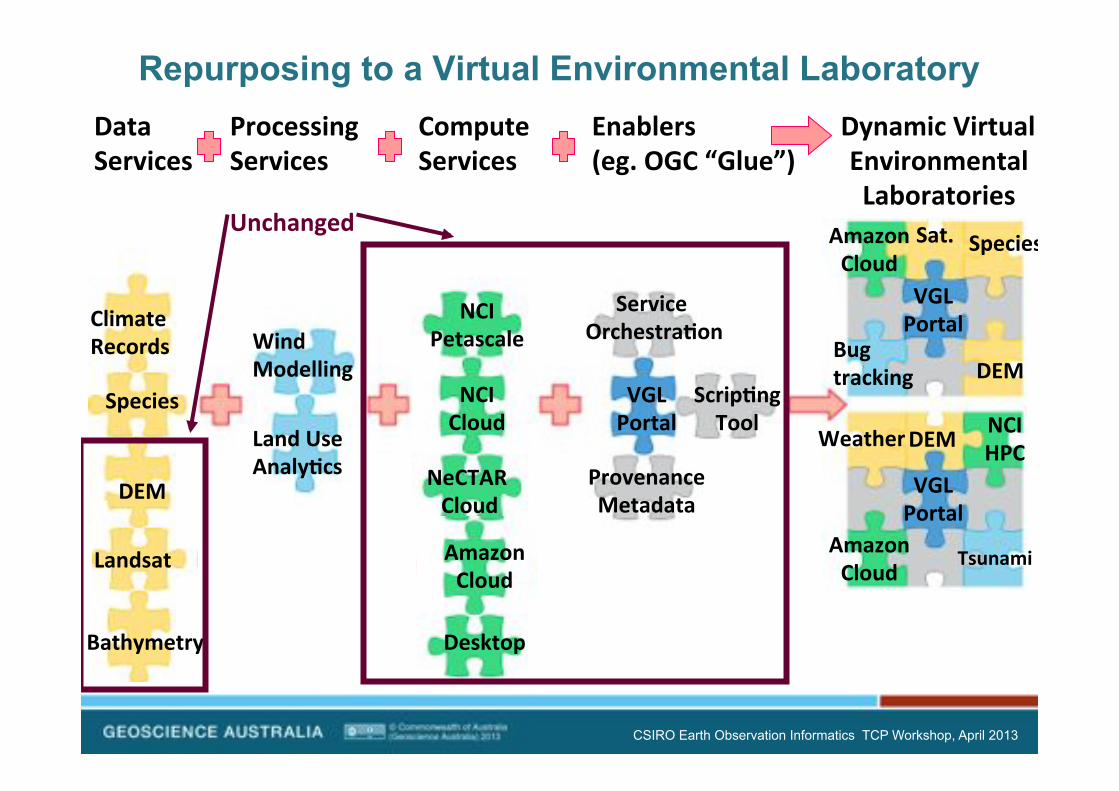
Repurposing to a Virtual Environmental Laboratory
CSIRO Earth Observation Informatics TCP Workshop, April 2013
Data'Services'
Processing'Services'
Compute'Services'
Dynamic'Virtual'Environmental'Laboratories'
Climate'Records'
Species'
DEM'
Wind'Modelling'
Land'Use'AnalyKcs'
NCI'Petascale'
NCI'Cloud'
NeCTAR'Cloud'
Amazon'Cloud'
Desktop'
Service''OrchestraKon'
VGL'Portal'
Provenance'Metadata'
ScripKng'Tool'
Tsunami'
Sat.' Species'Amazon'Cloud'
VGL'Portal'
VGL'Portal'
DEM'
Weather'DEM'
Amazon'Cloud'
NCI'HPC'
Landsat'
Bathymetry'
Bug'tracking'
Unchanged'
Enablers'(eg.'OGC'“Glue”)'

Phone: +61 2 6249 9489 Web: www.ga.gov.au Email: [email protected] Address: Cnr Jerrabomberra Avenue and Hindmarsh Drive, Symonston ACT 2609 Postal Address: GPO Box 378, Canberra ACT 2601
Any Questions?
http://www.dailymail.co.uk/news/article-2260544/How-camel-eye-needle-Artists-amazing-miniature-creations.html