biomass chp
TRANSCRIPT
8/11/2019 Biomass Chp
http://slidepdf.com/reader/full/biomass-chp 1/22
BIOMASS CHP
Vienna, January 2014
Student's name ID
Lovro Foretic (ERASMUS student) 1328301
Josipa Ljubicic(ERASMUS student)
1328302Marin Galic (ERASMUS student) 1328305

8/11/2019 Biomass Chp
http://slidepdf.com/reader/full/biomass-chp 2/22
2
1. Homework (1-A): Biomass CHP
1.1. Problem
• Carry out a rough assessment of the economic feasibility of biomass CHP including
sensitivity analysis and identification of crucial parameters and assumptions
• Calculate net present value taking into account investment costs, O&M costs, fuel
costs, heat revenues, electricity revenues
• Collect required input data from the literature, internet or make reasonable
assumptions (to be properly documented!); document in particular biomass prices and
underlying assumptions.
Calculate NPV, taking into account:
• Investment costs,
• O&M (e.g. as a 3% share of Investment costs),
•
Fuel costs (taking into account biomass price scenario, full load hours and capacity
of the plant),
•
Heat revenues (taking into account the thermal efficiency and heat price
development),
• Electricity revenues (taking into account the electric efficiency and feed-in tariffs),
And:
• Discuss the results
• Add sensitivity analyses regarding interest rate, investment costs, biomass fuel
prices, heat revenues, etc.,
• Discuss uncertainties and practical barriers in particular, regarding biomass
availability and heat revenues.

8/11/2019 Biomass Chp
http://slidepdf.com/reader/full/biomass-chp 3/22
3
1.2. Solution (Case 1)
In the February 2012. one Croatian company named Lika Energo Eko decided to open
new CHP power plant. The capacity of this power plant should be 5 MW and the fuel for
production of electricity and thermal energy should be pellets. Building this power plant,
company Lika Energo Eko decided to build a factory for pellet production too. The price of
whole project was determinate to 9 870 000 € and it was financed from the Republic of
Croatia [2].
Because of the lack of information, we assume that the electrical efficiency of this
power plant is 36% and that thermal efficiency is 44%. Total efficiency of this CHP power
plant is 80% [3]. Building a pellet factory right next to the CHP power plant, there is no need
to buy any fuel for energy production. Also, we assume that there are no significant costs in
fuel transport. According to [4] we also assume that production of fuel in this case is 0,10
€/kg what presents our fuel costs. O&M costs are 3% of total investment costs. All
information and assessments about this CHP power plant are given in the table below.
Table 1. Information and assessments of CHP power plant
Information and assessments of CHP power
plant
Power (P) 5 MW
fuel costs (pf ) 0,10 €/kg
full-load hours (t) 7 500 h
electrical efficiency (ƞel.) 36%
thermal efficiency (ƞth.) 44%
investment costs (I) 9 870 000 €
O&M costs (IO&M) 296 100 €
life time 20 years
feed-in tariff (pel)1 0,16 €/kWh
price of thermal en. (pth) 0,053 €/kWh
1 Price of electrical energy is determinate by Croatian law of Renewable Energy Sources
2 Price of thermal energy is determinate by Croatian law of Renewable Energy Sources
8/11/2019 Biomass Chp
http://slidepdf.com/reader/full/biomass-chp 4/22
4
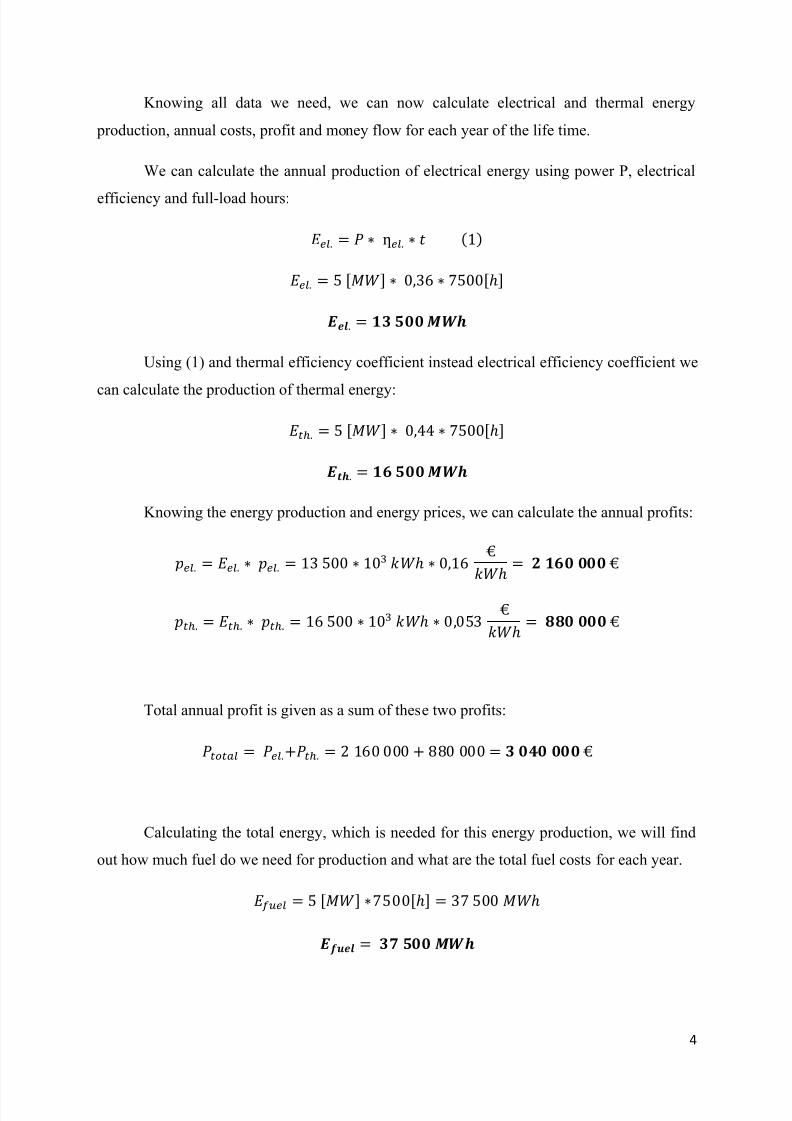
Knowing all data we need, we can now calculate electrical and thermal energy
production, annual costs, profit and money flow for each year of the life time.
We can calculate the annual production of electrical energy using power P, electrical
efficiency and full-load hours:
()
[] []
Using (1) and thermal efficiency coefficient instead electrical efficiency coefficient we
can calculate the production of thermal energy:
[] []
Knowing the energy production and energy prices, we can calculate the annual profits:
Total annual profit is given as a sum of these two profits:
Calculating the total energy, which is needed for this energy production, we will find
out how much fuel do we need for production and what are the total fuel costs for each year.
[] []
8/11/2019 Biomass Chp
http://slidepdf.com/reader/full/biomass-chp 5/22
5
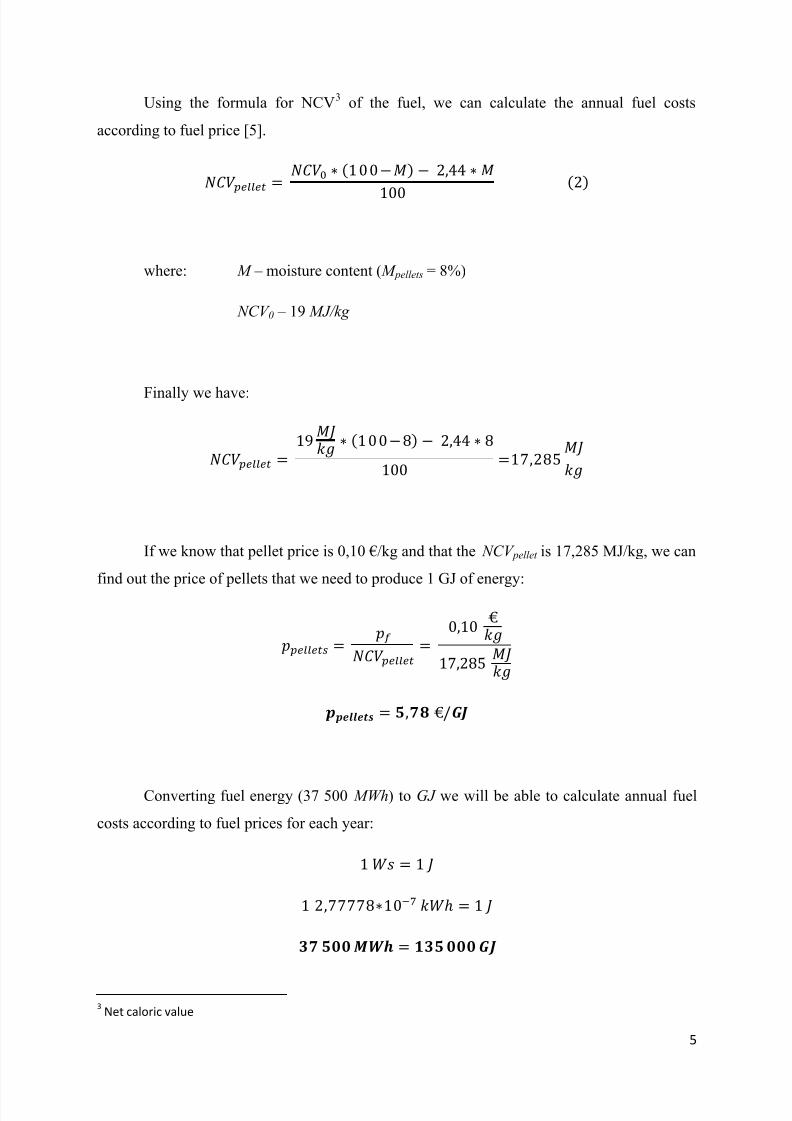
Using the formula for NCV3 of the fuel, we can calculate the annual fuel costs
according to fuel price [5].
( )
()
where: M – moisture content ( M pellets = 8%)
NCV 0 – 19 MJ/kg
Finally we have:
( )
If we know that pellet price is 0,10 €/kg and that the NCV pellet is 17,285 MJ/kg, we can
find out the price of pellets that we need to produce 1 GJ of energy:
Converting fuel energy (37 500 MWh) to GJ we will be able to calculate annual fuel
costs according to fuel prices for each year:
3 Net caloric value
8/11/2019 Biomass Chp
http://slidepdf.com/reader/full/biomass-chp 6/22
6
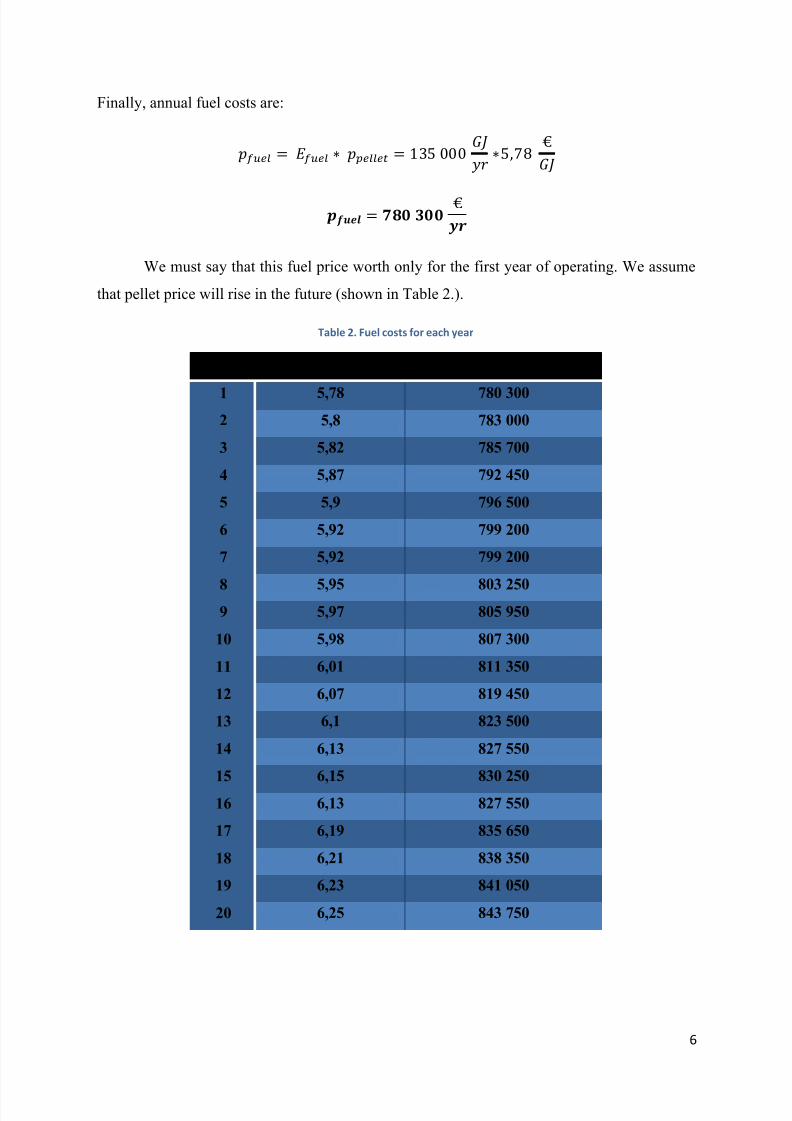
Finally, annual fuel costs are:
We must say that this fuel price worth only for the first year of operating. We assume
that pellet price will rise in the future (shown in Table 2.).
Table 2. Fuel costs for each year
year pellet price [€/GJ ] total annual fuel costs [€ ]
1 5,78 780 300
2 5,8 783 000
3 5,82 785 700
4 5,87 792 450
5 5,9 796 500
6 5,92 799 200
7 5,92 799 200
8 5,95 803 2509 5,97 805 950
10 5,98 807 300
11 6,01 811 350
12 6,07 819 450
13 6,1 823 500
14 6,13 827 550
15 6,15 830 250
16 6,13 827 550
17 6,19 835 650
18 6,21 838 350
19 6,23 841 050
20 6,25 843 750

8/11/2019 Biomass Chp
http://slidepdf.com/reader/full/biomass-chp 7/22
7
Picture 1. Fuel (pellet) price *€/GJ+
Pictur e 1. shows estimated fuel price during the 20 years period. We assumed that the
fuel price (pellet price) is growing up as the time flows.
Picture 2. Annual fuel price *€+
Pictur e 2. shows fuel costs in every year according to the fuel prices shown in Picture
1. and Table 2. As the pellet price grows, the annual fuel costs grow too. These costs effects
on the total costs and final money flow.
5.5
5.6
5.7
5.8
5.9
6
6.1
6.2
6.3
1 2 3 4 5 6 7 8 9 10 11 12 13 14 15 16 17 18 19 20
f u l e p r i c e [ € / G
J ]
time [yr]
fuel price
740000
750000
760000
770000
780000
790000
800000
810000
820000
830000
840000
850000
1 2 3 4 5 6 7 8 9 10 11 12 13 14 15 16 17 18 19 20
f u e l p r i c e [ € ]
time [yr]
Annual fuel price
8/11/2019 Biomass Chp
http://slidepdf.com/reader/full/biomass-chp 8/22
8
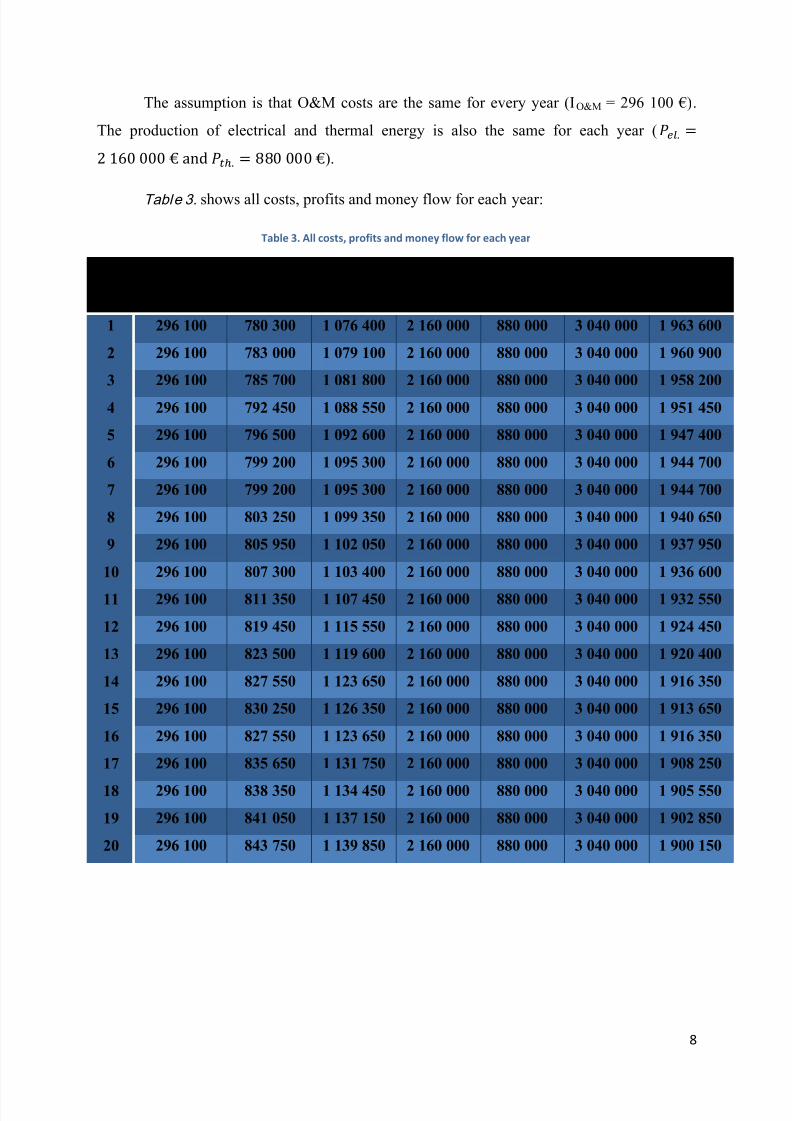
The assumption is that O&M costs are the same for every year (I O&M = 296 100 €).
The production of electrical and thermal energy is also the same for each year ( ).
Table 3. shows all costs, profits and money flow for each year:
Table 3. All costs, profits and money flow for each year
year
O&M costs
[€ ]
fuel costs
[€ ]
Total
costs [€ ]
El. en.
profit [€ ]
Th. en.
profit [€ ]
Total
profit [€ ]
Money
flow [€ ]
1 296 100 780 300 1 076 400 2 160 000 880 000 3 040 000 1 963 600
2 296 100 783 000 1 079 100 2 160 000 880 000 3 040 000 1 960 900
3 296 100 785 700 1 081 800 2 160 000 880 000 3 040 000 1 958 200
4 296 100 792 450 1 088 550 2 160 000 880 000 3 040 000 1 951 450
5 296 100 796 500 1 092 600 2 160 000 880 000 3 040 000 1 947 400
6 296 100 799 200 1 095 300 2 160 000 880 000 3 040 000 1 944 700
7 296 100 799 200 1 095 300 2 160 000 880 000 3 040 000 1 944 700
8 296 100 803 250 1 099 350 2 160 000 880 000 3 040 000 1 940 650
9 296 100 805 950 1 102 050 2 160 000 880 000 3 040 000 1 937 950
10 296 100 807 300 1 103 400 2 160 000 880 000 3 040 000 1 936 600
11 296 100 811 350 1 107 450 2 160 000 880 000 3 040 000 1 932 550
12 296 100 819 450 1 115 550 2 160 000 880 000 3 040 000 1 924 450
13 296 100 823 500 1 119 600 2 160 000 880 000 3 040 000 1 920 400
14 296 100 827 550 1 123 650 2 160 000 880 000 3 040 000 1 916 350
15 296 100 830 250 1 126 350 2 160 000 880 000 3 040 000 1 913 650
16 296 100 827 550 1 123 650 2 160 000 880 000 3 040 000 1 916 350
17 296 100 835 650 1 131 750 2 160 000 880 000 3 040 000 1 908 250
18 296 100 838 350 1 134 450 2 160 000 880 000 3 040 000 1 905 550
19 296 100 841 050 1 137 150 2 160 000 880 000 3 040 000 1 902 850
20 296 100 843 750 1 139 850 2 160 000 880 000 3 040 000 1 900 150
8/11/2019 Biomass Chp
http://slidepdf.com/reader/full/biomass-chp 9/22
9
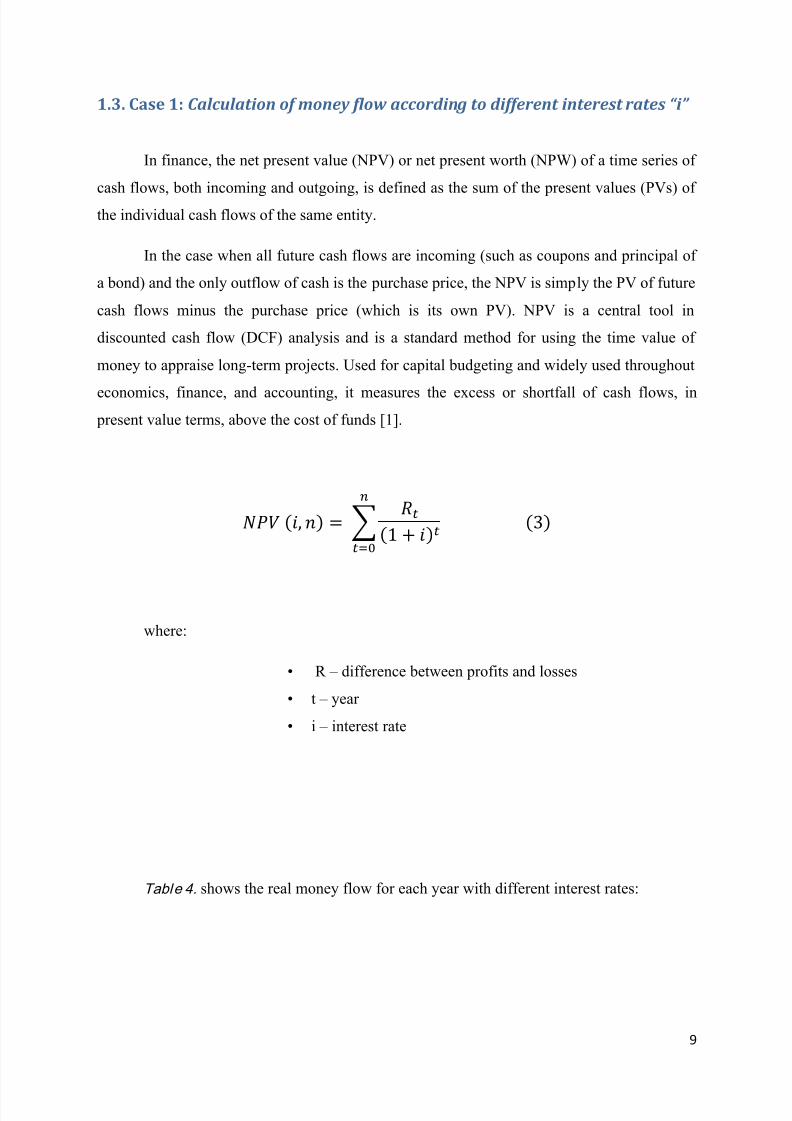
1.3. Case 1: Calculation of money flow according to different interest rates “i”
In finance, the net present value (NPV) or net present worth (NPW) of a time series of
cash flows, both incoming and outgoing, is defined as the sum of the present values (PVs) of
the individual cash flows of the same entity.
In the case when all future cash flows are incoming (such as coupons and principal of
a bond) and the only outflow of cash is the purchase price, the NPV is simply the PV of future
cash flows minus the purchase price (which is its own PV). NPV is a central tool in
discounted cash flow (DCF) analysis and is a standard method for using the time value of
money to appraise long-term projects. Used for capital budgeting and widely used throughout
economics, finance, and accounting, it measures the excess or shortfall of cash flows, in
present value terms, above the cost of funds [1].
( ) ∑ ( ) ()
where:
• R – difference between profits and losses
• t – year
• i – interest rate
Table 4. shows the real money flow for each year with different interest rates:
8/11/2019 Biomass Chp
http://slidepdf.com/reader/full/biomass-chp 10/22
10
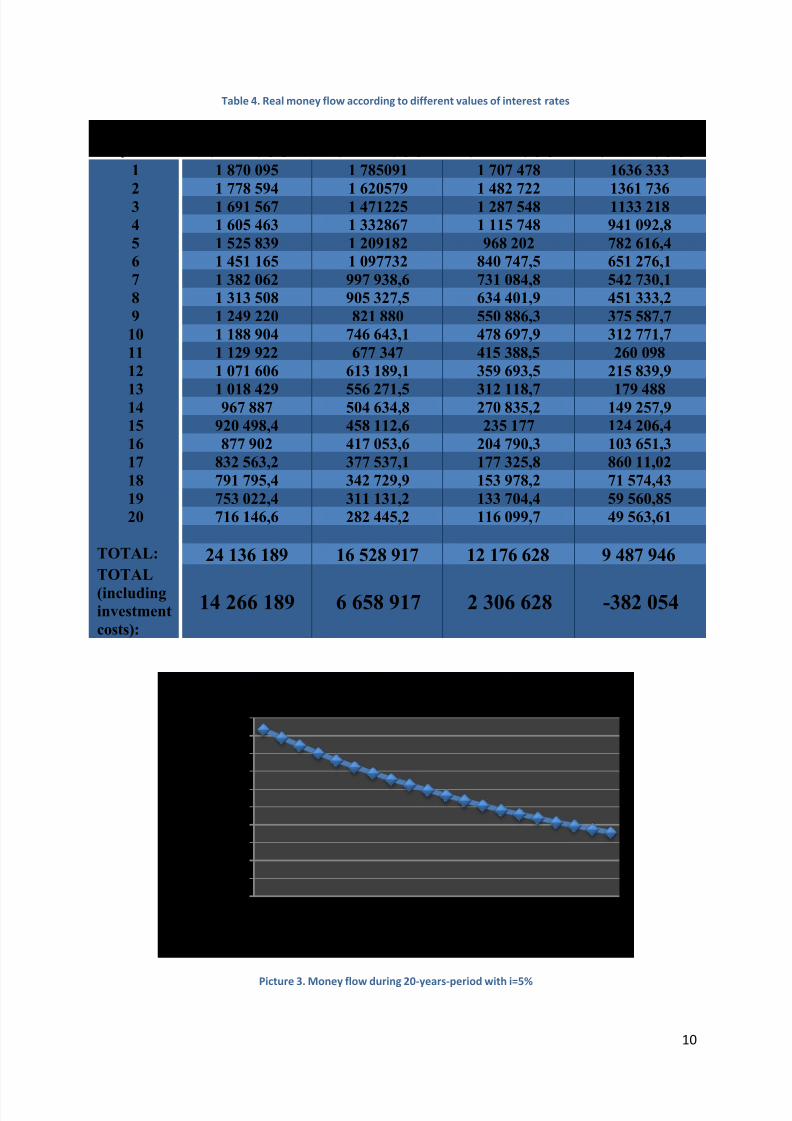
Table 4. Real money flow according to different values of interest rates
year
money flow
(i = 5%) [€]
money flow
(i = 10%) [€]
money flow
(i = 15%) [€]
money flow
(i = 20%) [€]
1 1 870 095 1 785091 1 707 478 1636 333
2 1 778 594 1 620579 1 482 722 1361 7363 1 691 567 1 471225 1 287 548 1133 218
4 1 605 463 1 332867 1 115 748 941 092,8
5 1 525 839 1 209182 968 202 782 616,4
6 1 451 165 1 097732 840 747,5 651 276,1
7 1 382 062 997 938,6 731 084,8 542 730,1
8 1 313 508 905 327,5 634 401,9 451 333,2
9 1 249 220 821 880 550 886,3 375 587,7
10 1 188 904 746 643,1 478 697,9 312 771,7
11 1 129 922 677 347 415 388,5 260 098
12 1 071 606 613 189,1 359 693,5 215 839,9
13 1 018 429 556 271,5 312 118,7 179 48814 967 887 504 634,8 270 835,2 149 257,9
15 920 498,4 458 112,6 235 177 124 206,4
16 877 902 417 053,6 204 790,3 103 651,3
17 832 563,2 377 537,1 177 325,8 860 11,02
18 791 795,4 342 729,9 153 978,2 71 574,43
19 753 022,4 311 131,2 133 704,4 59 560,85
20 716 146,6 282 445,2 116 099,7 49 563,61
TOTAL: 24 136 189 16 528 917 12 176 628 9 487 946TOTAL
(includinginvestment
costs):
14 266 189 6 658 917 2 306 628 -382 054
Picture 3. Money flow during 20-years-period with i=5%
0
200000
400000
600000
800000
1000000
1200000
1400000
1600000
1800000
2000000
1 2 3 4 5 6 7 8 9 10 11 12 13 14 15 16 17 18 19 20
m o n e y f l o w
[ € ]
time [yr]
Money flow with i = 5%
8/11/2019 Biomass Chp
http://slidepdf.com/reader/full/biomass-chp 11/22
11
Calculating the total money flow with interest rate of 5% during the period of 20
years, we can see that welfare is falling down during this period. Total welfare after 20 years
is 24 136 189 € what can be seen in Table 4 .
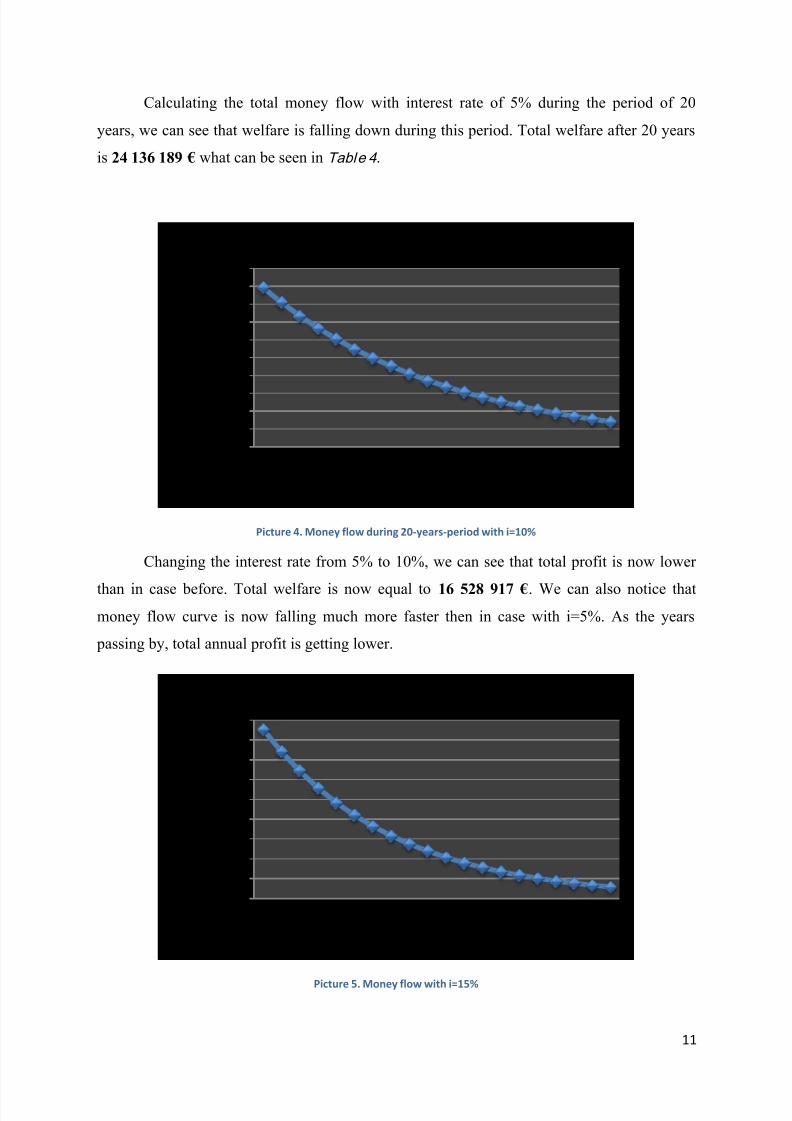
Picture 4. Money flow during 20-years-period with i=10%
Changing the interest rate from 5% to 10%, we can see that total profit is now lower
than in case before. Total welfare is now equal to 16 528 917 €. We can also notice that
money flow curve is now falling much more faster then in case with i=5%. As the years
passing by, total annual profit is getting lower.
Picture 5. Money flow with i=15%
0
200000
400000600000
800000
1000000
1200000
1400000
1600000
1800000
2000000
1 2 3 4 5 6 7 8 9 10 11 12 13 14 15 16 17 18 19 20
m
o n e y f l o w
[ € ]
time [yr]
Money flow with i = 10%
0
200000
400000
600000
800000
10000001200000
1400000
1600000
1800000
1 2 3 4 5 6 7 8 9 10 11 12 13 14 15 16 17 18 19 20
m o n e y f l o w
[ € ]
time [yr]
Money flow with i = 15%

8/11/2019 Biomass Chp
http://slidepdf.com/reader/full/biomass-chp 12/22
12
Picture 6. Money flow with i=20%
Pictur e 5. and Pictur e 6. show total money flow with interest rates 15% and 20%. As
we can see, total profits are now even more lower. Total welfare in case with i=15% is 12 176
628 €, and with i=20% is 9 487 946 €.
Pictur e 7. shows comparison of welfares for all interest rates.
Picture 7. Money flow with different interest rates
0
200000
400000
600000
800000
1000000
1200000
14000001600000
1800000
1 2 3 4 5 6 7 8 9 10 11 12 13 14 15 16 17 18 19 20
m o n e y f l o w [ € ]
time [yr]
Money flow with i = 20%
0
200000
400000
600000
800000
1000000
1200000
1400000
1600000
1800000
2000000
1 2 3 4 5 6 7 8 9 10 11 12 13 14 15 16 17 18 19 20
m o n e y f l o w
[ € ]
Money flow with different interest rates [€]
i = 5%
i = 10%
i = 15%
i = 20%
8/11/2019 Biomass Chp
http://slidepdf.com/reader/full/biomass-chp 13/22
13
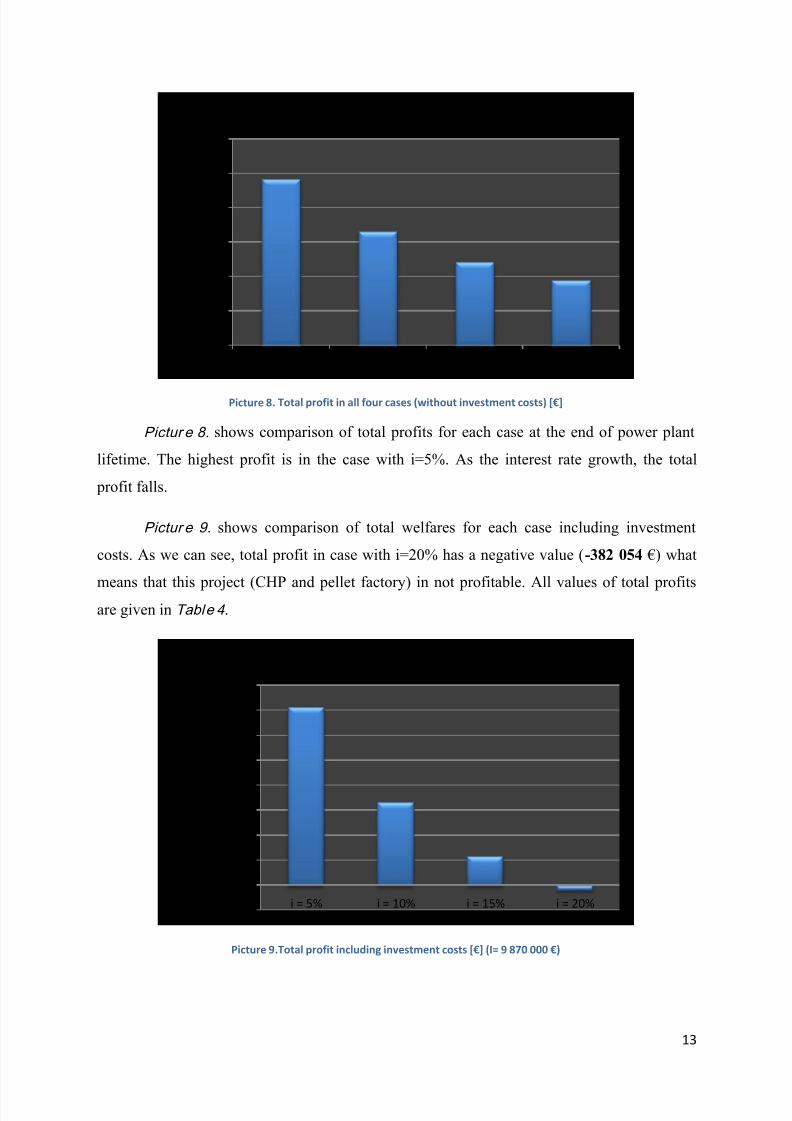
Picture 8. Total profit in all four cases (without investment costs) *€+
Pictur e 8. shows comparison of total profits for each case at the end of power plant
lifetime. The highest profit is in the case with i=5%. As the interest rate growth, the total
profit falls.
Pictur e 9. shows comparison of total welfares for each case including investment
costs. As we can see, total profit in case with i=20% has a negative value ( -382 054 €) what
means that this project (CHP and pellet factory) in not profitable. All values of total profitsare given in Table 4 .
Picture 9.Total profit including investment costs *€+ (I= 9 870 000 €)
0
5000000
10000000
15000000
20000000
25000000
30000000
i = 5% i = 10% i = 15% i = 20%
Total profit [€]
-2000000
0
2000000
4000000
6000000
8000000
10000000
12000000
14000000
16000000
i = 5% i = 10% i = 15% i = 20%
p r o f i t [ € ]
Total profit according to investment costs [€]
8/11/2019 Biomass Chp
http://slidepdf.com/reader/full/biomass-chp 14/22
14
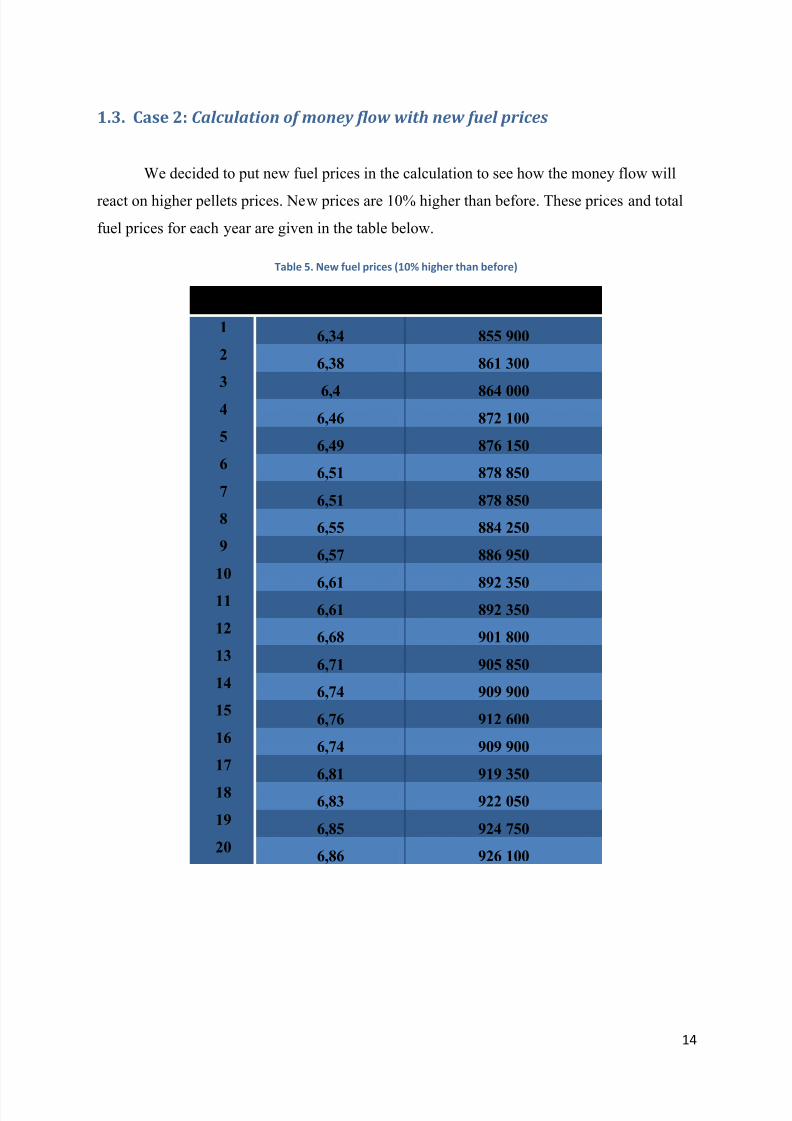
1.3. Case 2: Calculation of money flow with new fuel prices
We decided to put new fuel prices in the calculation to see how the money flow will
react on higher pellets prices. New prices are 10% higher than before. These prices and total
fuel prices for each year are given in the table below.
Table 5. New fuel prices (10% higher than before)
year pellet price [€/GJ ] total annual fuel costs [€ ]
16,34 855 900
26,38 861 300
36,4 864 000
46,46 872 100
56,49 876 150
66,51 878 850
76,51 878 850
86,55 884 250
96,57 886 950
10
6,61 892 350116,61 892 350
126,68 901 800
136,71 905 850
146,74 909 900
156,76 912 600
166,74 909 900
176,81 919 350
186,83 922 050
196,85 924 750
206,86 926 100
8/11/2019 Biomass Chp
http://slidepdf.com/reader/full/biomass-chp 15/22
15
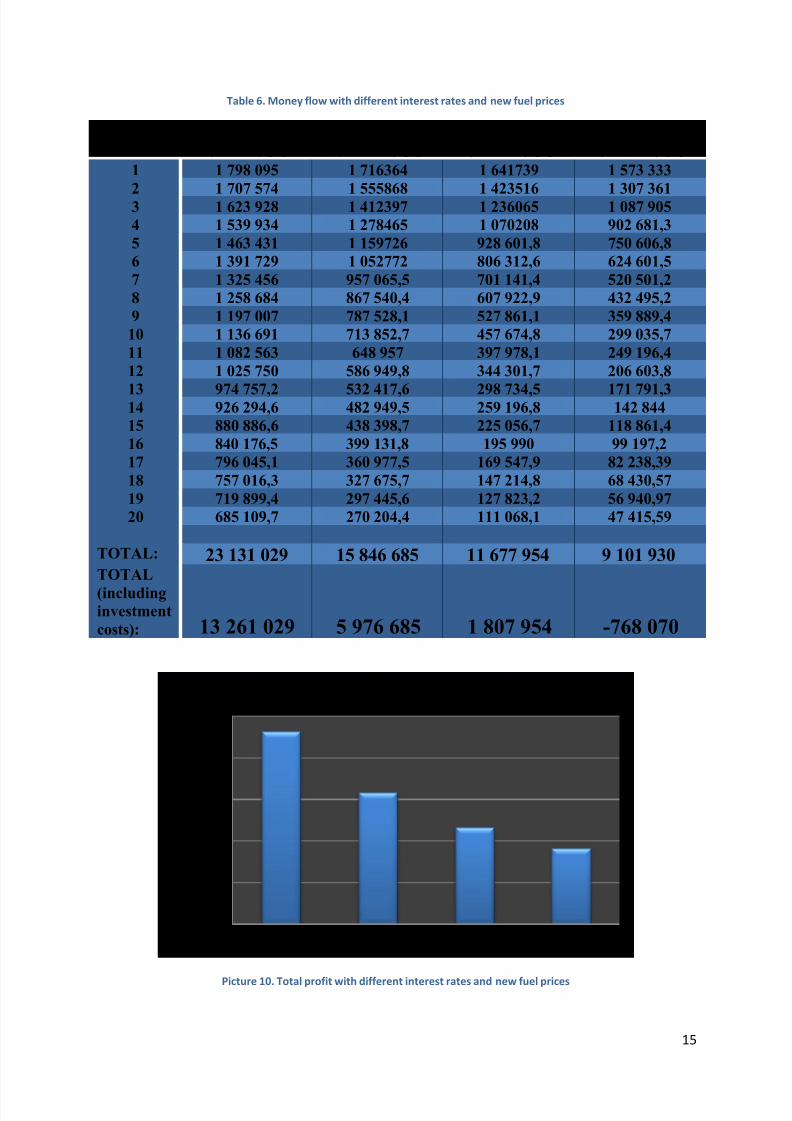
Table 6. Money flow with different interest rates and new fuel prices
year money flow
(i = 5%) [€]
money flow
(i = 10%) [€]
money flow
(i = 15%) [€]
money flow
(i = 20%) [€]
1 1 798 095 1 716364 1 641739 1 573 333
2 1 707 574 1 555868 1 423516 1 307 3613 1 623 928 1 412397 1 236065 1 087 905
4 1 539 934 1 278465 1 070208 902 681,3
5 1 463 431 1 159726 928 601,8 750 606,8
6 1 391 729 1 052772 806 312,6 624 601,5
7 1 325 456 957 065,5 701 141,4 520 501,2
8 1 258 684 867 540,4 607 922,9 432 495,2
9 1 197 007 787 528,1 527 861,1 359 889,4
10 1 136 691 713 852,7 457 674,8 299 035,7
11 1 082 563 648 957 397 978,1 249 196,4
12 1 025 750 586 949,8 344 301,7 206 603,8
13 974 757,2 532 417,6 298 734,5 171 791,314 926 294,6 482 949,5 259 196,8 142 844
15 880 886,6 438 398,7 225 056,7 118 861,4
16 840 176,5 399 131,8 195 990 99 197,2
17 796 045,1 360 977,5 169 547,9 82 238,39
18 757 016,3 327 675,7 147 214,8 68 430,57
19 719 899,4 297 445,6 127 823,2 56 940,97
20 685 109,7 270 204,4 111 068,1 47 415,59
TOTAL: 23 131 029 15 846 685 11 677 954 9 101 930TOTAL
(includinginvestment
costs): 13 261 029 5 976 685 1 807 954 -768 070
Picture 10. Total profit with different interest rates and new fuel prices
0
5000000
10000000
15000000
20000000
25000000
i = 5% i = 10% i = 15% i = 20%
Total profit [€]

8/11/2019 Biomass Chp
http://slidepdf.com/reader/full/biomass-chp 16/22
16
Picture 11. Total profit including investment costs
Picture 12. Comparison of total welfares including investment cost
As we could expect, total welfares are now lower then in case with old fuel prices.
Differences in total welfares for both cases (old and new fuel prices) are shown in Pictur e 12 .
Money flows and welfares are shown in Table 6 .
Looking at the case with interest rate i=20%, we can see that total welfare has even
higher negative value (Picture 12.).
-2000000
0
2000000
4000000
6000000
8000000
10000000
12000000
14000000
i = 5% i = 10% i = 15% i = 20%
Total profit including investment costs [€]
-2000000
0
2000000
4000000
6000000
8000000
10000000
12000000
14000000
16000000
i = 5% i = 10% i = 15% i = 20%
Comparison of total welfares including investment cost
old fuel price
new fuel price

8/11/2019 Biomass Chp
http://slidepdf.com/reader/full/biomass-chp 17/22
8/11/2019 Biomass Chp
http://slidepdf.com/reader/full/biomass-chp 18/22
18
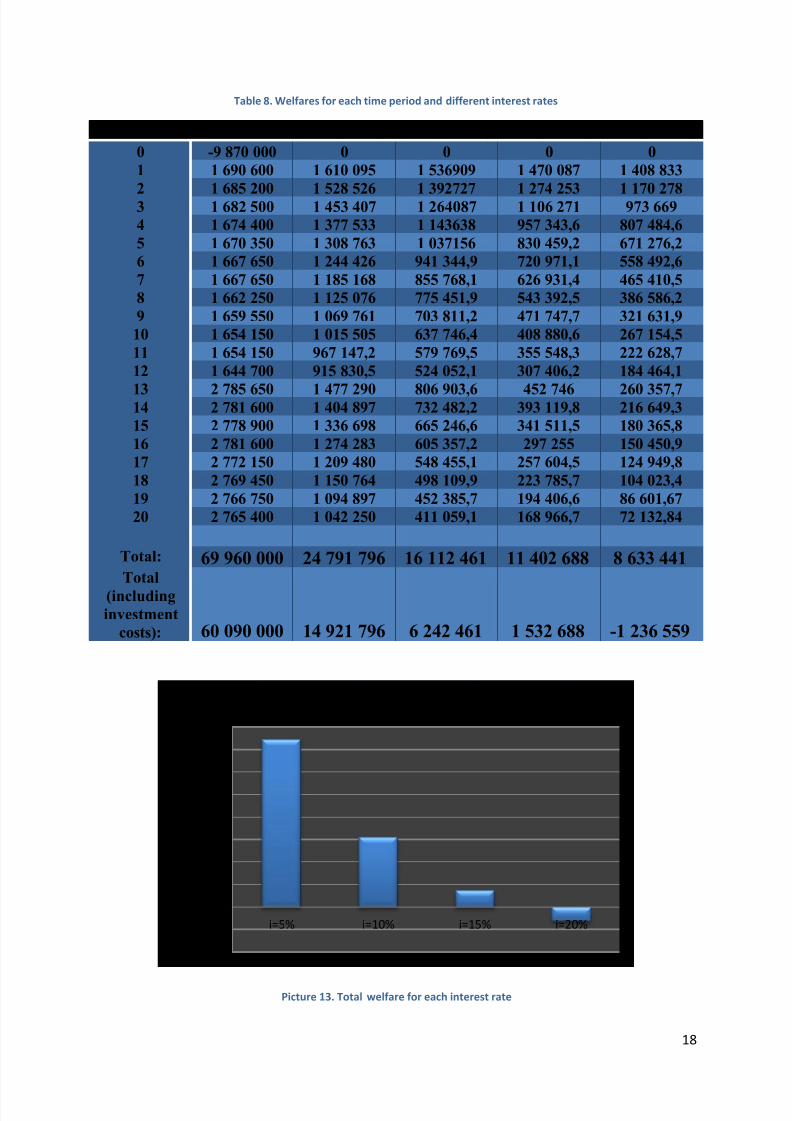
Table 8. Welfares for each time period and different interest rates
t Welfare NPV(i=5%) NPV(i=10%) NPV(i=15%) NPV(i=20%)
0 -9 870 000 0 0 0 0
1 1 690 600 1 610 095 1 536909 1 470 087 1 408 833
2 1 685 200 1 528 526 1 392727 1 274 253 1 170 2783 1 682 500 1 453 407 1 264087 1 106 271 973 669
4 1 674 400 1 377 533 1 143638 957 343,6 807 484,6
5 1 670 350 1 308 763 1 037156 830 459,2 671 276,2
6 1 667 650 1 244 426 941 344,9 720 971,1 558 492,6
7 1 667 650 1 185 168 855 768,1 626 931,4 465 410,5
8 1 662 250 1 125 076 775 451,9 543 392,5 386 586,2
9 1 659 550 1 069 761 703 811,2 471 747,7 321 631,9
10 1 654 150 1 015 505 637 746,4 408 880,6 267 154,5
11 1 654 150 967 147,2 579 769,5 355 548,3 222 628,7
12 1 644 700 915 830,5 524 052,1 307 406,2 184 464,1
13 2 785 650 1 477 290 806 903,6 452 746 260 357,714 2 781 600 1 404 897 732 482,2 393 119,8 216 649,3
15 2 778 900 1 336 698 665 246,6 341 511,5 180 365,8
16 2 781 600 1 274 283 605 357,2 297 255 150 450,9
17 2 772 150 1 209 480 548 455,1 257 604,5 124 949,8
18 2 769 450 1 150 764 498 109,9 223 785,7 104 023,4
19 2 766 750 1 094 897 452 385,7 194 406,6 86 601,67
20 2 765 400 1 042 250 411 059,1 168 966,7 72 132,84
Total: 69 960 000 24 791 796 16 112 461 11 402 688 8 633 441Total
(including
investment
costs): 60 090 000 14 921 796 6 242 461 1 532 688 -1 236 559
Picture 13. Total welfare for each interest rate
-4000000
-2000000
0
2000000
4000000
6000000
8000000
10000000
12000000
14000000
16000000
i=5% i=10% i=15% i=20%
total welfare for each interest rate [€]
8/11/2019 Biomass Chp
http://slidepdf.com/reader/full/biomass-chp 19/22
19
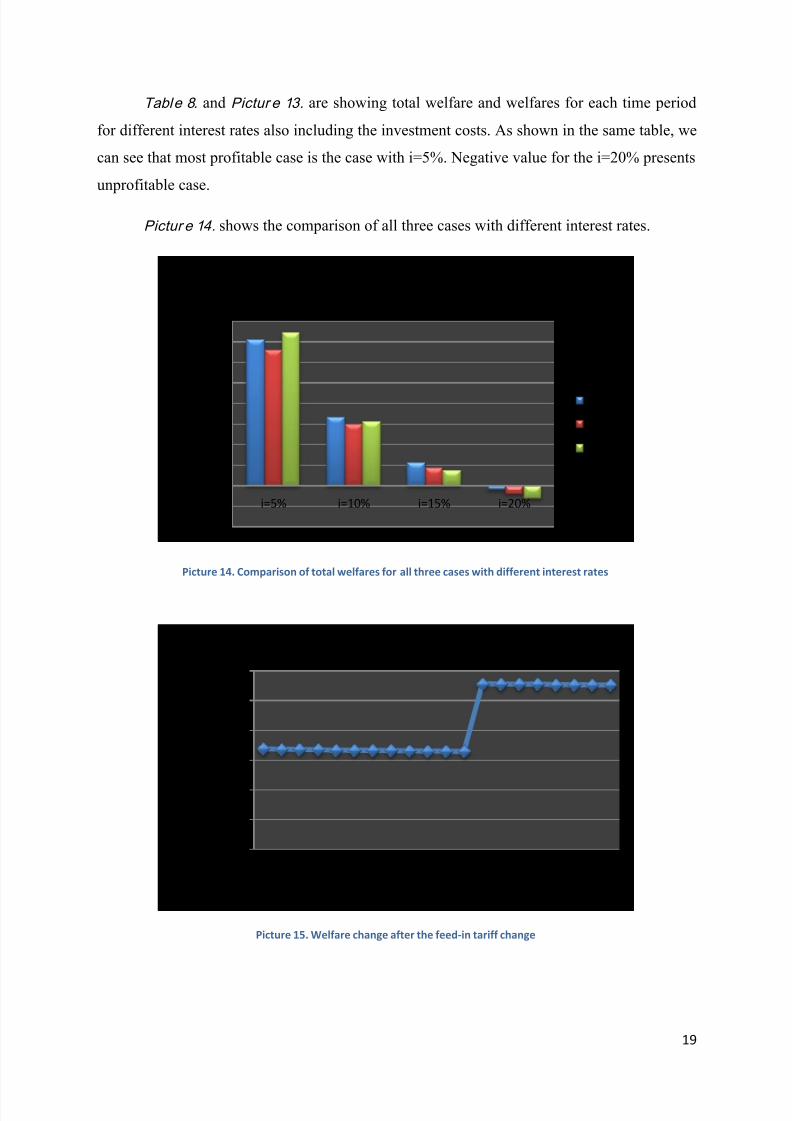
Table 8. and Pictur e 13. are showing total welfare and welfares for each time period
for different interest rates also including the investment costs. As shown in the same table, we
can see that most profitable case is the case with i=5%. Negative value for the i=20% presents
unprofitable case.
Pictur e 14. shows the comparison of all three cases with different interest rates.
Picture 14. Comparison of total welfares for all three cases with different interest rates
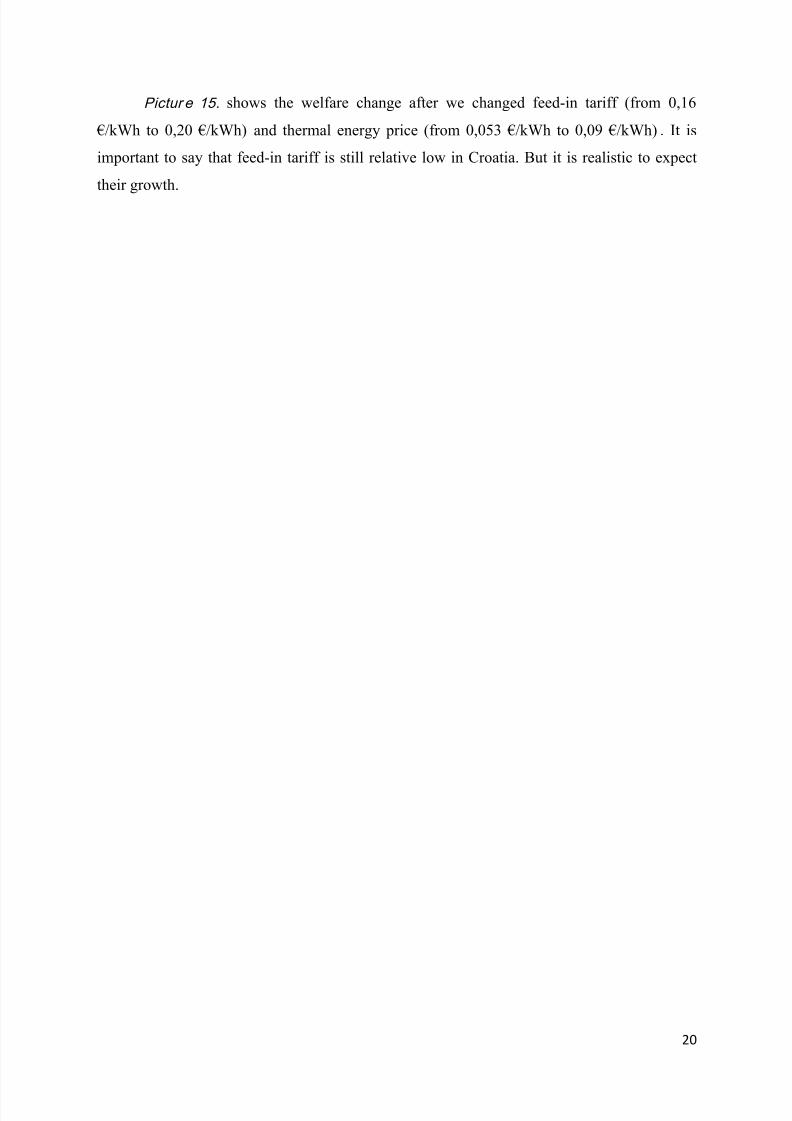
Picture 15. Welfare change after the feed-in tariff change
-4000000
-2000000
0
2000000
4000000
6000000
8000000
10000000
12000000
14000000
16000000
i=5% i=10% i=15% i=20%
Comparison of total welfares for all three cases and each
interest rate
Case 1
Case 2
Case 3
0
500000
1000000
1500000
2000000
2500000
3000000
1 2 3 4 5 6 7 8 9 10 11 12 13 14 15 16 17 18 19 20
w
e l f a r e [ € ]
time [year]
Welfare change after changing feed-in tariff
8/11/2019 Biomass Chp
http://slidepdf.com/reader/full/biomass-chp 20/22
20
Pictur e 15. shows the welfare change after we changed feed-in tariff (from 0,16
€/kWh to 0,20 €/kWh) and thermal energy price (from 0,053 €/kWh to 0,09 €/kWh) . It is
important to say that feed-in tariff is still relative low in Croatia. But it is realistic to expect
their growth.
8/11/2019 Biomass Chp
http://slidepdf.com/reader/full/biomass-chp 21/22
21
Conclusion
All three cases show profitable projects for interest rates 5%, 10% and 15%. Also
every of these cases is unprofitable for interest rate of 20%. Comparing different fuel prices,
feed-in tariff, thermal energy prices and O&M costs we presented the sensitivities of
profitability for this project.
All results are given in pictures and tables with short explanations. All possible
misunderstandings and questions can be discussed during the oral exam.

8/11/2019 Biomass Chp
http://slidepdf.com/reader/full/biomass-chp 22/22
22
Literature
[1] Wikipedia, „ Net present value“, http://en.wikipedia.org/wiki/Net_present_value,
27.12. 2013.
[2] Josip Dundović, “Kogeneracija LIKA ENERGO EKO d.o.o. Udbina”,
http://www.urh.hr/5Dundovic_SB.pdf , 27.12.2013.
[3] Wikipedia, “Kogeneracija”, http://hr.wikipedia.org/wiki/Kogeneracija, 29.12.2013.
[4] “Selected Topics in Energy Economics and Environment, Exercise VU „Selected
Topics“ on „Heating Costs””, December 2013.
[5] Lukas Kranzl, Energy Economics Group (EEG) at the Institute of Energy Systems
and Electrical Drives, “ Bioenergy - a key option within all energy sectors”, December 2013.