公共政策研究資助計劃pdf)/2015...請遵守公共政策研究資助計劃申請須知內關於「知識產權及項目數據的使用」的規定。...
TRANSCRIPT

PUBLIC POLICY RESEARCH FUNDING SCHEME
公共政策研究資助計劃
Project Number : 項目編號:
2015.A1.026.15D
Project Title : 項目名稱:
Tenant Purchase, Assisted Home Ownership and Social and Residential Mobility 租者置其屋與居者有其屋計劃─社會及居所流動
Principal Investigator : 首席研究員:
Professor Ray FORREST
Institution/Think Tank : 院校 /智庫:
City University of Hong Kong 香港城市大學
Project Duration (Month): 推行期 (月) :
15
Funding (HK$) : 總金額 (HK$):
657,296.00
This research report is uploaded onto the Central Policy Unit’s (CPU’s) website for public reference. The views expressed in this report are those of the Research Team of this project and do not represent the views of the CPU and/or the Assessment Panel. The CPU and/or the Assessment Panel do not guarantee the accuracy of the data included in this report.
Please observe the "Intellectual Property Rights & Use of Project Data” as stipulated in
the Guidance Notes of the Public Policy Research Funding Scheme. A suitable acknowledgement of the funding from the CPU should be included in any
publication/publicity arising from the work done on a research project funded in whole or in part by the CPU.
The English version shall prevail whenever there is any discrepancy between the
English and Chinese versions. 此研究報告已上載至中央政策組(中策組)網站,供公眾查閱。報告內所表達的意見純屬本
項目研究團隊的意見,並不代表中策組及/或評審委員會的意見。中策組及/或評審委員會不保
證報告所載的資料準確無誤。
請遵守公共政策研究資助計劃申請須知內關於「知識產權及項目數據的使用」的規定。
接受中策組全數或部分資助的研究項目如因研究工作須出版任何刊物/作任何宣傳,均
須在其中加入適當鳴謝,註明獲中策組資助。
中英文版本如有任何歧異,概以英文版本為準。
Tenant Purchase, Assisted Home Ownership and
Social and Residential Mobility
租者置其屋,居者有其
租者置其屋與居者有其屋計劃-社會及居所流動
[Project Number: 2015.A1.026.15D]
Principal Investigator: Professor Ray FORREST
Co-Investigator: Professor Ngai-ming YIP

1
Table of Contents
Abstract in English 3
Abstract in Chinese 4
List of Tables 5
List of Figures 6
Chapter 1 Introduction 7
Background 7
Previous Relevant Research 8
Objectives 9
Research Methodology 10
Chapter 2 The Evolution of Assisted Home Ownership Policies in Hong Kong
12
Background 12
The Working Party on Home Ownership 1976 – 2002 12
The Private Sector Participation Scheme: Increasing housing stock
13
Home Ownership Scheme Phase 3B: Removing the land values
14
The Long Term Housing Strategy 1987: Embedding home ownership in the Government’s policy
14
Incentivising PRH tenants to vacate their flats for re-allocation
16
The Tenants Purchase Scheme 17
The Secondary Market Scheme and Resale Relaxation: Increasing turnover of subsidised flats
19
The Economic downturn: 2003 – 2011 19
Terminating the HOS: The Housing Market Stabilisation Plan 2002
22
Where we are now? Revitalisation of the HOS: Providing reasonably priced small and medium flats
22
Chapter 3 Analysis of Secondary Data 25
Analysis of Property Transaction Database 25
Secondary data analysis of Census 27
Chapter 4 Findings from the Telephone Survey 31
Introduction 31
Profile of Respondents 32
Mobility and the Motivation to Buy 35
Views on Housing Policy and Assisted Home
Ownership
40
Attitudes towards home ownership 44

2
Chapter 5 Policy Implications and Recommendations 52
Background 52
Summary and Reflections 52
Policy Recommendations 55
Public Dissemination 56
Bibliography 57
Appendix 1 Questionnaire-English version 64
Appendix 2 Questionnaire-Chinese version 77
Appendix 3 Number of Applications for HOS Flats (1979 – 1994) 87
Appendix 4 Discount Rate of HOS Flats (1981 – 2016) 89
Appendix 5 Summary Technical Report on Survey 90
3
Abstract
The rising costs of home ownership are posing housing policy challenges in many parts of the world. In a low inflation, low interest rate era, the residential property market has become one of the primary destinations for personal savings and for speculative investment. As a consequence, affordability problems have become more acute and the prospect of achieving higher, sustainable levels of home ownership has become more difficult. In this situation there is a danger that the gap between owners and renters becomes wider and that mobility between tenures is reduced. Equally, the high costs of buying a flat impacts on new household formation and increases demand for public rental housing. There is therefore greater
pressure to ensure that the public sector stock is used efficiently and that those who can afford to enter the home ownership sector are enabled and encouraged to do so. In this context, assisted home ownership schemes may be resurrected in various forms-tenant purchase schemes, shared ownership programmes or build for sale in which production or land costs are subsidised. In Hong Kong, the home ownership scheme (HOS) and the Tenant
Purchase Scheme (TPS) have been the main policy vehicles but they were discontinued with the more negative economic conditions of the late 1990s and early 2000s. With an expanding waiting list for public rental housing and seemingly relentless, inflationary pressures on house prices, new but relatively modest HOS type schemes have been resurrected and there are regular calls to sell more public rental housing.
This project aimed to review the development of the previous HOS and TPS programmes, to explore their impact on the pattern of housing opportunities in Hong Kong and to explore current attitudes towards assisted home ownership scheme among various groups-those who bought under the TPS scheme; white and green form HOS buyers; secondary and open market purchasers; existing public tenants. This report provides a comprehensive account of the development of assisted home ownership schemes in Hong Kong. It then goes onto to report on secondary data analysis of a property transaction data base and a number of waves of the population census. With regard to the transaction database, the analysis is currently restricted to the earliest phases
of HOS (1-3A). The census analysis explores the changing income profile of HOS owners from 1981 to 2006. Further analyses will supplement the completion report and will appear in related papers. The social survey involved telephone interviews with over 1033 respondents;200 TPS households; 274 HOS households (89 white form, 120 green form, 65 open market purchasers); 102 households who were previous purchasers of HOS/TPS property; 457 public housing tenants. Overall, the study confirms the role of assisted home ownership schemes in Hong Kong in providing an important stepping stone into the home ownership market. The turnover of TPS
is in its early days but it is evident that many HOS properties have been absorbed into the wider market and represent a significant and distinctive route for public and private tenants.
4
It is also clear that for both TPS and HOS buyers the experience of buying has been an overwhelmingly positive one with evidently very few regretful owners identified in this study. It is noted, however, that market conditions have been very buoyant in recent years. If these conditions turned more negative again, attitudes among some buyers could change. The current climate in the housing market also shapes attitudes towards government policies with strong support for greater investment in both public rental housing and assisted home ownership schemes. People also appear more aware of the riskier housing market and seek lower risk means of achieving home ownership. There is enthusiasm for selling more public rental housing and for building more. There is also concern that there is greater divergence between owners and renters in Hong Kong society.
住屋費用的上漲在很多地方成為房屋政策的挑戰。在低通脹,低利率的年代,住宅物業市場成為私人儲蓄與投機性投資的主要工具。這導致住屋負擔能力惡化,也令置業率維持高水平及可持續發展變得困難。在這情況下,業主與租客的差距正在擴大,也會減弱不同居住類型之間的流動。同樣,置業費用的提高也影響組織新家庭,和推高對公共房屋的需求。因此社會有壓力要求加強公共房屋使用的效率,以及令有能力置業的家庭獲得置業的鼓勵及便利。 在這背景下,可能需要重啟輔助置業計劃,無論是出售公屋,共享業權計劃,出售新建公共房屋等由公帑補助建築費用或土地的計劃。在香港,居者置其屋和租者置其屋計劃是輔助置業計劃的重要的政策工具,但他們都在香港 1990 年代末至 2000 年代初
經濟低潮時被暫停。但在公共房屋輪候名單不斷增長,樓價好像脫繮野馬般上升時,居者有其屋計劃以新的型態及相對適量的重推,社會也不斷有聲音要求售賣更多的出租公共房屋。 本研究計畫的目標是檢視居者置其屋和租者置其屋計劃的發展,並了解其對香港房屋機遇結構的影響,也同時調查社會不同群體,例如居屋的白表和綠表買家,自由及第二市場買家,或公共房屋的租客等,對輔助置業政策的態度。 本研究計畫報告提供了一個對輔助置業計劃的詳盡描述,並提供了不同年份的人口普查及物業交易的數據分析。在交易數據方面,因數據庫裡缺乏居屋第 1 到 3A 期的數據,而需要從其他途徑再蒐集資料,詳盡分析需要在期終報告和其他論文再作補充。補充
數據也會在公共研討會公佈。本研究分析了1981到2006年居屋業主家庭收入的變化。研究計畫進行的社會調查訪問了 1033 受訪者,其中包括 200 租者置其屋業主,274 居屋業主(89 白表,120 綠表,65 自由市場買家),以及 102 個曾經購買居屋,置屋的家庭,和 457 公屋租戶。 總的來說,本研究證實了輔助置業計劃在香港作為重要置業跳板的角式,縱然租者置其屋計劃的轉售還在初始階段而成交不多,研究已顯示居者有其屋計劃已成功融進房產市場,成為公營與私營房屋的租客重要及獨特的置業途徑。居屋和置屋的買家也同時認為他們置業的經驗是正面的,研究只找到很少感到後悔的買家。但值得指出的是,近來樓市變得動盪,如經濟再次下滑,部份買家的態度可能轉變。現在社會氣氛也影響市民對政府房屋政策的意見,強烈支持多建公共出租與輔助置業房屋。人們也對樓
市的風險加強了關注,並希望能夠有較低風險的置業途徑,對增加出售及興建更多的公共房屋更熱衷,對香港社會業主與租客差距的增大更關注。

5
List of Tables
Table 2.1 Number of Applications for HOS flats (1995-2002)
Table 3.1 Resale of Phase 1 to 3A before 1991
Table 3.2 Resale of Phase 1 to 3A before 2015
Table 3.3 Housing Tenure by Income Decile
Table 4.1 Breakdown of Sample by Key Housing Groups
Table 4.2 Household Size (excl. domestic helpers)
Table 4.3 Age of Respondent by Housing Group (Percentage in each category)
Table 4.4 Occupation of Respondent (Percentage in each category)
Table 4.5 Household Income by Housing Group (Percentage in each category)
Table 4.6 Thinking back to when you bought this particular flat, what were your main
reasons for buying it?
Table 4.7 The government should provide more help for people to get into private home
ownership
Table 4.8 The government should provide subsidies to young people to help them buy
Table 4.9 The government should sell some public rental housing to widen opportunities
for home ownership
Table 4.10 The government should force wealthier tenants to leave public rental housing
Table 4.11 The gap between home owners and renters is getting wider
Table 4.12 Where do see yourself on the housing ladder?

6
List of Figures
Figure 2.1 Production of HOS flats (1979-2002)
Figure 3.1 Housing Tenure Changes (1981-2011)
Figure 4.1 Percentage of households who have considered moving
Figure 4.2 Reasons for thinking of moving
Figure 4.3 Open or Secondary Market Purchasers of HOS Properties
Figure 4.4 Views on Government Policy to Help People Into Home Ownership
Figure 4.5 Views on Rental Housing
Figure 4.6 Attitudes to Owning and Renting
Figure 4.7 Public rental tenants: if the price is right I would buy my unit
Figure 4.8 Looking to the future, do you see yourself moving up, down or staying the
same

7
Chapter 1
Introduction
Background Housing is one of the most important public policy challenges in Hong Kong. Indeed, in the 2014 Policy Address it was referred to as ‘the most critical of all livelihood issues…’ and
arguably, since then, the housing policy challenges have become more acute. Hong Kong is by no means unique in this respect. Many governments around the world are faced with very similar difficulties. House prices have often risen well beyond the reach of new households as residential real estate markets continue to attract a substantial proportion of expanding investment funds, local and international, looking for relatively safe havens. Even when house prices have fallen as in the aftermath of the global financial crisis (see Forrest and Yip, 2011), or the earlier Asian financial crisis, or as a longstanding process as in Japan (Ronald and Hirayama, 2009), younger households may then face higher deposit barriers or be in insecure employment. Moreover, different generations of home owners have conflicting interests. Aging generations of mature owners wish to keep property values high
to preserve their retirement assets or the inheritance for their children. Younger generations typically want to see prices fall to ease access. These kinds of conflicts and policy dilemmas are particularly evident in Asian societies which do not have the developed pension systems associated with many European countries. Singapore is a particularly good example of the way housing and welfare are intimately connected and where there are clear generational policy conflicts. These problems of access to home ownership and independent living for new households have also often been exacerbated by disinvestment in social housing in recent years and by the low quality or high cost of private renting.
On many of these measures Hong Kong is actually relatively well positioned. It retains an unusually large and well maintained public rental sector and has a relatively buoyant economy.
However, the city has experienced some of the highest levels of house price inflation in the world over the last decade and space norms are extremely low by international standards. Moreover, a relatively high average per capita income conceals high and widening income differentials and a large section of the population on low individual and household incomes. Unsurprisingly, median house price/median income ratios are also among the highest of the major world cities, with estimates ranging typically from between 13:1 to 18:1. In general terms there is, therefore, a considerable gap between those who have gained access to home ownership and those aspiring to enter. This gap has widened with increasing speculative pressures. Housing policy analysts often refer to marginal home owners-those households who have managed to gain a precarious foothold in private home ownership and those struggling on the edge. But in Hong Kong, in terms of gaining access at current market prices,
the ‘edge’ is rather narrow with a distant and substantial hinterland of households with little hope of purchasing a flat in the private market.
8
The problem facing Hong Kong and many other governments is how to sustain the political aspiration and promise of increased home ownership with such housing affordability challenges. Again, if we look internationally, home ownership rates in some countries have started to decline. In some cases, overall rates are in decline as in the USA and the UK, reversing long standing post war trends which saw higher rates of home ownership over the generations. However, these small falls in overall home ownership rates (eg from around 71% to 66% in the USA) conceal much more substantial falls among younger cohorts. For example, in England the proportion of 30-34 year olds in home ownership has dropped from 67 per cent in 1991 to 43 per cent in 2011/12 (Office of National Statistics, 2015). One response to this situation is to argue for new forms of social housing or more affordable
private rental opportunities. Such policy measures could certainly provide more housing opportunities for new households but sidestep the problem of how to avoid a growing fissure between those with housing assets and those without. With housing wealth gaining greater prominence in aging societies, and particularly in those societies lacking developed pension systems, the distinction between home owners and non-home owners is likely to become starker in terms of social mobility and life chances. However, it also has to be acknowledged that not all home owners own, valuable appreciating assets. This issue is of some considerable relevance to privatization programmes where, in some countries, governments have unburdened themselves of the responsibility for maintenance and repair of decaying properties by converting large parts of the stock from public to private ownership. This issue has been of particular importance in former state socialist societies in Eastern Europe and
particularly in Russia. It also has relevance to the privatization of some former work unit housing in China. These kinds of measures boost home ownership rates but not necessarily in a sustainable manner. A key policy question therefore is, in the longer term, where do former publicly owned housing units, or state assisted home ownership units fit in the market? Are they all desirable assets or are some more like liabilities? Which market segments are being served when these properties change hands? What kind of filtering process is set in train when these kinds of properties changes hands? To what extent does state assisted home ownership or sitting tenant purchase of a public rental flat provide an upward step on the housing ladder?
Previous Relevant Research
There have been numerous commentaries and analyses of the Hong Kong HOS and TPS schemes over
the years. Most academic studies have explored these policy initiatives in the context of the promotion of home ownership (eg Chiu 2002, 2007; Chan, 2000) and, more theoretically, with regard to processes of privatization or commodification (Ho, 2004; La Grange and Pretorius, 2005). Some economists have also been concerned particularly with the market impact of subsidized home ownership schemes, particularly in the wake of the Asian Financial Crisis (eg Ho and Wong, 2006; Lui and Yeung, 2013).There have also been various doctoral or MA theses which have taken HOS or TPS as the substantive topic for investigation (See for example, Cheung, 2007; Sze, 2005). The HKHA itself has undertaken regular assessments of the secondary market (SMS scheme) and open market (OM) for HOS flats. These have been
carried out since 1997, initially on an annual basis and biennially since 2001, and have

9
involved face to face interviews with SM and OM purchasers. In 2010/11 some 8800 HOS properties were sold on the open market. The 2012 survey (HKHA, 2012) indicated inter alia: • that open market purchasers of HOS flats are younger than SM purchasers with a median
age in the 30-39 band • that open market purchasers of HOS flats have higher median monthly incomes than SM
purchasers –around $27400 in 2011 • almost a quarter of OM purchasers had incomes of $40000 or above in 2011 • some 30% of OM purchasers of HOS flats were trading up from older properties, indicating
that they do not always represent the first rung on the ladder • The main reasons for open market purchasers choosing an HOS flat rather than another
property on the market were that they were cheaper, more affordable and some were better laid out and larger
• a small percentage (5%) of open market purchasers said they might sell the property within three years, only 1% of SM purchasers
The publicly available evidence is relatively limited in scope and much of it preceded the current housing market conditions and heightened housing concerns. There remains a lack of publicly available primary research on the impact of TPS and HOS schemes on the housing market experiences of the purchasers. Most research has had to rely on official secondary material and data (eg Lau, 2005) and moreover, it has been until recently, too early to begin to assess the longer term impacts because of limited property turnover, particularly in
relation to TPS. Thus, as in many other countries, the Hong Kong government has at various times developed policies to enable and encourage lower income households to enter home ownership. In particular, influenced by privatization policies elsewhere, notably Britain`s Right to Buy policy for public tenants, a sitting tenant purchase scheme (TPS) was finally implemented in 1997. Around 25,000 public rental flats were released for sale every year between 1998 and 2004. The policy was discontinued in 2002 and the last properties were sold in 2006. All the flats sold under the TPS scheme are therefore now well outside the resale restriction period. The HOS scheme had similar aims, namely to extend opportunities for lower income
households to attain home ownership but also to facilitate the release of public rental flats. This policy was introduced in the late 1970s but also discontinued in the early 2000s in the context of more depressed housing market conditions. Growing affordability problems and a period of severe house price inflation have contributed to a revived interest in such housing initiatives. It was therefore particularly timely to assess the impact of these previous schemes on the current pattern of housing opportunities. Objectives The original research proposal had four stated objectives: To assess the longer term impact of the TPS scheme on housing and social mobility as properties change hands on the secondary market

10
• To assess where former public rental properties fit in the housing market • To assess where HOS properties fit in the housing market
• To draw on the evidence of this study to inform current housing policy debate in Hong Kong
Research Methodology In pursuing these objectives the research aimed to explore the following issues: 1. What has been the pattern of turnover of TPS and HOS flats? 2. Who buys them on resale and what role do they play in wider property market?
3. What are the housing market aspirations and experiences of TPS and HOS purchasers? Has entry into home ownership been a positive experience?
4. What are the attitudes of current public tenants and those who have bought HOS and TPS towards assisted home ownership and sitting tenant purchase schemes?
5. What are the housing market trajectories of vendors of TPS and HOS properties?
The overall aim of this research project was to provide an up to date assessment of the role of ex HOS and TPS properties in the Hong Kong housing market. At the core of the empirical research were two main elements.
First, secondary data analysis was to include the use of different waves of the Census and the analysis of data from the EPRC database of property transactions in relation to TPS and HOS properties. This analysis aimed to provide an overall picture of property turnover over time and space (from 1991 t0 2015). The transaction data record when properties were sold, how many times they have changed hands and the purchase price. Additionally, a previous study of housing histories in Hong Kong was to be re-examined to add to the longitudinal perspective on the impact of HOS. This latter study was funded by the RGC and undertaken by the PI and Co-I in 2002. It examined some 2000 housing histories and trajectories in Hong Kong. The intention was to try to re-analyze this material and draw out any HOS or TPS purchasers for more detailed scrutiny. Part of the secondary analysis would also involve drawing together policy documents and related
data to provide a comprehensive review of the history and development of assisted home ownership policies in Hong Kong. This is provided in the next chapter.
The second and main element of the project was a Telephone Survey. This would cover a wider scope than the HKHA surveys in terms of types of household interviewed, properties surveyed and the questions asked. For example, it would include both TPS and HOS properties, will include early HOS sales and will encompass questions about motivations, aspirations and expectations of owners and tenants. It was to aim to achieve at least 1000 successful interview from a randomly selected sample of landline numbers. Within this sample at least 200 would be households currently occupying HOS properties and there would also be a quota of 200 for TPS properties. It was anticipated that achieving 200 HOS households would not be unduly difficult based on calculations of the
current housing stock profile. Achieving a similar number of TPS properties would, however, involve a considerable amount of sift sampling. This was taken into account in

11
the cost estimates for the survey. Three other groups were of interest. Any households living in former HOS and TPS properties would be included (open/secondary market purchasers); any households which had sold HOS and TPS properties (HOS/TPS vendors) would be included; the remaining sample would consist of current public rental households
In addition, some qualitative work on vendors, particularly of TPS properties, would be considered depending on the results of the survey. This might involve the use of personal contacts, revisiting previous datasets to identify eligible households and recruiting eligible households via the main survey. With this in mind, all respondents were to be asked if they would be willing to participate in further research.

12
Chapter 2
The Evolution of Assisted Home Ownership Policies in Hong Kong
Background The Home Ownership Scheme (“HOS”) was launched by the Hong Kong Government (“Government”) in 1976 and subsequently assigned to the Hong Kong Housing Authority (“HA”). HOS owners were not allowed to sell their flats on the open market in the first ten
years (subsequently reduced to five years in 1999) and had pay a land premium to the Government in doing so (HKHA, 2000). In this way, the Government entered into a shared-equity arrangement by holding an equity interest in the flat. The HOS programme also generated substantial revenue for the HA from successive sales in terms of increased funds to reinvest in more housing projects and thus subsidise the cost of public rental housing (“PRH”). In that sense, the model departs from the common conception of social policy, which categorises public housing as a form of unilateral transfer (Lee, 2003). The two founding aims of the HOS have remained unchanged over the last four decades:
(i) to encourage better-off tenants of PRH to vacate their flats for re-allocation to
families in greater housing need; (ii) to provide an opportunity for low and middle-income families to enter home
ownership (Working Party on Home Ownership [Working Party], 1977a).
The HOS typically offered PRH tenants (i.e., Green Form applicants) and eligible buyers (i.e., White Form applicants) with discounts of between 30 and 40 per cent below the market price. To date, subsidised sale flats accommodate around 2.13 million, or 29.2 per cent of people in Hong Kong (Census and Statistics Department, 2016f). The Working Party on Home Ownership 1976 – 2002
In March 1976, the then Financial Secretary Philip Haddon-Cave announced in his budget the Government’s intention to build and sell flats to PRH tenants. When they moved out, it would make room in low-cost rented accommodation for others more in need (The Office of the Financial Secretary, 1976). This was the Government’s original intention in launching the HOS (Working Party, 1977b). Subsequently, in view of public demand and reflecting broader policy shifts, the emphasis shifted to the “promotion of home ownership as a desirable social objective in its own right” (Working Party, 1977b, p2). In July 1976, Governor Murray MacLehose established the Working Party on Home Ownership, chaired by the Financial Secretary, to “work out a practical scheme for persons within and immediately above the income limits of eligibility for public housing,” including mortgage
facilities to assist them “towards becoming home owners” (Working Party, 1977b, p4). This was a key turning point in the broadening the scope of the HOS beyond PRH tenants to include families who were unable to buy a flat in the private market (Maclehose, 1976).

13
In November 1976, the Government accepted the Working Party’s recommendation to provide flats for families with an income of up to $3,500 a month, in addition to PRH tenants, irrespective of their income level, who were willing to surrender their existing PRH units (HKHA, 1978). Since then the thresholds have been regularly raised to “take account of increases in wages and capital costs” (HKHA, 1979). In March 1977, the Working Party stated that “public services and benefits have tended to be provided largely on the basis of means-tested need” and hence, “[t]he Government’s social and financial policies…have tended to favour the poor and overlook the lower-middle income group” (Working Party, 1977b, p6). This marked a significant shift in the Government’s housing philosophy. It was no longer only seeking to accommodate the poor but aimed to
provide affordable housing for rent and sale. It should be noted that the HOS was formulated in the context of a growing economy and the rising aspirations of the low to middle-income group who found housing unaffordable in the private market (Lee, 2003). The intention of the policy, as the Working Party put it, was to “help the lower middle income group to purchase their own homes on terms they could afford” (Working Party, 1977a). Property prices in the first phase of the HOS were around 40 per cent below market prices (Lee, 2003). The Working Party stated clearly that this group of families, who were not eligible for PRH, could afford neither open market property prices nor the terms of open market mortgage facilities, (which typically offered 10 to 12 year loans at an interest rate of over 10% per annum) (Working Party, 1977b). In view of this, the Government negotiated special mortgage
arrangements with leading banks on a standard repayment period of 15 years at interest rates between 7.5 per cent and 9 per cent per annum, and a minimum down payment of 10 per cent of the selling price (MacLehose, 1977, p.7; Working Party, 1977c). As at April 1992, the mortgages were extended to up to 20 years for up to 90 per cent or 95 per cent of flat prices for White Form and Green Form applicants respectively (HKHA, 1992). The Private Sector Participation Scheme: Increasing housing stock In March 1977, the Government entered into arrangements with local private developers to provide property for sale under the Private Sector Participation Scheme (“PSPS”) (Working Party, 1992). It served as an auxiliary programme of the HOS with the aim of increasing the
housing stock via the private sector to meet foreseeable demand, without putting additional burden on the HA that had already undertaken the task of building thousands of flats per year (Housing Branch, 1978a). The Government also intended to offer home buyers “more variety in the design, layout and standards of flats” and achieve “the most suitable private/public mix of housing in Hong Kong” (Housing Branch, 1978b). It invited bids from private estate developers for several additional sites to build flats for sale at fixed prices. In return, the Government guaranteed that “all flats would be bought either by eligible buyers nominated by the Housing Authority or by [the] Government itself” (Working Party, 1977a, p.11). By the termination of the scheme in November 2002, the PSPS had produced a total of about 98,000 flats in 47 projects (Transport and Housing Bureau [THB], 2014, p.28).
14
Home Ownership Scheme Phase 3B: Removing the land values Initially, the Government decided to sell HOS flats at cost to “recycle construction finance for the [HOS] scheme” and “create an increasing stock of housing” (Working Party, 1978b, p.5). The Government considered financial sustainability as a key element of the scheme because “it would be unjustifiable to subsidise one sector of the community at the expense of taxpayers” (Housing Branch, 1978b). This was in line with the Government principle of managing public finances prudently. Therefore, prior to HOS Phase 3B (i.e., before February 1982), on a cost-recovery basis, the selling prices of HOS flats included land, construction and development costs (HKHA, 2012).
Because the selling prices were still significantly lower than that of the open market, the Government imposed a resale restriction on HOS flats to minimise speculation. HOS owners could not sell their flats, except to the HA at their original purchase prices, in the first five years. After that, they would be free to sell the flats in the open market (Working Party, 1977c). However, in view of the sharp increase in land values and mortgage interest rates from 9 per cent to 17 per cent, the Government decided from Phase 3B onwards to exclude them from the selling prices to avoid “frustrat[ing] the social purpose” of the HOS (HKHA, 1982a, pp.55-60). Since then, the selling prices of HOS flats have been tied to the prevailing market value and affordability of the applicants, without any reference to cost (MacLehose, 1981; HKHA, 1982b, 1982c; HKHA, 2012).
With a reduction of almost half in selling prices, the HA were also compelled to revise the resale conditions for HOS flats to curb speculation. The resale condition of the first five years remained unchanged. However, the HA added a new condition that in the next five years, HOS owners could only sell their flats to the HA at a price corresponding to the selling price of a similar flat at that time. After ten years, they could sell their flats on the open market. But they would have to pay the Government a premium consisting of the current market value of the original discount (MacLehose, 1982). At first, returned HOS flats were offered for sale to eligible applicants on a first-come-first-served basis. They proved to be highly desirable and prospective buyers would queue up outside the HA for “several days and nights.” In October 1985 (i.e., from HOS Phase 8A
onwards), the HA decided that returned HOS flats would be sold together with new flats as part of the main sales exercise under which ballots would be held to decide successful applicants (HKHA, 1985a). The Government also amended the Housing Ordinance to ensure HOS flats were sold to and occupied by the target group, with a maximum penalty of $200,000 and one-year imprisonment for making a false declaration (HKHA, 1982a, pp. 55-60). The Long Term Housing Strategy 1987: Embedding home ownership in the Government’s policy Between the 1950s and 1970s, the Government concentrated on the provision of PRH. In the mid-1980s, the Government officially and decisively shifted its housing policy away from
providing PRH to “promote and satisfy the growing demand for home purchase” (HKHA, 1987a). Arguably, this shift reflected broader ideological currents at work internationally as

15
regards the primacy of the market in housing provision. And such a shift was most marked, and most influential, in the housing policy developments promoted by Margaret Thatcher`s first government in the UK. In the Long Term Housing Strategy published in April 1987 (“LTHS 1987”), the Government noted that “improved economic conditions in Hong Kong have brought with [Hong Kong citizens] rising expectations…including a growing aspiration to own rather than to rent [their homes]” (HKHA, 1987a). The LTHS 1987 stated clearly that “if the existing strategy and production programme remain unchanged…there is likely to be an over-provision of PRH, an under-provision of HOS/PSPS and an under-utilisation of the private sector’s resources” (HKHA, 1987a, p.3). The aim was to satisfy these demands with two fundamental principles:
“(i) to promote an equitable and efficient use of scarce resources in satisfying the housing need of all income groups; and (ii) to promote social stability and sense of belonging to Hong Kong by securing better living conditions for the needy and maximising the opportunity for home purchase” (Leung, 1993, p.267). For the first time, the Government set a home ownership target of 60 per cent by 1997 (HKHAa, 1987). Specifically, the Government intended to “expand the opportunities for assisted home purchase” by increasing the supply of HOS/PSPS flats and assisting home purchase in the private sector (HKHA, 1987a). For example, some public rental blocks were upgraded to HOS standards and made available for sale (HKHA, 1987a). In the fiscal year 1988/89, more than 5,000 PRH flats were transferred to the HOS as “a measure for the implementation of the
Long Term Housing Strategy” (HKHA, 1987b). Another measure was to prioritise the provision of new HOS projects in redevelopment sites (HKHA, 1987a).Between 1989 and 2001, when the housing philosophy of the LTHS 1987 was in effect, the HA produced 10,000 to 15,000 HOS flats annually. The only exceptions were1994/95 and 1998/99, when production was affected by the sluggish economy (see figure 2.1)

16
Note: Excluding PSPS
Source: Census and Statistics Department, 1987, 1989, 1996, 1998, 2004.
The Government also introduced the Home Purchase Loan Scheme (“HPLS”) as a supplementary scheme of the HOS and the PSPS to provide PRH tenants with an interest-free loan that amounted to 10 per cent of the flat price. This was repayable over a maximum period of 20 years and to be used to buy a flat in the private market (HKHA, 1987a). HPLS was an important measure to partially divert better-off PRH tenants to the private sector and reduce competition for HOS/PSPS flats (HKHA, 1987a). However, despite regular increase of the loan, and the introduction of a monthly subsidy for
36 months in 1991 (subsequently increased to 48 months in 1996) as an alternative option for which no repayment was required, response to the HPLS consistently fell short of the target (HKHA, 1994a, 1995, 1996b, 1997a). The down payment provided was not sufficient to keep up with the escalating property prices (HKHA, 1994b; Lee, 2003). By the time this scheme was terminated in 2002, it had only assisted 55,356 families (HKHA, 2003). Arguably, this rather disappointing result underlined the critical role of subsidised sale flats, the HOS and the PSPS, in promoting home ownership at affordable price. Incentivising PRH tenants to vacate their flats for re-allocation In the allocation of subsidised sale flats, PRH tenants were treated as a “special category,”
with half of the HOS/PSPS flats reserved for them. They were also given priority to choose flats in their preferred location, “on the basis of three Green Form applicants alternating with
0
5,000
10,000
15,000
20,000
25,000
Figure 2.1Production of HOS Flats (1979-2002)

17
one White Form applicant until the quota allocation for green form applicants is filled” (Working Party, 1977a, p.10; HKHA, 1984a, 1985b). Between 1978 and 1994, as of HOS Phase 16A, the Government recovered 73,400 PRH flats from Green Form applicants (Legislative Council, 1994). By 1996, around 95,000 PRH households had purchased flats under the HOS, with more than 80,000 PRH flats recovered for re-allocation to those who were seen as in more need (HKHA, 1996a). The Housing Authority pursued various measures to discourage better-off PRH tenants from remaining in the rental housing, such as the refusal of “providing [PRH tenants] larger accommodation for the relief of overcrowding,” without much success (HKHA, 1984, p.10).
The number of Green Form applicants was, however, actually low in the 1970s and mid-1980s (Working Party, 1977a). In HOS Phase 1, there were only 8,008 Green Form applicants, or just over a fifth (22.4 %) of the 35,822 applications (see detailed figures in Appendix 4).
A survey conducted by the authority in 1986 showed that 45 per cent of PRH households had an income exceeding the Waiting List Income limit but only a small number of such tenants moved out to other forms of accommodation (HKHA, 1987a). The fundamental problem was that despite the generous offer of the HOS, better-off PRH tenants had in reality little incentive to give up their secure tenure status and heavily-subsidised rent (less than 10% of their household income) and purchase a flat that could take up to 40 per cent of their household income.
HOS Phase 11A (i.e., May 1989) was a turning point as it saw a record number of applications at 108,569, an over-subscription rate of 18.5 times and a percentage of Green Form applicants at 44.1%. The selling prices were the reason. Between HOS Phase 5A and 10A (i.e., August 1983 and May 1988), the discount was set at 14 per cent to 27 per cent below the market price- for HOS Phase 11A, the discount ranged from 35% to 39% (HKHA, 1984, 2010). In 1991, the HA Home Ownership Committee again examined the pricing policy and concluded that “affordability to the target group should remain the primary consideration.” Subsequently, from HOS Phase 14B to 22B (i.e., August 1992 to January 2001), with few exceptions the discount fell within the range of 45 to 50 per cent of the market price “out of affordability consideration in a rising market” (HKHA, 1996a, 2010).
The Tenants Purchase Scheme As early as April 1984, the HA began to consider the proposal of allowing PRH tenants to “buy out” their existing units instead of granting them heavy subsidies indefinitely (HKHA, 1984). Again, like the tone and content of the LTHA, this had strong echoes of UK Government policy which at that time was vigorously promoting the ‘right to buy’ for British council tenants (Forrest and Murie, 1988). However, the proposal attracted criticism on its practicality from lawmakers, members of the HA Home Ownership Committee and other stakeholders in the 1980s (HKHA, 1984; HU, 1986).
The HA did not take the proposal any further until August 1989, when it established the Ad Hoc Committee on the Sale of Flats to Sitting Tenants to “study the feasibility of offering for

18
sale a selection of suitable rental public housing flats to its tenants.” The HA considered this as “a further opportunity for assisted home ownership for [PRH tenants].” The HA also noted that “the chances for these tenants to purchase a HOS/PSPS flats are not great because the number of applicants for these flats has always outstripped supply” (HKHA, 1989). A key driver for this policy was that the Government was very eager to achieve the core objectives of the 1987 Long Term Housing Strategy and to promote higher levels of home ownership with “innovative ways,”-recognising the land supply constraints and the limited financial resources likely to be available for additional new housing (i.e., HOS) projects. In August 1991, the HA piloted the Sale of Flats to Sitting Tenants Scheme (“SFSTS”). The Authority offered sitting PRH tenants the opportunity to buy their flats at a discount of 40 per
cent below market price, in addition, there were further adjustments in accordance with the design, condition and age of the blocks, to “produce more affordable prices” and “reach a broader range of public housing tenants” (Planning, Environment and Lands Branch [PELB], 1991; Home Affairs Branch, 1991; Tsao, 1991). As a consequence, the prices were around half of that of HOS and around a third of that of newly-completed private properties in the same district (PELB, 1991). The pilot scheme involved about 6,900 flats in 11 selected blocks in seven estates (Legislative Council, 1991). The sale of flats in a selected block would only proceed if more than 50 per cent of the tenants in that block opted to buy (Tsao, 1991). However, the HA only received 510 applications, or 7.4 per cent of the selected PRH flats, and in none of the blocks was the number of applications sufficient to reach the required 50 per cent take-up rate for the sale to proceed (Legislative Council, 1991). It was again apparent
that PRH tenants had little incentive to purchase their flats because they had secure tenure and low rent. The purchase of a flat, even with the Government’s assistance, would take up a considerably larger share of the household income than was spent on renting as a public tenant (Ho, 1991; HKHA, 1992). More importantly, this increase in housing expenditure would not bring with it a corresponding improvement in living conditions to sitting tenants (HKHA, 1996a).They would be simply paying more to live in the same flat. In an evaluation report in April 1992, the HA suggested that the prices should be “substantially reduced” and proposed a new pricing method that took into consideration the depreciated replacement costs, land cost and locational differences of the blocks. This would produce prices in the range of 80 to 85 per cent discount on market value of the flats and absorb, on
average, less than 30% of PRH tenants’ household income (HKHA, 1992, 1996a). But the Government did not support the proposal “because the proposed terms of offer were not considered sufficiently attractive to achieve a high take-up rate” (HKHA, 1996a, p.41). It seemed it was difficult to construct an offer which was too good to refuse for public rental tenants in Hong Kong. Although the SFSTS did not succeed, it once again demonstrated the Government’s policy objective to achieve a better allocation of housing resources through encouraging better-off PRH tenants to own their flats rather than to remain in the public rental sector. This evaluation of the SFSTS also paved the way for further reducing the selling prices in 1997. When the then Chief Executive Tung Chee-wah assumed office in July 1997, he announced
the ambitious aim of achieving a home ownership rate of 70 per cent by 2007 (HKHA, 1997b). Given the over-subscription in the sale of HOS/PSPS flats, in December 1997, the Government
19
finally launched the Tenant Purchase Scheme (“TPS”). The policy objectives was to widen the choices available to PRH tenants and provide an extra rung on the housing ladder (HKHA, 1997b, pp. 1-2). The TPS aimed to enable 250,000 families living in PRH to buy their flats at affordable prices by 2007 (HKHA, 1999, p.72). With this new sitting tenant purchase scheme the HA adopted the “adjusted replacement cost” approach, in which “the price of a flat is based on the present day cost of replacing it,” with adjustments in accordance to age, location and other relevant factors. This led to a discount equivalent to 70 per cent of assessed market value. PRH tenants who purchased their flats within the first year of the TPS were given an additional discount. As a result, TPS flats could be 12 per cent of the market value if the PRH tenants took full advantage of this
incentive (HKHA, 1997b, p.4). The HA also offered TPS buyers 100 per cent mortgages with a maximum repayment period of 25 years (HKHA, 1997. p.5). The first phase of TPS offered 27,000 flats in six estates for sale. This policy proved considerably more successful than previous policy initiatives with 75 per cent of eligible tenants buying their flats by the end of March 2000. Between 1998 and 2005, a total of around 184,000 flats in 39 estates were offered for sale. As at May 2016, a total of about 132,800 tenants, over 70 per cent, have purchased their flats under the TPS. Of those, 114,500 tenants, or 86 per cent, bought the flats under the full special credit and thus only paid 12 per cent of the market value (HKHA, 1997. p.4; Legislative Council, 2012, 2016).
The Secondary Market Scheme and Resale Relaxation: Increasing turnover of subsidised flats In June 1997, the HA launched the Secondary Market Scheme which aimed to “increase turnover and efficiency in the utilisation of housing resources” (HKHA, 1996a, p.16) From June 1999, HOS and PSPS owners could offer to sell their flats, from the fourth year after the purchase, to an eligible person (i.e., PRH tenants and Green Form certificate holders) in the secondary market at a negotiated price without the payment of a premium (HKHA, 1996a, p.15; 1998, pp. 69-71). At the same time, the resale restriction period was reduced from ten to five years to encourage HOS and PSPS owners who could afford private sector housing to resell their HOS flats in the open market for better utilisation of scarce housing resources
(HKHA, 1996a, p.14; 1997b, p.5; 1998, pp.69-71; 2000, p.63). This measure doubled the number of HOS and PSPS eligible for resale (HKHA, 2000, p.63).The HA also relaxed the eligibility of White Form applicants. With effect from HOS Phase 21B (i.e., December 1999) onwards, White Form applicants only needed to have lived in Hong Kong for over seven years and for their stay in Hong Kong to be unconditional. Family members on the same application were no longer required to meet residency requirements (HKHA, 2001, pp.72-76). The Economic downturn: 2003 – 2011 Between 1978 and 2001, over 300,000 families became home owners through the HOS and the PSPS. It had aimed to promote the mobility of PRH tenants and had released over 150,000
PRH units for re-allocation to those in greater need. The proceeds from HOS sales were also

20
a major source of revenue for the HA to finance other housing programmes, in particular public rental housing (HKHA, 2001, pp.2-3). The 1997 Asian Financial Crisis, however, impacted heavily on the economy of Hong Kong. In response, the HA adjusted its home ownership programme by transferring around 16,000 HOS units to rental use between 2000/01 and 2003/04, implementing a six-month moratorium on HOS sale in July 2000 and limiting the sale of HOS flats to no more than 20,000 units a year from 2001/02 to 2003/04 (HKHA, 2001, pp.3). In September 2001, the then Chief Secretary for Administration Donald Tsang delivered a Statement on Housing and asked the HA to place a moratorium on HOS sales for ten months. The Government noted that there was an over-supply in the housing market and “a significant overlap between the target group
of HOS and that of the private residential market. According to the Government’s analysis, “the heavily subsidised HOS has begun to crowd out private housing in a slow market” (Tsang, 2001, pp. 2-3; HKHA, 2011, pp.1-8). The demand for HOS was indeed decreasing from 1997/98 onwards (see Table 2.1). For instance, in HOS Phase 19A (i.e., June 1997), over 114,000 applications were received. The number dwindled to less than 19,000 in HOS Phase 23A (i.e., May 2001). Likewise, the over-subscription rate went down from ten to two times (HKHA, 2001, pp.6-7). In HOS Phase 24A (i.e., September 2002), there were less than 4,800 applications and only 54 per cent of the flats were sold (HKHA, 2001, pp.3). Inevitably, the significant drop in property prices diverted some potential HOS buyers to the private housing market. As the Chief Secretary for
Administration argued, “a considerable number of potential HOS buyers could afford buying private housing at affordable prices” (HKHA, 2001, pp.1-8).

21
Table 2.1 Number of Applications for HOS Flats (1995 – 2002)
Phase
(Date)*
Number of
Applicants
(Green Form)
Number of
Applicants
(White Form)
Number of Applicants (Total)
Over-
subscription
17A (Apr 95)
24,604 (31%) 53,984 (69%) 78,588 9 times
17B (Nov 95)
16,743 (32%) 36,338 (68%) 53,081 10 times
18A (Apr 96)
21,829 (42%) 29,955 (58%) 51,784 12 times
18B (Aug 96)
19,946 (38%) 32,492 (62%) 52,438 7 times
18C (Jan 97)
31,485 (36%) 55,117 (64%) 86,602 13 times
19A (Jun 97)
45,143 (40%) 68,875 (60%) 114,018 10 times
19B (Oct 97)
32,655 (36%) 56,827 (64%) 89,482 8 times
19C (Mar 98)
24,038 (31%) 52,994 (69%) 77,032 7 times
20A (Nov 98)
19,312 (45%) 23,745 (55%) 43,057 5 times
20B (Mar 99)
11,276 (41%) 16,145 (59%) 27,421 4 times
21A (Aug 99)
12,693 (41%) 18,368 (59%) 31,061 3 times
21B (Dec 99)
6,328 (23%) 20,680 (77%) 27,008 3 times
22A (May 00)
4,916 (17%) 23,872 (83%) 28,788 6 times
22B (Jan 01)
5,103 (20%) 20,515 (80%) 25,618 3 times
23A (May 01)
4,862 (26%) 14,017 (74%) 18,879 2 times
24A (Sep 02)
1,565 (33%) 3,213 (67%) 4,778 1 time
Note: * The closing date of application
Source: Hong Kong Housing Authority; Census and Statistics Department
22
Terminating the HOS: The Housing Market Stabilisation Plan 2002 When the HA resumed the sale of HOS flats in August 2002 (i.e., HOS Phase 24A), it received only 5,117 applications against an offer of 2,451 flats (HKHA, 2011, pp.6-7). It was the lowest subscription rate in the 25-year history of the HOS. In a subsequent report, it noted that there was “a major improvement in buyers’ affordability in purchasing properties in the private market as a result of the sharp downward adjustment of property prices [by over 60% from the peak in 1997] and record low mortgage rate.” Mortgage payment to median household income ratio dropped from 82.2 to 23.1 per cent between the third quarter of 1997 and the second quarter of 2002 (Suen, 2002, p. 10; HKHA, 2002, p.3). Thus, in November 2002, the Government announced the Housing Market Stabilisation Plan and officially repositioned its
housing policy. First, the Government decided to “withdraw from its role as property developer by halting the production and sale of subsidised flats and reduce radically its share in the overall housing production” (Suen, 2002, p.3). It terminated the production and sale of the HOS, as well as the PSPS and the TPS, indefinitely from 2003 onwards (Suen, 2002, p.10; HKHA, 2002, pp.1-2) (Legislative Council, 2002). The newly-completed and on-going HOS projects were either transformed to PRH and government quarters, or sold to private property developers. Secondly, the Government shifted its stance on home ownership. The new policy position was that it now considered home ownership as “a matter of personal choice and affordability”
rather than “a desirable social objective” -the Government’s guiding housing philosophy coined in the 1970s (Suen, 2002, pp.3-4). The focus of housing policy was shifted to “assist low-income families which cannot afford private rental housing” and to withdraw as far as possible from housing assistance programmes other than land supply and provision of rental assistance to minimise intervention in the market. And the long-term target of achieving 70 per cent home ownership by 2007 was abandoned (Suen, 2002, pp. 4-6; HKHA, 2012). As an example of this new approach, in January 2003 the HPLS was replaced with a similar Home Assistance Loan Scheme (“HALS”) with the intention to “allocate the limited public resources more effectively…and retreat from direct involvement in the market” (HKHA, 2002). However, in July 2004, the HA terminated the HALS to “reaffirm a clear and coherent message of minimising market intervention” and “concentrate its limited resources on providing PRH to
those in need” (HKHA, 2004a, 2004b). The HA nonetheless relaxed resale restrictions of HOS flats. From June 2005 onwards, after two years from the date of first assignment, HOS owners could choose between offering the flats to the HA for buyback, or apply to pay the premium to remove the resale restrictions of the flats in order to sell them in the open market (HKHA, 2010). As at March 2010, the HA had sold 320,047 HOS flats, with 4,077 surplus HOS flats to be sold (HKHA, 2010, p.5). Where we are now? Revitalisation of the HOS: Providing reasonably priced small and medium flats With the recovery of the economy and significant rise in property prices since 2003, there
have been increasing calls to revitalise the HOS and the TPS to assist low and middle-income families to achieve home ownership. As early as July 2008, the Legislative Council Panel on
23
Housing passed a motion to “request the HA to resume the sale of PRH flats and HOS flats as early as possible, and formulate a timetable for implementation, so as to improve people’s livelihood” (Legislative Council Panel on Housing, 2012a, p.3). However, the Government continued to defend the post-2002 housing policy and stated clearly that “the cessation of the HOS was a significant decision and [the Government] will not re-enter the market hastily” (Legislative Council Panel on Housing, 2010b, pp.2-3). The Government stressed its role in facilitating market allocation rather than producing new flats to the market. A case in point was the revitalisation of the HOS Secondary Market in June 2010. The Government aimed to increase the overall supply of flats and address public demand for home ownership through “a market-based solution” (Legislative Council Panel on
Housing, 2010, pp.2-3). This included extending the mortgage default guarantee period to 30 years for buyers of HOS units, streamlining the administrative arrangement and implementing the Premium Loan Guarantee Scheme by the Hong Kong Mortgage Corporation which helped HOS owners to finance the premium payment (Legislative Council Panel on Housing, 2010a, p.4). Nevertheless, between May and September 2010, the Government conducted a public consultation exercise to gauge views of stakeholders and members of the public on the issue of subsidising home ownership. The public consultation revealed that a majority of the public was concerned about the rise in property prices and the difficulties in purchasing their first flats (Transport and Housing Bureau, 2010a, Legislative Council Panel on Housing, 2017, p.4).
This paved the way to provide political justification for the revitalisation of the HOS. In October 2011, the then Chief Executive Donald Tsang, for the first time, officially admitted that private property prices were exceeding people’s affordability and leading to higher risks in home purchase (Tsang, 2011). Between August 2010 and August 2011, property prices increased by almost 18 per cent. The mortgage to income ratio reached 47 per cent in the second quarter of 2011. Thus, the Chief Executive announced the resumption of the HOS to provide affordable small and medium flats for “families whose household income exceeds the limits for PRH application but who may not be able to afford owning a flat.” The new HOS targeted families with a monthly household income under $30,000, mainly first-time home buyers (Legislative Council Panel on Housing, 2010a, p.4). It was stated that the new scheme
aimed to “serve as a buffer when the private residential property market is in disequilibrium due to unbalanced demand and supply, as well as internal and external macroeconomic factors such as low interest rates and quantitative easing measures taken by other economies” (Tsang, 2011, p.17). Under this philosophy, the HA would only provide new HOS flats for sale “when the private residential property market cannot provide enough reasonably priced small and medium flats” (Tsang, 2011). Again, the Government no longer emphasised the promotion of home ownership as a desirable social objective in itself. This more muted commitment to home ownership translated into a more modest HOS which was nowhere near the scale of the pre-2002 version. Only around 2,500 to 6,500 new HOS flats would be produced over a four-year period, which was far less than that of around
16,000 HOS flats produced annually before the repositioning of the housing policy in 2002 (Legislative Council Panel on Housing, 2010a).

24
In January 2014, the Government adopted a housing supply target of a total of 470,000 units in the coming ten years, and aimed to produce 8,000 HOS units per year (the targets were later adjusted to 480,000 and 9,000 respectively in December 2014) (Leung, 2014; Transport and Housing Bureau, 2014, pp. 1-2). Subsequently, in October 2014, the HA set the monthly income limit for family applicants for the sale of HOS flats in that year to $46,000, excluding statutory contributions under the Mandatory Provident Fund Scheme (HKHA, 2014a). The first batch of the new HOS flats comprised of 2,160 flats in five developments. It was opened for sale in December 2014, with the allocation ratio for Green Form and White Form applicants at 60:40, with average selling prices of 30 per cent below the market values (HKHA, 2014b). The HA received around 135,000 applications, with an over-subscription rate of 62.5 times. However, only 11,500, or 8.5 per cent were Green Form applicants. In other words,
around 123, 500 White Form applicants were fighting for the 864 flats reserved for them- 143 applicants per flat (HKHA, 2015b). The second batch of the new HOS offered 2,657 flats in two developments in February 2016. The HA received around 52,800 applications, with a much lower over-subscription rate than the first batch at 20 times. The new HOS has in fact continued to attract very few PRH tenants, with only 4,100, or 7.8 per cent Green Form applicants (HKHA, 2016a, p.1). The Government has tried to further incentivise PRH tenants to vacate their units for re-allocation and shorten the waiting list of PRH. In January 2015, in the Chief Executive’s Policy Agenda, the Government for the first time explicitly stated that the provision of subsidised
home ownership flats on top of PRH served to “build a progressive housing ladder” (Leung, 2015, p.26). With this objective in mind, in October 2016, the HA launched the Green Form Subsidised Home Ownership Pilot Scheme (“Pilot Scheme”) and offered 857 flats at a discount of 40 per cent below the market price-a higher discount rate than that of the HOS (HKHA, 2016b, 2016c, 2016d). The HA received around 16,200 applications, with an over-subscription rate much higher than that of the new HOS at 19 times (HKHA, 2016d). In fact, the number of applications was more than the total number of Green From applications of the two batches of the new HOS. The Government nonetheless has also provided more assistance to the low and middle-income families who were not eligible for PRH (i.e., White Form applicants). In January 2013,
the HA piloted an Interim Scheme to Extend the HOS Secondary Market to White Form Buyers (“Interim Scheme”) before the new HOS flats were released to the market. A quota of 5,000 was issued in two batches in May and December 2013 respectively (Transport and Housing Bureau, 2014). The HA received around 66,000 applications. As at November 2014, some 2,260 White Form applicants had purchased HOS flats without paying land premium through the Interim Scheme (Legislative Council, 2014). Another round of the Interim Scheme with a quota of 2,500 was launched in August 2015 (Transport and Housing Bureau, 2014; 2016). The HA received around 43,900 applications (HKHA, 2015a). Arguably, these figures demonstrate the significant need to provide subsidised, reasonably priced housing for the so-called “sandwich class” of Hong Kong. Against that background the HA intended to conduct a full review of the Interim Scheme in the first half of 2017 to decide whether the pilot Interim
Scheme should become a regular element of housing policy (HKHA, 2016e).

25
Chapter 3
Analysis of Secondary Data
Analysis of Property Transaction Database One element of the secondary analysis of this project was the utilisation of the EPRC database of property transactions to examine the pattern of transaction, particularly with regard to how many HOS, PSPS, TPS properties have changed hands. The EPRC database is a
commercially available database which is based on the property transaction records from the Land Registry and includes all property transaction registered with the Lands Registry from the year 1991 to 2015. Data include the full address, date of transaction, transaction price, area of the unit and other facilities. However, information on buyers has been removed for privacy reasons and information about the properties (e.g. the number of rooms) is not complete. In the course of this research we encountered two particular problems when using the database to examine the patterns of turnover of TPS, PSPS and TPS. The first issue is that the transaction data can only be traced back to 1991. Whilst this is not an issue for TPS as the scheme only began in 1998, it poses some challenges for the analysis of HOS / PSPS,
particularly for those flat that were developed before 1982. The second problem is that it is not easy to differentiate the sale of HOS. PSPS and TPS flats to the open and secondary market. HOS developed after 1981 (phase 3B and after) could only be sold back to Hong Kong Housing Authority in the first 10 years of occupation-which proved to be unpopular and hence the EPRC data should be able to catch the transactions of such flats. To achieve this we have had to undertake additional work in order to estimate the volume of transaction of HOS development from phase 1 to 3A (from 1978 to 1991) and a total of 17313 flats (out of a total of 332,604 flats that were developed before 2015). A random sample of 300 flats (1.7%) were selected by proportional sampling and land search on each of the properties in this sample was conducted to assess the pattern of transactions of such flats before 1991.
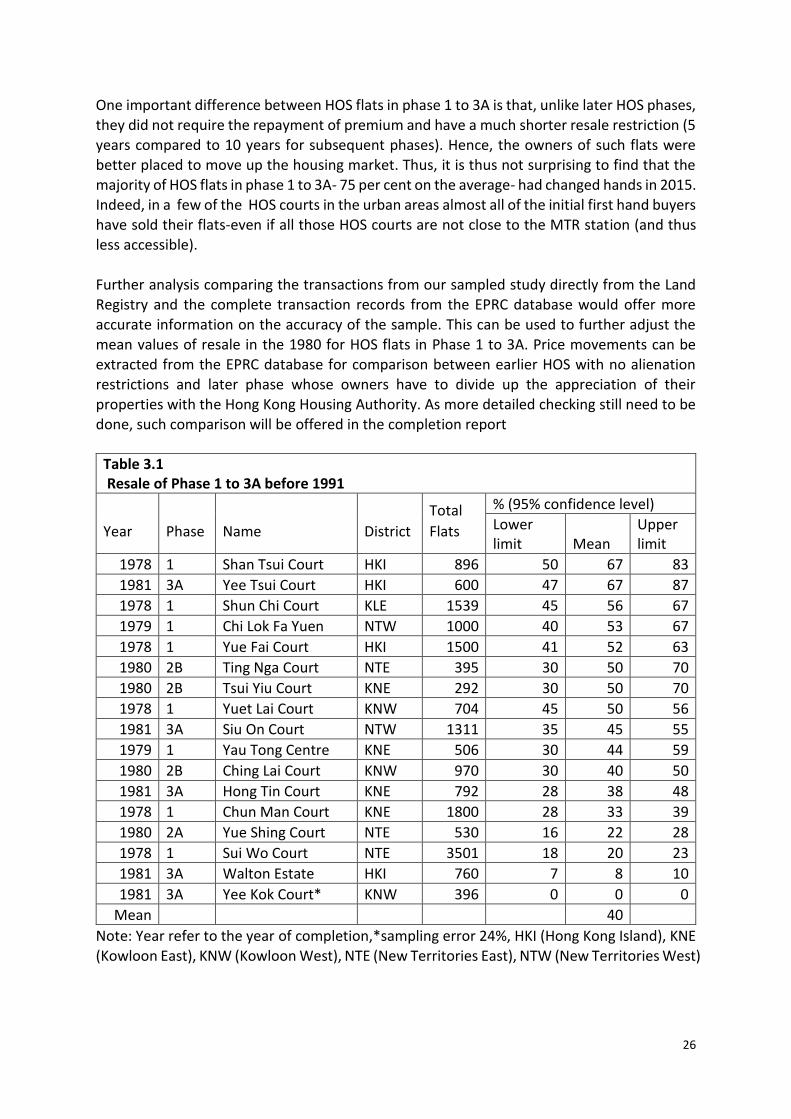
Table 3.1 shows the proportion of flats in the HOS phase 1 to 3A, which were developed between 1978 to 1981 that have been resold to the market before 1991. On average, 40 per cent of the flats have been resold in the 1980s. In general, it appears that it was HOS flats in the urban areas that have a higher resale rate. This is not surprising as the demand for flats in the urban areas is higher and the price increase has been more substantial. However, there is no obvious pattern in relation to the geography of resale. Although the HOS courts which have the highest proportion of resale are on Hong Kong Island, those with the lowest proportion of resale are also located there. There are also HOS courts in the New Territories, like Chi Lok Fa Yuen in Tuen Mun and Ting Nga Court in Tai Po, which were rather remote in the 1980s, that have a higher than average resale rate. Perhaps their initial sale value was low
and hence this gave more scope for subsequent appreciation and that pushed up the incentive to sell.
26
One important difference between HOS flats in phase 1 to 3A is that, unlike later HOS phases, they did not require the repayment of premium and have a much shorter resale restriction (5 years compared to 10 years for subsequent phases). Hence, the owners of such flats were better placed to move up the housing market. Thus, it is thus not surprising to find that the majority of HOS flats in phase 1 to 3A- 75 per cent on the average- had changed hands in 2015. Indeed, in a few of the HOS courts in the urban areas almost all of the initial first hand buyers have sold their flats-even if all those HOS courts are not close to the MTR station (and thus less accessible). Further analysis comparing the transactions from our sampled study directly from the Land Registry and the complete transaction records from the EPRC database would offer more
accurate information on the accuracy of the sample. This can be used to further adjust the mean values of resale in the 1980 for HOS flats in Phase 1 to 3A. Price movements can be extracted from the EPRC database for comparison between earlier HOS with no alienation restrictions and later phase whose owners have to divide up the appreciation of their properties with the Hong Kong Housing Authority. As more detailed checking still need to be done, such comparison will be offered in the completion report
Table 3.1 Resale of Phase 1 to 3A before 1991
Year Phase Name District
Total
Flats
% (95% confidence level)
Lower limit Mean
Upper limit
1978 1 Shan Tsui Court HKI 896 50 67 83
1981 3A Yee Tsui Court HKI 600 47 67 87
1978 1 Shun Chi Court KLE 1539 45 56 67
1979 1 Chi Lok Fa Yuen NTW 1000 40 53 67
1978 1 Yue Fai Court HKI 1500 41 52 63
1980 2B Ting Nga Court NTE 395 30 50 70
1980 2B Tsui Yiu Court KNE 292 30 50 70
1978 1 Yuet Lai Court KNW 704 45 50 56
1981 3A Siu On Court NTW 1311 35 45 55
1979 1 Yau Tong Centre KNE 506 30 44 59
1980 2B Ching Lai Court KNW 970 30 40 50
1981 3A Hong Tin Court KNE 792 28 38 48
1978 1 Chun Man Court KNE 1800 28 33 39
1980 2A Yue Shing Court NTE 530 16 22 28
1978 1 Sui Wo Court NTE 3501 18 20 23
1981 3A Walton Estate HKI 760 7 8 10
1981 3A Yee Kok Court* KNW 396 0 0 0
Mean 40
Note: Year refer to the year of completion,*sampling error 24%, HKI (Hong Kong Island), KNE (Kowloon East), KNW (Kowloon West), NTE (New Territories East), NTW (New Territories West)

27
Table 3.2 Resale of Phase 1 to 3A before 2015
Year Phase Name District
Total
Flats
% (95% confidence level)
Lower limit Mean
Upper limit
1978 1 Shan Tsui Court HKI 896 81 93 105
1979 1 Yau Tong Centre KNE 506 71 89 107
1981 3A Yee Tsui Court HKI 600 71 89 107
1978 1 Shun Chi Court KLE 1539 77 88 99
1980 2B Ching Lai Court KNW 970 72 87 101
1981 3A Walton Estate HKI 760 66 83 101
1978 1 Yue Fai Court HKI 1500 68 81 94
1979 1 Chi Lok Fa Yuen NTW 1000 64 80 96
1980 2A Yue Shing Court NTE 530 57 78 98
1981 3A Hong Tin Court KNE 792 59 77 95
1978 1 Yuet Lai Court KNW 704 57 75 93
1978 1 Chun Man Court KNE 1800 59 70 81
1981 3A Siu On Court NTW 1311 56 70 84
1980 2B Ting Nga Court NTE 395 42 67 92
1980 2B Tsui Yiu Court KNE 292 42 67 92
1978 1 Sui Wo Court, NTE 3501 55 63 71
1981 3A Yee Kok Court KNW 396 12 17 22
Mean 75
Note: Year refer to the year of completion,*sampling error 24%, HKI (Hong Kong Island), KNE (Kowloon East), KNW (Kowloon West), NTE (New Territories East), NTW (New Territories West) The cut-off date of the EPRC database at 1991 also poses minor problems for HOS flats of phase 12A to 13C which were developed from 1990 to 1991. Because the transaction dates vary not all transaction (between the first owners and the Hong Kong Housing Authorities) are captured by the EPRC database. This would affect the differentiation of first hand transactions and subsequent resale. Again, more detailed checking is still needed and the
further analysis will be added to the completion report and related papers. Secondary data analysis of Census Previous GRF projects by the PI and Co-I have undertaken analysis of secondary data from the Hong Kong Population Census. Micro-datasets of the population census 1981 to 2011 were interrogated to extract information on tenure and age. Such data have been re-analysed for this PPR project to show the change in income profile in the HOS sector. It is evident that over the three decades of the 1980s, 1990s and 2000s, HOS has emerged from being a minority tenure in the late 1970s to represent a sizeable tenure. By early 2010
16% of households were in the HOS sector (figure 3.1). In fact, HOS was the significant contributor to the increase in the overall level of homeownership in the 1990s when private

28
0
5
10
15
20
25
30
35
40
1981 1986 1991 1996 2001 2006 2011
Pri-own HOS Pub-rent Priv-rent other
homeownership rose only marginally. This rapid increase of HOS over the 1980s and 1990s reflects the rapid expansion of the scheme with an average of about 15,000 new HOS flats being constructed annually during that period. In fact, the construction of new HOS flats slowed down in late the 1990s, despite the ambitious plan of the first Chief Executive of HKSAR, Tung Chi Hwa to boost public home ownership. The continual momentum of publicly assisted homeownership was then being supported by the introduction of the Tenant Purchase Scheme in 1998 (the statistics shown in the figure incorporate TPS in HOS). Hence, at the same time (the late 1990s), there was a substantial reduction of the relative size of public renting, from 35 per cent in 1996 to 30 per cent in 2001.
Figure 3.1
Housing Tenure Changes (1981-2011)
Source: PI and Co-I’s analysis of Census waves Note: HOS includes TPS
If we look into the detailed distribution of housing tenures by income deciles, there were subtle changes in the income profile of HOS owners from the 1980s to the mid 2000s. The tenure distribution of income decile groups (households of that census years are aligned with their household income and the households are divided into 10 groups of equal size) were extracted from the 1981 to 2006 censuses. Income decile groups which are over-presented are shaded in table 3.3. It indicates that although the relative size of HOS was small in the early 1980s, households in the top 40 per cent of the income spectrum were more likely to buy HOS than their counterparts who were lower down in the income spectrum. The late 1970s was a housing boom period and house prices were at their historical peak (HOS price is determined with reference to general market price in the private sector) and hence the risk
of home purchaser was perceived to be high. Thus, it is not surprising that only the more affluent households would consider buying.
HOS
Priv Owned
Pub Rent
Priv Rent
Other
29
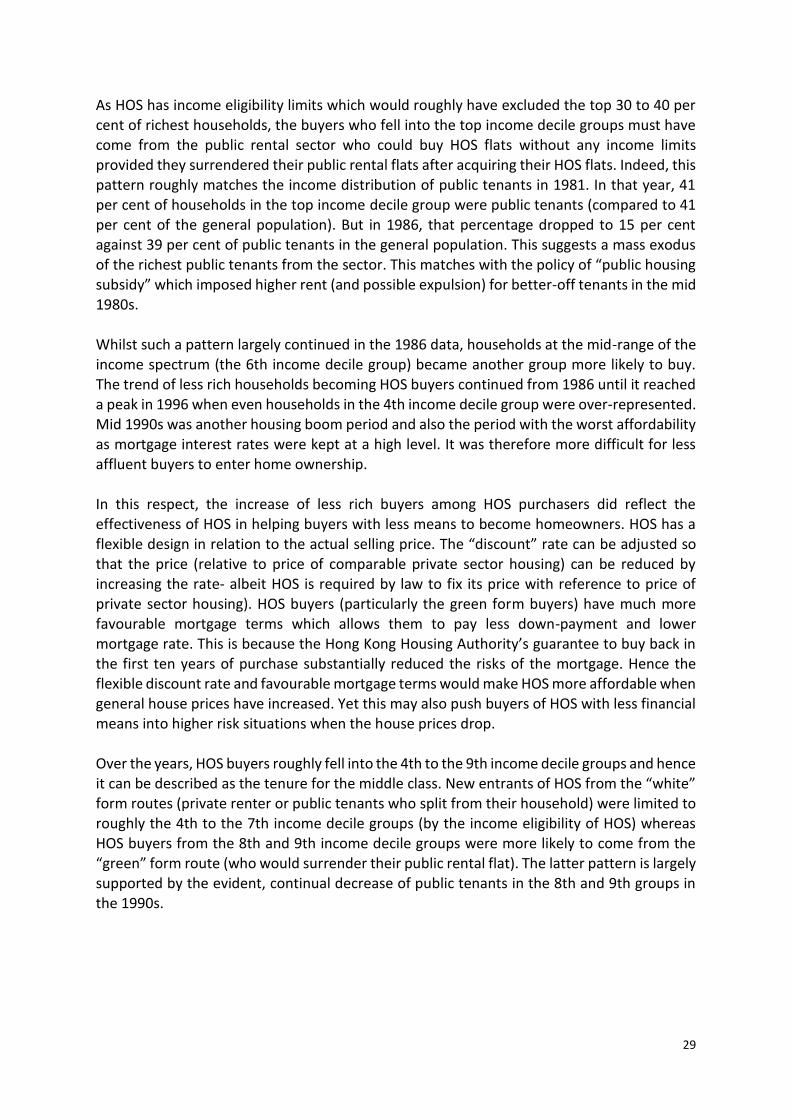
As HOS has income eligibility limits which would roughly have excluded the top 30 to 40 per cent of richest households, the buyers who fell into the top income decile groups must have come from the public rental sector who could buy HOS flats without any income limits provided they surrendered their public rental flats after acquiring their HOS flats. Indeed, this pattern roughly matches the income distribution of public tenants in 1981. In that year, 41 per cent of households in the top income decile group were public tenants (compared to 41 per cent of the general population). But in 1986, that percentage dropped to 15 per cent against 39 per cent of public tenants in the general population. This suggests a mass exodus of the richest public tenants from the sector. This matches with the policy of “public housing subsidy” which imposed higher rent (and possible expulsion) for better-off tenants in the mid 1980s.
Whilst such a pattern largely continued in the 1986 data, households at the mid-range of the income spectrum (the 6th income decile group) became another group more likely to buy. The trend of less rich households becoming HOS buyers continued from 1986 until it reached a peak in 1996 when even households in the 4th income decile group were over-represented. Mid 1990s was another housing boom period and also the period with the worst affordability as mortgage interest rates were kept at a high level. It was therefore more difficult for less affluent buyers to enter home ownership. In this respect, the increase of less rich buyers among HOS purchasers did reflect the effectiveness of HOS in helping buyers with less means to become homeowners. HOS has a
flexible design in relation to the actual selling price. The “discount” rate can be adjusted so that the price (relative to price of comparable private sector housing) can be reduced by increasing the rate- albeit HOS is required by law to fix its price with reference to price of private sector housing). HOS buyers (particularly the green form buyers) have much more favourable mortgage terms which allows them to pay less down-payment and lower mortgage rate. This is because the Hong Kong Housing Authority’s guarantee to buy back in the first ten years of purchase substantially reduced the risks of the mortgage. Hence the flexible discount rate and favourable mortgage terms would make HOS more affordable when general house prices have increased. Yet this may also push buyers of HOS with less financial means into higher risk situations when the house prices drop.
Over the years, HOS buyers roughly fell into the 4th to the 9th income decile groups and hence it can be described as the tenure for the middle class. New entrants of HOS from the “white” form routes (private renter or public tenants who split from their household) were limited to roughly the 4th to the 7th income decile groups (by the income eligibility of HOS) whereas HOS buyers from the 8th and 9th income decile groups were more likely to come from the “green” form route (who would surrender their public rental flat). The latter pattern is largely supported by the evident, continual decrease of public tenants in the 8th and 9th groups in the 1990s.

30
Table 3.3 Housing Tenure by Income Decile
Source: PI and Co-I’s analysis of Census waves Note: percentages across the row do not add up to 100% as Private Renting and Others are not shown, shaded cells are income decile groups over-represented in the tenure group.
Income Decile / Year
HOS % PRIVATE OWNERSHIP % PUBLIC RENTING %
81 86 91 96 01 06 81 86 91 96 01 06 81 86 91 96 01 06
Bottom 0.1 0.8 2.6 4.5 9 12 16 24 29 30 34 38 23 23 36 41 40 40
02 0.1 1.2 3.2 5.5 8 9.6 15 19 20 22 20 20 33 33 44 49 51 55
03 0.1 1.7 4.6 8.2 11 13 15 19 22 23 22 23 40 40 48 48 45 47
04 0.2 2.8 7 11 15 15 15 20 24 25 23 24 47 47 48 46 43 45
05 0.4 3.3 9 12 20 18 17 22 27 27 27 29 44 44 46 44 36 38
06 0.6 4.9 10 14 21 21 20 24 32 32 33 34 42 42 40 36 29 30
07 0.9 6.5 11 14 23 23 23 27 36 33 36 37 42 42 36 34 26 25
08 1.0 6.5 11 14 21 22 27 33 42 39 43 44 38 38 32 29 20 17
09 1.3 6.6 10 14 18 18 33 39 49 46 51 53 31 31 25 21 13 10
Top 1.1 4.5 5 6 7 7 46 32 57 56 64 64 41 12 9 7 3 3
All 0.7 4.5 8 11 16 16 27 32 37 36 37 38 41 39 40 38 32 32

31
Chapter 4
Findings from the Telephone Survey
Introduction
A telephone survey encompassing different groups in the Hong Kong housing sector was a central component of the project. The survey aimed for 1000 achieved interviews and was
undertaken between February 3rd and March 23rd, 2017. A small follow up section was also carried out in April, 2017. A total of 1033 successful interviews were achieved with Cantonese speaking Hong citizens aged 18 or above. The method was a random telephone survey conducted by real interviewers. To fulfil the objectives of the study a quota was set to achieve at least 200 interviews with HOS purchasers and 200 interviews with TPS purchasers. This latter group was a greater challenge given the relatively small numbers in the total population. A short pilot study had been used to estimate the penetration rate for TPS buyers. Both quotas (HOS and TPS) were achieved. Those living in private rental housing and those in private housing were excluded following the initial set of filter questions. The exceptions were private owners who were identified as previously owning HOS or TPS properties. A total of 102 households fell into this category. The remaining households in the overall sample were
public sector tenants. The survey was therefore focused on those households which have taken advantage of assisted home ownership schemes and households who could take advantage of such measures in the future-ie. public sector tenants. It also included those who had bought properties sold under such schemes on the open market. As shown in table 4.1, some 10 per cent of households fell into this latter category with current public sector tenants accounting for 44 per cent of the total interviews. Among HOS households who bought directly from the HKHA, 41 per cent were white form and 59 per cent green form purchasers.
Table 4.1 Breakdown of Sample by Key Housing Groups
Housing Group N= %
1.TPS households 200 19.4
2.HOS white form 89 8.6
3.HOS green form 129 11.6
4.HOS open or secondary market 65 6.3
5.Previous HOS/TPS purchasers 102 9.9
6.Public housing tenants 457 44.2
All groups 1033 100.002
The survey aimed to provide evidence on the housing experiences of both TPS and HOS purchasers. Why did they buy? How did they feel about the purchase? What were there views
on government housing policy and home ownership more generally? Existing tenants were asked a more restricted set of questions in the survey with the view to exploring how interested they are in assisted home ownership schemes and their current views on the

32
benefits/risks of home ownership. With regard to the core aims of the study, the subsample of those who had purchased HOS/TPS on the open market helps address the wider issue of where such properties fit in the housing system, who benefits when such properties are resold and provides some insight on the multiplier effect of HOS/TPS type schemes. A more difficult issue to research concerns the longer term impact of assisted home ownership schemes on the trajectory of households through the housing market. How far does HOS/TPS offer a step on the housing ladder? To what extent do households see their move into home ownership in those terms? There are also policy restraints on selling on the open market which may limit interest in moving in the early stages or, indeed, pose problems of repurchase if there is insufficient equity realised once premiums are repaid. TPS properties may also fare less well than HOS properties in the market. The small sub sample of previous TPS purchasers
offers some insight into this issue. Profile of Respondents
Looking beyond the basic housing market groups, tables 4.2 to 4.5 provides the essential demographic profiles in relation to age, socio-economic group and income. Taking home owners as a whole in the sample, that is Groups 1-5 (table 4.1), 14 per cent stated that they had bought their current flat before 1990, 40 per cent between 1990 and 2000, and just under a third after 2000. Just under 12 per cent of respondent did not know or found it hard to say when they bought indicating that the percentage of early sales may be
underestimated. It is also worth noting that in our sample, the highest number of purchasers tend to be found in periods when Hong Kong`s house price index was declining-the early 1990s and late 1990s to early 2000s. Or stated differently, some two thirds of our sample stated that they had purchased their current flat prior to the long period of sustained house price inflation from 2004 onwards. Perhaps this is part of the reason why the overwhelming majority of owners have no regrets about buying (95%). Only 17 owners express some regrets. In this small group the reasons are most typically property related (difficult to sell, not a good investment, difficult to move) rather than because of a change in personal or family circumstances. Among our sub-group of previous HOS/TPS purchasers, a similar degree of satisfaction is evident with only 7 per cent expressing any regrets about their purchase. Among those with regrets (12 households), the reasons were all property related with half
referring to difficulties of selling at the right price or neighbourhood decline. However, with such small numbers, these comments cannot be taken as in any sense representative. In terms of ownership of the property title, 35 per cent of properties were jointly owned with partner, 48 per cent by the respondent or partner only. There were other ownership arrangements for some 17 per cent of properties. In this latter category, just over half (51%) were owned by parents and 15 per cent by the respondent`s children. In the other cases, ownership was shared more widely among parents and children.. Among TPS and HOS white form purchasers, since the property was originally purchased, there had been additions to the ownership title in over a quarter of cases. These changes most typically involved the addition of a partner (43.7%) or children (26.4%).The title holder were mainly living in the
property (93%) and 78 per cent of the owners had paid off their mortgage or never had one.

33
Among our owners, the vast majority own outright. This is not surprising given their age profile (see below) and the discount conditions under which many purchased. Some four-fifths of home owners in the survey have no mortgage. Predictably, open or secondary market purchasers are more likely to still be paying off a mortgages. With regard to the general social profile of the sample we can disaggregate the housing groups in terms of age, household income and occupation. It should be noted that the individual data refer to the respondent, and not head of household. The median household size, excluding any domestic helpers, for the sample as a whole was 2.0 compared with the SAR 2016 census median of 2.8. One in ten households were single
persons-14 per cent of public tenants. The sample structure therefore inevitably skews the household size towards smaller households (Table 4.2). The sample is also relatively old with almost half (48%) of respondents aged 65 or over. As would be expected, the secondary and open market purchaser group have a slightly younger profile. TPS purchasers and HOS green form buyers have a quarter of more respondents aged 70 or over. The sample omits private renter households and private owners (with the exception of previous HOS/TPS purchasers) and thus the main tenure categories for newly formed and younger households. However, entry to home ownership via the private market is generally taking on an older profile with decreasing numbers of under 40 year olds able to raise the necessary deposit and pay the required mortgage costs(Forrest and Shi, 2017).
Table 4.2 Household Size (excl. domestic helpers)
(Percentage in each category) 1 2 3 4 5 6+ N
TPS 7 24 29 24 11 5 200
HOS (white form) 9 24 34 24 16 3 89
HOS (green form) 5 27 32 27 8 2 120
HOS (open or secondary market) 5 28 31 29 6 2 65
Previously bought HOS/TPS 7 22 28 30 9 4 102
Public tenants 14 21 26 24 11 5 457
Total % 10 22 29 25 10 4 100
Total N 104 228 294 259 107 41 1033
Table 4.3 Age of Respondent by Housing Group (Percentage in each category)
18-19 20-29 30-39 40-49 50-59 60-69 70 or above
N
TPS households 1 6 8 7 26 29 25 199
HOS (white form) 0 2 8 24 26 29 11 89
HOS (green form) 0 3 4 10 21 35 27 120
HOS (open or secondary market) 1 6 12 20 34 15 11 65
Previous HOS/TPS purchasers 0 0 5 28 27 26 15 102
Public tenants 2 10 7 12 21 24 24 456
Total % 1 7 7 14 24 26 22 100
Total N 11 68 70 145 245 270 222 1031
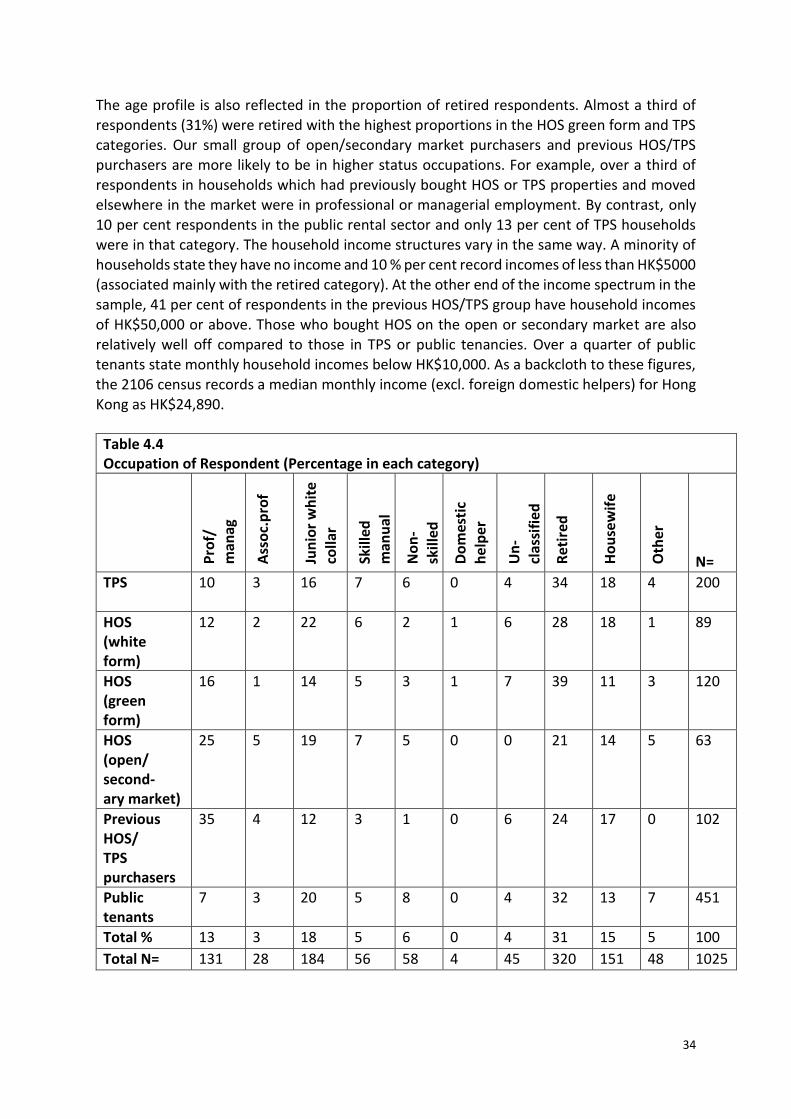
34
The age profile is also reflected in the proportion of retired respondents. Almost a third of respondents (31%) were retired with the highest proportions in the HOS green form and TPS categories. Our small group of open/secondary market purchasers and previous HOS/TPS purchasers are more likely to be in higher status occupations. For example, over a third of respondents in households which had previously bought HOS or TPS properties and moved elsewhere in the market were in professional or managerial employment. By contrast, only 10 per cent respondents in the public rental sector and only 13 per cent of TPS households were in that category. The household income structures vary in the same way. A minority of households state they have no income and 10 % per cent record incomes of less than HK$5000 (associated mainly with the retired category). At the other end of the income spectrum in the sample, 41 per cent of respondents in the previous HOS/TPS group have household incomes
of HK$50,000 or above. Those who bought HOS on the open or secondary market are also relatively well off compared to those in TPS or public tenancies. Over a quarter of public tenants state monthly household incomes below HK$10,000. As a backcloth to these figures, the 2106 census records a median monthly income (excl. foreign domestic helpers) for Hong Kong as HK$24,890.
Table 4.4 Occupation of Respondent (Percentage in each category)
Pro
f/
man
ag
Ass
oc.
pro
f
Jun
ior
wh
ite
colla
r
Skill
ed
man
ual
No
n-
skill
ed
Do
mes
tic
h
elp
er
Un
-
clas
sifi
ed
Ret
ired
Ho
use
wif
e
Oth
er
N=
TPS
10 3 16 7 6 0 4 34 18 4 200
HOS (white form)
12 2 22 6 2 1 6 28 18 1 89
HOS (green form)
16 1 14 5 3 1 7 39 11 3 120
HOS (open/ second- ary market)
25 5 19 7 5 0 0 21 14 5 63
Previous HOS/ TPS purchasers
35 4 12 3 1 0 6 24 17 0 102
Public tenants
7 3 20 5 8 0 4 32 13 7 451
Total % 13 3 18 5 6 0 4 31 15 5 100
Total N= 131 28 184 56 58 4 45 320 151 48 1025

35
Table 4.5 Household Income by Housing Group (Percentage in each category)
Bel
ow
H
K$
5,0
00
HK
$5
,000
-
9,9
99
HK
$1
0,0
00
-1
4,9
99
H
K$
15
,00
0-
19
,99
9
HK
$2
0,0
00
-2
9,9
99
HK
$3
0,0
00
-3
9,9
99
H
K$
40
,00
0-
49
,99
9
HK
$5
0,0
00
or
abo
ve
No
inco
me
No
t st
able
N=
TPS
8 12 11 10 18 12 7 9 7 4 179
HOS (white form)
5 4 2 8 21 16 13 22 8 0 82
HOS (green form)
5 6 13 9 17 15 6 15 7 8 103
HOS (open/ sec. mkt.)
5 4 5 8 13 17 15 27 7 0 60
Previous HOS/ TPS purchasers
4 4 4 2 15 13 12 41 3 1 94
Public tenants
13 13 12 14 21 9 5 3 6 3 430
Total % 10 10 10 11 19 12 7 12 6 3 100
Total N= 91 95 93 103 180 110 70 116 62 29 948
TPS and HOS purchasers were also asked whether they owned any other properties-8 per cent did. These were almost all in Hong Kong or Mainland China. A small number owned properties overseas. The sample numbers are small and these figures are likely to be an underestimate. However, the fact that a small minority of TPS and HOS (white and green form)
purchasers claim to own more than one property reflects both the particular conditions of the local and regional housing market and the more general phenomenon of growing second home ownership. Assisted home ownership schemes are for some not only it seems a stepping stone into the housing market but a path to asset building through additional property purchase, especially once mortgages are paid off. Mobility and the Motivation to Buy
One of the key concerns of the survey was to explore mobility experiences and intentions of those buying HOS and TPS. Have they tried to move? Did they succeed? If not, why not? With assisted home ownership schemes of any kind, there are often concerns about where such
properties are going to fit in the market and if they prove to be good investment for the purchaser. This is of particular relevance to the idea of such policies being designed to offer a

36
step onto the housing market-as was explicit in some of the official policy comments on the HOS and TPS schemes. The other two groups of particular interest here and are therefore HOS and TPS vendors identified in the survey (those categorised as previous HOS/TPS purchasers) and secondary and open market purchasers. The former group are successful movers from HOS/TPS and the latter provide some indication of where such properties fit in the market. We shall explore these and related issues below. The survey asked all owners about their main reasons for buying the particular flat they were occupying and we also asked them if they had any regrets about purchasing. Virtually no one had .Only 17 respondents stated that they regretted their purchase. Of those, 9 were TPS purchasers, 3 HOS white form households, 4 HOS green form households and there was 1
open/secondary market purchasers. The numbers are admittedly small but it is of some interest to look at the reasons for their regret, particularly the TPS purchasers. If these numbers are representative, it would suggest that just under 5 per cent of TPS buyers may not have a positive view of their move into home ownership. With regard to this group, the reasons included: ‘not a good investment’; ‘difficult to move somewhere else’; ‘neighbourhood has got worse’. There were also reference to changes in personal circumstances. In designed the study, it was anticipated that we might come across frustrated movers among particularly TPS buyers-simply because their position in the wider market (ie. lagging behind general house price inflation) might mean that options to move somewhere else were limited. However, as is shown below (figure 4.1) across all our owners, there is only small proportion of respondents stating that they have thought about moving. This kind of
response does need further probing. Compared to the other home ownership markets in say, the UK or the USA, Hong Kong has relatively low mobility. This is partly a function of living in a high density city with an extensive and well integrated public transport system. But it may also be that in many cases, households have the view that the transaction costs (in the widest sense) outweigh the gains likely to be achieved in living conditions or location. Reasons for Buying Why did people buy the particular flat they were living in? Table 4.6 shows the distribution of responses to this questions for HOS and TPS purchasers. TPS purchasers are clearly in a different position from other owners as sitting tenant buyers. What has changed is the tenure
not the location or the property. Prior to purchase there was no search involved for properties or locations-that was already given. As can be seen, TPS households are slightly more likely to say that they liked the property, perhaps reflecting their greater familiarity with the flat they purchased. And the terms of the sale, with low purchase costs, are reflected in the high proportion who refer to the purchase being good value for money. TPS buyers are much less likely to say that they had always wanted to own-half the proportion of HOS white form applicants which could indicate a higher motivation among those moving out of PRH to buy. A fifth of TPS households also state (probably correctly in most cases) that they couldn't afford to buy anywhere else. Interestingly, across the three groups, there appears to be little reference to the property as an investment in anticipation of retirement
or for other purposes. The simple desire to own a property seems to be the strongest motivator.

37
Table 4.6 Thinking back to when you bought this particular flat, what were your main reasons for buying it? (Multiple answers allowed-percentage of responses for each group) % Good
value for money/ discount
Liked the property
I wanted to own my own home
Liked the n’hood
Investment for the future
Couldn't afford to buy anywhere else
Others Don't know/hard to say
N
TPS 23 17 19 17 3 20 4 0 412
HOS (white form)
15 14 38 13 3 16 1 1 163
HOS (green form)
14 10 34 15 4 13 10 1 198
Total % 18 13 28 16 4 17 5 0 100
Total N 161 114 248 143 32 149 42 2 891
Moving
It has already been noted that only a small proportion of our HOS/TPS groups said they had considered moving-14 per cent. And there is no statistically significant difference across our three groups. Among those who did say they had thought about moving, the desire for more space and a better neighbourhood were the main drivers. Over 60 per cent of the potential movers wanted a bigger flat and a third were seeking a better neighbourhood. If these responses are
disaggregated by housing group, there is some indication that TPS purchasers are more likely than HOS buyers to be motivated to move in order to live in a better neighbourhood (44% as against 25% green form and 31% white form) but the sample number in these sub groups are small.
Those who had purchased an HOS property on the open or secondary market were also asked if they had thought about moving-a small number (7) had done so and, of those, 6 wanted a bigger flat.
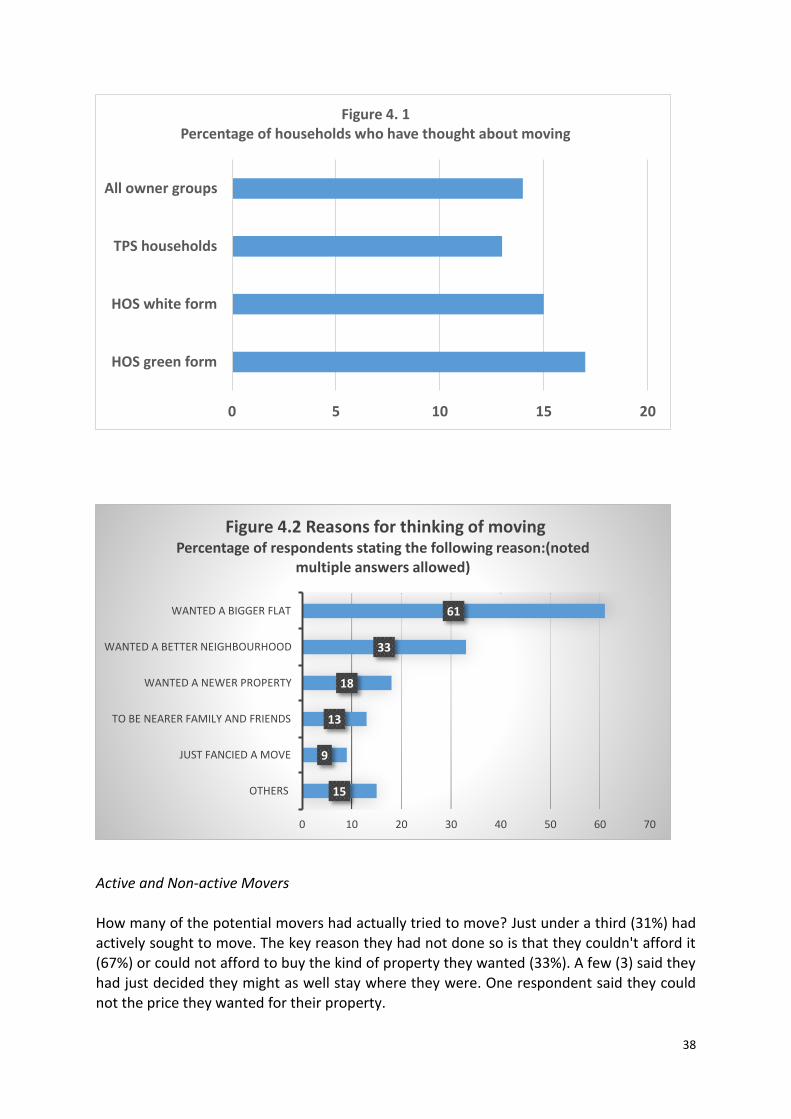
38
Active and Non-active Movers How many of the potential movers had actually tried to move? Just under a third (31%) had actively sought to move. The key reason they had not done so is that they couldn't afford it (67%) or could not afford to buy the kind of property they wanted (33%). A few (3) said they
had just decided they might as well stay where they were. One respondent said they could not the price they wanted for their property.
0 5 10 15 20
HOS green form
HOS white form
TPS households
All owner groups
Figure 4. 1Percentage of households who have thought about moving
15
9
13
18
33
61
OTHERS
JUST FANCIED A MOVE
TO BE NEARER FAMILY AND FRIENDS
WANTED A NEWER PROPERTY
WANTED A BETTER NEIGHBOURHOOD
WANTED A BIGGER FLAT
0 10 20 30 40 50 60 70
Figure 4.2 Reasons for thinking of movingPercentage of respondents stating the following reason:(noted
multiple answers allowed)

39
Among those who had thought about moving but had not taken any further steps, the reasons were a bit more mixed. A third did refer to not being able to afford what they wanted but a similar percentage (31%) said they had decided they were happy enough where they were, 27% said they had just not got round to it yet and 22% said that family circumstances had changed in some way. Six respondents said that they didn't think they would get a good enough price for their own property to enable them to make the move they wanted. Open and Secondary Market Purchasers The survey results also enable us to say something about moving patterns between different tenures. Who is buying previous HOS properties? Among the respondents in this survey, 65
fall into this group. Of those, only 20 stated that they had bought the property on the open market. Some two thirds were secondary market buyers. As Figure 4.3 shows, 27 per cent of buyers of former HOS flats were moving from the private home ownership market. According to these data, the market for assisted home ownership properties on resale is mainly from within the public sector. Public owners or renters account for 70 per cent of the purchasers. We identified a small group of previous TPS purchasers (vendors of TPS) in our sample-15 in total. Their previous tenure is quite mixed with only 4 stating that they were moving directly from a TPS flat. Three said they were in public renting, three HOS, three in private renting and two in the private home ownership sector. This very mixed background may be due to a range of circumstances including: changing ownership arrangements among parents and children,
by varied moves since TPS flats were purchased or by the purchase of a second property.
40%
3%15%
15%
27%
Figure 4. 3Open or Secondary Market Purchasers of HOs properties-housing situation immediately prior to this purchase (%)
Public renting
TPS
HOS
Private renting
Private home ownership

40
Views on Housing Policy and Assisted Home Ownership
The survey devoted a number of questions to exploring attitudes towards various housing policy options-real and hypothetical. Specifically, which ways to assist households into home ownership were most favoured and to what extent did that vary by housing group? More generally, did our respondents believe that the government should have some responsibility for providing routes to residential property purchase and how did they feel about the role of public rental housing? Help to Buy? Policy initiatives to reduce the cost of entering home ownership can take various forms. The
can involve build for sale schemes in which government`s intervene with regard to land and/or building costs and thus reduce the final cost to the consumer below prevailing market prices for comparable properties. The costs of mortgage finance can be reduced via measures such as preferential interest rates, stamp duty can be lower for lower value properties and deposit requirements can be eased through lump sum assistance or lower deposit requirements for certain categories of consumers. Or where there is substantial public rental or social housing, discounted sale can be offered for sitting tenants, or other designated groups. Hong Kong has pursued these kinds of policies to varying degrees at different times. Affordability problems are particularly acute at the moment. It is therefore of particular interest to explore current attitudes towards subsidised home purchase, especially among those groups who have themselves taken advantage of such opportunities or, as current
public tenants, are a key target group for such policy initiatives. First of all, we asked a general question regarding whether respondents felt that the government should have some obligation to help people buy. We then asked a series of questions about how they might do this. As can be seen from figure 4.4, the most popular policy options among our respondents as whole were to build more home ownership scheme flats and some revival of tenant purchase schemes. Indeed, over 90 per cent of those questioned supported building more HOS flats. But all the options attracted more than 50 per cent support. The responses can be nuanced more with reference to those with particularly strong feelings either way. Which policy options gained the highest percentage of respondents agreeing strongly and, conversely, did policy options substantial negative
feelings? As regards strong positive feelings, it was the more specific and familiar policy proposal which again gained strong support-58 percent strongly agreed with HOS type schemes and 47 per cent with selling public housing. The decline in space standards has attracted considerable publicity recently as property prices have soared and developers have sought to reduce entry costs by building micro flats. As figure 4.1 shows, over 50 per cent of respondents supported the idea that the government could take a similar approach. However, this was also the policy option which had the most polarised response. Only 5 per cent of respondents were neutral on this. Over a fifth (22%) strongly agreed with the idea but 17 per cent strongly disagreed and in total 39 per cent were negative. It is worth noting that none of these questions suffered from a high level of indifference. They were either very strongly supported or there were significant minorities who were also against such policy initiatives

41
In disaggregating these responses further, to what extent did our different groups vary in terms of their attitudes? Did for example, public rental tenants have a different views from HOS purchasers, or those who had previous bought under HOS and moved elsewhere? Again
it is worth noting that these questions are being asked in the context of a housing market which has experienced a decade or more of rapid house price inflation. Thus, the experience of home ownership among those who have entered the market is predictably very positive and this is reflected in the introductory remarks regarding the very few purchasers who have any regrets about their move into home ownership or their particular purchase. However, in different market conditions, say post 1997, attitudes and experiences could have been very different. Home ownership is most attractive when it is least affordable-for those in the market and for those hoping to enter it. On some questions there is very strong and clear support across all housing groups included in the survey. The strongest level of disagreement regarding whether more HOS flats should
be built is only 7% (who agree/strongly disagree) and that is among previous HOS/TPS buyers. Similarly, the level of support for selling some public housing is strong across the different groups-the most negative view coming from the green form HOS group where 16 per cent are negative, but of that, only 3 per strongly against. On some questions there is a more varied and, in some cases, surprising pattern of responses. Views on whether the government should provide more help to get into the private housing market are as Figure 4.4 indicates, less strongly supportive than for other policy measures. This follows a general pattern in the survey responses. It would appear that respondents are more supportive of policies which produce access at less than market costs (HOS, TPS) than measures which subsidise house purchase ( and renting) in prevailing market prices. This may
reflect the view that current market price levels are so high that the level of subsidy required would be too great and provide less value for money in terms of space and location. However,
0 10 20 30 40 50 60 70 80 90 100
The government should provide more help to get intoprivate home ownership
The government should sell some public rental housing towiden opportunities for home ownership
The government should build smaller flats to make themcheaper to buy
The government should provide subsidies for youngpeople to buy
The government should provide more home ownershipscheme flats
It is the government`s responsibility to help people buytheir housing
Figure: 4.4 Views on Government Policy to Help People Into Home
Ownership
Percentage of respondents agreeing
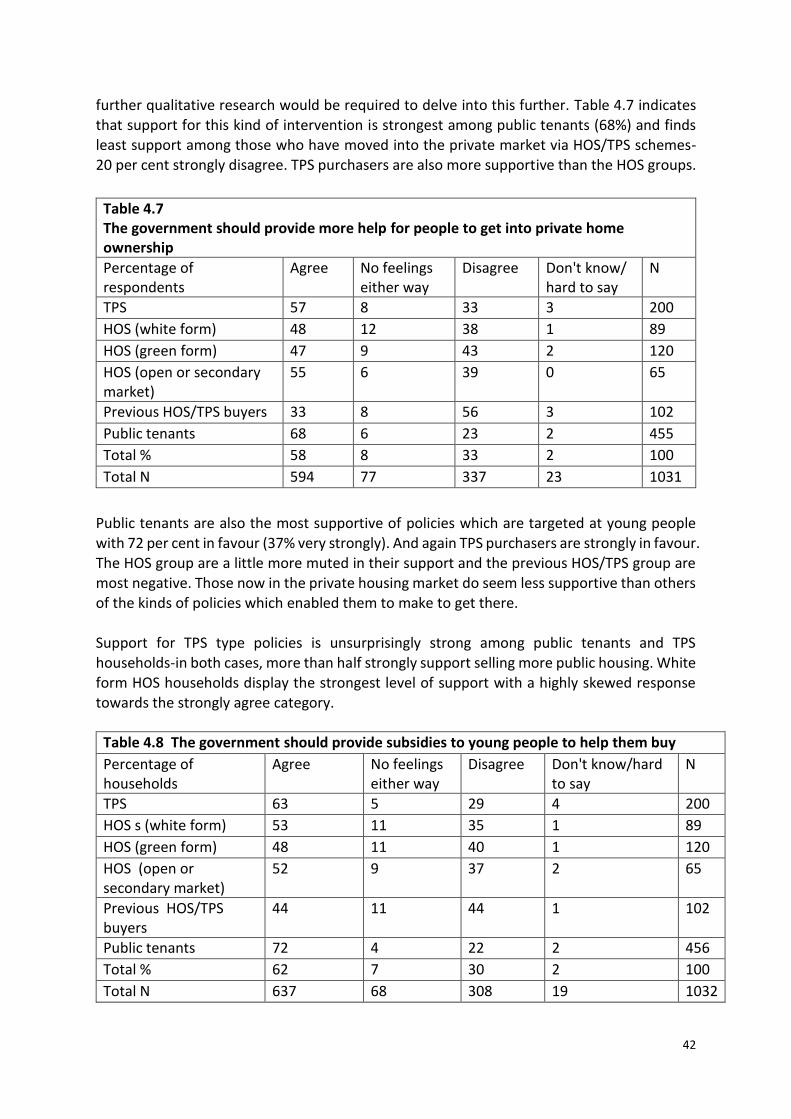
42
further qualitative research would be required to delve into this further. Table 4.7 indicates that support for this kind of intervention is strongest among public tenants (68%) and finds least support among those who have moved into the private market via HOS/TPS schemes-20 per cent strongly disagree. TPS purchasers are also more supportive than the HOS groups.
Table 4.7 The government should provide more help for people to get into private home ownership
Percentage of respondents
Agree No feelings either way
Disagree Don't know/ hard to say
N
TPS 57 8 33 3 200
HOS (white form) 48 12 38 1 89
HOS (green form) 47 9 43 2 120
HOS (open or secondary market)
55 6 39 0 65
Previous HOS/TPS buyers 33 8 56 3 102
Public tenants 68 6 23 2 455
Total % 58 8 33 2 100
Total N 594 77 337 23 1031
Public tenants are also the most supportive of policies which are targeted at young people
with 72 per cent in favour (37% very strongly). And again TPS purchasers are strongly in favour. The HOS group are a little more muted in their support and the previous HOS/TPS group are most negative. Those now in the private housing market do seem less supportive than others of the kinds of policies which enabled them to make to get there. Support for TPS type policies is unsurprisingly strong among public tenants and TPS households-in both cases, more than half strongly support selling more public housing. White form HOS households display the strongest level of support with a highly skewed response towards the strongly agree category.
Table 4.8 The government should provide subsidies to young people to help them buy
Percentage of households
Agree No feelings either way
Disagree Don't know/hard to say
N
TPS 63 5 29 4 200
HOS s (white form) 53 11 35 1 89
HOS (green form) 48 11 40 1 120
HOS (open or secondary market)
52 9 37 2 65
Previous HOS/TPS buyers
44 11 44 1 102
Public tenants 72 4 22 2 456
Total % 62 7 30 2 100
Total N 637 68 308 19 1032
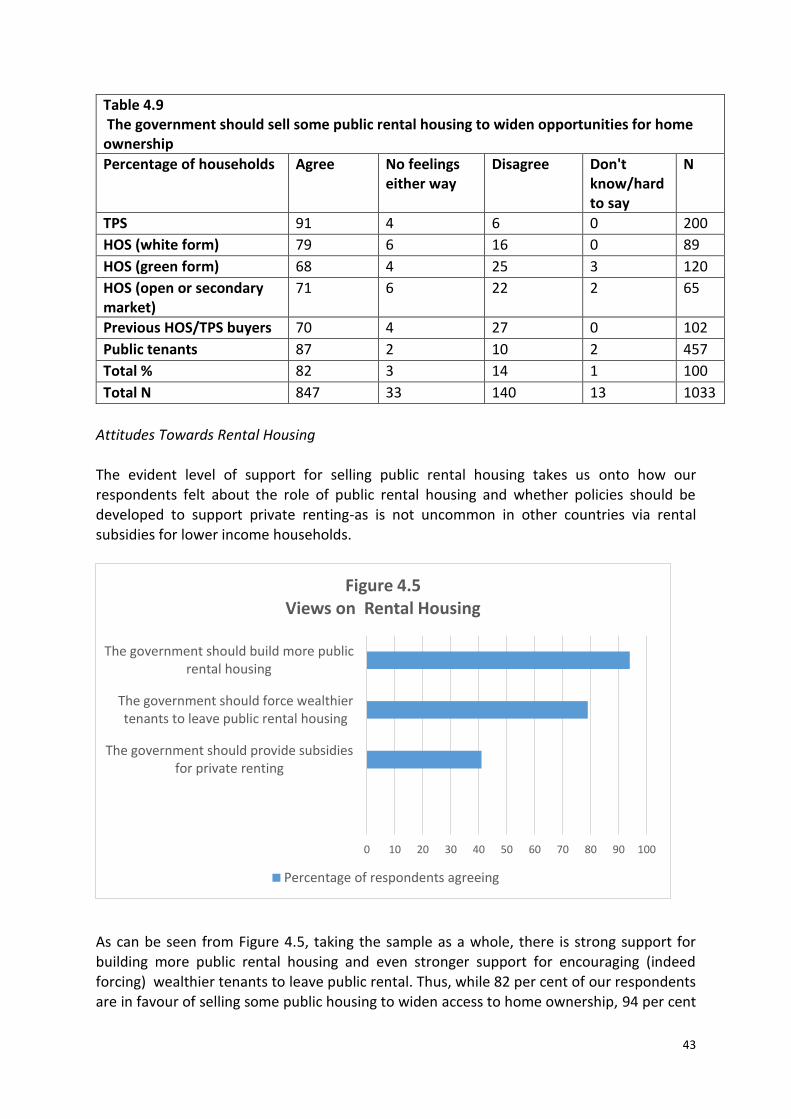
43
Table 4.9 The government should sell some public rental housing to widen opportunities for home ownership
Percentage of households Agree No feelings either way
Disagree Don't know/hard to say
N
TPS 91 4 6 0 200
HOS (white form) 79 6 16 0 89
HOS (green form) 68 4 25 3 120
HOS (open or secondary market)
71 6 22 2 65
Previous HOS/TPS buyers 70 4 27 0 102
Public tenants 87 2 10 2 457
Total % 82 3 14 1 100
Total N 847 33 140 13 1033
Attitudes Towards Rental Housing The evident level of support for selling public rental housing takes us onto how our respondents felt about the role of public rental housing and whether policies should be developed to support private renting-as is not uncommon in other countries via rental
subsidies for lower income households.
As can be seen from Figure 4.5, taking the sample as a whole, there is strong support for building more public rental housing and even stronger support for encouraging (indeed
forcing) wealthier tenants to leave public rental. Thus, while 82 per cent of our respondents are in favour of selling some public housing to widen access to home ownership, 94 per cent
0 10 20 30 40 50 60 70 80 90 100
The government should provide subsidiesfor private renting
The government should force wealthiertenants to leave public rental housing
The government should build more publicrental housing
Figure 4.5Views on Rental Housing
Percentage of respondents agreeing
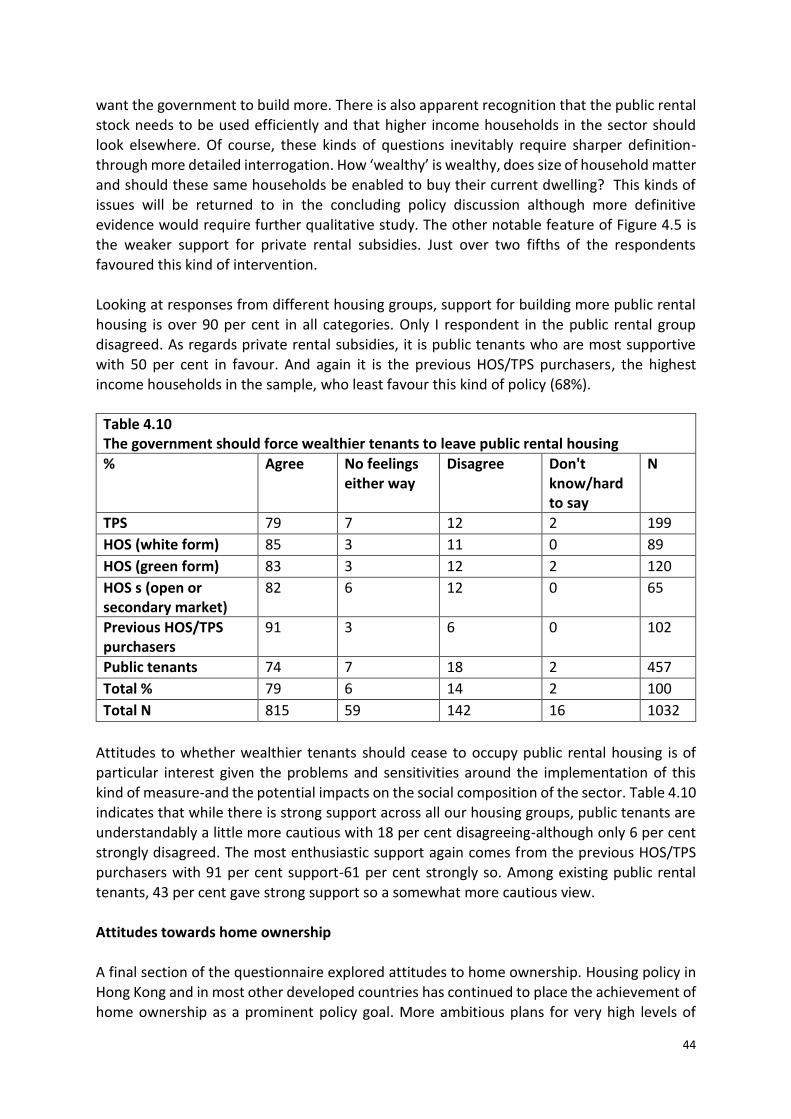
44
want the government to build more. There is also apparent recognition that the public rental stock needs to be used efficiently and that higher income households in the sector should look elsewhere. Of course, these kinds of questions inevitably require sharper definition-through more detailed interrogation. How ‘wealthy’ is wealthy, does size of household matter and should these same households be enabled to buy their current dwelling? This kinds of issues will be returned to in the concluding policy discussion although more definitive evidence would require further qualitative study. The other notable feature of Figure 4.5 is the weaker support for private rental subsidies. Just over two fifths of the respondents favoured this kind of intervention. Looking at responses from different housing groups, support for building more public rental
housing is over 90 per cent in all categories. Only I respondent in the public rental group disagreed. As regards private rental subsidies, it is public tenants who are most supportive with 50 per cent in favour. And again it is the previous HOS/TPS purchasers, the highest income households in the sample, who least favour this kind of policy (68%).
Table 4.10 The government should force wealthier tenants to leave public rental housing
% Agree No feelings either way
Disagree Don't know/hard to say
N
TPS 79 7 12 2 199
HOS (white form) 85 3 11 0 89
HOS (green form) 83 3 12 2 120
HOS s (open or secondary market)
82 6 12 0 65
Previous HOS/TPS purchasers
91 3 6 0 102
Public tenants 74 7 18 2 457
Total % 79 6 14 2 100
Total N 815 59 142 16 1032
Attitudes to whether wealthier tenants should cease to occupy public rental housing is of
particular interest given the problems and sensitivities around the implementation of this kind of measure-and the potential impacts on the social composition of the sector. Table 4.10 indicates that while there is strong support across all our housing groups, public tenants are understandably a little more cautious with 18 per cent disagreeing-although only 6 per cent strongly disagreed. The most enthusiastic support again comes from the previous HOS/TPS purchasers with 91 per cent support-61 per cent strongly so. Among existing public rental tenants, 43 per cent gave strong support so a somewhat more cautious view. Attitudes towards home ownership
A final section of the questionnaire explored attitudes to home ownership. Housing policy in Hong Kong and in most other developed countries has continued to place the achievement of home ownership as a prominent policy goal. More ambitious plans for very high levels of

45
home ownership may have been scaled back in many countries with changing economic conditions and increasing housing affordability challenges but the underlying, guiding assumption of much housing policy still assumes that most households would ideally prefer to own than rent property. Indeed, arguably, while it has become more difficult to gain an initial foothold on the residential property ladder because of high house price inflation and higher deposit requirement, the penalties of being excluded from the home ownership sector have become greater. Residential property equity is the main source of wealth for the majority of households in Hong Kong and globally and is the main differentiating feature in the social mainstream. In the wider scheme of things, attitudes to property ownership in Hong Kong may be influenced by two rather contradictory features. First, the level of house price inflation in Hong Kong is exceptional. Thus the investment potential is exceptional.
Secondly, the public rental sector is also exceptionally important compared with most other affluent societies. And rents are low and public rental housing is of relatively good quality, particularly the more recent developments. Thus, the attractions of home ownership are strong as regards investment. Equally, renting offers very good value and a no risk safety net for a large section of the Hong Kong population. It might also be noted that our assisted owners all fall into what could be regarded as a group less exposed to the vicissitudes of the market given that they have not paid the full market price for their properties, and some considerably less. The survey findings do reflect these different influences and tensions. Taking all households together, which of course excludes those renting or owning in the private market (apart from
our subgroup of previous HOS/TPS purchasers), what is the broad picture of how they feel about home ownership. At the beginning of this report, it was shown that only a very small minority of owners in the survey had any regrets about purchasing their particular property. And as can be seen from Figure 4.6, the broader desire for home ownership remains very strong. Taking all respondents, two thirds regard property as the best way to invest their money; 85 per cent say they have always wanted to own their own home and 78 per cent say they do (or would) feel more secure as a home owner. That is a rather clear endorsement of home ownership-friendly policies and demonstrates the continuing aspiration among the majority of households in Hong Kong to own their own home. However, other responses indicates a more
nuanced view of the desirability of home ownership and the relative benefits of the public rental sector. More than 80 per cent of respondents state that they would be happy to live in public rental housing, only a minority (28%) agree with the view that paying rent is a waste of money and three quarters agree that the housing market is too risky these days. These are quite striking findings and would be likely to contrast with the views of those living in the private rental sector in Hong Kong and with the views of households in other societies with much more limited and more residual, public rental sectors. It is also notable that the association between residential property ownership and being middle class appears less strong than might be expected with less half of our respondents agreeing with this proposition. Interestingly, existing public rental tenants are more likely to agree with this statement than home owners. More than half of public tenants (54%) agree that home
ownership is a symbol of being middle class compared with, for example, 31 per cent of open or secondary market HOS buyers.

46
The somewhat contradictory views captured in Figure 4.6 reflect perhaps the way in which residential property markets have changed-in Hong Kong and elsewhere. People want to own their own homes and regard residential property as a good investment. But with greater market volatility and rising entry costs, people are also more aware of the risks involved. Indeed, it is striking that on this question, in each group, those who agree strongly that the housing market is too risky outnumber those who merely agree (overall 43% strongly agree; 32% agree). In this context, policies to assist entry into home ownership, particularly discounted tenant purchase schemes become increasingly attractive as the immediate equity cushion and relatively low mortgage payments can offer a low risk move into residential property ownership. Those buying in the private market at market prices are considerably
more exposed. This issue will be returned to later.
How do these responses vary across our groups? It has already been noted that views vary
about the relationship between middle class status and home ownership. There are some other differences although no major variations in responses. For example, all groups take the view that they are, or would be, more secure as home owners (despite the perceived greater risks). Public sector tenants are, however, most likely to disagree with this statement (18%) and white form HOS respondents least likely (8%). And whilst the vast majority of respondents state they would be happy to live in the public rental sector, this is particularly true of existing public tenants and TPS households (82% and 90% respectively). Previous purchasers of HOS and TPS are least likely to hold this view (65%). There is therefore little evidence from this question and elsewhere in the survey that those currently in public renting, those who have bought as sitting tenants or those who are either HOS buyers or have moved on from public to private home ownership have negative views of the public rental sector. Their preference
is generally to buy a property if they can but this would to be the pull of the potential benefits of ownership rather than a strong desire to escape public rental.
0 10 20 30 40 50 60 70 80 90
I would be happy to live in the public rental sector
I (would) feel more secure as a home owner
The housing market is too risky these days
Owning a property is symbol of being middle class
I always wanted to own my own home
Property is the best way to invest your money
Paying rent is a waste of money
Figure 4.6Attitudes to Owning and Renting
Percentage of respondents who agree
47
Mobility between public renting and owning Public rental tenants were asked about their expectations of buying a property in Hong Kong. Over half (54%) agreed with the statement “I do not think I will have the ability to purchase a property in Hong Kong”-29 per cent strongly agreed. Over 30 per cent, however, disagreed which is perhaps more surprising. It would, however, be instructive to know if tenants have TPS or similar schemes in mind in response to that kind of question. It may be that if asked whether they believed they would be able to buy in the private housing market, at prevailing market prices, they would be less sanguine. Given the significance of public home ownership in the overall home ownership market in Hong Kong it would not be surprising if expectations of entering home ownership were shaped by the policy history of HOS, TPS and related
programmes. That is, however, speculating beyond the evidence in the survey. With regard to sitting tenant purchase, our public tenant group were asked about their interest in buy their existing apartment. As figure 4.7 shows, there is considerable interest in sitting tenant purchase-if the price is right. That is perhaps not entirely surprising since most of us would probably given an affirmative response to such a question. Nevertheless, the experience of sitting tenant purchase schemes in some other societal contexts indicates that some tenants are wary of taking on a property which may have low saleability and market value. In Hong Kong, property values are so high, and have been rising for such a sustained period, that most properties are perceived as saleable, worthwhile investments-and probably correctly so. Of course, the desire to purchase an apartment cannot be reduced to investment
value. There is a strong assumption, especially in the Hong Kong context, that it is the investment motive which drives the desire to own. But the apparent contradiction between the strong desire for home ownership and the perceived risks involved may also be partly attributable to the emotional, rather than the material aspects of property ownership. From a policy perspective, these emotional aspects are of some importance in formulating housing policies which are to contribute to collective well being and social cohesion.

48
In order to get a little more purchase on this issue, the survey also explored whether for some tenants, the price could never be right. In other words, what proportion would not buy regardless of the price. A fifth of our tenant respondents agreed that they were not interesteding in buying their existing unit under any circumstances-a not insignificant minority.
Returning to the broader issue of social divisions and tenure mobility, there is an evident consensus that owners and renters are becoming more distant from one another (see table 4.11). We purposely did not specify exactly what kind of ‘gap’ was being referred to but whatever the personal interpretation it is unlikely to be negative. Thus, although a majority state that they would be happy to live in the public rental sector, there is also a view that the social and/or economic distance between renters and owners is widening. The proportion of respondents who believe this strongly varies from 45 per cent among public tenants to 34 per cent among previous HOS/TPS purchasers.
Table 4.11 The gap between home owners and renters is getting wider
Percentage of respondents Agree No feelings either way
Disagree Don't know/hard to say
N
TPS 75 3 10 13 200
HOS (white form) 51 6 6 8 89
HOS (green form) 72 6 7 15 119
HOS (open or secondary market)
75 5 14 6 64
Previous HOS/TPS purchasers
65 6 18 11 101
Public tenants 82 4 7 7 453
Total % 77 4 9 10 100
Total N 791 45 92 98 1026
53%
28%
3%8%
6%
2% Figure 4.7 Public rental tenants:
If the price is right I would buy my unit
Strongly agree
Agree
No feelings either way
Disagree
Strongly disagree
Don`t know/hard to say

49
This issue of a perceived widening social division between the renters and owners takes us to a final question which asked our respondents where they saw themselves on a notional housing ladder (table 4.12). They were asked to consider their current housing situation and to place themselves on the ladder-with 10 being the (best) top rung and 1 being the bottom (worst). As might be expected, respondents tended to gravitate around the middle rungs. The majority believe they are somewhere around the average housing situation. There are, however, higher proportions placing themselves on the lower rungs (1-4) than on the upper ones. The pattern is what might be predicted from the sample structure given that almost all private home owners and all private tenants are excluded. Thus, the most affluent sections of the community-upscale private renters and high end home owners are not represented.
Almost half the sample is constituted by public rental households and this largely accounts for the 10 per cent of respondents placing themselves on the bottom rung. Just over a fifth of public tenants are on rungs 1 or 2-16 per cent put themselves right at the bottom. In contrast, only 4 per cent of open or secondary market purchasers see themselves at the bottom-an equal proportion put themselves on the top two rungs-although the sample numbers are small. But more than a third of this group place themselves above rung 6.Perhaps it is more striking, however, that 7 per cent of HOS white form households put themselves on the very top rung and 12 per cent of TPS purchasers see themselves at, or above, rung 7. These are, of course, entirely subjective views but as a measure of how assisted home ownership policies have affected well-being they are not to be dismissed for that reason. If people believe
themselves to be well housed in relation to others, or even in the same place as the majority, that is a very desirable policy achievement. Although there are TPS purchasers who have a very positive view of their housing circumstances, their overall profile remains closer to public rental tenants with just under a third (32%) placing themselves on the bottom four rungs. This would be expected of a group who may generally see themselves as still living in public rental housing although they are owners. Perceived social mobility is more likely to come with spatial mobility when, or if, they can buy another property on the open market. Although public rental tenants clearly have the most negative view of their housing
circumstances, perhaps because they are not on the property investment ladder (which may be the ‘divide’ most people are thinking of), it is nonetheless notable that 1 in 10 tenants place themselves on the top three rungs. Perhaps they are objectively misguided or are taking account of their low housing costs relative to many other groups in the market who may pay much more for housing of similar quality and space standards. There is an evident contract between the perceptions of the owners and renters in the sample but it is certainly far from polarised. Tenure mobility may be associated with social mobility but in terms of broader assessments of material living standards the contrasts are not substantial.

50
Table 4.12 Where do see yourself on the housing ladder? 10= Top 1= Bottom
Percentage of respondents
TPS
HOS white form
HOS green form
HOS open/ secondary market
Previous HOS/TPS purchasers
Public housing tenants
All
1 8 2 6 2 2 16 10
2 4 3 2 2 2 5 4
3 14 8 8 8 4 14 11
4 8 2 12 11 8 9 9
5 40 35 35 25 32 28 32
6 13 17 14 22 21 10 14
7 7 9 15 19 17 5 9
8 2 14 4 11 10 6 6
9 1 0 1 2 2 1 3
10 2 7 0 2 1 3 2
Don't know/hard to say
3 3 4 0 2 4 3
How do different groups regard their future housing prospects? Do they believe their housing situation is going to improve or deteriorate?
0
10
20
30
40
50
60
70
Moving Up Staying the same Moving down Don't know/hard tosay
Per
cen
tage
of
resp
on
den
ts
Figure 4.8Looking to the future, do you see yourself moving up the
ladder, moving down or staying the same

51
As can be seen from Figure 4.8, respondents as whole have a rather positive view of their future housing prospects. The majority may think not much will change but few expect their position to deteriorate. Predictably, those who are currently most likely to see themselves as being on the lower rungs are most likely to expect to improve their situation in the future. Almost a third of public rental tenants (32%) and TPS purchasers (31%) have this view. Open or secondary market purchasers, who are most likely to see themselves on the higher rungs, have less expectation of moving further up the notional ladder- 71 per cent expect their housing situation to stay the same. There is thus a general expectation of better housing prospects or, as is evident from the previous discussion, a recognition that their housing circumstances are already fairly satisfactory and are unlikely to get substantially better. From a policy perspective, this offers a reasonably comforting view of the impact of assisted home
ownership policies and of the expectations of public sector tenants. In terms of socio-spatial mobility, it is also worth pointing out that it is the previous HOS/TPS purchasers, those who have mainly sold and moved out in to the private market, which appear to have the highest expectations of further improvement in their housing situation. Finally, do respondents in higher income households in the sample have generally different views on the nature and level of housing assistance which should be on offer to help people enter the home ownership sector? It seems that those on higher incomes are, indeed, less likely to favour certain policy measures than those on lower incomes. There are statistically significant differences with regard to whether smaller flats should be built to enhance affordability (less favoured by higher income households), whether the government should
provide specific subsidies to younger households (much more favoured by lower income households) and whether private rental costs should be subsidised. On that latter question, almost half of those in households earning less than HK $20,000 are in favour compared with 32 per cent of those earning over HK$40,000.

52
Chapter 5
Policy Implications and Recommendations
Background
The rising costs of home ownership are posing housing policy challenges in many parts of the world. In a low inflation, low interest rate era, the residential property market has become one of the primary destinations for personal savings and for speculative investment. As a
consequence, affordability problems have become more acute and the prospect of achieving higher, sustainable levels of home ownership has become more difficult. In this situation there is a danger that the gap between owners and renters becomes wider and that mobility between tenures is reduced. Equally, the high costs of buying a flat impacts on new household formation, family development and increases demand for public rental housing. There is therefore greater pressure to ensure that the public sector stock is used efficiently and that those who can afford to enter the home ownership sector are enabled and encouraged to do so.
Summary and Reflections
This report has explored the development of assisted home ownership policies in Hong Kong with HOS and TPS as the primary and most interventionist policy vehicles. The programme expanded until the more negative and turbulent economic conditions of the late 1990s and early 2000s generated concerns in the commercial sector that there was increasing competition between the public and private sector home ownership products. The housing market was in recession and there was waning interest in HOS. The programme was halted as was the considerable cross subsidy between the revenue produced by HOS sales and
investment in public rental housing (HKHA, 1994a).
Since then, house prices in Hong Kong have more than recovered. They have been among the fastest rising residential values in the world. Investment flowing into the local housing market
has helped fuel an unrelenting growth in the price of flats and particularly those in at the more expensive luxury end of the market. As price-income ratios have widened there have increasing calls to re-introduce assisted home ownership programmes. This has happened but on a smaller scale than previously. At the same time, waiting lists for public rental housing have continued to grow and the housing problems facing young people and young families regularly features in the press and media.
The report demonstrates that HOS in particular has played a pivotal role in the expansion of home ownership for middle income households. In the first ten years, the HOS provided permanent housing to over 380,000 people (Housing Branch, 1988). Almost 30 per cent of the population now lives in subsidised sale flats (Census and Statistics Department, 2016).
The Home ownership rate increased from 18 per cent in 1971 to 56 per cent in 2002 before the repositioning of the Government’s housing policy referred to above.

53
The various assisted home ownership schemes combined with measure to increase public sector rents for wealthier tenants have created the encouragement and the opportunities for the departure of higher income households from the public renting. Although this kind of flow risks the creation of a more residual, stigmatised public sector-a problem which policymakers in other countries have had to wrestle with-it does create more housing opportunities for those in most housing need. Moreover, the attitudes towards, and strong support for, public rental housing evident in this and other reports indicates that Hong Kong is still a long way from the kinds of difficulties which have beset smaller, poorer quality social housing sectors in other parts of the world. The social survey demonstrates inter alia that:
the experience of buying HOS or TPS has been a largely positive experience
that few purchasers apparently feel trapped in less sellable properties
although over time substantial numbers of HOS properties have changed hands-almost 100 per cent on some early HOS courts-only a small minority of the current HOS and TPS households identified in this survey have considered moving
the desire to own remains very strong but the majority of existing public sector tenants do not expect to be able to enter the home ownership market
that the desire to own is tempered by a concern about the risks and costs of entering the housing market
there is widespread support for a renewal of some sort of tenant purchase scheme
there is widespread support for more investment in public rental housing
people may not all expect their housing situations to improve, but few expect them to
get worse
there is a shared perception of a widening gap between owners and renters
The survey illustrates that households in Hong Kong have a view of home ownership which is shaped by the distinctive history of its development-and notably the distinction between public and private home ownership as recognised in the official statistics. Home ownership is not so exclusively associated with the private market as it is in many western societies. Thus, a desire to buy can run parallel with support for more public rental opportunities. This attitude is also shaped by the disconnection between the local household income structure and the residential price structure. As a global city, and one which is a particular magnet for speculative residential investment, Hong Kong has a residential property market which is as
much international as local. It sits in the company of cities such as London, Vancouver and Sydney but is distinguished by the continuing role and size of its public rental sector. As the data show, the respondents in this survey are perhaps unsurprisingly supportive of assisted home ownership policies. Arguably, a different set of questions posed in different circumstances could produce a more nuanced picture of attitudes towards such policies and of the role of government in the housing market. However, it also reflects a shared experience of a housing market in which prices and deposit requirements have spun out of reach of growing numbers of households in Hong Kong. Here the dilemma for the Hong Kong government is how to maintain a ladder of housing opportunity when economic forces tend to be pushing in the opposite direction. Moreover, as has been shown in a number of studies, buying a flat is buying a ‘home’ –a process which has become intertwined with various
emotional and affective qualities. Our respondents who agreed that they always ‘simply wanted to own’ are expressing this kind of mix of both material and non- material views of
54
buying of flat. Indeed, politicians and policymakers both in Hong Kong and elsewhere have taken the view that home ownership enhances social inclusion and social cohesion. Thus, in referring to the HOS scheme in the early 1990s the HOS former Secretary for Home Affairs Peter Tsao suggested that the policy was about more than ‘bricks and mortar’, and sought to “foster a sense of belonging and engender social stability and shared prosperity” (Tsao, 1991). Similarly, the former Chairman of the HA Home Ownership Committee, Charles Sin had earlier stated that , “[H]ome ownership is conducive to a more stable society as home-owners are committed to the place in which they have a stake…HOS is instrumental in pursuing this objective” (HKHA, 1984b). That may be a belief which his open to some empirical challenge but it has certainly underlain a lot of the pro-home ownership policies of governments around the world.
The material, or asset based, qualities of home ownership have, however, gained greater prominence in social policy debate since over the last two decades or so. Home ownership has been strongly associated with asset-based social policy-a concept, if not a term, which has always been a central feature of housing policy in Asian societies. Assisted home ownership schemes can be contrasted with social or public rental housing schemes as a comparison between an asset as opposed to need based approach. With the former type of housing policy, long term welfare for families is linked to, investment and long terms asset accumulation). The HOS extended home ownership downward to the low to middle-income families who were unable to afford buying a flat in the private property market (Sherranden, 1991; 1992a,b). HOS owners would use their flats as a financial resource over the life course,
such as borrowing from a bank under the Reverse Mortgage Programme introduced in 2011 (Hong Kong Monetary Authority, 2011; Hong Kong Mortgage Corporation Limited, 2016). This approach aims to foster social cohesion through upward mobility and financial sustainability. This is a particularly important consideration in societies like Hong Kong with a widening wealth gap and increasing income inequality. It also returns to the view supported in this survey that owners and renters are on increasingly divergent paths-particularly perhaps in relation to asset accumulation. If ownership is a more distant prospect and significantly higher levels of home ownership are unlikely in the foreseeable future, what is on offer to those unable to enter the residential property market? A smaller home ownership sector is not a problem if it represents a flow rather than a stock. In other words there must still be a prospect of movement into the sector from outside.
In this context, it is also worth observing that encouraging and enabling households to buy can have the opposite impact on their wellbeing when there is a severe downturn. The so-called global financial crisis demonstrated the vulnerability of lower income households with unpayable mortgage debts. For Hong Kong it also demonstrated the important safety net to households and society represented by public rental housing in such circumstances.

55
Policy Recommendations
Affordability
The HOS has been very successful in providing affordable housing. However, the existing policy fails to take care of the significant portion of the middle-class who are not eligible for the HOS. Existing policy considers them self-sufficient in housing. Nonetheless, they cannot afford to purchase a flat in the private property market. Even if they could, they would have to put up with a heavy mortgage burden and a reduced quality of life. In other words, you must either be poor enough to qualify for public rental housing or you must be rich enough to buy a flat and having the means to pay the mortgage. Those caught in that middle ground,
the sandwich class will remain sizeable, particularly while house prices continue to escalate. More specifically, the high discount rate for those who are eligible for HOS can itself create problems in the future when owners come to sell. The high discount enhances affordability at the time of buying but sets a high hurdle for reselling. This could impede residential mobility. It is suggested that for this reason, the discount norm should be 30 per cent. Mobility
To further enhance residential mobility the government should consider reviewing the restrictions on HOS/TPS owners with regard to the secondary market. HOS/TPS purchasers should be permitted to enter the secondary market and the flats they vacate should be
restricted to resale on the secondary market. Such a policy change would potentially increase mobility among low to middle income owners, enhance and extend housing opportunities and hopefully create a better fit between housing and households. The Housing Ladder
At the moment, HOS/TPS purchasers have to take the pay the full amount of the premium when they resell on the open market. It is proposed that there should be some flexibility in when the premium is repaid prior to any resale. Households may prefer to pay off portions of the premium as part of their upgrading strategy. Some ‘staircasing’ of the repayments could ease the next step on the housing ladder for some households.
Creating More Rental Opportunities
Restrictions regarding the repayment of the premium may act to deter the renting out of vacant or underused space in the HOS/TPS sector. Given the excess demand for affordable rental space, and particularly the difficulties faced by younger households, At present, if an HOS/TPS owner wishes to rent all or part of their dwelling, they have to repay the full premium. It is proposed that some consideration should be given to allowing renting out without the repayment of the premium with the rental income being shared with the HKHA in the same proportion as the initial discount rates. This idea resonates with suggestions from the new Chief Executive that social enterprise could be used to manage this kind of innovative
housing policy.
56
Public Dissemination When the analysis is fully completed, dissemination to the wider public is planned in a variety of ways. An open seminar will be held at an appropriate venue and the secondary data analysis and survey data will be available via the CityU Urban Research Group website. Any working papers will also be available there. In addition, it is planned to prepare a press release and draft newspaper articles in English and Chinese. These shorter pieces will also be made available online.

57
Bibliography
Brown, T. (1999). (ed.), Stakeholder Housing: A Third Way. London: Pluto Press, 1999.
Census and Statistics Department. (1987). Hong Kong Annual Digest of Statistics (1987 Edition). Hong Kong: Census and Statistics Department, 1987.
Census and Statistics Department. (1989). Hong Kong Annual Digest of Statistics (1989 Edition). Hong Kong: Census and Statistics Department, 1989, p.196.
Census and Statistics Department. (1996). Hong Kong Annual Digest of Statistics (1996 Edition). Hong Kong: Census and Statistics Department, 1996, p.198.
Census and Statistics Department. (1998). Hong Kong Annual Digest of Statistics (1998 Edition).
Hong Kong: Census and Statistics Department, 1998, p.135.
Census and Statistics Department. (2004). Hong Kong Annual Digest of Statistics (2004 Edition).
Hong Kong: Census and Statistics Department, 2004, p.173.
Census and Statistics Department. (2016). Hong Kong Annual Digest of Statistics (2016 Edition).
Hong Kong: Census and Statistics Department.
Chan. K. W. (2000). Prosperity or inequality: deconstructing the myth of home ownership in Hong
Kong. Housing Studies, 15(1), 28-43.
Cheung, A. (2013). Rebuilding the Housing Ladder, Speech given at the Hong Kong Institute of
Surveyors Annual Conference 2013, 14 September 2013.
Forrest, R., Murie, A. & Gordon, G. (1995). The Resale of Former Council Homes, London: HMSO.
Forrest, R. and Murie, A. (1988). Selling the Welfare State: The Privatisation of Public Housing.
London: Routledge, 1988, pp.218-50.
Forrest, R. and Murie, A. & Hawes, D. (1995). Leaseholders and Service Charges in Former Local
Authority Flats, London: H.M.S.O.
Forrest, R., & Yip, N. M. (2014). The Future for Reluctant Intervention: The Prospects for Hong
Kong's Public Rental Sector. Housing Studies, 29(4), 551-565.
Forrest, R., & Yip, N. M. (Eds.). (2011). Housing markets and the global financial crisis: The uneven
impact on households. Edward Elgar Publishing.
Forrest, R., & Yip, N. M. (Eds.). (2012). Young people and housing: transitions, trajectories and
generational fractures. Routledge.
Forrest, R., Gordon, D. & Murie, A. (1996). ‘The Position of Former Council Homes in the Housing
Market. Urban Studies, 33:2,125-136.
Forrest, R., Hawes D., & Murie A. (1993). Services Charges on Former Local Authority Flats Report
for the Department of the Environment.
Ho, E. (1991). Speech by The Hon. Edward S. T. Ho, JP at the motion Debate on Sale of Flats to
Sitting Tenants Scheme on 27 November 1991. Hong Kong: Legislative Council, 1991.

58
Ho, L. S., & WONG, G. W. C. (2006). Privatization of public housing: did it cause the 1998 recession
in Hong Kong?. Contemporary Economic Policy, 24(2), 262-273.
Ho, M. H. (2004). Privatization of public housing in Hong Kong: a genuine agenda or propaganda.
Habitat International, 28(3), 481-494.
Home Affairs Branch. (1991). New Scheme to Provide Home Ownership Opportunity, Press Release, 8 May 1991.
Hong Kong Housing Authority. (1976). Way Ahead Clear for Housing Authority to Build First 6,000 Flats for Sale. Press Release, 25 November 1976.
Hong Kong Housing Authority. (1979). Hosing Chief Wary of Speculators in Home Ownership
Scheme, Press Release, 12 November 1979.
Hong Kong Housing Authority. (1982a). Annual Report 1981/82. Hong Kong: Hong Kong Housing Authority, 1982.
Hong Kong Housing Authority. (1982b). Housing (Amendment) Bill 1982 Gazetted, Press Release, 29 January 1982a.
Hong Kong Housing Authority. (1982c). 33,000 Application for Home Ownership Flats without
Land Values. Press Release, 16 February.
Hong Kong Housing Authority. (1984a). A Review of Public Housing Allocation Policies: A
Consultative Document. Hong Kong: Hong Kong Housing Authority, 1984.
Hong Kong Housing Authority. (1984b). Greater Flexibility in the Public Housing Programme –
Chairman of Home Ownership Committee Suggests, Press Release, 24 August 1984.
Hong Kong Housing Authority. (1985a). Arrangements for Resale of HOS Flats Revised. Press
Release, 31 October 1985.
Hong Kong Housing Authority. (1985b). HOS Flats To Be Sold Equally between Green and White
Form Applicants – Housing Spokesman Reiterates, Press Release, 4 December 1985.
Hong Kong Housing Authority. (1987a). Long Term Housing Strategy 1987: A Policy Statement.
Hong Kong: Government Information Services, 1987.
Hong Kong Housing Authority. (1987b). Home Ownership Committee Endorses Proposal to
Transfer Rental Flats to HOS Sales Programme. Press Release, 23 April 1987.
Hong Kong Housing Authority. (1989). Study on Proposed Sale of Public Housing Flats to Sitting
Tenants. Press Release, 22 June 1989.
Hong Kong Housing Authority. (1992). Report on the Review of Schemes to Promote Home
Ownership. Hong Kong: Hong Kong Housing Authority.
Hong Kong Housing Authority. (1994a). Final Report on the Mid-Term Review of the Long Term Housing Strategy. Hong Kong: Hong Kong Housing Authority, 1994.
Hong Kong Housing Authority. (1994b). Report on the Review of Schemes to Promote Home Ownership; Hong Kong: Hong Kong Housing Authority, 1994.

59
Hong Kong Housing Authority. (1996a). Report on the Review of Home Ownership Schemes. Hong
Kong: Hong Kong Housing Authority, 1996, p.3.
Hong Kong Housing Authority. (1996b). The Enhanced Home Purchase Loan Scheme for Green
Form Applicants Annual Quota for 1995/96 & 1996/97. Hong Kong: Hong Kong Housing Authority, 1996.
Hong Kong Housing Authority. (1997a). Long Term Housing Strategy Review: Home Purchase
Loan Scheme. Hong Kong: Hong Kong Housing Authority, 1997.
Hong Kong Housing Authority. (1997b). Memorandum for the Housing Authority: Tenants
Purchase Scheme. Hong Kong: Hong Kong Housing Authority, 1997, p.1.
Hong Kong Housing Authority. (1998). Hong Kong Housing Authority, Annual Report 1997/98.
Hong Kong: Hong Kong Housing Authority, 1998, pp.69-71.
Hong Kong Housing Authority. (1999). Annual Report 1998/99. Hong Kong: Hong Kong Housing
Authority, 1999, p. 72.
Hong Kong Housing Authority. (2000). Annual Report 1999/2000. Hong Kong: Hong Kong Housing
Authority, 2000, p.63.
Hong Kong Housing Authority. (2002). Memorandum for the Housing Authority: Statement on
Housing Policy by the Secretary for Housing, Planning and Lands on 13 November 2002. Hong Kong: Hong Kong Housing Authority, 2002, p.3, Annex C.
Hong Kong Housing Authority. (2002). New Home Assistance Loan Scheme to be Launched Soon, Press Release, 16 December 2002.
Hong Kong Housing Authority. (2003). Annual Report 2002/03. Hong Kong: Hong Kong Housing Authority, 2003, pp.31-35.
Hong Kong Housing Authority. (2004a). Review of the Home Assistance Loan Scheme. Hong Kong: Legislative Council, 2004.
Hong Kong Housing Authority. (2004b). Home Assistance Loan Scheme to be terminated, Press
Release, 2 June 2004.
Hong Kong Housing Authority. (2010). Memorandum for the Subsidised Housing Committee:
Revitalising the Home Ownership Scheme Secondary Market. Hong Kong: Hong Kong Housing
Authority, 2010, Annex D, p.8.
Hong Kong Housing Authority. (2012). Memorandum for the Subsidised Housing Committee of
the Hong Kong Housing Authority: Sale of Remaining Surplus Home Ownership Scheme Flats and New Home Ownership Scheme Flats. Hong Kong: Hong Kong Housing Authority, 2012, p.2.
Hong Kong Housing Authority. (2014a). Memorandum for the Subsidised Housing Committee: Income and Asset Limits for the Sale of Home Ownership Scheme Flats 2014. Hong Kong: Hong
Kong Housing Authority, 2014, p.8.
Hong Kong Housing Authority. (2014b). Memorandum for the Subsidised Housing Committee:
Sale of Home Ownership Scheme Flats 2014 – Sale Prices and Sales Arrangements. Hong Kong: Hong Kong Housing Authority, 2014, pp.2-4.
60
Hong Kong Housing Authority. (2015a). Ballots Drawn for New Round of Interim Scheme to
Extend the Home Ownership Scheme Secondary Market to White Form Buyers. Press Release, 29 October 2015.
Hong Kong Housing Authority. (2015b). Ballots Drawn for Sale of Home Ownership Scheme Flats 2014. Press Release, 26 March 2015.
Hong Kong Housing Authority. (2016a). Ballots Drawn for Sale of Home Ownership Scheme Flats
2016, Press Release, 10 May 2016.
Hong Kong Housing Authority. (2016b). Selling Price and Sales Arrangements for Green Form
Subsidised Home Ownership Pilot Scheme Endorsed. Press Release, 12 September 2016.
Hong Kong Housing Authority. (2016c). Application for Purchase under Green Form Subsidised
Home Ownership Pilot Scheme to Start on October 20, Press Release, 12 October 2016.
Hong Kong Housing Authority. (2016d). Ballots Drawn for Sale of Green Form Subsidised Home
Ownership Pilot Scheme Flats, Press Release, 6 December 2016.
Hong Kong Housing Authority. (2016d). Ballots Drawn for Sale of Green Form Subsidised Home
Ownership Pilot Scheme Flats.
Hong Kong Housing Authority. (2016e). Allocation of Unused Quota under New Round of Interim
Scheme to Extend the Home Ownership Scheme Secondary Market to White Form Buyers, Press Release, 25 February 2016.
Hong Kong Housing Authority. (2016f). Housing in Figures 2016. Hong Kong: Hong Kong Housing Authority.
Hong Kong Monetary Authority. (2011). Launch of the Reverse Mortgage Programme. Press Release, 11 July 2011.
Hong Kong Mortgage Corporation Limited. (2016). Reverse Mortgage: Brightens Up Your Retired Life. Hong Kong: Hong Kong Mortgage Corporation Limited, 2016, p.2.
Housing Branch. (1978a). Private Developers Invited to Participate in Home Ownership Scheme,
Press Release, 28 April 1978.
Housing Branch. (1978b). Home Ownership Scheme Tailor-made for Hong Kong, Press Release,
23 June 1978.
La Grange, A., & Pretorius, F. (2005). Shifts along the decommodification-commodification
continuum: Housing delivery and state accumulation in Hong Kong. Urban Studies, 42(13), 2471-
2488.
Lau, K.Y. (2005). Report of the Study on Home Ownership Promotion Policy Development in Hong
Kong: Statistics and Interpretations on Home Ownership Scheme and the Private Sector Participation Scheme, Department of Public and Social Administration, City University of Hong
Kong.
Lee, J. (1999). Housing, home ownership, and social change in Hong Kong. Aldershot: Ashgate.

61
Lee, J. (2003). “The Home Ownership Scheme and its Continuing Needs,” in Y. Yeung, M. and
Wong, K. Y. (eds.), Fifty Years of Public Housing in Hong Kong: A Golden Jubilee Review and Appraisal. Hong Kong: Hong Kong Housing Authority and Hong Kong Institute of Asia-Pacific
Studies.
Legislative Council Panel on Housing. (2010a). Relaunching of Home Ownership Scheme and
Revitalisation of the HOS Secondary Market. Hong Kong: Legislative Council, 2010, pp.2-3.
Legislative Council Panel on Housing. (2010b). Updated Background Brief, p.2.
Legislative Council Panel on Housing. (2012). Updated Background Brief on Re-launching of the
Home Ownership Scheme and Tenants Purchase Scheme prepared by the Legislative Council
Secretariat. Hong Kong: Legislative Council, 2012, p.3.
Legislative Council Panel on Housing. (2014). Updated Background Brief, p.4.
Legislative Council. (1991). Legislative Council Question No.1, Council Proceeding. 23 October
1991.
Legislative Council. (1994). Legislative Council Question No.4, Council Proceeding, 23 November
1994.
Legislative Council. (2012). Legislative Council Question No.7: Tenants Purchase Scheme, Council
Proceeding, 29 February 2012.
Legislative Council. (2014). Legislative Council Question No.1: Interim Scheme to Extend the
Home Ownership Scheme Secondary Market to White Form Buyers, Council Proceeding, 17 December 2014.
Legislative Council. (2016). Legislative Council Question No.5: The Role of the Hong Kong Housing Authority in the Management of Tenants Purchase Scheme Estates, Council Proceeding, 16 May
2016.
Leung C. Y. (2014). Policy Address: Support the Needy, Let Youth Flourish, Unleash Hong Kong’s
Potential. Hong Kong: Information Services Department, 2014.
Leung, C.Y. (2015). Policy Address: Policy Agenda, p.26.
Leung, C.Y. (2016). The 2016 Policy Address: Policy Agenda. Hong Kong: Information Services
Department, 2016, p.43.
Leung, W.T. (1993). “Housing,” in Po-king Choi and Lok-sang Ho (eds.), The Other Hong Kong
Report 1997. Hong Kong: The Chinese University Press, 1993), p.267.
Leung. C.Y. (2015). Policy Address: Policy Agenda. Hong Kong: Information Services Department,
2015, p.26.
Lui,S.S. & Yeung, R.W. (2013). The Impact of Home Ownership Scheme on Hong Kong Property
Market From 1997 to 2012. Economics and Finance Department. Policy Address.
MacLehose, M. (1976). The Governor Sir Murray MacLehose G.B.E., K.C.M.G., K.C.V.O., at the
Opening Session of the Legislative Council on October 6, 1976. Hong Kong: Government Information Services

62
MacLehose, M. (1977). The Governor Sir Murray MacLehose G.B.E., K.C.M.G., K.C.V.O., at the
Opening Session of the Legislative Council on October 5, 1977. Hong Kong: Government Information Services.
MacLehose, M. (1981). The Governor Sir Murray MacLehose G.B.E., K.C.M.G., K.C.V.O., at the Opening Session of the Legislative Council on October 11, 1981. Hong Kong: Government
Information Services, 1981.
MacLehose, M. (1982). The Governor on October 11, 1981; Hong Kong Housing Authority.
Housing (Amendment) Bill 1982.
Planning, Environment and Lands Branch. (1991). Objectives of Public Flat Sale Scheme
Elaborated, Press Release, 27 November 1991.
Ronald, R., & Hirayama, Y. (2009). Home alone: the individualization of young, urban Japanese
singles. Environment and planning. A, 41(12), 2836.
Sherraden, M. (1992a). Assets and the Poor: A New American Welfare Policy. Armonk, N.Y.: M.E.
Sharpe, 1991.
Sherranden, M. (1992b). “Asset-Based Social Welfare Policy: Homeownership for the Poor”. The Journal of Sociology & Social Welfare 1992:19(3), pp.65-67.
Suen, M. (2002). A Statement on Housing Policy by Hon. Michael M. Y. SUEN, GBS, JP, Secretary for Housing, Planning and Lands. Hong Kong: Information Services Department, 2002, p.10.
Sze,J.W. (2005). An evaluation of tenant purchase scheme (TPS) : the right model towards sustainable housing in Hong Kong through privatization?. Hong Kong: University of Hong Kong.
The Office of the Financial Secretary. (1976). Hong Kong May Build Flats for Sale, Press Release, 16 March 1976.
Transport and Housing Bureau, Public Consultation on Subsidising Home Ownership. Hong Kong: Transport and Housing Bureau, 2010.
Transport and Housing Bureau. (2014). Long Term Housing Strategy Implementation Milestones
as at December 2014. Hong Kong: Transport and Housing Bureau, 2014, pp.1-2.
Tsang, D. (2001). Statement by the Chief Secretary for Administration, the Honourable Donald
Tsang, JP on 3 September 2001: A Statement on Housing. Hong Kong: Information Services
Department, 2001, pp.2-3.
Tsang, D. (2011). 2011 – 2012 Policy Address: From Strength to Strength. Hong Kong: Information
Services Department, 2011.
Tsao, P. (1991). Speech by the Secretary for Home Affairs, the Hon. Peter Tsao in the Adjournment
Debate on 8 May 1991. Hong Kong: Legislative Council, 1991.
Working Party on Home Ownership. (1977a). Government’s Home Ownership Scheme. Press Release, 4 March 1977.
Working Party on Home Ownership. (1977b). Background Brief on the Government’s Home Ownership Scheme. Hong Kong: Government Information Services.

63
Working Party on Home Ownership. (1977c). Second Background Brief on the Government’s
Home Ownership Scheme. Hong Kong: Government Information Services.
Yip, N. M., Forrest, R., & La Grange, A. (2007). Cohort trajectories in Hong Kong's housing system:
1981–2001. Housing Studies, 22(1), 121-136.

64
Appendix 1
Questionnaire-English version
Survey on Tenant Purchase Scheme, Home Ownership Scheme, and Social
and Residential Mobility
Jan 2017
GROUPING
Group 1: TPS households[K1 = a; K2 = a; K5=a]=> Not less than 200 samples
Group 2: HOS households (white form)[K1 = b; K2 = a; K5 = a; K6 = a]
Group 3: HOS households (green form)[K1 = b; K2 = a; K5 = a; K6 = b]
Group 4: HOS households (open or secondary market)[K1 = a/b; K2 = a; K5 = b/c]
=> Group 2/3/4: Not less than 200 samples in total
Group 5: Previously bought HOS/TPS property[K1 = c; K2 = a/b; K4 = a]=> Not less than
100 samples
Group 6: Public housing tenants[K1 = a; K2 = b; K3 = a]=> Not less than 200 samples
Group 7:Private housing tenants[K1 = c; K2 = b]or[K1 = a/b; K2 = b; K3 = b][Interview
ends, thank you for your cooperation!]=> No need to interview
Group 8:Private housing households[K1 = c; K2 = a; K3 = b/c][Interview ends, thank you
for your cooperation!]=> No need to interview
Family Composition[Group 1/2/3/4/5/6]
H1. Not counting domestic helper, how many people live in this property?
_____________________ people [Input exact number]
Don’t know/hard to say
Refuse to answer
H2. Who else lives in this flat? (Do not read out options, multiple answers allowed)
a. My partner
b. My child(ren)
c. My parents / parents-in-law
d. My sons / daughters-in-law

65
e. My grand-parents / grand-parents-in-law
f. My grand-children-in-law
g. Other relatives
h. Others (please specify): ______________________
i. Don’t know/hard to say
j. Refuse to answer
H3. Right before moving into this flat, what kind of housing did you live in? (Read out
options 1-5, only one answer is allowed)
a. Public housing tenants
b. TPS households
c. HOS households
d. Private housing tenants
e. Private housing households
f. Others (please specify): ______________________
g. Don’t know/hard to say
h. Refuse to answer
Ownership and Home Loans[Group 1/2/3/4]
A1. When did you buy it?
a. _____________________ year(s) [Input exact number]
b. Don’t know/hard to say
c. Refuse to answer
A2. Who has the title of the property? (Do not read out options, only one answer is
allowed)
a. I and my partner (skip to A4)
b. Only Myself (skip to A4)
c. Only My partner (skip to A4)
d. Others (skip to A3)
e. Don’t know/hard to say (skip to A4)
f. Refuse to answer (skip to A4)
A3. [Only ask respondents who answered “others” in A2] If it is not you or your partner,
who holds the title? (Do not read out options, multiple answers allowed)

66
a. My parents / parent in-law
b. My child(ren)
c. Shared among my parents / parents in law and myself / partner
d. Shared among my child(ren) and myself / partner
e. Others (please specify): ______________________
f. Don’t know/hard to say
g. Refuse to answer
A4. Are all those who hold the title of the property living in this property?
a. Yes
b. No
c. Don’t know/hard to say
d. Refuse to answer
A5. Do you remember who paid for the mortgage when you first bought the flat? (Do not
read out options, only one answer is allowed)
a. I and my partner (skip to A7a)
b. Only Myself (skip to A7a)
c. Only My partner (skip to A7a)
d. No mortgage (skip to A7a)
e. Others (skip to A6)
f. Don’t know/hard to say (skip to A7a)
g. Refuse to answer (skip to A7a)
A6. [Only ask respondents who answered “others” in A5] If it was not paid by you or your
partner, who paid for the mortgage? (Do not read out options, multiple answers allowed)
a. My parents / parent in-law
b. My child(ren)
c. Shared among my parents / parents in law and myself / partner
d. Shared among my child(ren) and myself / partner
e. Others (please specify): ______________________
f. Don’t know/hard to say
g. Refuse to answer
A7a. Do you still have a mortgage?
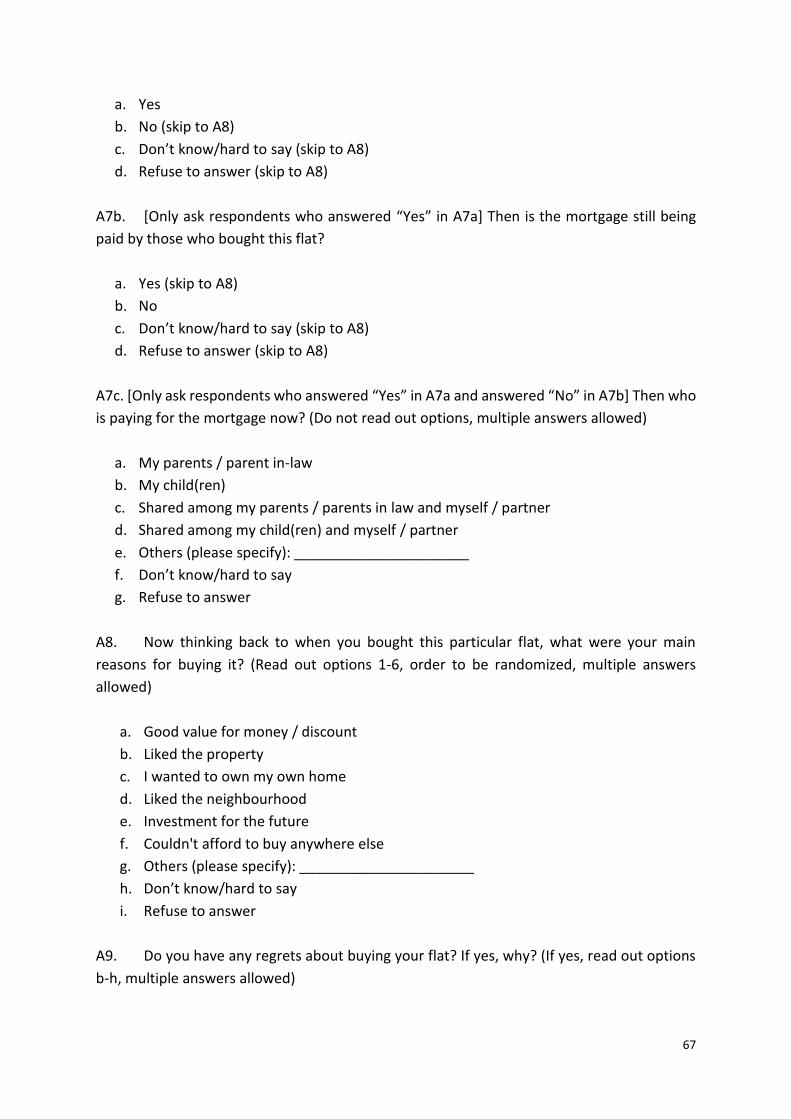
67
a. Yes
b. No (skip to A8)
c. Don’t know/hard to say (skip to A8)
d. Refuse to answer (skip to A8)
A7b. [Only ask respondents who answered “Yes” in A7a] Then is the mortgage still being
paid by those who bought this flat?
a. Yes (skip to A8)
b. No
c. Don’t know/hard to say (skip to A8)
d. Refuse to answer (skip to A8)
A7c. [Only ask respondents who answered “Yes” in A7a and answered “No” in A7b] Then who
is paying for the mortgage now? (Do not read out options, multiple answers allowed)
a. My parents / parent in-law
b. My child(ren)
c. Shared among my parents / parents in law and myself / partner
d. Shared among my child(ren) and myself / partner
e. Others (please specify): ______________________
f. Don’t know/hard to say
g. Refuse to answer
A8. Now thinking back to when you bought this particular flat, what were your main
reasons for buying it? (Read out options 1-6, order to be randomized, multiple answers
allowed)
a. Good value for money / discount
b. Liked the property
c. I wanted to own my own home
d. Liked the neighbourhood
e. Investment for the future
f. Couldn't afford to buy anywhere else
g. Others (please specify): ______________________
h. Don’t know/hard to say
i. Refuse to answer
A9. Do you have any regrets about buying your flat? If yes, why? (If yes, read out options
b-h, multiple answers allowed)

68
a. None (skip to B1)
b. Yes, not big enough
c. Yes, not a good investment
d. Yes, difficult to sell at the right price
e. Yes, difficult to move somewhere else
f. Yes, neighbourhood has got worse
g. Yes, economic conditions of family changed
h. Yes, other conditions of family changed
i. Yes, others (please specify): ______________________
j. Don’t know/hard to say
k. Refuse to answer
A10. Since you bought your flat, have you thought about moving?
a. Yes
b. No (skip to B1)
A11. Why so? (Read out options 1-7, order to be randomized, multiple answers allowed)
a. Wanted a bigger flat
b. Wanted a smaller flat
c. Wanted a newer property
d. Wanted to live in a better neighbourhood
e. To be nearer family, friends
f. Just fancied a move
g. Problems with neighbours
h. Others (please specify): ______________________
i. Don’t know/hard to say
j. Refuse to answer
A12. Have you actively tried to move home?
a. Yes (skip to A13)
b. No (skip to A14)
c. Don’t know/hard to say (skip to A15a)
d. Refuse to answer (skip to A15a)
A13. [Only ask respondents who answered “Yes” in A12] Why didn’t you move at last?
(Read out options 1-6, order to be randomized, multiple answers allowed)
a. Could not get a good enough price to sell this property

69
b. Could not afford to buy the kind of property I wanted somewhere else
c. Just decided I might as well stay here
d. Family and friends live around here
e. Family circumstances changed
f. I couldn’t afford it
g. Others (please specify): ______________________
h. Don’t know/hard to say
i. Refuse to answer
A14. [Only ask respondents who answered “No” in A12] Why didn’t you try? (Read out
options 1-4, order to be randomized, multiple answers allowed)
a. Didn’t think I would get a good enough price for this property
b. Just haven’t got round to it
c. Decided I am happy enough here
d. Family circumstances changed
e. Others (please specify): ______________________
f. Don’t know/hard to say
g. Refuse to answer
A15a. Thinking about when you (last) tried to move, where did you want to move to? (Do
not read out options, multiple answers allowed)
a. Hong Kong: _________ district
b. Mainland China
c. Taiwan
d. United States
e. Canada
f. Australia
g. United Kingdom
h. Others (please specify): ______________________
i. Don’t know/hard to say
j. Refuse to answer
Other properties
B1. Do you own other properties? If yes, where are they located? (Read out options 2-4,
multiple answers allowed)
a. No (If respondents belong to Group 1/3, skip to C1; if respondents belong to Group 2/4,
skip to D1)

70
b. Yes, in Hong Kong
c. Yes, in Mainland China
d. Yes, overseas
e. Refuse to answer (If respondents belong to Group 1/3, skip to C1; if respondents belong
to Group 2/4, skip to D1)
B2. [Only ask respondents who answered “Yes, in Hong Kong”, “Yes, in Mainland China”
and “Yes, overseas” in B1] Then are they for self-living or rental?
a. Self-living (If respondents belong to Group 1/3, skip to C1; if respondents belong to
Group 2/4, skip to D1)
b. Rental (If respondents belong to Group 1/3, skip to C1; if respondents belong to Group
2/4, skip to D1)
c. Refuse to answer (If respondents belong to Group 1/3, skip to C1; if respondents belong
to Group 2/4, skip to D1)
Previously Bought HOS/TPS Property[Group 5]
F1. In what year did you buy that public housing/HOS flat?
a. _____________________ year(s) [Input exact number]
b. Don’t know/hard to say
c. Refuse to answer
F2. Which estate/court was that?
a. _____________________(See Appendix I)
b. Don’t know/hard to say
c. Refuse to answer
F3. Do you have any regrets about buying the flat?
a. Yes
b. No (skip to F5)
c. Don’t know/hard to say (skip to F5)
d. Refuse to answer (skip to F5)
F4. [Only ask respondents who answered “Yes” in F3] Why do you say that? (Read out
options 1-5, order to be randomized, multiple answers allowed)
a. Not big enough (skip to D1)
b. Not a good investment (skip to D1)
c. Difficult to sell at the right price (skip to D1)

71
d. Difficult to move somewhere else (skip to D1)
e. Neighbourhood has got worse (skip to D1)
f. Others (please specify): ______________________(skip to D1)
g. Don’t know/hard to say (skip to D1)
h. Refuse to answer (skip to D1)
F5. Looking back, what were the main reasons for moving? (Read out options 1-4, order
to be randomized, multiple answers allowed)
a. Wanted a bigger flat (skip to D1)
b. Wanted a smaller flat (skip to D1)
c. Wanted to live in a better neighbourhood (skip to D1)
d. Couldn’t afford to live in other places (skip to D1)
e. Others (please specify): ______________________ (skip to D1)
f. Don’t know/hard to say (skip to D1)
g. Refuse to answer (skip to D1)
TPS and HOS Households (Green Form)[Group 1/3]
C1. As TPS buyer or HOS white form buyer, you need to relinquish your old public rental
flat. Who was the head of household in the tenant registration? (Do not read out options,
only one answer is allowed)
a. Myself
b. My partner
c. My parents / parents in-law
d. My child(ren)
e. Others (please specify): ______________________
f. Don’t know/hard to say
g. Refuse to answer
C2. Besides the head of household of the former public rental flat, have any person(s)
been added as the owners of the current property?
a. Yes
b. No (skip to D1)
c. Don’t know/hard to say (skip to D1)
d. Refuse to answer (skip to D1)
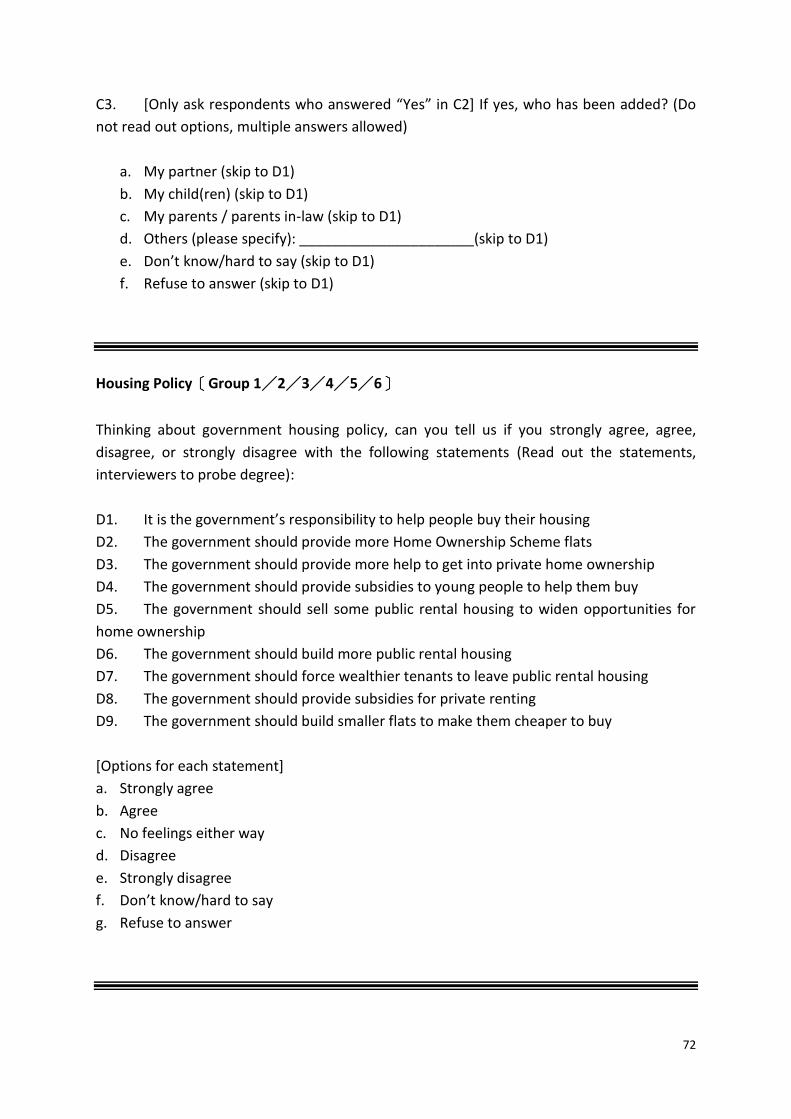
72
C3. [Only ask respondents who answered “Yes” in C2] If yes, who has been added? (Do
not read out options, multiple answers allowed)
a. My partner (skip to D1)
b. My child(ren) (skip to D1)
c. My parents / parents in-law (skip to D1)
d. Others (please specify): ______________________(skip to D1)
e. Don’t know/hard to say (skip to D1)
f. Refuse to answer (skip to D1)
Housing Policy[Group 1/2/3/4/5/6]
Thinking about government housing policy, can you tell us if you strongly agree, agree,
disagree, or strongly disagree with the following statements (Read out the statements,
interviewers to probe degree):
D1. It is the government’s responsibility to help people buy their housing
D2. The government should provide more Home Ownership Scheme flats
D3. The government should provide more help to get into private home ownership
D4. The government should provide subsidies to young people to help them buy
D5. The government should sell some public rental housing to widen opportunities for
home ownership
D6. The government should build more public rental housing
D7. The government should force wealthier tenants to leave public rental housing
D8. The government should provide subsidies for private renting
D9. The government should build smaller flats to make them cheaper to buy
[Options for each statement]
a. Strongly agree
b. Agree
c. No feelings either way
d. Disagree
e. Strongly disagree
f. Don’t know/hard to say
g. Refuse to answer
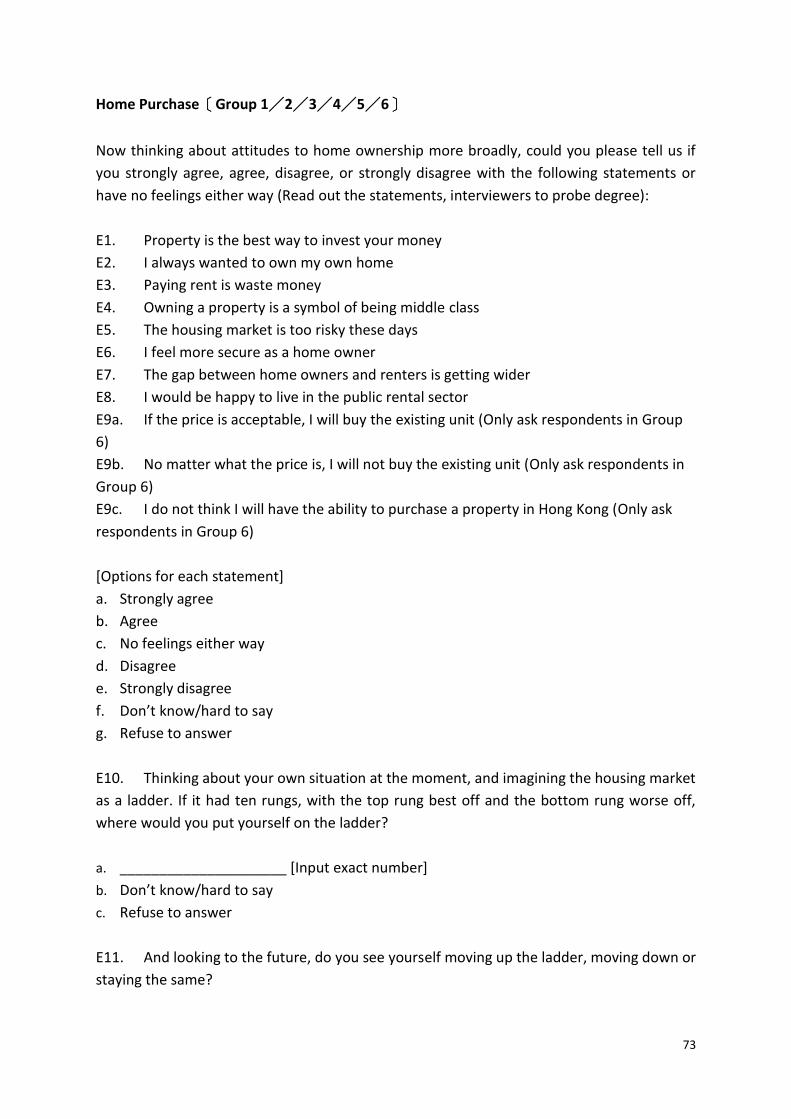
73
Home Purchase[Group 1/2/3/4/5/6]
Now thinking about attitudes to home ownership more broadly, could you please tell us if
you strongly agree, agree, disagree, or strongly disagree with the following statements or
have no feelings either way (Read out the statements, interviewers to probe degree):
E1. Property is the best way to invest your money
E2. I always wanted to own my own home
E3. Paying rent is waste money
E4. Owning a property is a symbol of being middle class
E5. The housing market is too risky these days
E6. I feel more secure as a home owner
E7. The gap between home owners and renters is getting wider
E8. I would be happy to live in the public rental sector
E9a. If the price is acceptable, I will buy the existing unit (Only ask respondents in Group
6)
E9b. No matter what the price is, I will not buy the existing unit (Only ask respondents in
Group 6)
E9c. I do not think I will have the ability to purchase a property in Hong Kong (Only ask
respondents in Group 6)
[Options for each statement]
a. Strongly agree
b. Agree
c. No feelings either way
d. Disagree
e. Strongly disagree
f. Don’t know/hard to say
g. Refuse to answer
E10. Thinking about your own situation at the moment, and imagining the housing market
as a ladder. If it had ten rungs, with the top rung best off and the bottom rung worse off,
where would you put yourself on the ladder?
a. _____________________ [Input exact number]
b. Don’t know/hard to say
c. Refuse to answer
E11. And looking to the future, do you see yourself moving up the ladder, moving down or
staying the same?

74
a. Moving up
b. Moving down
c. Staying the same
d. Don’t know/hard to say
e. Refuse to answer
Demographics of Respondents
[DM1] Gender
Male
Female
[DM2] Age
__________ [Input exact number]
Refuse to answer
[DM2a] Age (range) [For those who do not want to tell their exact age] (Interviewer can
read out the intervals)
18-19
20-24
25-29
30-34
35-39
40-44
45-49
50-54
55-59
60-64
65-69
70 or above
Refuse to answer
[DM3] Occupation
Managers and administrators
Professionals
Associate professionals
Clerks
Service workers

75
Shop sales workers
Skilled agricultural and fishery workers
Craft and related workers
Plant and machine operators and assemblers
Drivers
Non-skilled workers
Domestic helpers
Unclassified
Others
Refuse to answer
[DM4] Personal monthly income
No income
Below HK$5,000
HK$5,000-7,099
HK$7,100-9,999
HK$10,000-14,999
HK$15,000-19,999
HK$20,000-29,999
HK$30,000-39,999
HK$40,000-49,999
HK$50,000 or above
Not stable
Refuse to answer
[DM5] Family monthly income
No income
Below HK$5,000
HK$5,000-7,099
HK$7,100-9,999
HK$10,000-14,999
HK$15,000-19,999
HK$20,000-29,999
HK$30,000-39,999
HK$40,000-49,999
HK$50,000 or above
Not stable
Refuse to answer
[DM6] Name of current estate/court
____________________________ (See Appendix I)

76
Refuse to answer
[DM7] Are you willing to be interviewed again?
Yes
No
Refuse to answer

77
Appendix 2
Questionnaire-Chinese version
租者置其屋計劃(租置計劃)、居者有其屋計劃(居屋)與社會及居住流動性
基本結構
前言
對於香港市民來說,房屋是非常重要的議題。這項研究針對市民置業的機會。請問你
能否花十數分鐘的時間回答以下的問題?我們主要希望了解你的置業經驗及你對房屋
議題的意見。
戶主?
首先,請問你是否戶主或他/她的配偶?
a. 否[請問我可以和戶主或他/她的配偶談談嗎?]
b. 不在家[請問我什麼時候可以再次來電?]
篩選問題
K1. 請問你住在:
a. 公屋
b. 居屋
c. 私人樓宇
K2. 請問你的單位是:
a. 買
b. 租
c. 其他
K3. [K1 = a 及 K2 = b]請問你是從何處租住單位?
a. 房委會
b. 私人業主
c. 其他
K4. [K1 = c]請問你是否曾經透過置或居屋計劃買入單位?

78
a. 是
b. 否
K5. [K1 = a/b 及 K2 = a]請問你是從何處買入單位?
a. 房委會
b. 公開市場
c. 二手市場
K6. [K1 = b 及 K5 = a]請問你是:
a. 白表買家
b. 綠表買家
分組
第 1 組:租置計劃業主[K1 = a 及 K2 = a]
第 2 組:居屋業主(白表)[K1 = b 及 K2 = a 及 K5 = a 及 K6 = a]
第 3 組:居屋業主(綠表)[K1 = b 及 K2 = a 及 K5 = a 及 K6 = b]
第 4 組:租置計劃/居屋業主(公開/二手市場)[K1 = a/b 及 K2 = a 及 K5 = b/c]
第 5 組:曾經買入租置計劃/居屋單位的私人樓宇業主/租戶[K1 = c 及 K2 = a/b 及
K4 = a]
第 6 組:公屋租戶[K1 = a 及 K2 = b 及 K3 = a]
第 7 組:私人樓宇租戶[K1 = c 及 K2 = b]或[K1 = a/b 及 K2 = b 及 K3 = b][完,多
謝你接受訪問!]
第 8 組:私人樓宇業主[K1 = c 及 K2 = a 及 K3 = c][完,多謝你接受訪問!]
家庭組成[第 1/2/3/4/5/6 組]
H1. 請問有多少人住在該單位?(不包括家庭傭工)
H2. 請問誰人住在該單位?(可選多項)
a. 我的配偶
b. 我的子女
c. 我的父母/岳父/岳母
d. 我的女婿/媳婦
e. 我的祖父母/ 外祖父母
f. 我的孫/外孫
g. 其他親戚

79
h. 其他(請註明)
H3. 在搬入該單位前,請問你住在哪一類別的房屋?
i. 公屋租戶
j. 私人樓宇租戶
k. 居屋
l. 租置計劃
m. 私人樓宇業主
n. 其他(請註明)
業權及房屋貸款[第 1/2/3/4 組]
A1. 請問你什麼時候買入?(年份)
A2. 請問誰擁有單位的業權?
g. 我和我的配偶
h. 我
i. 我的配偶
j. 其他(請註明)
A3. [A2 = d]如果不是你或你的配偶,哪是誰擁有單位的業權?
a. 父母/岳父/岳母
b. 子女
c. 與父母/岳父/岳母共享
d. 與子女共享
e. 其他(請註明)
f. 拒答[不讀]
A4. 請問是否所有業權人仍在該單位居住?
e. 是
f. 否
A5. 你還記得當你買入單位時,是由誰人支付房屋貸款?
a. 我和我的配偶
b. 我
c. 我的配偶
d. 當時沒有房屋貸款
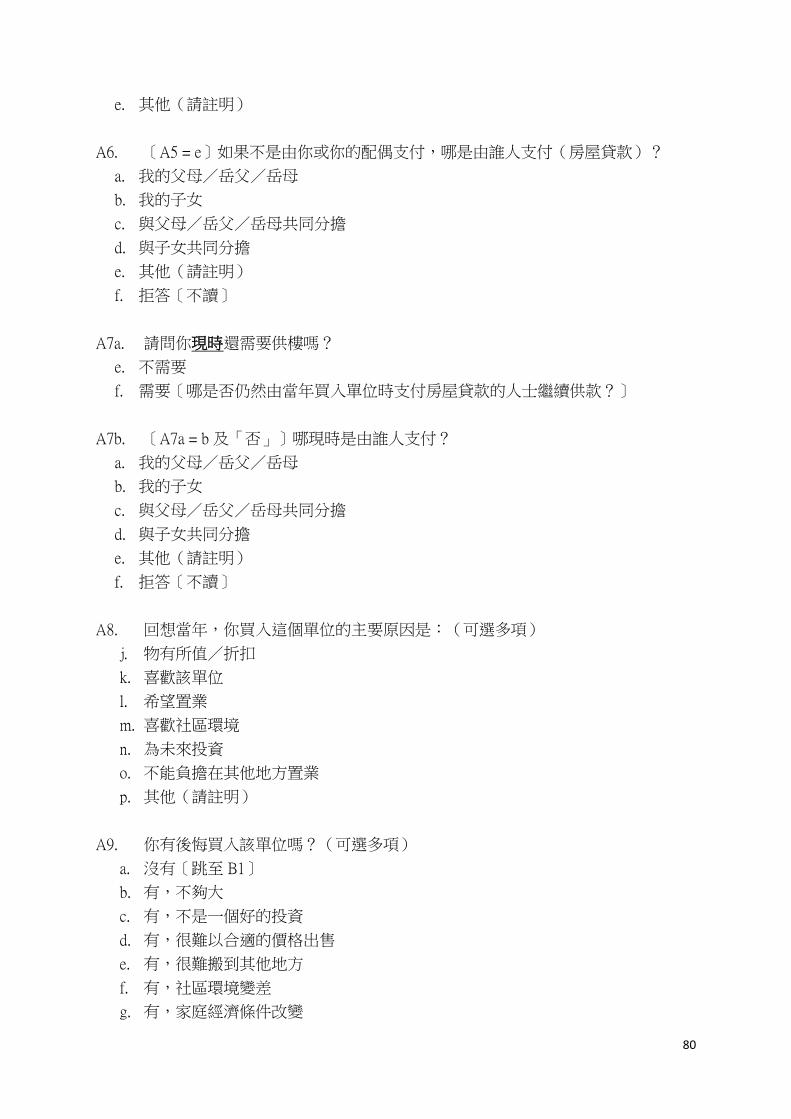
80
e. 其他(請註明)
A6. [A5 = e]如果不是由你或你的配偶支付,哪是由誰人支付(房屋貸款)?
a. 我的父母/岳父/岳母
b. 我的子女
c. 與父母/岳父/岳母共同分擔
d. 與子女共同分擔
e. 其他(請註明)
f. 拒答[不讀]
A7a. 請問你現時還需要供樓嗎?
e. 不需要
f. 需要[哪是否仍然由當年買入單位時支付房屋貸款的人士繼續供款?]
A7b. [A7a = b 及「否」]哪現時是由誰人支付?
a. 我的父母/岳父/岳母
b. 我的子女
c. 與父母/岳父/岳母共同分擔
d. 與子女共同分擔
e. 其他(請註明)
f. 拒答[不讀]
A8. 回想當年,你買入這個單位的主要原因是:(可選多項)
j. 物有所值/折扣
k. 喜歡該單位
l. 希望置業
m. 喜歡社區環境
n. 為未來投資
o. 不能負擔在其他地方置業
p. 其他(請註明)
A9. 你有後悔買入該單位嗎?(可選多項)
a. 沒有[跳至 B1]
b. 有,不夠大
c. 有,不是一個好的投資
d. 有,很難以合適的價格出售
e. 有,很難搬到其他地方
f. 有,社區環境變差
g. 有,家庭經濟條件改變

81
h. 有,其他家庭因素改變
i. 有,其他(請註明)
A10. 自買入該單位後,你有否想過搬屋?
c. 有
d. 沒有[跳至 B1]
A11. 為什麼?
k. 想要一個更大的單位
l. 想要一個較小的單位
m. 想要一個較新的單位
n. 想住在一個更好的社區
o. 想住在家人、朋友附近
p. 只是想搬家
q. 與鄰里之間的問題
r. 其他(請註明)
A12. 請問你有否積極嘗試搬屋?
e. 有[跳至 A13]
f. 沒有[跳至 A14]
A13. 為何最終沒有搬?
j. 原本的單位賣不到好價錢
k. 沒有能力在其他地方買入我想要的單位
l. 最終認為留在這裡也不錯
m. 家人和朋友住在附近
n. 家庭環境改變
o. 未能負擔
p. 其他(請註明)
A14. 為何沒有積極嘗試考慮?
h. 不認為原本的單位能賣到好價錢
i. 最終沒有坐言起行
j. 最終認為留在這裡也不錯
k. 家庭環境改變
l. 其他(請註明)
A15. 回想你最後一次嘗試搬屋,你想搬到哪裡?(open answers)

82
其他物業
B1. 請問你是否擁有任何其他物業?
f. 沒有
g. 有,在香港
h. 有,在國內
i. 有,在國外
j. 拒答[不讀]
B2. [B1 = b/c/d]哪是第二個家,抑或是用來出租?
d. 出租
e. 第二個家
f. 二者皆不
g. 拒答[不讀]
曾經買入租置計劃/居屋單位的私人樓宇業主/租戶[第 5 組]
F1. 請問你什麼時候買入?(年份)
F2. 請問你曾經買入的租置計劃/居屋單位在哪個屋苑?
F3. 請問你有否後悔買入該單位嗎?
e. 有
f. 沒有
F4. [F3 = a]為什麼? (可選多項)
i. 不夠大
j. 不是一個好的投資
k. 很難以合適的價格出售
l. 很難搬到其他地方
m. 社區環境變差
n. 其他(請註明)
F5. 回想當年,你搬屋的主要原因是:(可選多項)
a. 想要一個更大的單位
b. 想要一個較小的單位
c. 想住在一個更好的社區

83
d. 不能負擔在其他地方置業
e. 其他(請註明)
租置計劃及居屋(綠表)業主[第 1/3 組]
C1. 作為租置計劃及綠表居屋買家,你需要放棄你的公屋單位。請問誰是當時公屋
登記的戶主?
a. 我
b. 我的配偶
c. 我的父母/岳父/岳母
d. 我的子女
e. 其他(請註明)
C2. 除了當時公屋登記的戶主,有否增添其他人士為現有單位的業權人?
e. 有
f. 否
C3. [C2 = a]哪是誰?(可選多項)
g. 我的配偶
h. 我的子女
i. 我的父母/岳父/岳母
j. 其他(請註明)
房屋政策[第 1/2/3/4/5/6 組]
我們希望進一步了解市民對政府房屋政策的意見。請你以「非常同意」、「同意」、
「不同意」或「非常不同意」來回答以下的觀點/說法。
非常同
意
同意 中立[
不讀]
不同意 非常不同
意
D1. 協助市民置業是政府的
責任
政府應該:

84
D2. 提供更多居屋單位
D3. 為市民在私人市場置業
提供更多幫助
D4. 資助青年置業
D5. 出售部分公屋單位,擴
闊置業的機會
D6. 出售大量公屋單位,擴
闊置業的機會
D7. 興建更多公屋
D8. 迫使公屋富戶離開公屋
單位
D9. 資助市民在私人市場租
住房屋
D10. 興建面積較小、價格較
便宜的單位
置業[第 1/2/3/4/5/6 組]
我們希望進一步了解市民對置業的意見。請你以「非常同意」、「同意」、「不同意」
或「非常不同意」來回答以下的觀點/說法。
非常同意
同意 中立
[不
讀]
不同意 非常不同
意
E1. 物業是最佳的投資

85
E2. 我經常希望擁有自己的物業
E3. 交租是浪費金錢
E4. 擁有物業是中產階級的象徵
E5. 現時的房屋市場太過危險險
太大
E6. 作為業主讓我感覺更安全
E7. 業主與租客之間的差距越來
越大
E8. 我很樂意租住公屋
E9a. 如果價錢合適,我會買入現
有單位[第 6 組]
E9b. 無論是什麼價錢,我都不會
買入現有單位[第 6 組]
E9c. 我不認為我將來有能力在香
港置業[第 6 組]
E10. 假設房屋市場是一個階梯,而它有十個梯級,頂部為最好、底部為最差;按照
你目前的情況,你覺得自己在一至十的哪一級?
E11. 展望未來,你認為自己會向上移動、向下移動,還是保持不變?
f. 向上移動
g. 向下移動
h. 保持不變
i. 不知道
基本資料[第 1/2/3/4/5/6 組]

86
感謝你參與是次問卷調查!在完成之前,我們希望了解 閣下的基本資料:(the
options will be substantiated later)
E1. 年齡
E2. 職業
E3. 收入
E4. 現有單位的屋苑/屋邨名稱
E5. 請問你是否願意再次接受訪問?
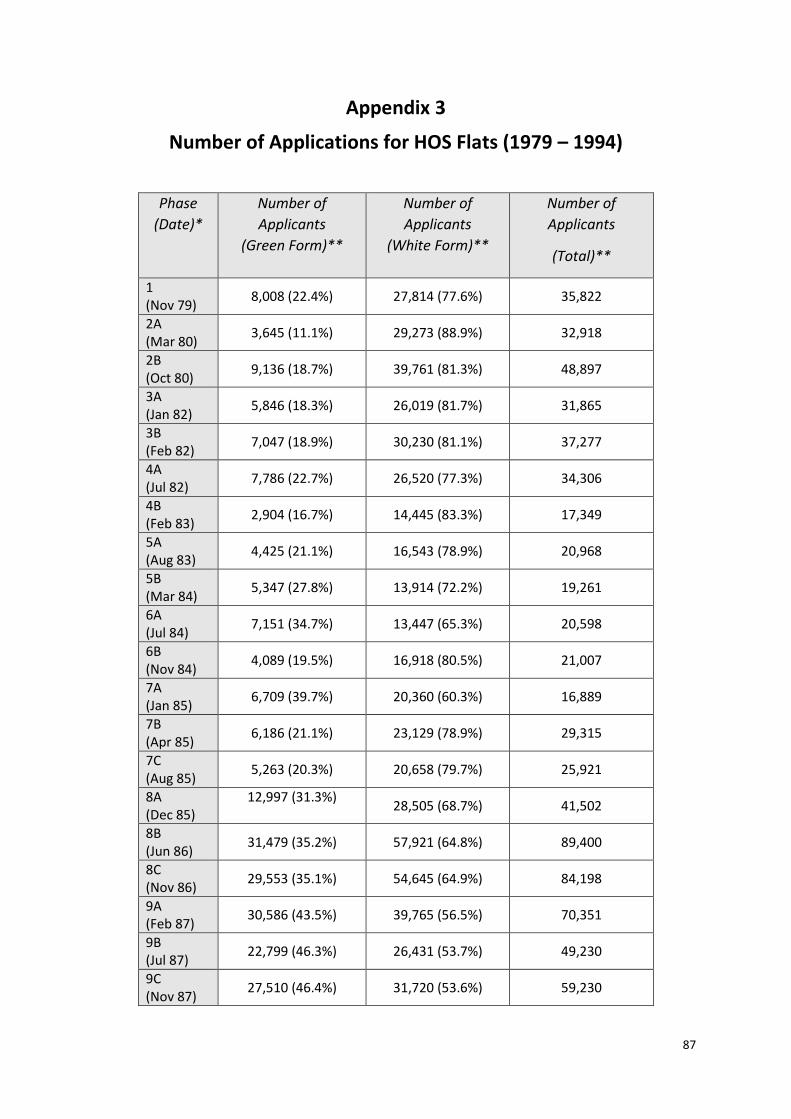
87
Appendix 3
Number of Applications for HOS Flats (1979 – 1994)
Phase
(Date)*
Number of
Applicants
(Green Form)**
Number of
Applicants
(White Form)**
Number of
Applicants
(Total)**
1 (Nov 79)
8,008 (22.4%) 27,814 (77.6%) 35,822
2A (Mar 80)
3,645 (11.1%) 29,273 (88.9%) 32,918
2B (Oct 80)
9,136 (18.7%) 39,761 (81.3%) 48,897
3A (Jan 82)
5,846 (18.3%) 26,019 (81.7%) 31,865
3B (Feb 82)
7,047 (18.9%) 30,230 (81.1%) 37,277
4A (Jul 82)
7,786 (22.7%) 26,520 (77.3%) 34,306
4B (Feb 83)
2,904 (16.7%) 14,445 (83.3%) 17,349
5A (Aug 83)
4,425 (21.1%) 16,543 (78.9%) 20,968
5B (Mar 84)
5,347 (27.8%) 13,914 (72.2%) 19,261
6A (Jul 84)
7,151 (34.7%) 13,447 (65.3%) 20,598
6B (Nov 84)
4,089 (19.5%) 16,918 (80.5%) 21,007
7A (Jan 85)
6,709 (39.7%) 20,360 (60.3%) 16,889
7B (Apr 85)
6,186 (21.1%) 23,129 (78.9%) 29,315
7C (Aug 85)
5,263 (20.3%) 20,658 (79.7%) 25,921
8A (Dec 85)
12,997 (31.3%)
28,505 (68.7%) 41,502
8B (Jun 86)
31,479 (35.2%) 57,921 (64.8%) 89,400
8C (Nov 86)
29,553 (35.1%) 54,645 (64.9%) 84,198
9A (Feb 87)
30,586 (43.5%) 39,765 (56.5%) 70,351
9B (Jul 87)
22,799 (46.3%) 26,431 (53.7%) 49,230
9C (Nov 87)
27,510 (46.4%) 31,720 (53.6%) 59,230
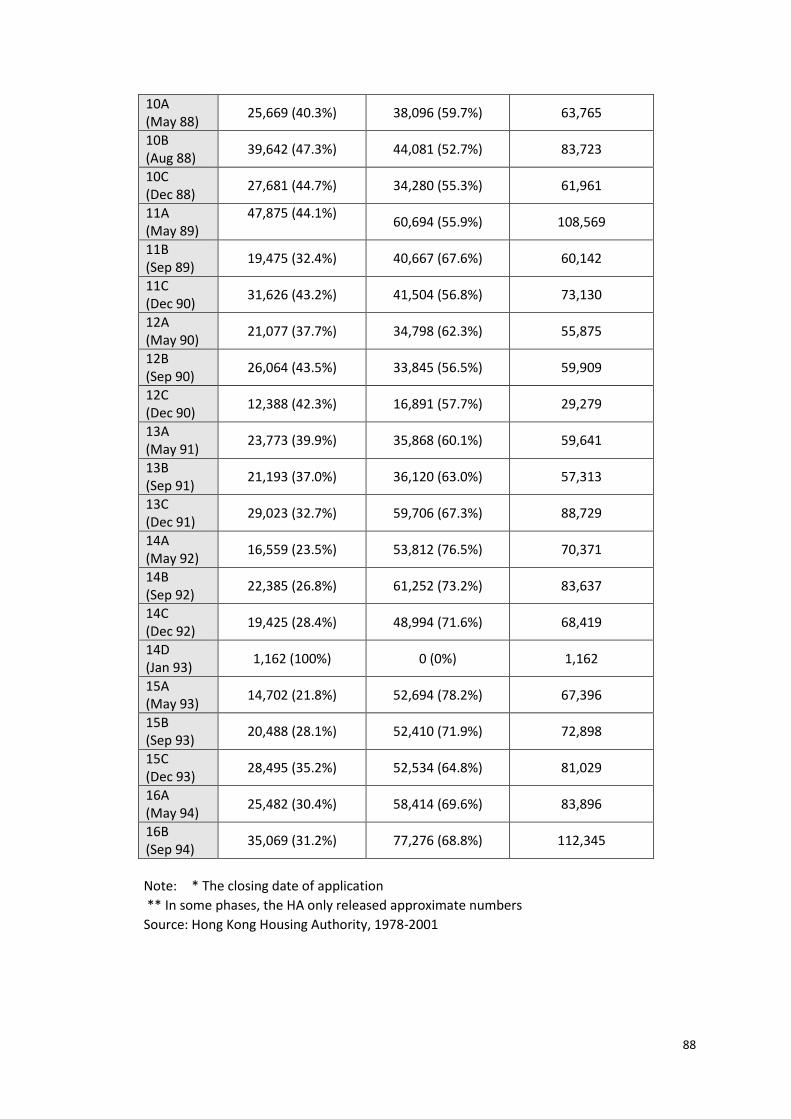
88
10A (May 88)
25,669 (40.3%) 38,096 (59.7%) 63,765
10B (Aug 88)
39,642 (47.3%) 44,081 (52.7%) 83,723
10C (Dec 88)
27,681 (44.7%) 34,280 (55.3%) 61,961
11A (May 89)
47,875 (44.1%)
60,694 (55.9%) 108,569
11B (Sep 89)
19,475 (32.4%) 40,667 (67.6%) 60,142
11C (Dec 90)
31,626 (43.2%) 41,504 (56.8%) 73,130
12A (May 90)
21,077 (37.7%) 34,798 (62.3%) 55,875
12B (Sep 90)
26,064 (43.5%) 33,845 (56.5%) 59,909
12C (Dec 90)
12,388 (42.3%) 16,891 (57.7%) 29,279
13A (May 91)
23,773 (39.9%) 35,868 (60.1%) 59,641
13B (Sep 91)
21,193 (37.0%) 36,120 (63.0%) 57,313
13C (Dec 91)
29,023 (32.7%) 59,706 (67.3%) 88,729
14A (May 92)
16,559 (23.5%) 53,812 (76.5%) 70,371
14B (Sep 92)
22,385 (26.8%) 61,252 (73.2%) 83,637
14C (Dec 92)
19,425 (28.4%) 48,994 (71.6%) 68,419
14D (Jan 93)
1,162 (100%) 0 (0%) 1,162
15A (May 93)
14,702 (21.8%) 52,694 (78.2%) 67,396
15B (Sep 93)
20,488 (28.1%) 52,410 (71.9%) 72,898
15C (Dec 93)
28,495 (35.2%) 52,534 (64.8%) 81,029
16A (May 94)
25,482 (30.4%) 58,414 (69.6%) 83,896
16B (Sep 94)
35,069 (31.2%) 77,276 (68.8%) 112,345
Note: * The closing date of application
** In some phases, the HA only released approximate numbers
Source: Hong Kong Housing Authority, 1978-2001

89
Appendix 4
Discount Rate of HOS Flats (1981 – 2016)
Application Period Phase Discount Rate (%)
Application Period Phase Discount Rate (%)
1981/82 3B 47 1993/94 15A 15B 15C
40 45 48
1982/83 4A 4B 4P
40 39 7 1994/95 16A
16B 48 48
1983/84 5A 5B
27 26
1995/96 17A 17B
45 45
1984/85 6A 6B 7A 7B
17 – 25 14 26 21 – 23
1996/97 18A 18B 18C
45 45 45
1985/86 7C 8A
21 – 23 24
1997/98 19A 19B 19C
50 50 40 – 60 1986/87 8B
8C 9A
24 24 24 1998/99 MS1
20A 20B
50 35 – 45 45 1987/88 9B
9C 24 24
1999/2000 001 21A 21B
45 45 – 48 44 1988/89 10A
10B 10C
24 – 26 30 – 32 30 – 32 2000/01 22A
22B 47 44
1989/90 11A 11B 11C
35 – 39 36 – 37 35 – 37 2001/02 23A 40
2002/03 24A 30
1990/91 12A 12B 12C
30 30 – 33 30
2006/07 S01 30
2007/08 S02 S03
30 30
1991/92 13A 13B 13C
30 – 35 35 40
2008/09 S04 30
2009/10 S05 S06
30 30
1992/93 14A 14B 14C 14D
37 45 45 45
2012/13 S07 30
2014/15 (New HOS)
2014 30
2015/16 (New HOS)
2016 30
Source: Hong Kong Housing Authority

90
Appendix 5
Summary Technical Report on Survey
This summary report draws on a fuller technical report prepared for the research team by POP- The University of Hong Kong Public Opinion Programme. The full report is available on request. Method
The telephone interviews were conducted by interviewers working under close supervision. All data were collected by interviewers using a Web-based Computer Assisted Telephone Interview (Web-CATI) system invented in-house by the POP team, which allowed real-time data capture and consolidation.
Telephone numbers were randomly generated using known prefixes assigned to telecommunication services providers under the Numbering Plan provided by the Office of the Communications Authority (OFCA). Invalid numbers were then eliminated according to computer and manual dialing records to produce the final sample.
The target population of the survey was Hong Kong householders aged 18 or above who spoke Cantonese. Among the 1,000 plus successful interviews, minimum quotas were set for the following target groups: 1) 200 respondents currently living in TPS
properties, 2) 200 respondents currently living in HOS properties, 3) 100 respondents previously living in HOS/TPS properties, and 4) 200 respondents who are tenants of public housing. After telephone contact was successfully established with a target household, one eligible person was selected using “next birthday rule” for the interview. The fieldwork of the survey was conducted during the period of February 3 to March 23, 2017. A total of 1,033 qualified respondents were successfully interviewed, the distributions of each target group are shown below:
Target group Sample size Percent
Group 1 TPS households 200 19.4%
Group 2 HOS households (white form) 89
274
8.6%
26.5%
Group 3 HOS households (green form) 120 11.6%
Group 4 HOS households (open or
secondary market) 65 6.3%
Group 5 Previously bought HOS/TPS
property 102 9.9%
Group 6 Public housing tenants 457 44.2%
Total 1,033 100.0%

91
As shown in Table 1 below, the effective response rate of this survey was 79.0%, and the standard sampling error for percentages based on the overall sample was less than 1.6 percentage points. In other words, the sampling error for all percentages using the total sample was less than plus/minus 3.1 percentage points at 95% confidence level.
Table 1. Breakdown of contact information
Frequency Percentage
Respondents’ ineligibility confirmed 10,316 46.2%
Fax / data line 194 0.9%
Invalid number 913 4.1%
Call forwarding 69 0.3%
Non-residence 136 0.6%
Special technological circumstances 29 0.1%
No eligible respondent 8,975 40.2%
Respondents’ ineligibility not confirmed 7,841 35.1%
Always busy 311 1.4%
No answer 4,996 22.4%
Answering device 377 1.7%
Call-blocking 11 <0.1%
Language problem 159 0.7%
No screener completed 1,984 8.9%
Others 3 <0.1%
Respondents’ eligibility confirmed, but failed to complete
the interview 3,140 14.1%
Household-level refusal 10 <0.1%
Known respondent refusal 8 <0.1%
Appointment date beyond the end of the fieldwork period 3,068 13.7%
Partial interview / break off 41 0.2%
Miscellaneous / other reasons 13 0.1%
Complete Interview 1,033 4.6%
Total 22,330 100%

92
Data Collection
Over 150 telephone interviewers were deployed to work on this project, and telephone calls were made between 2:00pm and 10:30pm seven days a week. The average interview time was 12.6 minutes Each target telephone number was called a maximum of 5 times, including different call attempts made during daytime, in the evenings, and also during weekends or public holidays, before it was dropped as “non-contact”. If the target respondent was not immediately available to answer the survey at the time when
initial call was made, interviewers would make attempts to gain their co-operation by re-calling at different time slots, or by making appointment with the respondents and re-called at a specific time slot. Explicit refusals from the target respondents or other household members were recorded as unsuccessful cases and no more re-calls would be made. Following the main fieldwork, a routing error was discovered in the questionnaire which meant that six questions on mobility had been omitted expect for those who stated that they ‘regretted buying the current flat’. The research team requested POP to conduct follow up calls-of those eligible, 316 respondents (69%) were successfully recalled. The data collected on these 6 questions was incorporated into the final dataset.