cehs 2016 poster

1
Interpretable deep learning models to predict protein phenotype from genotype Eric J. Ma 1 , David K. Duvenaud 2 , Jonathan A. Runstadler 1,3 1 Department of Biological Engineering & 3 Division of Comparative Medicine, MIT 2 School of Engineering and Applied Science, Harvard University Problems 1. Pathogen risk determination is currently based on non-standardized measurements and simple heuristics. 2. Mapping from genotype to phenotype is complex. 3. Lack of standardized measurements hampers systematic study & reproducibility. 4. Current machine learning models cannot regress on inputs of variable length. Convolution & Fingerprint Introduction Deep Learning Algorithm Results Future Work Learning Capacity: neural network architecture improvements; prevent overfitting. • Interpretability: better visualizations of convolutional feature maps. • Applications: pathogen genomic surveillance, chemical surveillance. Real-time dashboard for influenza surveillance Risk profile informs tailored interventions Vision • Duvenaud et. al., 2016 (arXiv): prediction of chemical properties on chemical graphs • Genotype: chemical structure; phenotype: chemical property. • Applications in drug screening, toxicity prediction etc. Prior Work toxicity solubility 0 1 2 3 4 5 6 Fingerprint radius 0.8 1.0 1.2 1.4 1.6 1.8 2.0 RMSE (log Mol/L) Circular fingerprints Random conv with large parameters Random conv with small parameters Predictive Features Training Performance Goals • Data set: HIV-1 Protease, Stanford HIV Drug Resistance Database • Train convolutional network on protein graph. • Develop software package for generalized graph regression Protein Graphs Atomic Structure Graph Representation • Nodes: Amino acids with their identities • Edges: Biochemical interactions between amino acids • Biochemical knowledge of each node is encoded as fixed vector. 1 4 -3 1 Input Convolution -2 2 3 2 Fingerprint Non-Linearity 0 2 3 2 7 • Convolutions capture local structure of graph • Non-linearities allow modelling of arbitrary functions Fingerprints represent a fixed-length representation of underlying graph. Graphs with identical nodes and edges will have identical fingerprints. Synthetic Data # Nodes Train Loss Conv::Sine Train Loss Conv::Sum Nodes Train Loss Fingerprint Lin. Reg. Convolution Convolution Fingerprint Lin. Reg. 1 4 -3 1 Σ(node + Σ(neighbors)) 1 4 -3 1 = 5 Σ(sin(node) + Σsin(neighbors)) 1 4 -3 1 = 1.37 = 4 number of nodes • Learn mathematical transforms on top of integer graphs. • Deeper networks converge in fewer iterations with smaller error. • Graph-based convolutional neural nets work on simplemathematical functions. PQVTLWQRPI VTIRIGGQLK EALLDTGADD... PQVTLWQRPI VTIKIGGQLK EALLDTGADD... PQVTLWQRPI VTIKIGGDLK EALLDTGADD... MNPNQKLITI GSICLVVGLI SLILQIGNII... MNPNQKIITI GSICLVMGLI SLILQIGNII... MNPNQKIITI GSICLVVGLI SLILQIGNII... Viral Samples Sequences Models Risk Profile Drug Resistance Antigenicity Replication Rate Aerosol Viability Thermal Stability Visualizing Learned Features ABCDEFGHIJKLMNPQRSTVWXYZ pKa mol. wt degree Σ(dist.) h-phobic disulfide h-bond ionic aromatic arm_sulph cation_pi backbone 00000000001111111 012345678901234567890123456789012345 1112222222222333333 Feature ID Node Properties Edge Properties - - - - • Able to recapitulate known mutations involved in FPV drug resistance. • Interpretable: hydrophobic network of amino acids implicated in FPV resistance. • (left) Dark nodes: highly activating; light nodes: weakly activating • (right) Green ribbon: backbone; Dark blue spheres: top activating nodes; Light blue spheres: neighbors. HIV Protease Drug Resistance • Simple convolutional model comparable with random forest and gradient boost baseline models. Very little overfitting. Model Error Random Forest Gradient Boost Convolution 0.09 0.07 0.14

Upload: eric-ma

Post on 13-Apr-2017

63 views

Category:

Science


0 download

TRANSCRIPT

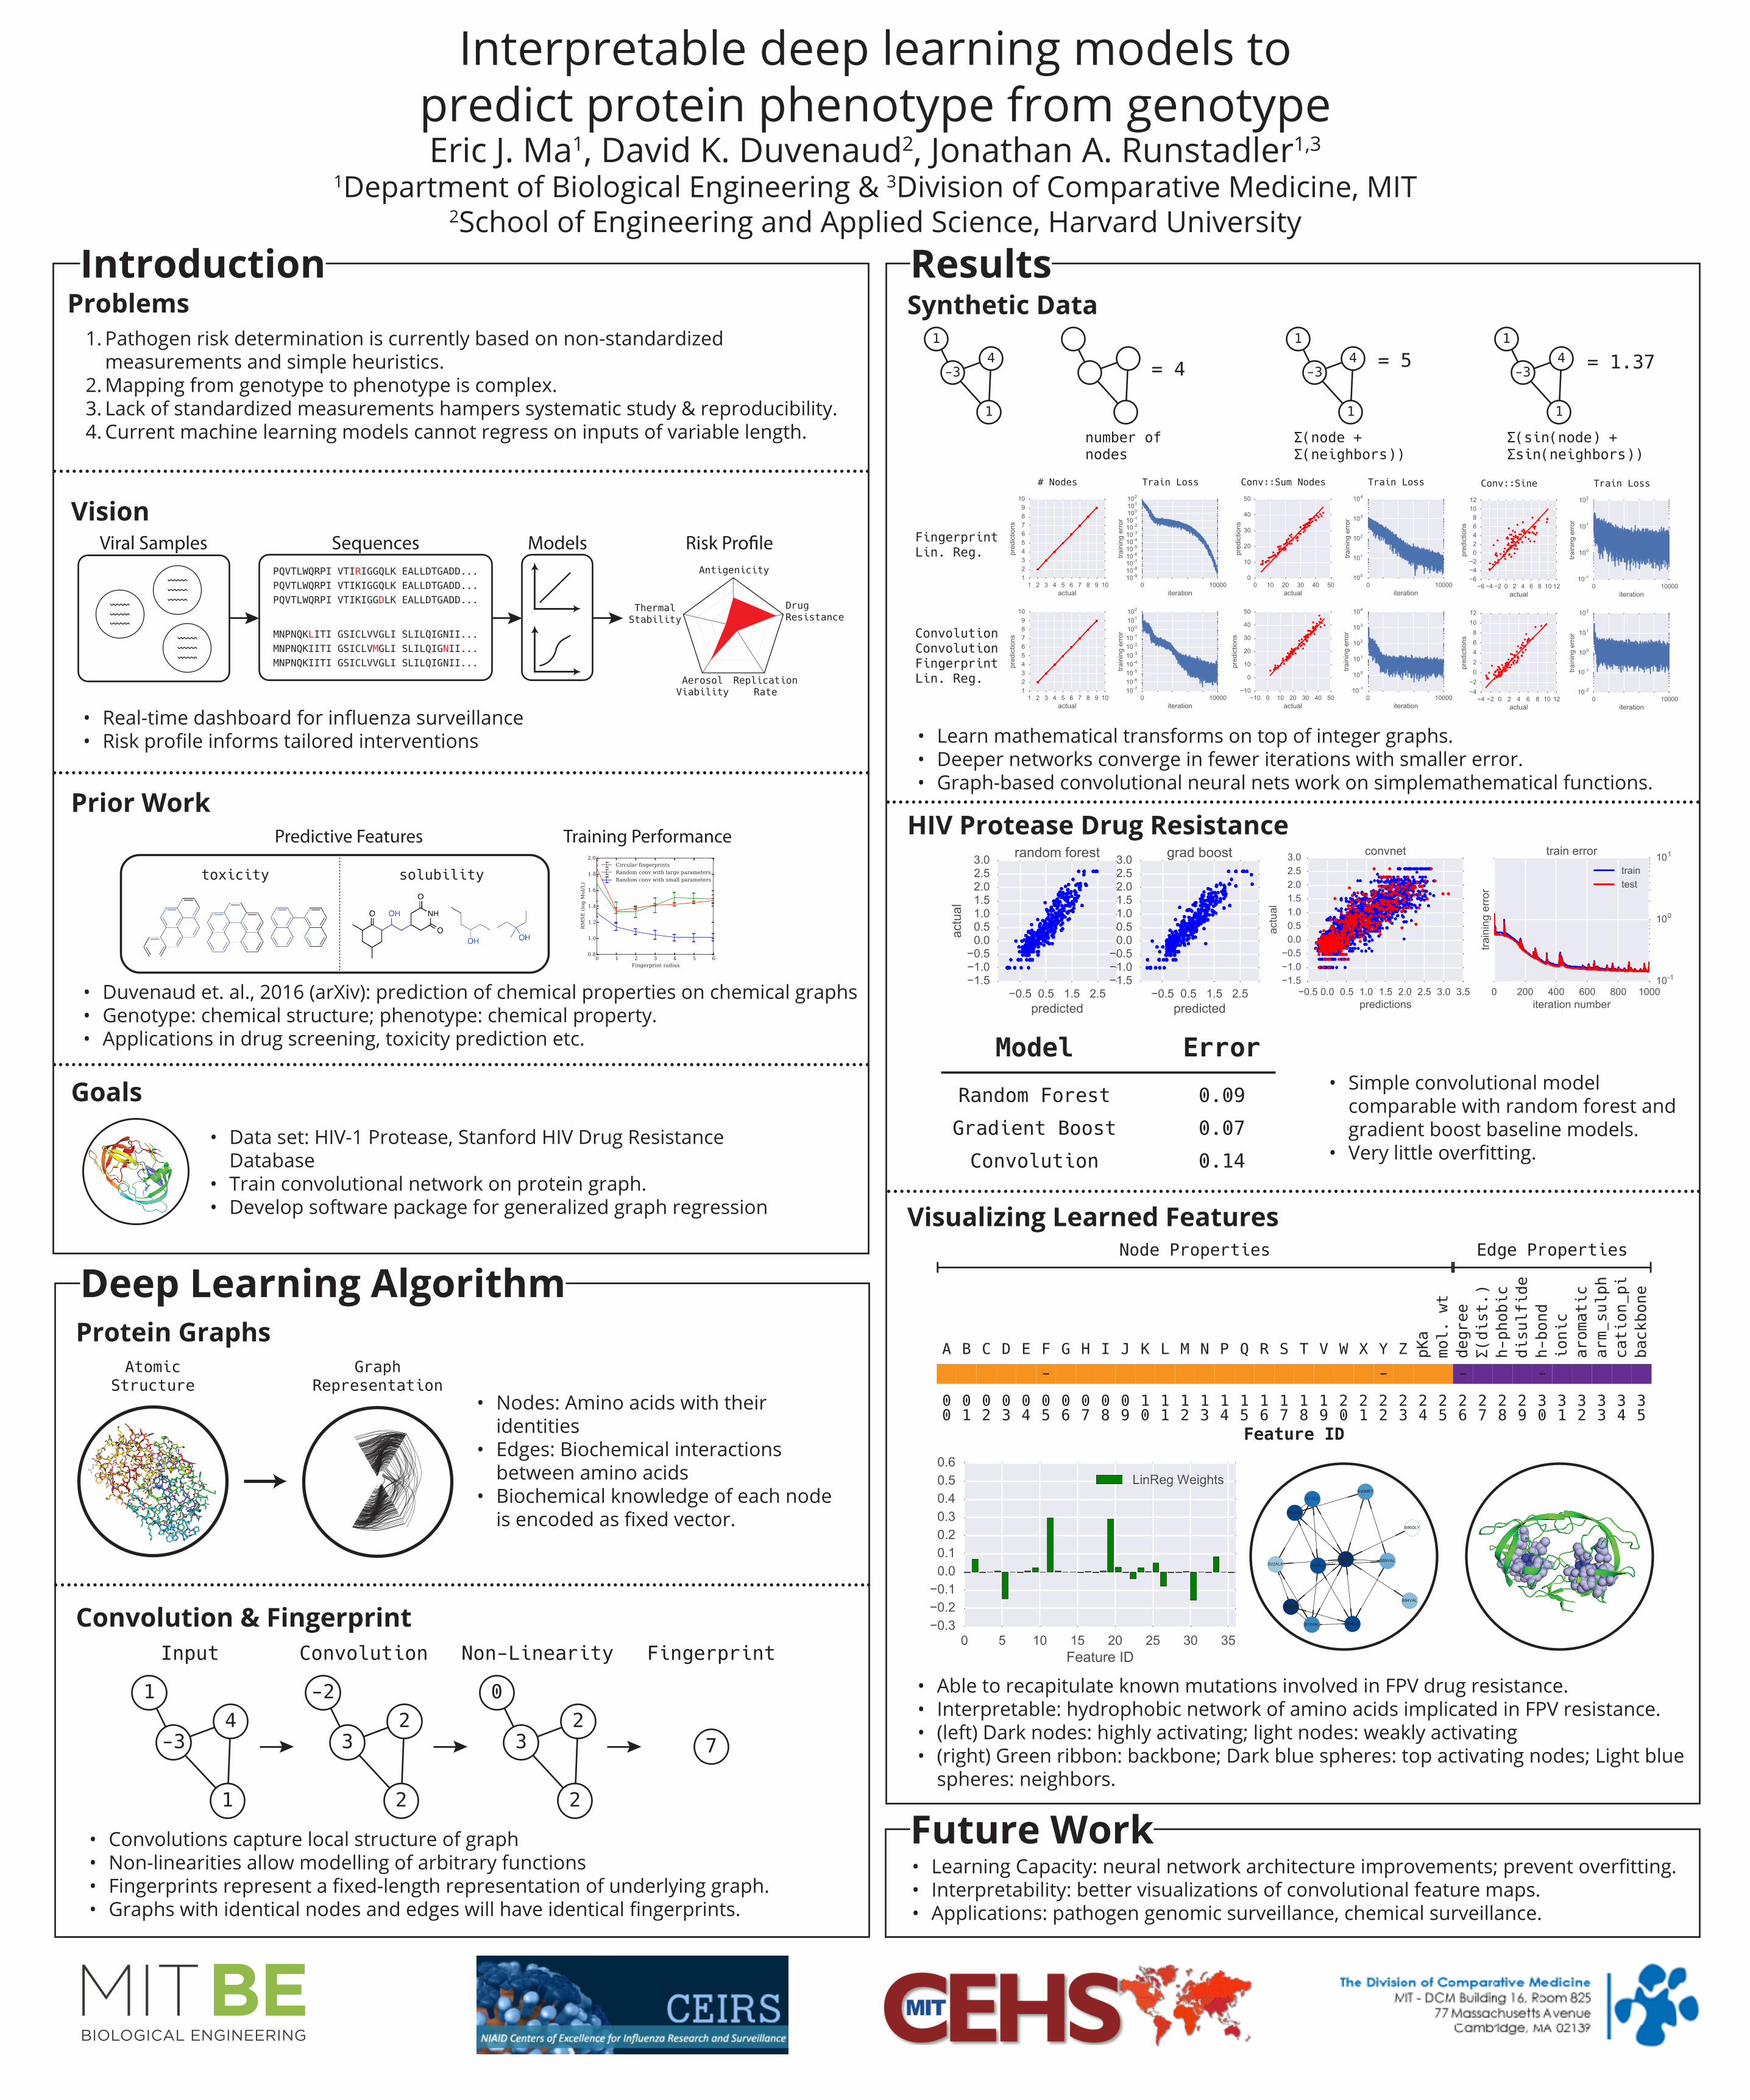
Interpretable deep learning models to predict protein phenotype from genotypeEric J. Ma1, David K. Duvenaud2, Jonathan A. Runstadler1,3

1Department of Biological Engineering & 3Division of Comparative Medicine, MIT 2School of Engineering and Applied Science, Harvard University

Problems1. Pathogen risk determination is currently based on non-standardized

measurements and simple heuristics.2. Mapping from genotype to phenotype is complex.3. Lack of standardized measurements hampers systematic study & reproducibility.4. Current machine learning models cannot regress on inputs of variable length.

Convolution & Fingerprint

Introduction

Deep Learning Algorithm

Results

Future Work• Learning Capacity: neural network architecture improvements; prevent overfitting.• Interpretability: better visualizations of convolutional feature maps.• Applications: pathogen genomic surveillance, chemical surveillance.

• Real-time dashboard for influenza surveillance• Risk profile informs tailored interventions

Vision

• Duvenaud et. al., 2016 (arXiv): prediction of chemical properties on chemical graphs• Genotype: chemical structure; phenotype: chemical property.• Applications in drug screening, toxicity prediction etc.

Prior Work

toxicity solubility

0 1 2 3 4 5 6Fingerprint radius

0.8

1.0

1.2

1.4

1.6

1.8

2.0

RM

SE

(lo

g M

ol/

L)

Circular fingerprints

Random conv with large parameters

Random conv with small parameters

Predictive Features Training Performance

Goals• Data set: HIV-1 Protease, Stanford HIV Drug Resistance

Database• Train convolutional network on protein graph.• Develop software package for generalized graph regression

Protein GraphsAtomic

StructureGraph

Representation• Nodes: Amino acids with their

identities• Edges: Biochemical interactions

between amino acids• Biochemical knowledge of each node

is encoded as fixed vector.

14

-3

1

Input Convolution

-22

3

2

FingerprintNon-Linearity

02

3

2

7

• Convolutions capture local structure of graph• Non-linearities allow modelling of arbitrary functions• Fingerprints represent a fixed-length representation of underlying graph.• Graphs with identical nodes and edges will have identical fingerprints.

Synthetic Data

# Nodes Train Loss Conv::Sine Train LossConv::Sum Nodes Train Loss

FingerprintLin. Reg.

ConvolutionConvolutionFingerprintLin. Reg.

14

-3

1

Σ(node + Σ(neighbors))

14

-3

1

= 5

Σ(sin(node) + Σsin(neighbors))

14

-3

1

= 1.37= 4

number ofnodes

• Learn mathematical transforms on top of integer graphs.• Deeper networks converge in fewer iterations with smaller error.• Graph-based convolutional neural nets work on simplemathematical functions.

PQVTLWQRPI VTIRIGGQLK EALLDTGADD...PQVTLWQRPI VTIKIGGQLK EALLDTGADD...PQVTLWQRPI VTIKIGGDLK EALLDTGADD...

MNPNQKLITI GSICLVVGLI SLILQIGNII...MNPNQKIITI GSICLVMGLI SLILQIGNII...MNPNQKIITI GSICLVVGLI SLILQIGNII...

Viral Samples Sequences Models Risk Pro�le

Drug Resistance

Antigenicity

ReplicationRate

AerosolViability

ThermalStability

Visualizing Learned Features

A B C D E F G H I J K L M N P Q R S T V W X Y Z pKa

mol. wt

degree

Σ(dist.)

h-phobic

disulfide

h-bond

ionic

aromatic

arm_sulph

cation_pi

backbone

0 0 0 0 0 0 0 0 0 0 1 1 1 1 1 1 10 1 2 3 4 5 6 7 8 9 0 1 2 3 4 5 6 7 8 9 0 1 2 3 4 5 6 7 8 9 0 1 2 3 4 5

1 1 1 2 2 2 2 2 2 2 2 2 2 3 3 3 3 3 3

Feature ID

Node Properties Edge Properties

- - - -

• Able to recapitulate known mutations involved in FPV drug resistance.• Interpretable: hydrophobic network of amino acids implicated in FPV resistance.• (left) Dark nodes: highly activating; light nodes: weakly activating• (right) Green ribbon: backbone; Dark blue spheres: top activating nodes; Light blue

spheres: neighbors.

HIV Protease Drug Resistance

• Simple convolutional model comparable with random forest and gradient boost baseline models.

• Very little overfitting.

Model Error

Random Forest

Gradient Boost

Convolution

0.09

0.07

0.14