certified reference material oreas 610
TRANSCRIPT
Document: COA-1400-OREAS610-R1 (Template:BUP-70-10-01 Rev:2.0)
24-July-2019
ORE RESEARCH & EXPLORATION P/L ABN 28 006 859 856
37A Hosie Street · Bayswater North · VIC 3153 · AUSTRALIA
61 3 9729 0333 61 3 9729 8338
[email protected] www.ore.com.au
CERTIFICATE OF ANALYSIS FOR
High Sulphidation Epithermal Au-Cu-Ag Ore
(Mt Carlton, Queensland, Australia)
CERTIFIED REFERENCE MATERIAL
OREAS 610
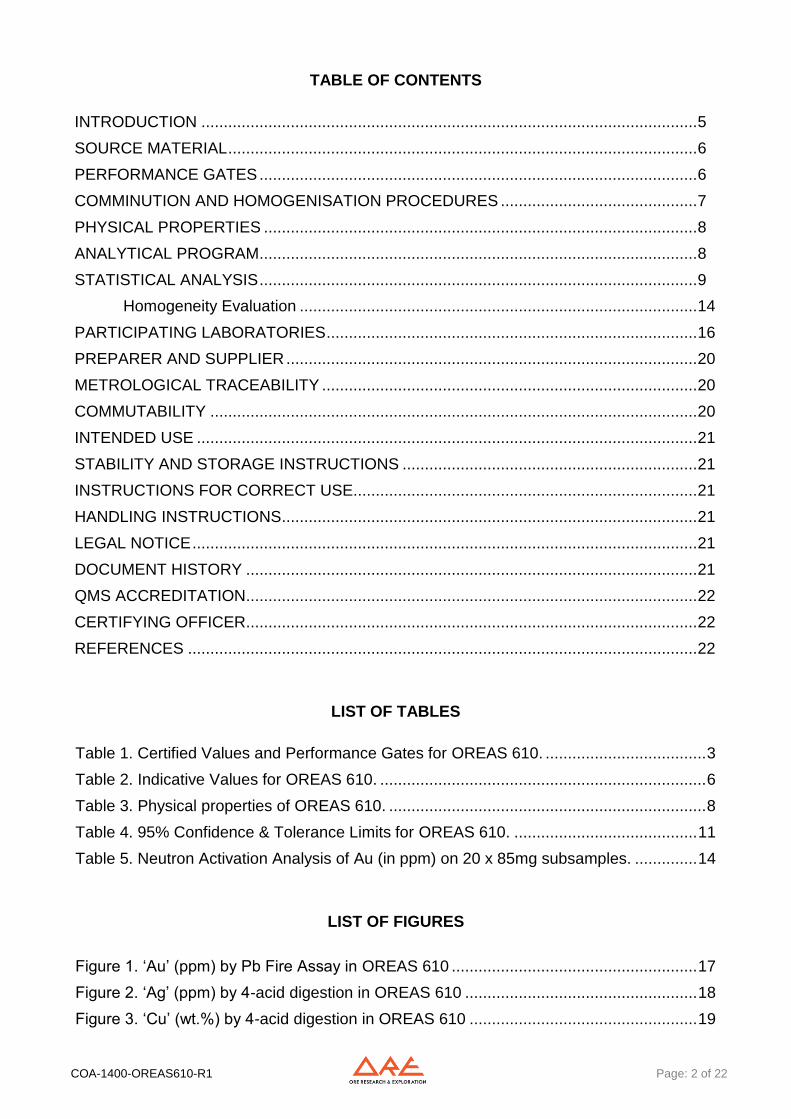
Summary Statistics for Key Analytes.
Constituent Certified
Absolute Standard Deviations Relative Standard Deviations 5% window
Value 1SD
2SD Low
2SD High
3SD Low
3SD High
1RSD 2RSD 3RSD Low High
Pb Fire Assay
Au, ppm 9.83 0.254 9.33 10.34 9.07 10.60 2.59% 5.17% 7.76% 9.34 10.33
4-Acid Digestion
Ag, ppm 49.4 1.79 45.8 52.9 44.0 54.7 3.63% 7.25% 10.88% 46.9 51.8
Cu, wt.% 0.971 0.023 0.926 1.017 0.903 1.040 2.35% 4.71% 7.06% 0.923 1.020
SI unit equivalents: ppm, parts per million ≡ mg/kg ≡ µg/g ≡ 0.0001 wt.% ≡ 1000 ppb, parts per billion.
Note 1: intervals may appear asymmetric due to rounding.
Note 2: the number of decimal places quoted does not imply accuracy of the certified value to this level but are given to minimise rounding errors when calculating 2SD and 3SD windows.
COA-1400-OREAS610-R1 Page: 2 of 22
TABLE OF CONTENTS
INTRODUCTION ............................................................................................................... 5
SOURCE MATERIAL ......................................................................................................... 6
PERFORMANCE GATES .................................................................................................. 6
COMMINUTION AND HOMOGENISATION PROCEDURES ............................................ 7
PHYSICAL PROPERTIES ................................................................................................. 8
ANALYTICAL PROGRAM .................................................................................................. 8
STATISTICAL ANALYSIS .................................................................................................. 9
Homogeneity Evaluation ......................................................................................... 14
PARTICIPATING LABORATORIES ................................................................................... 16
PREPARER AND SUPPLIER ............................................................................................ 20
METROLOGICAL TRACEABILITY .................................................................................... 20
COMMUTABILITY ............................................................................................................. 20
INTENDED USE ................................................................................................................ 21
STABILITY AND STORAGE INSTRUCTIONS .................................................................. 21
INSTRUCTIONS FOR CORRECT USE............................................................................. 21
HANDLING INSTRUCTIONS ............................................................................................. 21
LEGAL NOTICE ................................................................................................................. 21
DOCUMENT HISTORY ..................................................................................................... 21
QMS ACCREDITATION ..................................................................................................... 22
CERTIFYING OFFICER ..................................................................................................... 22
REFERENCES .................................................................................................................. 22
LIST OF TABLES
Table 1. Certified Values and Performance Gates for OREAS 610. .................................... 3
Table 2. Indicative Values for OREAS 610. ......................................................................... 6
Table 3. Physical properties of OREAS 610. ....................................................................... 8
Table 4. 95% Confidence & Tolerance Limits for OREAS 610. ......................................... 11
Table 5. Neutron Activation Analysis of Au (in ppm) on 20 x 85mg subsamples. .............. 14
LIST OF FIGURES
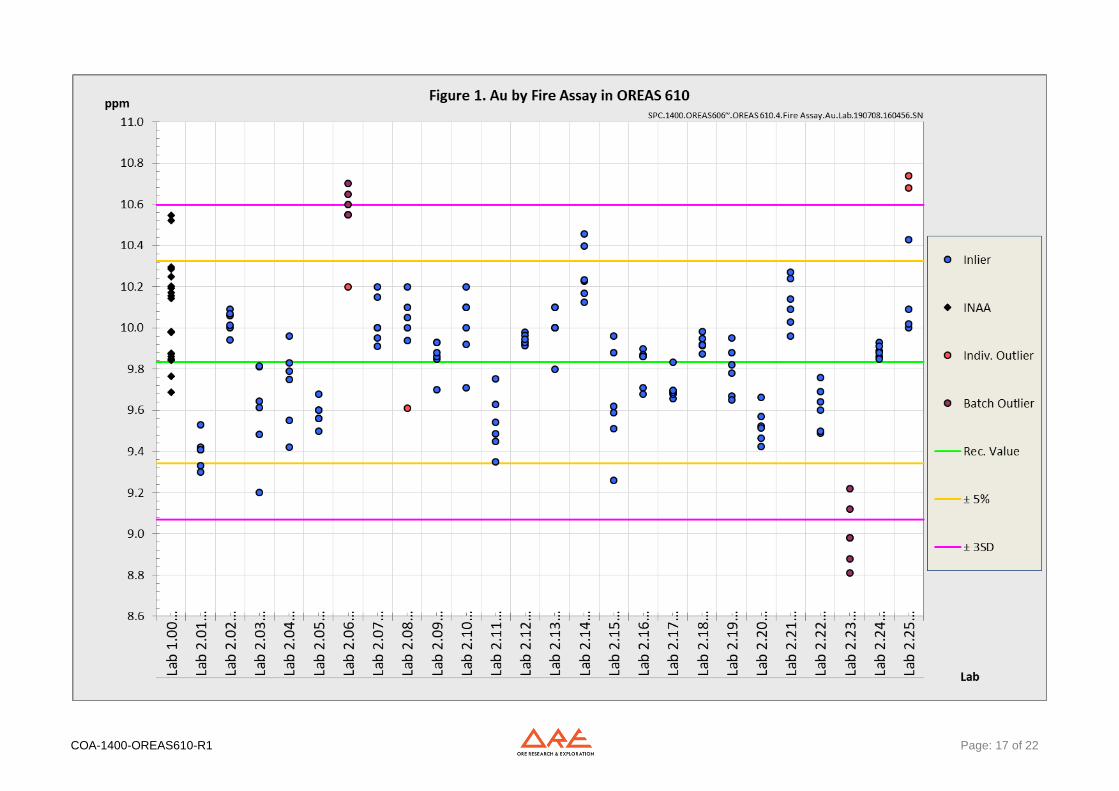
Figure 1. ‘Au’ (ppm) by Pb Fire Assay in OREAS 610 ....................................................... 17
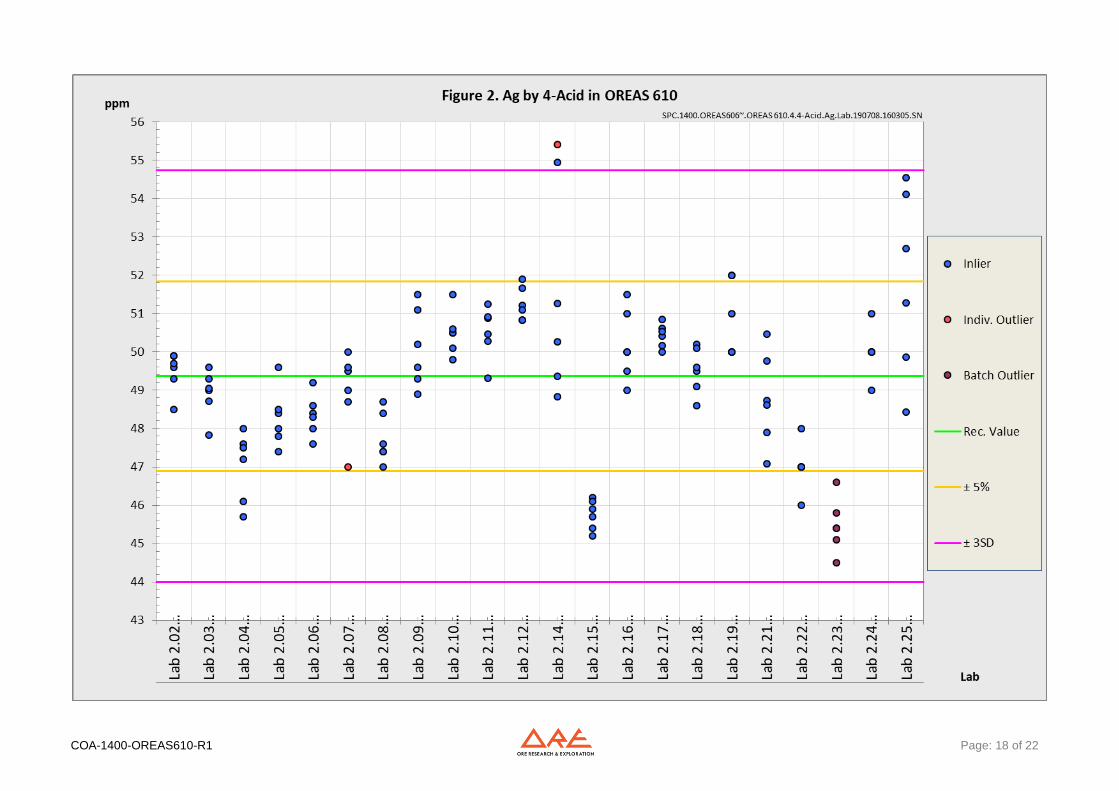
Figure 2. ‘Ag’ (ppm) by 4-acid digestion in OREAS 610 .................................................... 18
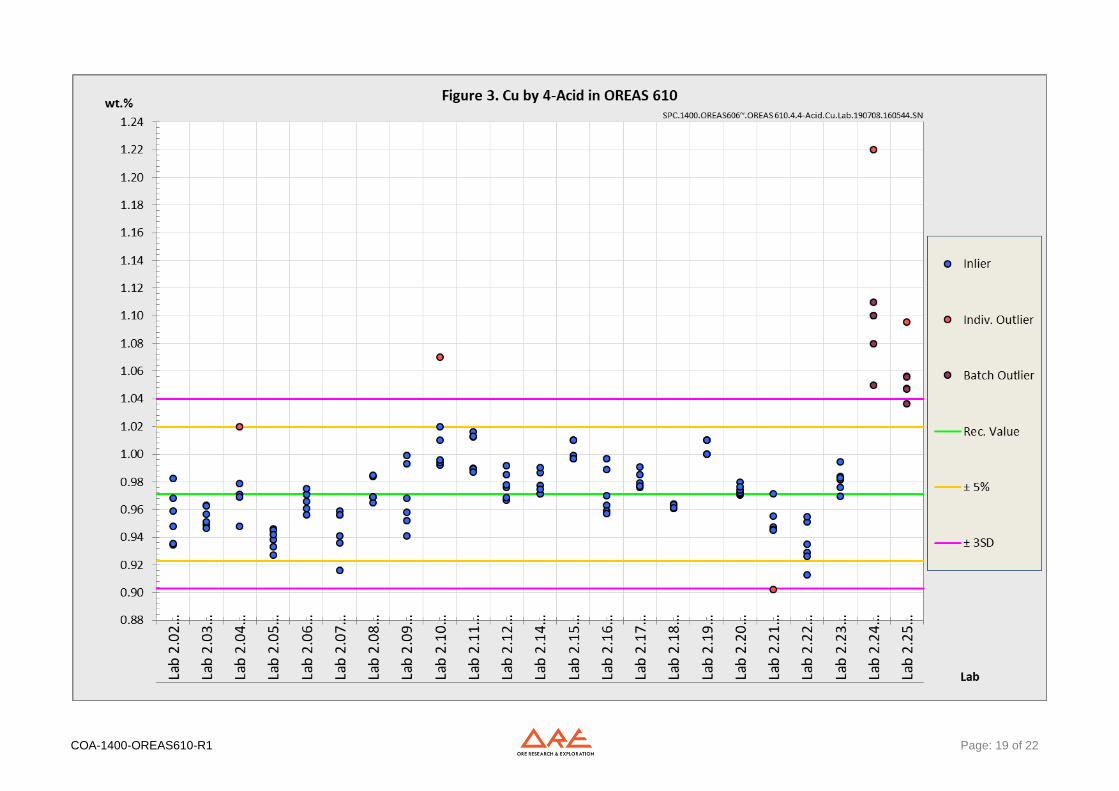
Figure 3. ‘Cu’ (wt.%) by 4-acid digestion in OREAS 610 ................................................... 19
COA-1400-OREAS610-R1 Page: 3 of 22
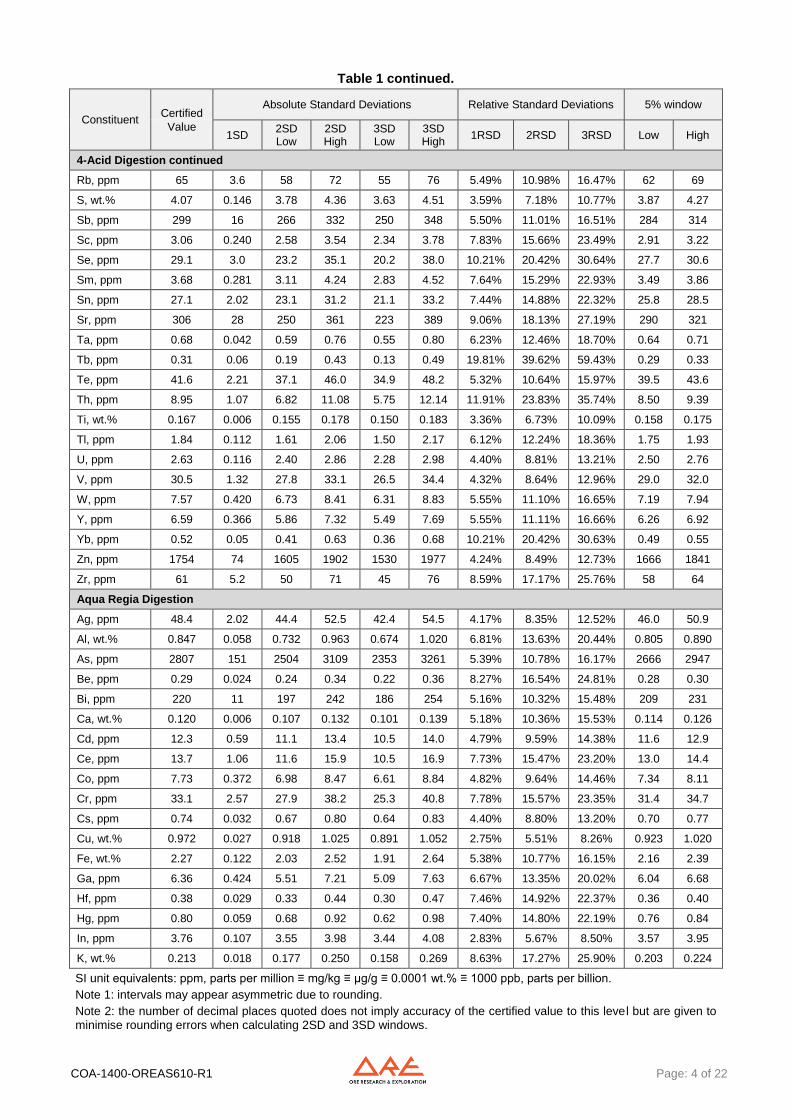
Table 1. Certified Values and Performance Gates for OREAS 610.
Constituent Certified
Absolute Standard Deviations Relative Standard Deviations 5% window
Value 1SD
2SD Low
2SD High
3SD Low
3SD High
1RSD 2RSD 3RSD Low High
Pb Fire Assay
Au, ppm 9.83 0.254 9.33 10.34 9.07 10.60 2.59% 5.17% 7.76% 9.34 10.33
Aqua Regia Digestion (sample weights 10-50g)
Au, ppm 9.81 0.341 9.13 10.49 8.79 10.83 3.47% 6.95% 10.42% 9.32 10.30
Infrared Combustion
S, wt.% 4.12 0.157 3.80 4.43 3.65 4.59 3.81% 7.62% 11.42% 3.91 4.32
4-Acid Digestion
Ag, ppm 49.4 1.79 45.8 52.9 44.0 54.7 3.63% 7.25% 10.88% 46.9 51.8
Al, wt.% 5.99 0.260 5.47 6.51 5.21 6.77 4.35% 8.70% 13.05% 5.69 6.29
As, ppm 2835 185 2464 3205 2279 3390 6.53% 13.07% 19.60% 2693 2976
Be, ppm 1.48 0.109 1.26 1.69 1.15 1.80 7.41% 14.83% 22.24% 1.40 1.55
Bi, ppm 224 10 204 243 195 253 4.33% 8.66% 12.99% 212 235
Ca, wt.% 0.241 0.014 0.213 0.269 0.198 0.283 5.85% 11.70% 17.55% 0.229 0.253
Cd, ppm 12.1 0.71 10.7 13.5 10.0 14.2 5.86% 11.72% 17.58% 11.5 12.7
Ce, ppm 46.7 4.46 37.8 55.6 33.3 60.1 9.56% 19.12% 28.68% 44.4 49.0
Co, ppm 7.72 0.305 7.11 8.33 6.81 8.64 3.95% 7.90% 11.85% 7.34 8.11
Cr, ppm 39.1 5.1 29.0 49.3 23.9 54.3 12.94% 25.88% 38.82% 37.2 41.1
Cs, ppm 2.16 0.146 1.86 2.45 1.72 2.59 6.78% 13.56% 20.34% 2.05 2.26
Cu, wt.% 0.971 0.023 0.926 1.017 0.903 1.040 2.35% 4.71% 7.06% 0.923 1.020
Dy, ppm 1.53 0.089 1.35 1.70 1.26 1.79 5.83% 11.66% 17.49% 1.45 1.60
Er, ppm 0.59 0.041 0.51 0.68 0.47 0.72 6.91% 13.81% 20.72% 0.56 0.62
Eu, ppm 0.77 0.051 0.67 0.87 0.62 0.92 6.58% 13.16% 19.75% 0.73 0.81
Fe, wt.% 2.37 0.077 2.21 2.52 2.14 2.60 3.24% 6.48% 9.72% 2.25 2.48
Ga, ppm 24.4 1.02 22.4 26.5 21.3 27.5 4.19% 8.38% 12.57% 23.2 25.6
Gd, ppm 2.86 0.256 2.34 3.37 2.09 3.63 8.98% 17.95% 26.93% 2.71 3.00
Hf, ppm 2.01 0.128 1.75 2.26 1.62 2.39 6.36% 12.71% 19.07% 1.91 2.11
Ho, ppm 0.22 0.021 0.17 0.26 0.15 0.28 9.84% 19.69% 29.53% 0.21 0.23
In, ppm 3.90 0.244 3.41 4.38 3.16 4.63 6.27% 12.55% 18.82% 3.70 4.09
K, wt.% 1.98 0.067 1.84 2.11 1.78 2.18 3.41% 6.82% 10.23% 1.88 2.08
La, ppm 20.4 4.4 11.6 29.2 7.1 33.6 21.67% 43.33% 65.00% 19.4 21.4
Li, ppm 28.4 1.35 25.8 31.1 24.4 32.5 4.73% 9.46% 14.19% 27.0 29.9
Mg, ppm 1557 91 1376 1738 1286 1829 5.81% 11.62% 17.43% 1480 1635
Mn, ppm 78 3.6 71 85 67 88 4.58% 9.16% 13.74% 74 82
Mo, ppm 4.82 0.332 4.15 5.48 3.82 5.81 6.89% 13.78% 20.67% 4.58 5.06
Na, wt.% 0.820 0.027 0.767 0.874 0.740 0.900 3.26% 6.51% 9.77% 0.779 0.861
Nb, ppm 8.27 0.430 7.41 9.13 6.98 9.56 5.20% 10.39% 15.59% 7.86 8.69
Nd, ppm 18.9 1.56 15.8 22.0 14.2 23.6 8.26% 16.52% 24.78% 17.9 19.8
Ni, ppm 24.6 1.17 22.3 27.0 21.1 28.1 4.74% 9.49% 14.23% 23.4 25.8
P, ppm 554 36 481 627 445 663 6.57% 13.14% 19.71% 527 582
Pb, ppm 662 42 577 747 534 789 6.42% 12.84% 19.27% 629 695
Pr, ppm 5.09 0.61 3.88 6.31 3.27 6.92 11.93% 23.87% 35.80% 4.84 5.35
SI unit equivalents: ppm, parts per million ≡ mg/kg ≡ µg/g ≡ 0.0001 wt.% ≡ 1000 ppb, parts per billion.
Note 1: intervals may appear asymmetric due to rounding.
Note 2: the number of decimal places quoted does not imply accuracy of the certified value to this level but are given to minimise rounding errors when calculating 2SD and 3SD windows.
COA-1400-OREAS610-R1 Page: 4 of 22
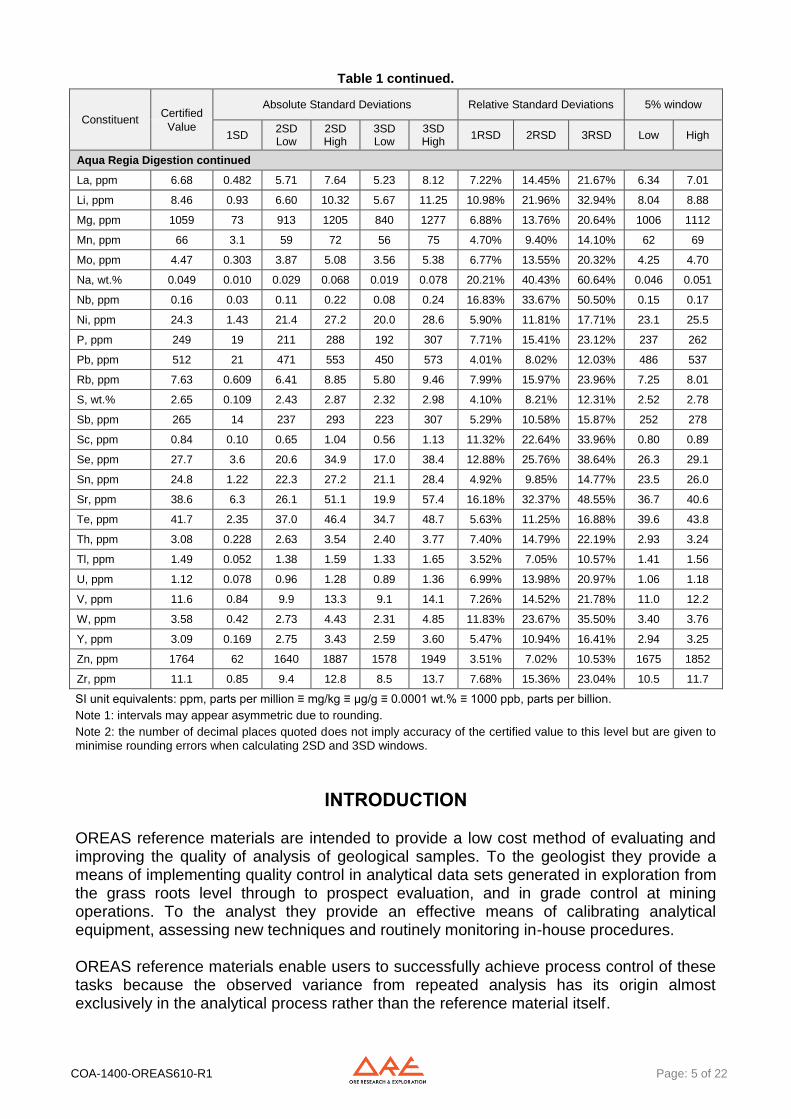
Table 1 continued.
Constituent Certified
Absolute Standard Deviations Relative Standard Deviations 5% window
Value 1SD
2SD Low
2SD High
3SD Low
3SD High
1RSD 2RSD 3RSD Low High
4-Acid Digestion continued
Rb, ppm 65 3.6 58 72 55 76 5.49% 10.98% 16.47% 62 69
S, wt.% 4.07 0.146 3.78 4.36 3.63 4.51 3.59% 7.18% 10.77% 3.87 4.27
Sb, ppm 299 16 266 332 250 348 5.50% 11.01% 16.51% 284 314
Sc, ppm 3.06 0.240 2.58 3.54 2.34 3.78 7.83% 15.66% 23.49% 2.91 3.22
Se, ppm 29.1 3.0 23.2 35.1 20.2 38.0 10.21% 20.42% 30.64% 27.7 30.6
Sm, ppm 3.68 0.281 3.11 4.24 2.83 4.52 7.64% 15.29% 22.93% 3.49 3.86
Sn, ppm 27.1 2.02 23.1 31.2 21.1 33.2 7.44% 14.88% 22.32% 25.8 28.5
Sr, ppm 306 28 250 361 223 389 9.06% 18.13% 27.19% 290 321
Ta, ppm 0.68 0.042 0.59 0.76 0.55 0.80 6.23% 12.46% 18.70% 0.64 0.71
Tb, ppm 0.31 0.06 0.19 0.43 0.13 0.49 19.81% 39.62% 59.43% 0.29 0.33
Te, ppm 41.6 2.21 37.1 46.0 34.9 48.2 5.32% 10.64% 15.97% 39.5 43.6
Th, ppm 8.95 1.07 6.82 11.08 5.75 12.14 11.91% 23.83% 35.74% 8.50 9.39
Ti, wt.% 0.167 0.006 0.155 0.178 0.150 0.183 3.36% 6.73% 10.09% 0.158 0.175
Tl, ppm 1.84 0.112 1.61 2.06 1.50 2.17 6.12% 12.24% 18.36% 1.75 1.93
U, ppm 2.63 0.116 2.40 2.86 2.28 2.98 4.40% 8.81% 13.21% 2.50 2.76
V, ppm 30.5 1.32 27.8 33.1 26.5 34.4 4.32% 8.64% 12.96% 29.0 32.0
W, ppm 7.57 0.420 6.73 8.41 6.31 8.83 5.55% 11.10% 16.65% 7.19 7.94
Y, ppm 6.59 0.366 5.86 7.32 5.49 7.69 5.55% 11.11% 16.66% 6.26 6.92
Yb, ppm 0.52 0.05 0.41 0.63 0.36 0.68 10.21% 20.42% 30.63% 0.49 0.55
Zn, ppm 1754 74 1605 1902 1530 1977 4.24% 8.49% 12.73% 1666 1841
Zr, ppm 61 5.2 50 71 45 76 8.59% 17.17% 25.76% 58 64
Aqua Regia Digestion
Ag, ppm 48.4 2.02 44.4 52.5 42.4 54.5 4.17% 8.35% 12.52% 46.0 50.9
Al, wt.% 0.847 0.058 0.732 0.963 0.674 1.020 6.81% 13.63% 20.44% 0.805 0.890
As, ppm 2807 151 2504 3109 2353 3261 5.39% 10.78% 16.17% 2666 2947
Be, ppm 0.29 0.024 0.24 0.34 0.22 0.36 8.27% 16.54% 24.81% 0.28 0.30
Bi, ppm 220 11 197 242 186 254 5.16% 10.32% 15.48% 209 231
Ca, wt.% 0.120 0.006 0.107 0.132 0.101 0.139 5.18% 10.36% 15.53% 0.114 0.126
Cd, ppm 12.3 0.59 11.1 13.4 10.5 14.0 4.79% 9.59% 14.38% 11.6 12.9
Ce, ppm 13.7 1.06 11.6 15.9 10.5 16.9 7.73% 15.47% 23.20% 13.0 14.4
Co, ppm 7.73 0.372 6.98 8.47 6.61 8.84 4.82% 9.64% 14.46% 7.34 8.11
Cr, ppm 33.1 2.57 27.9 38.2 25.3 40.8 7.78% 15.57% 23.35% 31.4 34.7
Cs, ppm 0.74 0.032 0.67 0.80 0.64 0.83 4.40% 8.80% 13.20% 0.70 0.77
Cu, wt.% 0.972 0.027 0.918 1.025 0.891 1.052 2.75% 5.51% 8.26% 0.923 1.020
Fe, wt.% 2.27 0.122 2.03 2.52 1.91 2.64 5.38% 10.77% 16.15% 2.16 2.39
Ga, ppm 6.36 0.424 5.51 7.21 5.09 7.63 6.67% 13.35% 20.02% 6.04 6.68
Hf, ppm 0.38 0.029 0.33 0.44 0.30 0.47 7.46% 14.92% 22.37% 0.36 0.40
Hg, ppm 0.80 0.059 0.68 0.92 0.62 0.98 7.40% 14.80% 22.19% 0.76 0.84
In, ppm 3.76 0.107 3.55 3.98 3.44 4.08 2.83% 5.67% 8.50% 3.57 3.95
K, wt.% 0.213 0.018 0.177 0.250 0.158 0.269 8.63% 17.27% 25.90% 0.203 0.224
SI unit equivalents: ppm, parts per million ≡ mg/kg ≡ µg/g ≡ 0.0001 wt.% ≡ 1000 ppb, parts per billion.
Note 1: intervals may appear asymmetric due to rounding.
Note 2: the number of decimal places quoted does not imply accuracy of the certified value to this level but are given to minimise rounding errors when calculating 2SD and 3SD windows.
COA-1400-OREAS610-R1 Page: 5 of 22
Table 1 continued.
Constituent Certified
Absolute Standard Deviations Relative Standard Deviations 5% window
Value 1SD
2SD Low
2SD High
3SD Low
3SD High
1RSD 2RSD 3RSD Low High
Aqua Regia Digestion continued
La, ppm 6.68 0.482 5.71 7.64 5.23 8.12 7.22% 14.45% 21.67% 6.34 7.01
Li, ppm 8.46 0.93 6.60 10.32 5.67 11.25 10.98% 21.96% 32.94% 8.04 8.88
Mg, ppm 1059 73 913 1205 840 1277 6.88% 13.76% 20.64% 1006 1112
Mn, ppm 66 3.1 59 72 56 75 4.70% 9.40% 14.10% 62 69
Mo, ppm 4.47 0.303 3.87 5.08 3.56 5.38 6.77% 13.55% 20.32% 4.25 4.70
Na, wt.% 0.049 0.010 0.029 0.068 0.019 0.078 20.21% 40.43% 60.64% 0.046 0.051
Nb, ppm 0.16 0.03 0.11 0.22 0.08 0.24 16.83% 33.67% 50.50% 0.15 0.17
Ni, ppm 24.3 1.43 21.4 27.2 20.0 28.6 5.90% 11.81% 17.71% 23.1 25.5
P, ppm 249 19 211 288 192 307 7.71% 15.41% 23.12% 237 262
Pb, ppm 512 21 471 553 450 573 4.01% 8.02% 12.03% 486 537
Rb, ppm 7.63 0.609 6.41 8.85 5.80 9.46 7.99% 15.97% 23.96% 7.25 8.01
S, wt.% 2.65 0.109 2.43 2.87 2.32 2.98 4.10% 8.21% 12.31% 2.52 2.78
Sb, ppm 265 14 237 293 223 307 5.29% 10.58% 15.87% 252 278
Sc, ppm 0.84 0.10 0.65 1.04 0.56 1.13 11.32% 22.64% 33.96% 0.80 0.89
Se, ppm 27.7 3.6 20.6 34.9 17.0 38.4 12.88% 25.76% 38.64% 26.3 29.1
Sn, ppm 24.8 1.22 22.3 27.2 21.1 28.4 4.92% 9.85% 14.77% 23.5 26.0
Sr, ppm 38.6 6.3 26.1 51.1 19.9 57.4 16.18% 32.37% 48.55% 36.7 40.6
Te, ppm 41.7 2.35 37.0 46.4 34.7 48.7 5.63% 11.25% 16.88% 39.6 43.8
Th, ppm 3.08 0.228 2.63 3.54 2.40 3.77 7.40% 14.79% 22.19% 2.93 3.24
Tl, ppm 1.49 0.052 1.38 1.59 1.33 1.65 3.52% 7.05% 10.57% 1.41 1.56
U, ppm 1.12 0.078 0.96 1.28 0.89 1.36 6.99% 13.98% 20.97% 1.06 1.18
V, ppm 11.6 0.84 9.9 13.3 9.1 14.1 7.26% 14.52% 21.78% 11.0 12.2
W, ppm 3.58 0.42 2.73 4.43 2.31 4.85 11.83% 23.67% 35.50% 3.40 3.76
Y, ppm 3.09 0.169 2.75 3.43 2.59 3.60 5.47% 10.94% 16.41% 2.94 3.25
Zn, ppm 1764 62 1640 1887 1578 1949 3.51% 7.02% 10.53% 1675 1852
Zr, ppm 11.1 0.85 9.4 12.8 8.5 13.7 7.68% 15.36% 23.04% 10.5 11.7
SI unit equivalents: ppm, parts per million ≡ mg/kg ≡ µg/g ≡ 0.0001 wt.% ≡ 1000 ppb, parts per billion.
Note 1: intervals may appear asymmetric due to rounding.
Note 2: the number of decimal places quoted does not imply accuracy of the certified value to this level but are given to minimise rounding errors when calculating 2SD and 3SD windows.
INTRODUCTION OREAS reference materials are intended to provide a low cost method of evaluating and improving the quality of analysis of geological samples. To the geologist they provide a means of implementing quality control in analytical data sets generated in exploration from the grass roots level through to prospect evaluation, and in grade control at mining operations. To the analyst they provide an effective means of calibrating analytical equipment, assessing new techniques and routinely monitoring in-house procedures. OREAS reference materials enable users to successfully achieve process control of these tasks because the observed variance from repeated analysis has its origin almost exclusively in the analytical process rather than the reference material itself.
COA-1400-OREAS610-R1 Page: 6 of 22
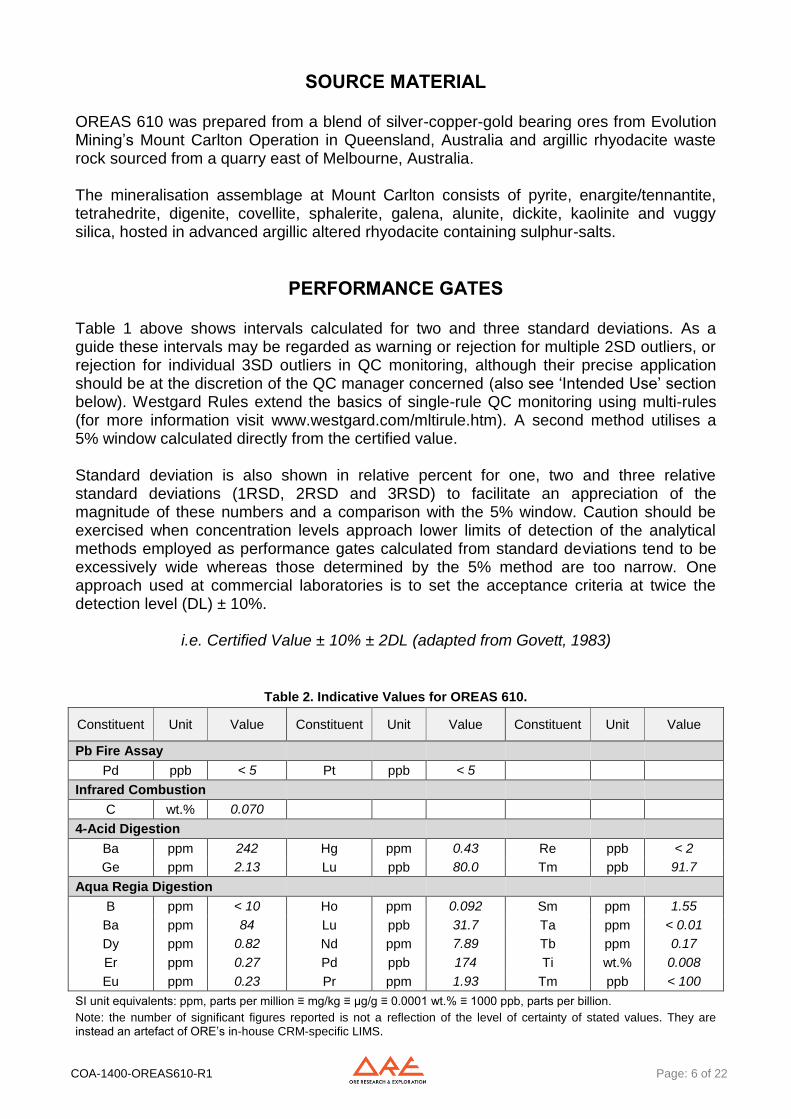
SOURCE MATERIAL
OREAS 610 was prepared from a blend of silver-copper-gold bearing ores from Evolution Mining’s Mount Carlton Operation in Queensland, Australia and argillic rhyodacite waste rock sourced from a quarry east of Melbourne, Australia. The mineralisation assemblage at Mount Carlton consists of pyrite, enargite/tennantite, tetrahedrite, digenite, covellite, sphalerite, galena, alunite, dickite, kaolinite and vuggy silica, hosted in advanced argillic altered rhyodacite containing sulphur-salts.
PERFORMANCE GATES
Table 1 above shows intervals calculated for two and three standard deviations. As a guide these intervals may be regarded as warning or rejection for multiple 2SD outliers, or rejection for individual 3SD outliers in QC monitoring, although their precise application should be at the discretion of the QC manager concerned (also see ‘Intended Use’ section below). Westgard Rules extend the basics of single-rule QC monitoring using multi-rules (for more information visit www.westgard.com/mltirule.htm). A second method utilises a 5% window calculated directly from the certified value. Standard deviation is also shown in relative percent for one, two and three relative standard deviations (1RSD, 2RSD and 3RSD) to facilitate an appreciation of the magnitude of these numbers and a comparison with the 5% window. Caution should be exercised when concentration levels approach lower limits of detection of the analytical methods employed as performance gates calculated from standard deviations tend to be excessively wide whereas those determined by the 5% method are too narrow. One approach used at commercial laboratories is to set the acceptance criteria at twice the detection level (DL) ± 10%.
i.e. Certified Value ± 10% ± 2DL (adapted from Govett, 1983)
Table 2. Indicative Values for OREAS 610.
Constituent Unit Value Constituent Unit Value Constituent Unit Value
Pb Fire Assay
Pd ppb < 5 Pt ppb < 5
Infrared Combustion
C wt.% 0.070
4-Acid Digestion
Ba ppm 242 Hg ppm 0.43 Re ppb < 2
Ge ppm 2.13 Lu ppb 80.0 Tm ppb 91.7
Aqua Regia Digestion
B ppm < 10 Ho ppm 0.092 Sm ppm 1.55
Ba ppm 84 Lu ppb 31.7 Ta ppm < 0.01
Dy ppm 0.82 Nd ppm 7.89 Tb ppm 0.17
Er ppm 0.27 Pd ppb 174 Ti wt.% 0.008
Eu ppm 0.23 Pr ppm 1.93 Tm ppb < 100
SI unit equivalents: ppm, parts per million ≡ mg/kg ≡ µg/g ≡ 0.0001 wt.% ≡ 1000 ppb, parts per billion.
Note: the number of significant figures reported is not a reflection of the level of certainty of stated values. They are instead an artefact of ORE’s in-house CRM-specific LIMS.
COA-1400-OREAS610-R1 Page: 7 of 22
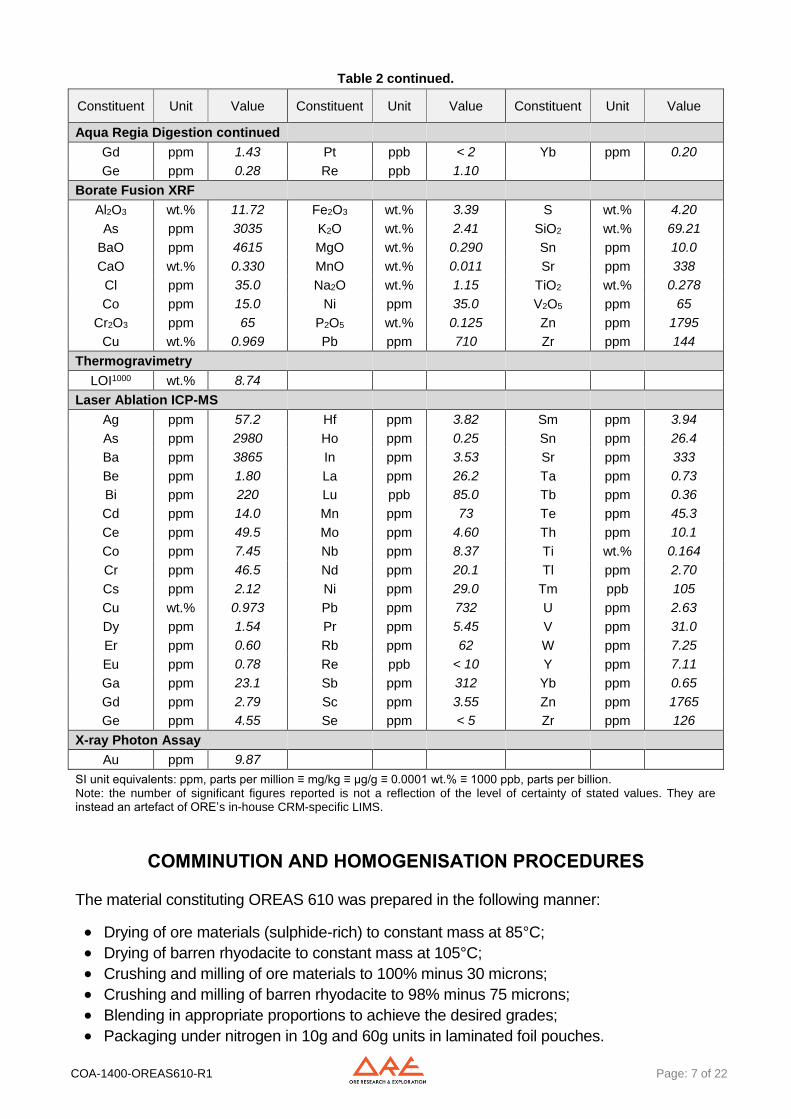
Table 2 continued.
Constituent Unit Value Constituent Unit Value Constituent Unit Value
Aqua Regia Digestion continued
Gd ppm 1.43 Pt ppb < 2 Yb ppm 0.20
Ge ppm 0.28 Re ppb 1.10
Borate Fusion XRF
Al2O3 wt.% 11.72 Fe2O3 wt.% 3.39 S wt.% 4.20
As ppm 3035 K2O wt.% 2.41 SiO2 wt.% 69.21
BaO ppm 4615 MgO wt.% 0.290 Sn ppm 10.0
CaO wt.% 0.330 MnO wt.% 0.011 Sr ppm 338
Cl ppm 35.0 Na2O wt.% 1.15 TiO2 wt.% 0.278
Co ppm 15.0 Ni ppm 35.0 V2O5 ppm 65
Cr2O3 ppm 65 P2O5 wt.% 0.125 Zn ppm 1795
Cu wt.% 0.969 Pb ppm 710 Zr ppm 144
Thermogravimetry
LOI1000 wt.% 8.74
Laser Ablation ICP-MS
Ag ppm 57.2 Hf ppm 3.82 Sm ppm 3.94
As ppm 2980 Ho ppm 0.25 Sn ppm 26.4
Ba ppm 3865 In ppm 3.53 Sr ppm 333
Be ppm 1.80 La ppm 26.2 Ta ppm 0.73
Bi ppm 220 Lu ppb 85.0 Tb ppm 0.36
Cd ppm 14.0 Mn ppm 73 Te ppm 45.3
Ce ppm 49.5 Mo ppm 4.60 Th ppm 10.1
Co ppm 7.45 Nb ppm 8.37 Ti wt.% 0.164
Cr ppm 46.5 Nd ppm 20.1 Tl ppm 2.70
Cs ppm 2.12 Ni ppm 29.0 Tm ppb 105
Cu wt.% 0.973 Pb ppm 732 U ppm 2.63
Dy ppm 1.54 Pr ppm 5.45 V ppm 31.0
Er ppm 0.60 Rb ppm 62 W ppm 7.25
Eu ppm 0.78 Re ppb < 10 Y ppm 7.11
Ga ppm 23.1 Sb ppm 312 Yb ppm 0.65
Gd ppm 2.79 Sc ppm 3.55 Zn ppm 1765
Ge ppm 4.55 Se ppm < 5 Zr ppm 126
X-ray Photon Assay
Au ppm 9.87
SI unit equivalents: ppm, parts per million ≡ mg/kg ≡ µg/g ≡ 0.0001 wt.% ≡ 1000 ppb, parts per billion. Note: the number of significant figures reported is not a reflection of the level of certainty of stated values. They are instead an artefact of ORE’s in-house CRM-specific LIMS.
COMMINUTION AND HOMOGENISATION PROCEDURES
The material constituting OREAS 610 was prepared in the following manner:
Drying of ore materials (sulphide-rich) to constant mass at 85°C;
Drying of barren rhyodacite to constant mass at 105°C;
Crushing and milling of ore materials to 100% minus 30 microns;
Crushing and milling of barren rhyodacite to 98% minus 75 microns;
Blending in appropriate proportions to achieve the desired grades;
Packaging under nitrogen in 10g and 60g units in laminated foil pouches.
COA-1400-OREAS610-R1 Page: 8 of 22
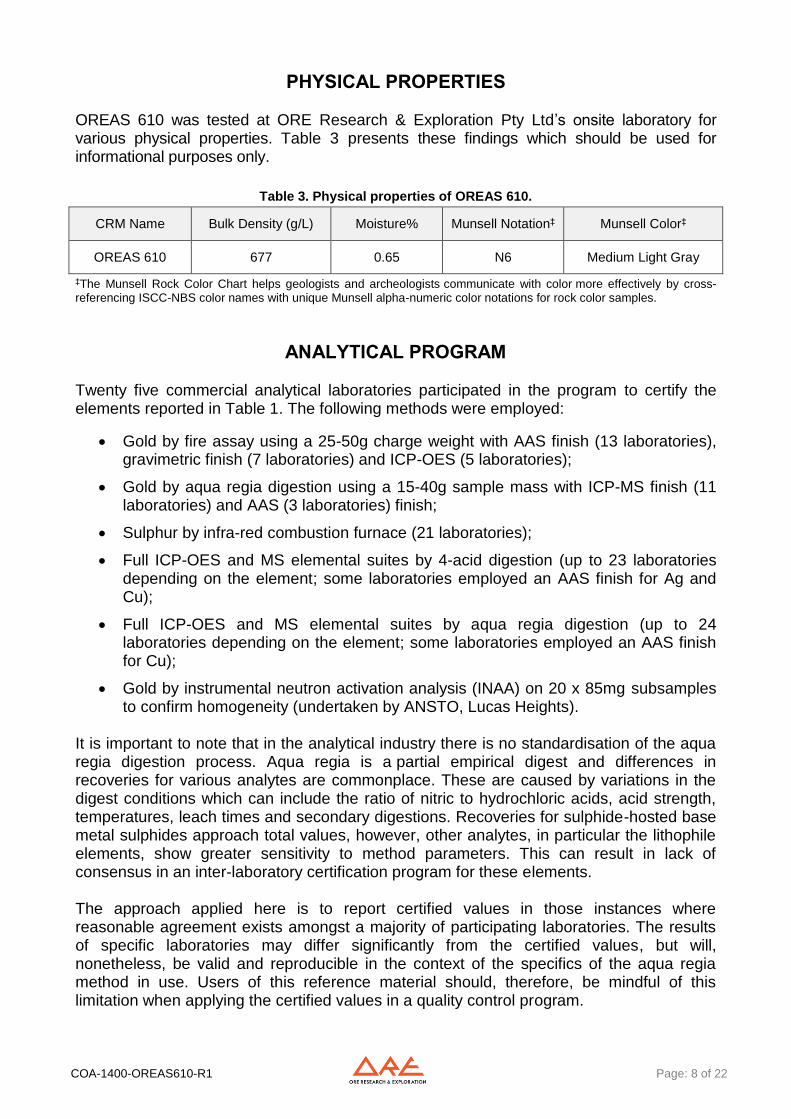
PHYSICAL PROPERTIES OREAS 610 was tested at ORE Research & Exploration Pty Ltd’s onsite laboratory for various physical properties. Table 3 presents these findings which should be used for informational purposes only.
Table 3. Physical properties of OREAS 610.
CRM Name Bulk Density (g/L) Moisture% Munsell Notation‡ Munsell Color‡
OREAS 610 677 0.65 N6 Medium Light Gray
‡The Munsell Rock Color Chart helps geologists and archeologists communicate with color more effectively by cross-referencing ISCC-NBS color names with unique Munsell alpha-numeric color notations for rock color samples.
ANALYTICAL PROGRAM Twenty five commercial analytical laboratories participated in the program to certify the elements reported in Table 1. The following methods were employed:
Gold by fire assay using a 25-50g charge weight with AAS finish (13 laboratories), gravimetric finish (7 laboratories) and ICP-OES (5 laboratories);
Gold by aqua regia digestion using a 15-40g sample mass with ICP-MS finish (11 laboratories) and AAS (3 laboratories) finish;
Sulphur by infra-red combustion furnace (21 laboratories);
Full ICP-OES and MS elemental suites by 4-acid digestion (up to 23 laboratories depending on the element; some laboratories employed an AAS finish for Ag and Cu);
Full ICP-OES and MS elemental suites by aqua regia digestion (up to 24 laboratories depending on the element; some laboratories employed an AAS finish for Cu);
Gold by instrumental neutron activation analysis (INAA) on 20 x 85mg subsamples to confirm homogeneity (undertaken by ANSTO, Lucas Heights).
It is important to note that in the analytical industry there is no standardisation of the aqua regia digestion process. Aqua regia is a partial empirical digest and differences in recoveries for various analytes are commonplace. These are caused by variations in the digest conditions which can include the ratio of nitric to hydrochloric acids, acid strength, temperatures, leach times and secondary digestions. Recoveries for sulphide-hosted base metal sulphides approach total values, however, other analytes, in particular the lithophile elements, show greater sensitivity to method parameters. This can result in lack of consensus in an inter-laboratory certification program for these elements. The approach applied here is to report certified values in those instances where reasonable agreement exists amongst a majority of participating laboratories. The results of specific laboratories may differ significantly from the certified values, but will, nonetheless, be valid and reproducible in the context of the specifics of the aqua regia method in use. Users of this reference material should, therefore, be mindful of this limitation when applying the certified values in a quality control program.
COA-1400-OREAS610-R1 Page: 9 of 22
Gold was also determined by Chrysos Corporation’s new Photon Assay technique at their Perth and Kalgoorlie branches. The mean value is included in Table 2 as an indicative value since it is reported by two laboratories only. Table 2 also includes major and trace element characterisation by BV Perth Geoanalytical laboratory using the following methodologies:
Major oxides by lithium borate fusion with X-ray fluorescence;
LOI at 1000°C by thermogravimetric analyser;
Infra-red combustion furnace for C;
Trace element characterisation by laser ablation with ICP-MS finish.
For the round robin program twenty 1.2kg test units were taken at predetermined intervals during the bagging stage, immediately following homogenisation and are considered representative of the entire prepared batch. Six 100g pulp samples were submitted to each laboratory for analysis received by each laboratory were obtained by taking two 100g samples from each of three separate 1.2kg test units. This format enabled nested ANOVA treatment of the results to evaluate homogeneity, i.e. to ascertain whether between-unit variance is greater than within-unit variance. Table 4 presents the 102 certified values together with their associated 1SD’s, 95% confidence and tolerance limits. Gold homogeneity has been evaluated and confirmed by instrumental neutron activation analysis (INAA) on twenty ~85mg sample portions (see Table 5 below) and by a nested ANOVA program for both fire assay and aqua regia digestion (see ‘nested ANOVA’ section). Tabulated results of all elements together with uncorrected means, medians, standard deviations, relative standard deviations and per cent deviation of lab means from the corrected mean of means (PDM3) are presented in the detailed certification data for this CRM (OREAS 610 DataPack-1.0.190706_183700.xlsx). Results are also presented in scatter plots for gold by fire assay, silver by 4-acid digestion and copper by 4-acid digestion (Figures 1 to 3, respectively) together with ±3SD (magenta) and ±5% (yellow) control lines and certified value (green line). Accepted individual results are coloured blue and individual and dataset outliers are identified in red and violet, respectively.
STATISTICAL ANALYSIS Standard Deviation intervals (see Table 1) provide an indication of a level of performance that might reasonably be expected from a laboratory being monitored by this CRM in a QA/QC program. They take into account errors attributable to measurement uncertainty and CRM variability. For an effective CRM the contribution of the latter should be negligible in comparison to measurement errors. The Standard Deviation values include all sources of measurement uncertainty: between-lab variance, within-run variance (precision errors) and CRM variability. In the application of SD’s in monitoring performance it is important to note that not all laboratories function at the same level of proficiency and that different methods in use at a particular laboratory have differing levels of precision. Each laboratory has its own inherent SD (for a specific concentration level and analyte-method pair) based on the analytical
COA-1400-OREAS610-R1 Page: 10 of 22
process and this SD is not directly related to the round robin program (see Intended Use section for more detail). The SD for each analyte’s certified value is calculated from the same filtered data set used to determine the certified value, i.e. after removal of all individual, lab dataset (batch) and 3SD outliers (single iteration). These outliers can only be removed after the absolute homogeneity of the CRM has been independently established, i.e. the outliers must be confidently deemed to be analytical rather than arising from inhomogeneity of the CRM. The standard deviation is then calculated for each analyte from the pooled accepted analyses generated from the certification program. Certified Values, Standard Deviations, Confidence Limits and Tolerance Limits (Table 4) have been determined for each analyte following removal of individual, laboratory dataset (batch) and 3SD outliers (single iteration). For individual outliers within a laboratory batch the z-score test is used in combination with a second method that determines the per cent deviation of the individual value from the batch median. Outliers in general are selected on the basis of z-scores > 2.5 and with per cent deviations (i) > 3 and (ii) more than three times the average absolute per cent deviation for the batch. In certain instances statistician’s prerogative has been employed in discriminating outliers. Each laboratory data set mean is tested for outlying status based on z-score discrimination and rejected if > 2.5. After individual and laboratory data set (batch) outliers have been eliminated a non-iterative 3 standard deviation filter is applied, with those values lying outside this window also relegated to outlying status. Certified Values are the means of accepted laboratory means after outlier filtering. The INAA data (see Table 5) is omitted from determination of the certified value for Au and is used solely for the calculation of Tolerance Limits and homogeneity evaluation of OREAS 610 (see ‘Homogeneity Evaluation’ section below). 95% Confidence Limits are inversely proportional to the number of participating laboratories and inter-laboratory agreement. It is a measure of the reliability of the certified value. A 95% confidence interval indicates a 95% probability that the true value of the analyte under consideration lies between the upper and lower limits. 95% Confidence Limits should not be used as control limits for laboratory performance. Indicative (uncertified) values (Table 2) are provided for the major and trace elements determined by borate fusion XRF (Al2O3 to Zr), laser ablation with ICP-MS (Ag to Zr), LOI at 1000°C and C by infrared combustion furnace and are the means of duplicate assays from Bureau Veritas, Perth. Additional indicative values by other analytical methods are present where the number of laboratories reporting a particular analyte is insufficient (< 5) to support certification or where inter-laboratory consensus is poor.
COA-1400-OREAS610-R1 Page: 11 of 22
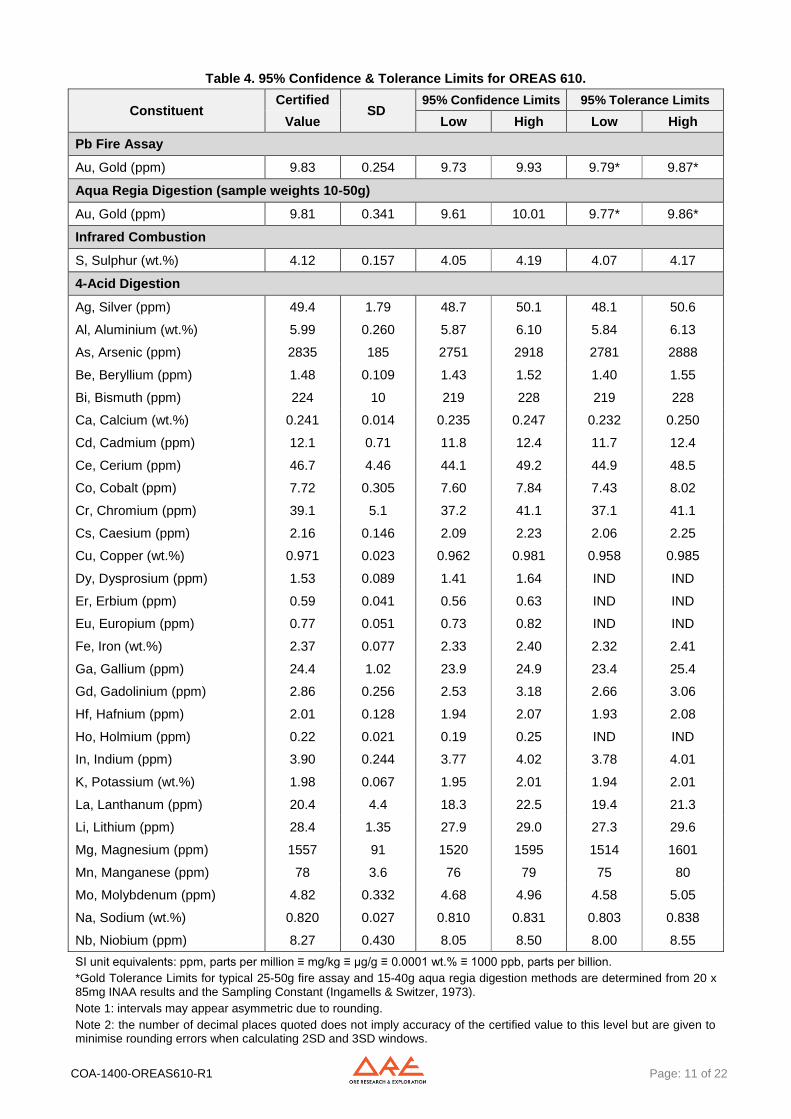
Table 4. 95% Confidence & Tolerance Limits for OREAS 610.
Constituent Certified
SD 95% Confidence Limits 95% Tolerance Limits
Value Low High Low High
Pb Fire Assay
Au, Gold (ppm) 9.83 0.254 9.73 9.93 9.79* 9.87*
Aqua Regia Digestion (sample weights 10-50g)
Au, Gold (ppm) 9.81 0.341 9.61 10.01 9.77* 9.86*
Infrared Combustion
S, Sulphur (wt.%) 4.12 0.157 4.05 4.19 4.07 4.17
4-Acid Digestion
Ag, Silver (ppm) 49.4 1.79 48.7 50.1 48.1 50.6
Al, Aluminium (wt.%) 5.99 0.260 5.87 6.10 5.84 6.13
As, Arsenic (ppm) 2835 185 2751 2918 2781 2888
Be, Beryllium (ppm) 1.48 0.109 1.43 1.52 1.40 1.55
Bi, Bismuth (ppm) 224 10 219 228 219 228
Ca, Calcium (wt.%) 0.241 0.014 0.235 0.247 0.232 0.250
Cd, Cadmium (ppm) 12.1 0.71 11.8 12.4 11.7 12.4
Ce, Cerium (ppm) 46.7 4.46 44.1 49.2 44.9 48.5
Co, Cobalt (ppm) 7.72 0.305 7.60 7.84 7.43 8.02
Cr, Chromium (ppm) 39.1 5.1 37.2 41.1 37.1 41.1
Cs, Caesium (ppm) 2.16 0.146 2.09 2.23 2.06 2.25
Cu, Copper (wt.%) 0.971 0.023 0.962 0.981 0.958 0.985
Dy, Dysprosium (ppm) 1.53 0.089 1.41 1.64 IND IND
Er, Erbium (ppm) 0.59 0.041 0.56 0.63 IND IND
Eu, Europium (ppm) 0.77 0.051 0.73 0.82 IND IND
Fe, Iron (wt.%) 2.37 0.077 2.33 2.40 2.32 2.41
Ga, Gallium (ppm) 24.4 1.02 23.9 24.9 23.4 25.4
Gd, Gadolinium (ppm) 2.86 0.256 2.53 3.18 2.66 3.06
Hf, Hafnium (ppm) 2.01 0.128 1.94 2.07 1.93 2.08
Ho, Holmium (ppm) 0.22 0.021 0.19 0.25 IND IND
In, Indium (ppm) 3.90 0.244 3.77 4.02 3.78 4.01
K, Potassium (wt.%) 1.98 0.067 1.95 2.01 1.94 2.01
La, Lanthanum (ppm) 20.4 4.4 18.3 22.5 19.4 21.3
Li, Lithium (ppm) 28.4 1.35 27.9 29.0 27.3 29.6
Mg, Magnesium (ppm) 1557 91 1520 1595 1514 1601
Mn, Manganese (ppm) 78 3.6 76 79 75 80
Mo, Molybdenum (ppm) 4.82 0.332 4.68 4.96 4.58 5.05
Na, Sodium (wt.%) 0.820 0.027 0.810 0.831 0.803 0.838
Nb, Niobium (ppm) 8.27 0.430 8.05 8.50 8.00 8.55
SI unit equivalents: ppm, parts per million ≡ mg/kg ≡ µg/g ≡ 0.0001 wt.% ≡ 1000 ppb, parts per billion.
*Gold Tolerance Limits for typical 25-50g fire assay and 15-40g aqua regia digestion methods are determined from 20 x 85mg INAA results and the Sampling Constant (Ingamells & Switzer, 1973).
Note 1: intervals may appear asymmetric due to rounding.
Note 2: the number of decimal places quoted does not imply accuracy of the certified value to this level but are given to minimise rounding errors when calculating 2SD and 3SD windows.
COA-1400-OREAS610-R1 Page: 12 of 22
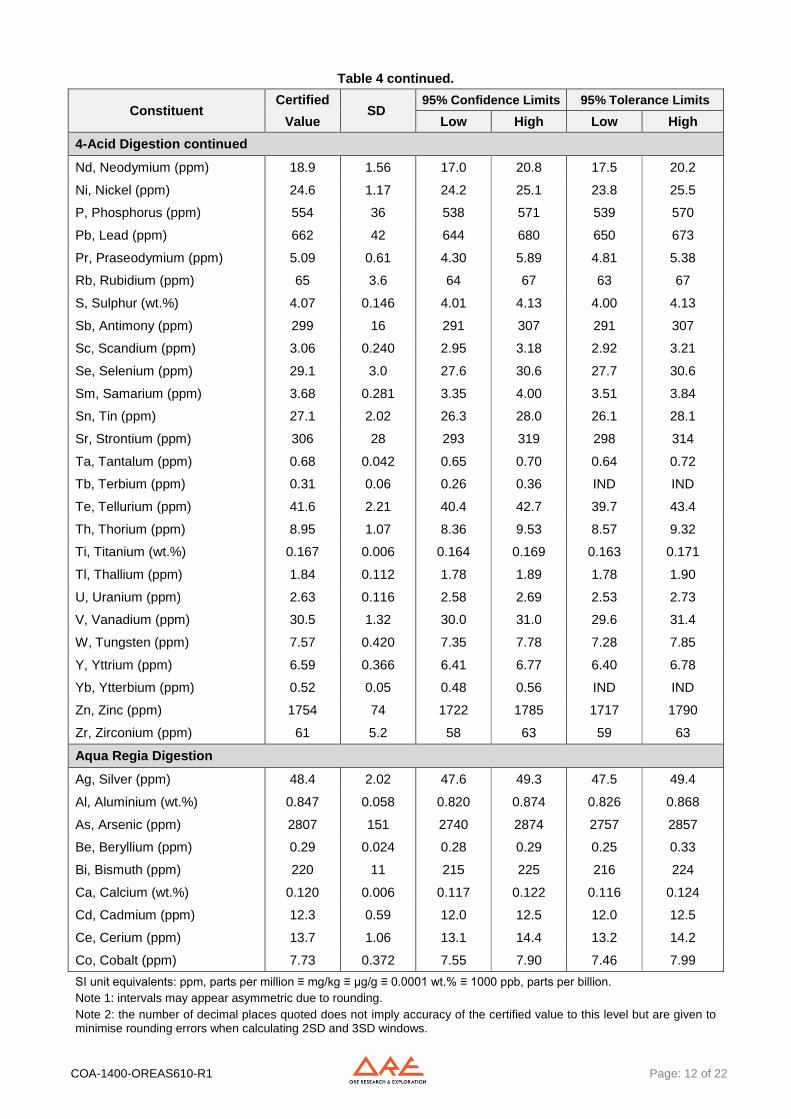
Table 4 continued.
Constituent Certified
SD 95% Confidence Limits 95% Tolerance Limits
Value Low High Low High
4-Acid Digestion continued
Nd, Neodymium (ppm) 18.9 1.56 17.0 20.8 17.5 20.2
Ni, Nickel (ppm) 24.6 1.17 24.2 25.1 23.8 25.5
P, Phosphorus (ppm) 554 36 538 571 539 570
Pb, Lead (ppm) 662 42 644 680 650 673
Pr, Praseodymium (ppm) 5.09 0.61 4.30 5.89 4.81 5.38
Rb, Rubidium (ppm) 65 3.6 64 67 63 67
S, Sulphur (wt.%) 4.07 0.146 4.01 4.13 4.00 4.13
Sb, Antimony (ppm) 299 16 291 307 291 307
Sc, Scandium (ppm) 3.06 0.240 2.95 3.18 2.92 3.21
Se, Selenium (ppm) 29.1 3.0 27.6 30.6 27.7 30.6
Sm, Samarium (ppm) 3.68 0.281 3.35 4.00 3.51 3.84
Sn, Tin (ppm) 27.1 2.02 26.3 28.0 26.1 28.1
Sr, Strontium (ppm) 306 28 293 319 298 314
Ta, Tantalum (ppm) 0.68 0.042 0.65 0.70 0.64 0.72
Tb, Terbium (ppm) 0.31 0.06 0.26 0.36 IND IND
Te, Tellurium (ppm) 41.6 2.21 40.4 42.7 39.7 43.4
Th, Thorium (ppm) 8.95 1.07 8.36 9.53 8.57 9.32
Ti, Titanium (wt.%) 0.167 0.006 0.164 0.169 0.163 0.171
Tl, Thallium (ppm) 1.84 0.112 1.78 1.89 1.78 1.90
U, Uranium (ppm) 2.63 0.116 2.58 2.69 2.53 2.73
V, Vanadium (ppm) 30.5 1.32 30.0 31.0 29.6 31.4
W, Tungsten (ppm) 7.57 0.420 7.35 7.78 7.28 7.85
Y, Yttrium (ppm) 6.59 0.366 6.41 6.77 6.40 6.78
Yb, Ytterbium (ppm) 0.52 0.05 0.48 0.56 IND IND
Zn, Zinc (ppm) 1754 74 1722 1785 1717 1790
Zr, Zirconium (ppm) 61 5.2 58 63 59 63
Aqua Regia Digestion
Ag, Silver (ppm) 48.4 2.02 47.6 49.3 47.5 49.4
Al, Aluminium (wt.%) 0.847 0.058 0.820 0.874 0.826 0.868
As, Arsenic (ppm) 2807 151 2740 2874 2757 2857
Be, Beryllium (ppm) 0.29 0.024 0.28 0.29 0.25 0.33
Bi, Bismuth (ppm) 220 11 215 225 216 224
Ca, Calcium (wt.%) 0.120 0.006 0.117 0.122 0.116 0.124
Cd, Cadmium (ppm) 12.3 0.59 12.0 12.5 12.0 12.5
Ce, Cerium (ppm) 13.7 1.06 13.1 14.4 13.2 14.2
Co, Cobalt (ppm) 7.73 0.372 7.55 7.90 7.46 7.99
SI unit equivalents: ppm, parts per million ≡ mg/kg ≡ µg/g ≡ 0.0001 wt.% ≡ 1000 ppb, parts per billion.
Note 1: intervals may appear asymmetric due to rounding.
Note 2: the number of decimal places quoted does not imply accuracy of the certified value to this level but are given to minimise rounding errors when calculating 2SD and 3SD windows.
COA-1400-OREAS610-R1 Page: 13 of 22
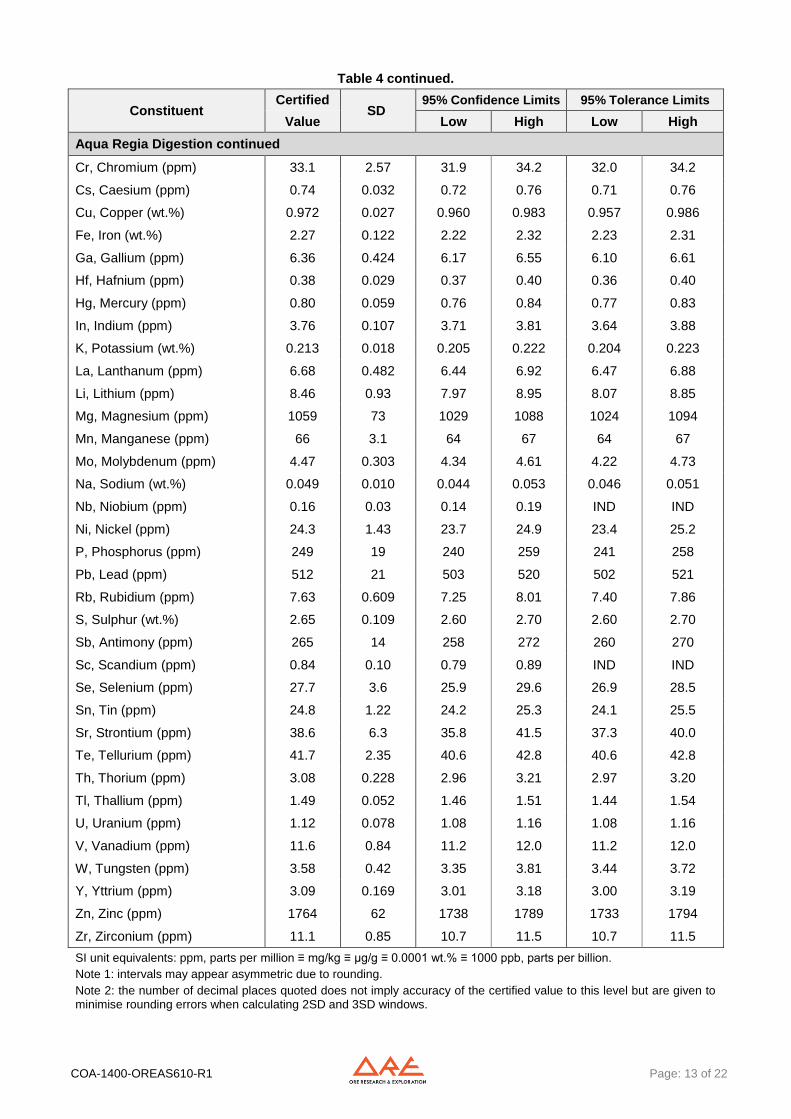
Table 4 continued.
Constituent Certified
SD 95% Confidence Limits 95% Tolerance Limits
Value Low High Low High
Aqua Regia Digestion continued
Cr, Chromium (ppm) 33.1 2.57 31.9 34.2 32.0 34.2
Cs, Caesium (ppm) 0.74 0.032 0.72 0.76 0.71 0.76
Cu, Copper (wt.%) 0.972 0.027 0.960 0.983 0.957 0.986
Fe, Iron (wt.%) 2.27 0.122 2.22 2.32 2.23 2.31
Ga, Gallium (ppm) 6.36 0.424 6.17 6.55 6.10 6.61
Hf, Hafnium (ppm) 0.38 0.029 0.37 0.40 0.36 0.40
Hg, Mercury (ppm) 0.80 0.059 0.76 0.84 0.77 0.83
In, Indium (ppm) 3.76 0.107 3.71 3.81 3.64 3.88
K, Potassium (wt.%) 0.213 0.018 0.205 0.222 0.204 0.223
La, Lanthanum (ppm) 6.68 0.482 6.44 6.92 6.47 6.88
Li, Lithium (ppm) 8.46 0.93 7.97 8.95 8.07 8.85
Mg, Magnesium (ppm) 1059 73 1029 1088 1024 1094
Mn, Manganese (ppm) 66 3.1 64 67 64 67
Mo, Molybdenum (ppm) 4.47 0.303 4.34 4.61 4.22 4.73
Na, Sodium (wt.%) 0.049 0.010 0.044 0.053 0.046 0.051
Nb, Niobium (ppm) 0.16 0.03 0.14 0.19 IND IND
Ni, Nickel (ppm) 24.3 1.43 23.7 24.9 23.4 25.2
P, Phosphorus (ppm) 249 19 240 259 241 258
Pb, Lead (ppm) 512 21 503 520 502 521
Rb, Rubidium (ppm) 7.63 0.609 7.25 8.01 7.40 7.86
S, Sulphur (wt.%) 2.65 0.109 2.60 2.70 2.60 2.70
Sb, Antimony (ppm) 265 14 258 272 260 270
Sc, Scandium (ppm) 0.84 0.10 0.79 0.89 IND IND
Se, Selenium (ppm) 27.7 3.6 25.9 29.6 26.9 28.5
Sn, Tin (ppm) 24.8 1.22 24.2 25.3 24.1 25.5
Sr, Strontium (ppm) 38.6 6.3 35.8 41.5 37.3 40.0
Te, Tellurium (ppm) 41.7 2.35 40.6 42.8 40.6 42.8
Th, Thorium (ppm) 3.08 0.228 2.96 3.21 2.97 3.20
Tl, Thallium (ppm) 1.49 0.052 1.46 1.51 1.44 1.54
U, Uranium (ppm) 1.12 0.078 1.08 1.16 1.08 1.16
V, Vanadium (ppm) 11.6 0.84 11.2 12.0 11.2 12.0
W, Tungsten (ppm) 3.58 0.42 3.35 3.81 3.44 3.72
Y, Yttrium (ppm) 3.09 0.169 3.01 3.18 3.00 3.19
Zn, Zinc (ppm) 1764 62 1738 1789 1733 1794
Zr, Zirconium (ppm) 11.1 0.85 10.7 11.5 10.7 11.5
SI unit equivalents: ppm, parts per million ≡ mg/kg ≡ µg/g ≡ 0.0001 wt.% ≡ 1000 ppb, parts per billion.
Note 1: intervals may appear asymmetric due to rounding.
Note 2: the number of decimal places quoted does not imply accuracy of the certified value to this level but are given to minimise rounding errors when calculating 2SD and 3SD windows.
COA-1400-OREAS610-R1 Page: 14 of 22
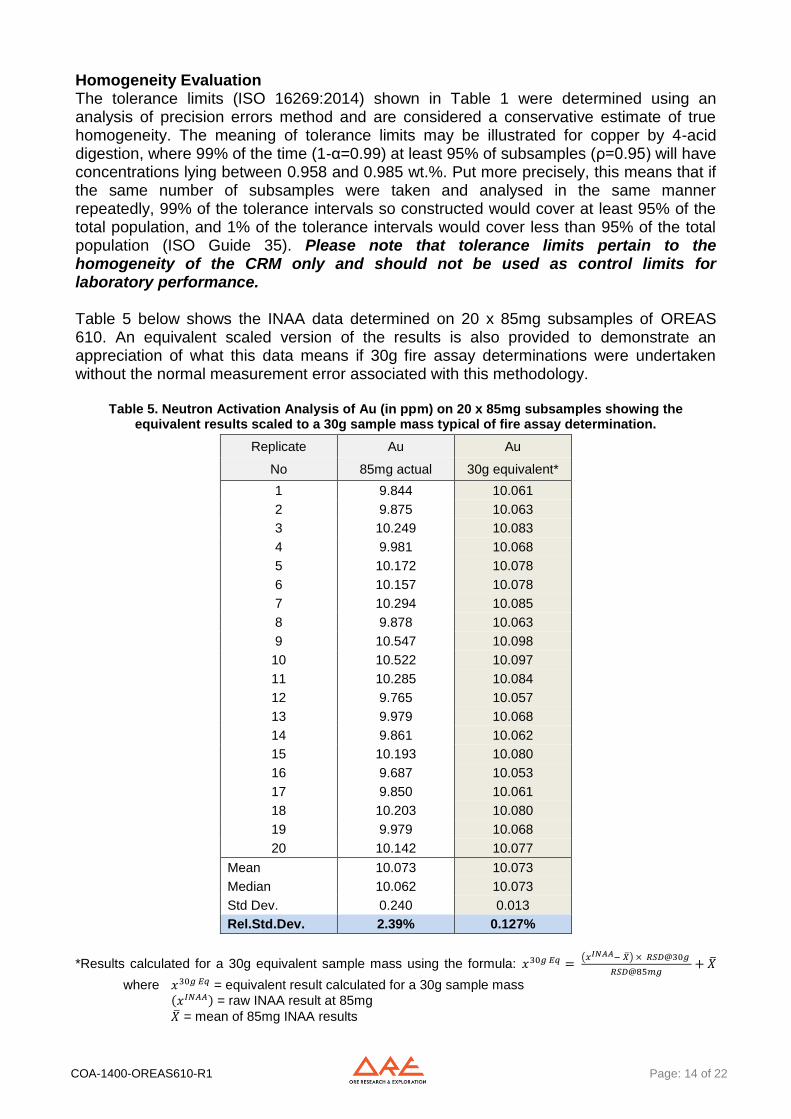
Homogeneity Evaluation The tolerance limits (ISO 16269:2014) shown in Table 1 were determined using an analysis of precision errors method and are considered a conservative estimate of true homogeneity. The meaning of tolerance limits may be illustrated for copper by 4-acid digestion, where 99% of the time (1-α=0.99) at least 95% of subsamples (ρ=0.95) will have concentrations lying between 0.958 and 0.985 wt.%. Put more precisely, this means that if the same number of subsamples were taken and analysed in the same manner repeatedly, 99% of the tolerance intervals so constructed would cover at least 95% of the total population, and 1% of the tolerance intervals would cover less than 95% of the total population (ISO Guide 35). Please note that tolerance limits pertain to the homogeneity of the CRM only and should not be used as control limits for laboratory performance. Table 5 below shows the INAA data determined on 20 x 85mg subsamples of OREAS 610. An equivalent scaled version of the results is also provided to demonstrate an appreciation of what this data means if 30g fire assay determinations were undertaken without the normal measurement error associated with this methodology.
Table 5. Neutron Activation Analysis of Au (in ppm) on 20 x 85mg subsamples showing the equivalent results scaled to a 30g sample mass typical of fire assay determination.
Replicate Au Au
No 85mg actual 30g equivalent*
1 9.844 10.061
2 9.875 10.063
3 10.249 10.083
4 9.981 10.068
5 10.172 10.078
6 10.157 10.078
7 10.294 10.085
8 9.878 10.063
9 10.547 10.098
10 10.522 10.097
11 10.285 10.084
12 9.765 10.057
13 9.979 10.068
14 9.861 10.062
15 10.193 10.080
16 9.687 10.053
17 9.850 10.061
18 10.203 10.080
19 9.979 10.068
20 10.142 10.077
Mean 10.073 10.073
Median 10.062 10.073
Std Dev. 0.240 0.013
Rel.Std.Dev. 2.39% 0.127%
*Results calculated for a 30g equivalent sample mass using the formula: 𝑥30𝑔 𝐸𝑞 = (𝑥𝐼𝑁𝐴𝐴− �̅�) × 𝑅𝑆𝐷@30𝑔
𝑅𝑆𝐷@85𝑚𝑔+ �̅�
where 𝑥30𝑔 𝐸𝑞 = equivalent result calculated for a 30g sample mass
(𝑥𝐼𝑁𝐴𝐴) = raw INAA result at 85mg
�̅� = mean of 85mg INAA results
COA-1400-OREAS610-R1 Page: 15 of 22
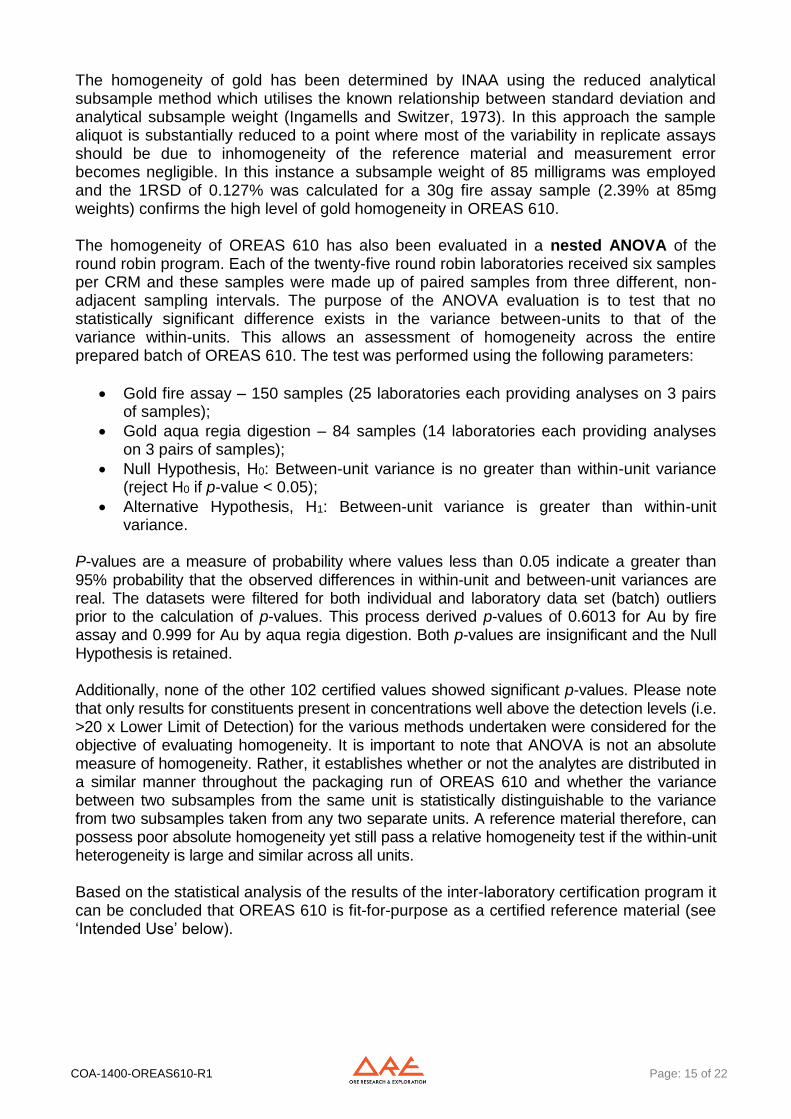
The homogeneity of gold has been determined by INAA using the reduced analytical subsample method which utilises the known relationship between standard deviation and analytical subsample weight (Ingamells and Switzer, 1973). In this approach the sample aliquot is substantially reduced to a point where most of the variability in replicate assays should be due to inhomogeneity of the reference material and measurement error becomes negligible. In this instance a subsample weight of 85 milligrams was employed and the 1RSD of 0.127% was calculated for a 30g fire assay sample (2.39% at 85mg weights) confirms the high level of gold homogeneity in OREAS 610. The homogeneity of OREAS 610 has also been evaluated in a nested ANOVA of the round robin program. Each of the twenty-five round robin laboratories received six samples per CRM and these samples were made up of paired samples from three different, non-adjacent sampling intervals. The purpose of the ANOVA evaluation is to test that no statistically significant difference exists in the variance between-units to that of the variance within-units. This allows an assessment of homogeneity across the entire prepared batch of OREAS 610. The test was performed using the following parameters:
Gold fire assay – 150 samples (25 laboratories each providing analyses on 3 pairs of samples);
Gold aqua regia digestion – 84 samples (14 laboratories each providing analyses on 3 pairs of samples);
Null Hypothesis, H0: Between-unit variance is no greater than within-unit variance (reject H0 if p-value < 0.05);
Alternative Hypothesis, H1: Between-unit variance is greater than within-unit variance.
P-values are a measure of probability where values less than 0.05 indicate a greater than 95% probability that the observed differences in within-unit and between-unit variances are real. The datasets were filtered for both individual and laboratory data set (batch) outliers prior to the calculation of p-values. This process derived p-values of 0.6013 for Au by fire assay and 0.999 for Au by aqua regia digestion. Both p-values are insignificant and the Null Hypothesis is retained. Additionally, none of the other 102 certified values showed significant p-values. Please note that only results for constituents present in concentrations well above the detection levels (i.e. >20 x Lower Limit of Detection) for the various methods undertaken were considered for the objective of evaluating homogeneity. It is important to note that ANOVA is not an absolute measure of homogeneity. Rather, it establishes whether or not the analytes are distributed in a similar manner throughout the packaging run of OREAS 610 and whether the variance between two subsamples from the same unit is statistically distinguishable to the variance from two subsamples taken from any two separate units. A reference material therefore, can possess poor absolute homogeneity yet still pass a relative homogeneity test if the within-unit heterogeneity is large and similar across all units. Based on the statistical analysis of the results of the inter-laboratory certification program it can be concluded that OREAS 610 is fit-for-purpose as a certified reference material (see ‘Intended Use’ below).
COA-1400-OREAS610-R1 Page: 16 of 22
PARTICIPATING LABORATORIES
1. Actlabs, Ancaster, Ontario, Canada
2. AGAT Laboratories, Mississauga, Ontario, Canada
3. Alex Stewart International, Mendoza, Argentina
4. ALS, Brisbane, QLD, Australia
5. ALS, Lima, Peru
6. ALS, Loughrea, Galway, Ireland
7. ALS, Perth, WA, Australia
8. ALS, Vancouver, BC, Canada
9. ANSTO, Lucas Heights, NSW, Australia
10. ARGETEST Mineral Processing, Ankara, Central Anatolia, Turkey
11. Bureau Veritas Commodities Canada Ltd, Vancouver, BC, Canada
12. Bureau Veritas Geoanalytical, Perth, WA, Australia
13. CERTIMIN, Lima, Peru
14. Chrysos Corporation Limited, Kalgoorlie, WA, Australia
15. Chrysos Corporation Limited, Perth, WA, Australia
16. Inspectorate (BV), Lima, Peru
17. Inspectorate America Corporation (BV), Sparks, Nevada, USA
18. Intertek Genalysis, Perth, WA, Australia
19. Intertek Testing Services, Townsville, QLD, Australia
20. Intertek Testing Services Philippines, Cupang, Muntinlupa, Philippines
21. On Site Laboratory Services, Bendigo, VIC, Australia
22. PT Geoservices Ltd, Cikarang, Jakarta Raya, Indonesia
23. PT Intertek Utama Services, Jakarta Timur, DKI Jakarta, Indonesia
24. SGS, Ankara, Anatolia, Turkey
25. SGS Canada Inc., Vancouver, BC, Canada
26. SGS de Mexico SA de CV, Cd. Industrial, Durango, Mexico
27. SGS del Peru, Lima, Peru
28. Skyline Assayers & Laboratories, Tucson, Arizona, USA
Please note: Above numbered alphabetical list of participating laboratories does not reflect the Lab ID numbering on the scatter plots below.
COA-1400-OREAS610-R1 Page: 17 of 22
Figure 1. ‘Au’ (ppm) by Pb Fire Assay in OREAS 610
COA-1400-OREAS610-R1 Page: 18 of 22
Figure 2. ‘Ag’ (ppm) by 4-acid digestion in OREAS 610
COA-1400-OREAS610-R1 Page: 19 of 22
Figure 3. ‘Cu’ (wt.%) by 4-acid digestion in OREAS 610
COA-1400-OREAS610-R1 Page: 20 of 22
PREPARER AND SUPPLIER Certified reference material OREAS 610 was prepared, certified and supplied by: ORE Research & Exploration Pty Ltd Tel: +613-9729 0333
37A Hosie Street Fax: +613-9729 8338
Bayswater North VIC 3153 Web: www.ore.com.au
AUSTRALIA Email: [email protected]
METROLOGICAL TRACEABILITY The analytical samples were selected in a manner to represent the entire batch of prepared CRM. This ‘representivity’ was maintained in each submitted laboratory sample batch and ensures the user that the data is traceable from sample selection through to the analytical results that underlie the consensus values. Each analytical data set has been validated by its assayer through the inclusion of internal reference materials and QC checks during analysis. The laboratories were chosen on the basis of their competence (from past performance in inter-laboratory programs undertaken by ORE Pty Ltd) for a particular analytical method, analyte or analyte suite, and sample matrix. Most of these laboratories have and maintain ISO 17025 accreditation. The certified values presented in this report are calculated from the means of accepted data following robust statistical treatment as detailed in this report. Guide ISO/TR 16476:2016, section 5.3.1 describes metrological traceability in reference materials as it pertains to the transformation of the measurand. In this section it states, “Although the determination of the property value itself can be made traceable to appropriate units through, for example, calibration of the measurement equipment used, steps like the transformation of the sample from one physical (chemical) state to another cannot. Such transformations may only be compared with a reference (when available), or among themselves. For some transformations, reference methods have been defined and may be used in certification projects to evaluate the uncertainty associated with such a transformation. In other cases, only a comparison among different laboratories using the same method is possible. In this case, certification takes place on the basis of agreement among independent measurement results (see ISO Guide 35:2006, Clause 10).”
COMMUTABILITY
The measurements of the results that underlie the certified values contained in this report were undertaken by methods involving pre-treatment (digestion/fusion) of the sample. This served to reduce the sample to a simple and well understood form permitting calibration using simple solutions of the CRM. Due to these methods being well understood and highly effective, commutability is not an issue for this CRM. All OREAS CRMs are sourced from natural ore minerals meaning they will display similar behaviour as routine ‘field’ samples in the relevant measurement process. Care should be taken to ensure ‘matrix matching’ as close as practically achievable. The matrix and mineralisation style of the CRM is described in the ‘Source Material’ section and users should select appropriate CRMs matching these attributes to their field samples.
COA-1400-OREAS610-R1 Page: 21 of 22
INTENDED USE OREAS 610 is intended to cover all activities needed to produce a measurement result. This includes extraction, possible separation steps and the actual measurement process (the signal producing step). OREAS 610 may be used to calibrate the entire procedure by producing a pure substance CRM transformed into a calibration solution. OREAS 610 is intended for the following uses:
For the monitoring of laboratory performance in the analysis of analytes reported in Table 1 in geological samples;
For the verification of analytical methods for analytes reported in Table 1;
For the calibration of instruments used in the determination of the concentration of analytes reported in Table 1.
STABILITY AND STORAGE INSTRUCTIONS OREAS 610 has been prepared from sulphide bearing ores and concentrate blended with rhyodacite. It contains reactive sulphide (~4.1% S) and has been packaged under nitrogen in single use laminated foil pouches. In its unopened state and under normal conditions of storage the CRM has a shelf life beyond ten years. Its stability will be monitored at regular intervals and purchasers notified if any changes are observed.
INSTRUCTIONS FOR CORRECT USE The certified values for OREAS 610 refer to the concentration level in its packaged state. It should not be dried prior to weighing and analysis.
HANDLING INSTRUCTIONS Fine powders pose a risk to eyes and lungs and therefore standard precautions such as the use of safety glasses and dust masks are advised.
LEGAL NOTICE Ore Research & Exploration Pty Ltd has prepared and statistically evaluated the property values of this reference material to the best of its ability. The Purchaser by receipt hereof releases and indemnifies Ore Research & Exploration Pty Ltd from and against all liability and costs arising from the use of this material and information.
DOCUMENT HISTORY
Revision No. Date Changes applied
1 24th July 2019 Edited ‘PARTICIPATING LABORATORIES’ list.
0 11th July 2019 First publication.
COA-1400-OREAS610-R1 Page: 22 of 22
QMS ACCREDITATION ORE Pty Ltd is accredited to ISO 9001:2015 by Lloyd’s Register Quality Assurance Ltd for its quality management system including development, manufacturing, certification and supply of CRMs.
CERTIFYING OFFICER
24th July, 2019
Craig Hamlyn (B.Sc. Hons - Geology), Technical Manager - ORE P/L
REFERENCES Govett, G.J.S. (1983), ed. Handbook of Exploration Geochemistry, Volume 2: Statistics and Data Analysis in Geochemical Prospecting (Variations of accuracy and precision), P.O. Box 330, 1000 AH Amsterdam, The Netherlands.
Ingamells, C. O. and Switzer, P. (1973), Talanta 20, 547-568.
ISO Guide 30:2015, Terms and definitions used in connection with reference materials.
ISO Guide 31:2015, Reference materials – Contents of certificates and labels.
ISO Guide 35:2017, Certification of reference materials - General and statistical principals.
ISO 16269:2014, Statistical interpretation of data – Part 6: Determination of statistical tolerance intervals.
Munsell Rock Color Book (2014), Rock-Color Chart Committee, Geological Society of America (GSA), 4300 44th Street SE, Grand Rapids, MI 49512.