chapter 2 observing the electromagnetic spectrum
TRANSCRIPT
Chapter 2
Observing the ElectromagneticSpectrum
2.1 Earth’s Atmosphere and Extraneous Radia-
tion
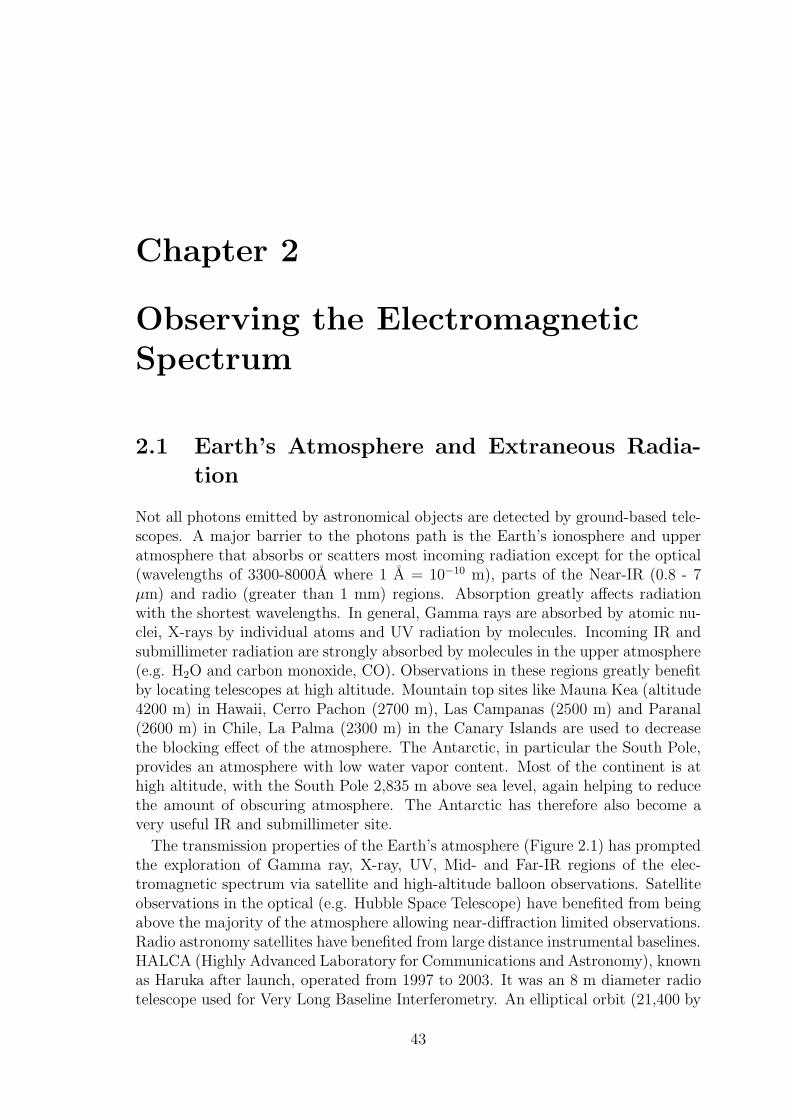
Not all photons emitted by astronomical objects are detected by ground-based tele-scopes. A major barrier to the photons path is the Earth’s ionosphere and upperatmosphere that absorbs or scatters most incoming radiation except for the optical(wavelengths of 3300-8000A where 1 A = 10−10 m), parts of the Near-IR (0.8 - 7µm) and radio (greater than 1 mm) regions. Absorption greatly affects radiationwith the shortest wavelengths. In general, Gamma rays are absorbed by atomic nu-clei, X-rays by individual atoms and UV radiation by molecules. Incoming IR andsubmillimeter radiation are strongly absorbed by molecules in the upper atmosphere(e.g. H2O and carbon monoxide, CO). Observations in these regions greatly benefitby locating telescopes at high altitude. Mountain top sites like Mauna Kea (altitude4200 m) in Hawaii, Cerro Pachon (2700 m), Las Campanas (2500 m) and Paranal(2600 m) in Chile, La Palma (2300 m) in the Canary Islands are used to decreasethe blocking effect of the atmosphere. The Antarctic, in particular the South Pole,provides an atmosphere with low water vapor content. Most of the continent is athigh altitude, with the South Pole 2,835 m above sea level, again helping to reducethe amount of obscuring atmosphere. The Antarctic has therefore also become avery useful IR and submillimeter site.
The transmission properties of the Earth’s atmosphere (Figure 2.1) has promptedthe exploration of Gamma ray, X-ray, UV, Mid- and Far-IR regions of the elec-tromagnetic spectrum via satellite and high-altitude balloon observations. Satelliteobservations in the optical (e.g. Hubble Space Telescope) have benefited from beingabove the majority of the atmosphere allowing near-diffraction limited observations.Radio astronomy satellites have benefited from large distance instrumental baselines.HALCA (Highly Advanced Laboratory for Communications and Astronomy), knownas Haruka after launch, operated from 1997 to 2003. It was an 8 m diameter radiotelescope used for Very Long Baseline Interferometry. An elliptical orbit (21,400 by
43
44 CHAPTER 2. OBSERVING THE ELECTROMAGNETIC SPECTRUM
Figure 2.1: Transmission Properties of Earth’s Atmosphere. Credit: NASA and”Imagine the Universe!” http://imagine.gsfc.nasa.gov/.
560 km) allowed imaging by the satellite and ground based telescopes, with good(u,v) plane coverage and high resolution. In late 1998 the Balloon Observations ofMillimetric Extragalactic Radiation and Geophysics experiment (BOOMERANG),observed the sky at millimeter wavelengths for about ten days. Future space in-terferometry missions include ESAs Darwin mission and NASAs Terrestrial PlanetFinder, both in mission concept stages of planning.
Emission from the night sky plays an important part in observational astronomyand seriously affects our ability to detect faint objects. Reactions in the upperatmosphere that result in radiation are known as airglow or nightglow. Electronsrecombining with ions (e.g. O, Na, O2, OH) at typical altitudes of 100 km canradiate in the Ultraviolet, optical and Near-IR regions. The emission is usuallymeasured in Rayleighs where
1 Rayleigh = 106 photons cm−2 s−1 sr−1
and sr is steradian1. For example, at 762 nm the emission from O2 is ∼6000Rayleigh.
The interaction of the solar wind with the Earth’s magnetic field results in polaraurorae, usually close to the geomagnetic poles. Dust grains in the plane of theSolar System scatter sunlight causing zodiacal light. The Sun and the Moon aremajor contributors to night sky brightness. The influence of the Moon is easy towitness if you compare the night sky brightness at both Full and New Moon. Opticalobservations that aim to detect very faint objects are usually scheduled during darkskies, close to New Moon.
1Steradian is a unit of solid angle. A sphere measures 4π ∼12.56637 steradians
2.1. EARTH’S ATMOSPHERE AND EXTRANEOUS RADIATION 45
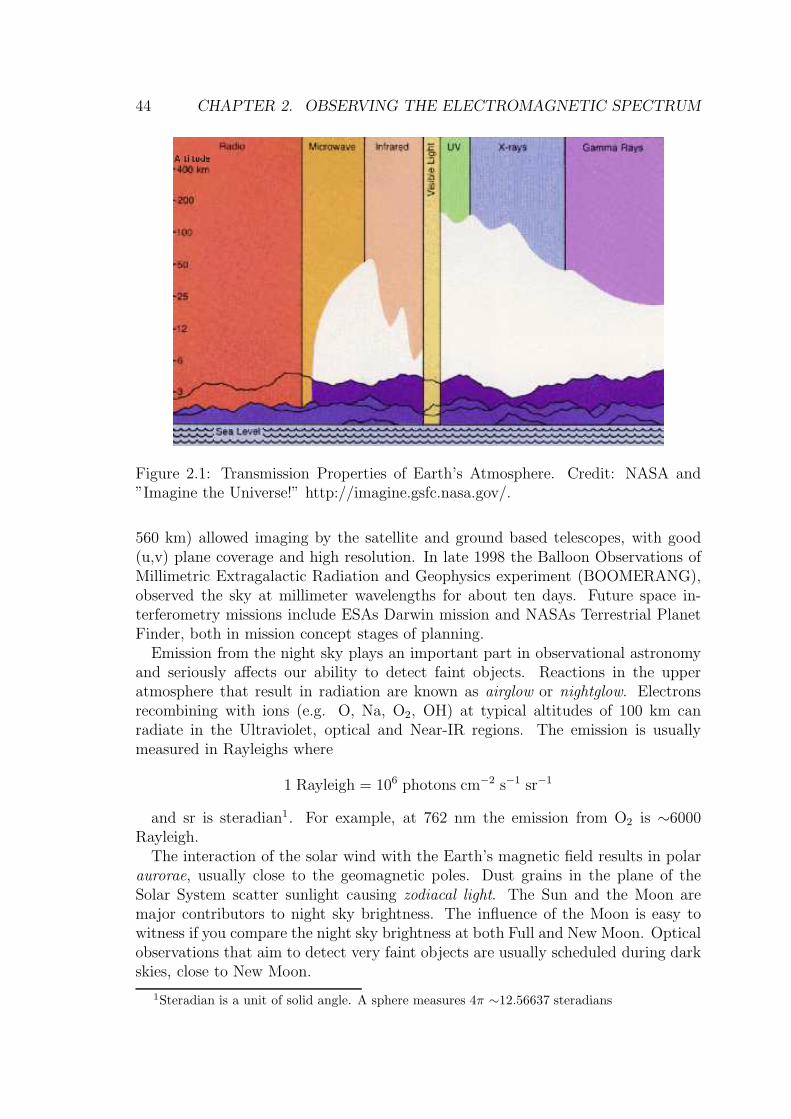
Figure 2.2: The main image shows the Mayall 4 m telescope at Kitt Peak NationalObservatory in visual light. The insert shows the horseshoe mount at 10 µm takenwith a thermal video camera. Hot oil lubricated bearings that support the mountappear as bright red. Credit: National Optical Astronomy Observatory, M. Hanna,G. Jacoby.
Other extraneous radiation sources are also present. Ground-based Near-IR obser-vations are plagued by background heat radiation from the telescope (e.g. mirrors)and structure (e.g. oil lubricated bearing of horseshoe mounts; Figure 2.2). Theinsert image of Figure 2.2 at a wavelength of 10 µm shows temperature changesrepresented by color differences. Oil lubricated bearings that support the horseshoemount appear in the infrared image as bright red, representing a 15◦ C increase intemperature above surrounding structures.
This nuisance radiation is also minimized by cooling and reducing the surface areaalong the optical path of instruments. The Near-IR background sky is also verybright and highly variable on short time scales. Observations from the excellentground-based IR sites of the Antarctic, Chile and Mauna Kea can help minimizesuch fluctuations, yet satellite observations offer the best IR observing conditions.
Human activity produces spurious radiation sources that can affect astronomi-cal observations. These include microwave and radio emission from industrial andtelecommunication sources. In the optical region night-time outdoor lighting andgeneral city and suburban lights have all put additional pressure on the quality ofobservations. Finally, whilst satellites have allowed us to make observations across
46 CHAPTER 2. OBSERVING THE ELECTROMAGNETIC SPECTRUM
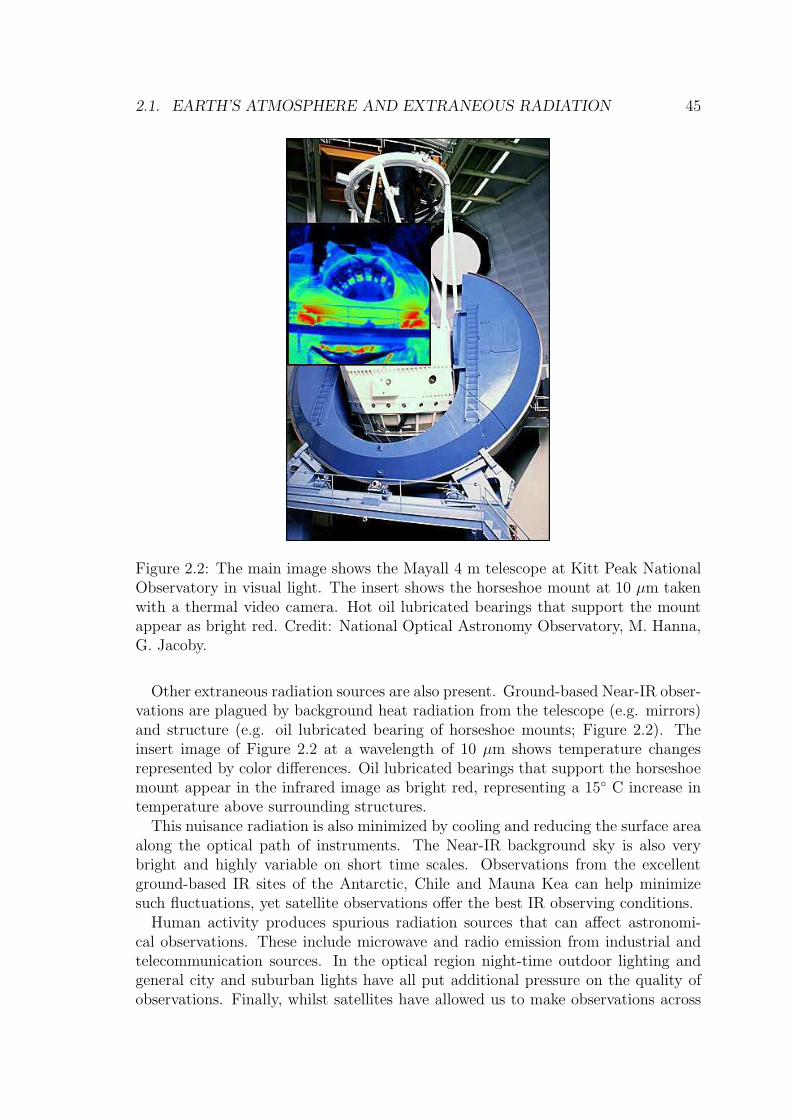
Figure 2.3: Globular cluster NGC 104 (47 Tuc) and satellite trail. A 30 secondexposure, 30 ′′ across. Credit: A. Mattingly, Grove Creek Observatory.
the entire electromagnetic region, they too are sources of increasing ’pollution’ forground-based observations, when recorded as streaks of light across long exposurewide-field images near to, or through (Figure 2.3) objects of interest. Of July, 2009there were ∼900 operational satellites, with ∼1500 objects greater than 100 kg inmass in orbit, and 19,000 objects in orbit with diameters > 10 cm.
2.2 Temperature, Energy, Wavelength and Fre-
quency
In astronomy, temperatures are usually quoted in terms of degrees Kelvin (K). OneK is the same interval as 1◦ Celsius (C), however the Kelvin scale starts at absolutezero, or -273.16◦ C.
As might be expected temperatures of astronomical radiation sources vary widely.Dusty, dark nebulae (e.g. the Horsehead Nebula in Orion) exist at temperatures be-tween 10-100 K enabling molecular hydrogen (H2), carbon monoxide (CO), hydrogencyanide (HCN) and water (H2O) to exist in molecular clouds.
Dust grains emit at a characteristic temperature between 20-100 K and are foundin and near such clouds. The temperature of neutral or atomic hydrogen, H I, isusually between 25-250 K. Emission nebulae or ionized H II regions (near hot, youngstars that strongly emit UV radiation) exist at ∼10,000 K. The surface temperaturesof stars range from 2,500-40,000 K. Our Sun, a G dwarf, has a surface temperatureof 5,800 K. Surface temperatures of neutron stars could be several × 105 K. Gastemperatures in accretion disks (e.g. around the black hole candidate Cygnus X-1)are ∼2 × 10⁶ K. Galaxy cluster (ICM) gas detected in the X-ray region, typically has
2.2. TEMPERATURE, ENERGY, WAVELENGTH AND FREQUENCY 47
temperatures of 107 K. The temperature of gas involved in thermonuclear explosionsnear the surface of accreting neutron stars is ∼107−9 K. Hence astronomical objecttemperatures range over nine orders of magnitude, or a factor of a billion.
Emission, especially in the Gamma ray and X-ray regions, is typically measuredin terms of its corresponding energy in units of electron Volts (eV2). X-ray energiesare usually measured in terms of keV with kT as the symbol for energy, where thek (in kT) is Boltzmann’s constant = 1.38 x 10⁻¹⁶ erg/K. Gamma ray energies arequoted in MeV, GeV and in extreme cases TeV.
Radiation wavelengths are typically quoted when discussing the EUV region andlonger wavelengths. Nanometers (nm) and Angstroms (A) are used until the Near-IR when microns (µm) are stated. From submillimeter to Radio units progress frommm to cm to m and are interchanged with frequency units such as MHz and GHz.
2One eV is the energy acquired by an electron when it is accelerated through a potentialdifference of 1 Volt in a vacuum. 1 eV has an associated energy = 1.60 x 10⁻¹² erg.
48 CHAPTER 2. OBSERVING THE ELECTROMAGNETIC SPECTRUM
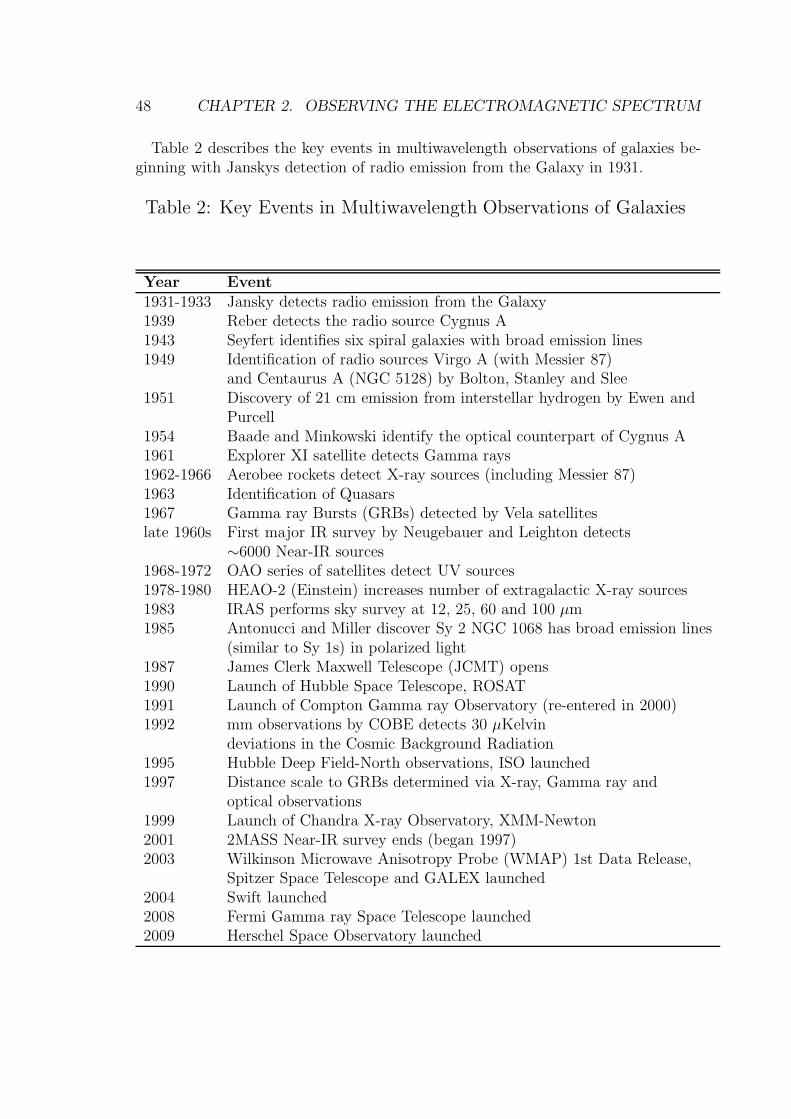
Table 2 describes the key events in multiwavelength observations of galaxies be-ginning with Janskys detection of radio emission from the Galaxy in 1931.
Table 2: Key Events in Multiwavelength Observations of Galaxies
Year Event1931-1933 Jansky detects radio emission from the Galaxy1939 Reber detects the radio source Cygnus A1943 Seyfert identifies six spiral galaxies with broad emission lines1949 Identification of radio sources Virgo A (with Messier 87)
and Centaurus A (NGC 5128) by Bolton, Stanley and Slee1951 Discovery of 21 cm emission from interstellar hydrogen by Ewen and
Purcell1954 Baade and Minkowski identify the optical counterpart of Cygnus A1961 Explorer XI satellite detects Gamma rays1962-1966 Aerobee rockets detect X-ray sources (including Messier 87)1963 Identification of Quasars1967 Gamma ray Bursts (GRBs) detected by Vela satelliteslate 1960s First major IR survey by Neugebauer and Leighton detects
∼6000 Near-IR sources1968-1972 OAO series of satellites detect UV sources1978-1980 HEAO-2 (Einstein) increases number of extragalactic X-ray sources1983 IRAS performs sky survey at 12, 25, 60 and 100 µm1985 Antonucci and Miller discover Sy 2 NGC 1068 has broad emission lines
(similar to Sy 1s) in polarized light1987 James Clerk Maxwell Telescope (JCMT) opens1990 Launch of Hubble Space Telescope, ROSAT1991 Launch of Compton Gamma ray Observatory (re-entered in 2000)1992 mm observations by COBE detects 30 µKelvin
deviations in the Cosmic Background Radiation1995 Hubble Deep Field-North observations, ISO launched1997 Distance scale to GRBs determined via X-ray, Gamma ray and
optical observations1999 Launch of Chandra X-ray Observatory, XMM-Newton2001 2MASS Near-IR survey ends (began 1997)2003 Wilkinson Microwave Anisotropy Probe (WMAP) 1st Data Release,
Spitzer Space Telescope and GALEX launched2004 Swift launched2008 Fermi Gamma ray Space Telescope launched2009 Herschel Space Observatory launched
2.3. TELESCOPES AND INSTRUMENTS 49
2.3 Telescopes and Instruments
The following will briefly describe the main telescopes and instruments used to ob-tain images presented in the atlas or those used in observations discussed in the text.Detectors are not described. Since there exists significant overlap between telescopesused for submillimeter and radio observations these are considered together.
2.3.1 Gamma ray
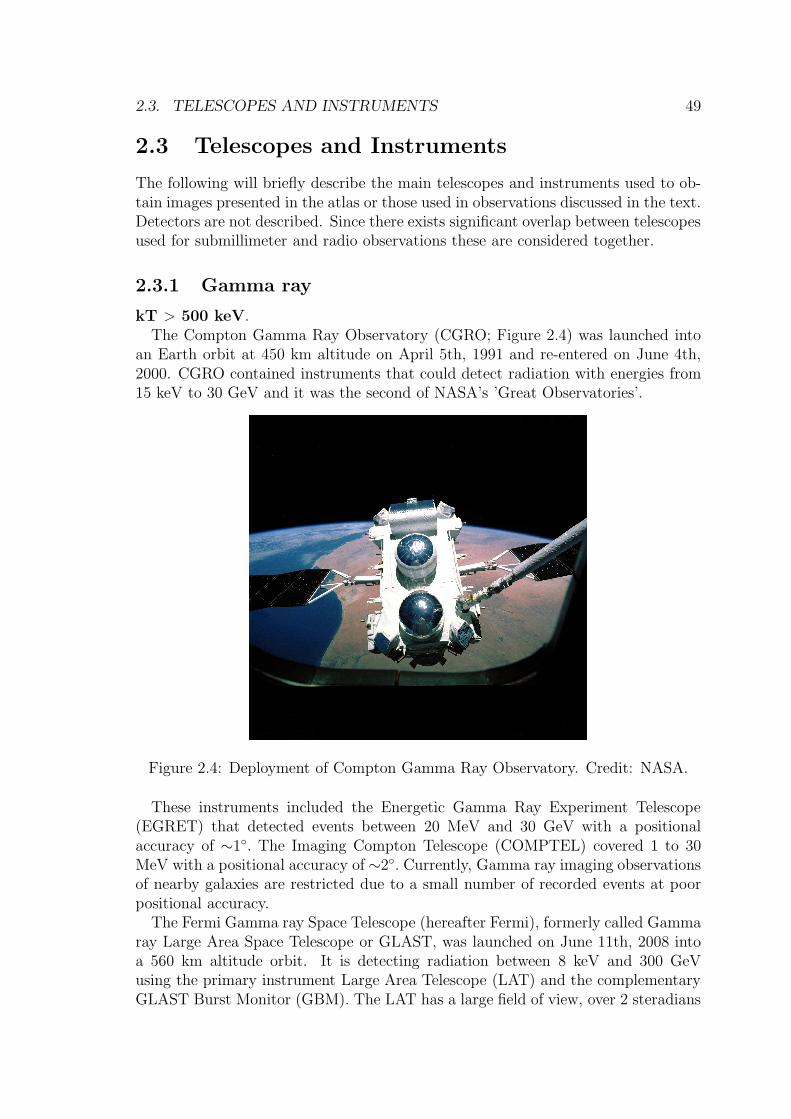
kT > 500 keV.The Compton Gamma Ray Observatory (CGRO; Figure 2.4) was launched into
an Earth orbit at 450 km altitude on April 5th, 1991 and re-entered on June 4th,2000. CGRO contained instruments that could detect radiation with energies from15 keV to 30 GeV and it was the second of NASA’s ’Great Observatories’.
Figure 2.4: Deployment of Compton Gamma Ray Observatory. Credit: NASA.
These instruments included the Energetic Gamma Ray Experiment Telescope(EGRET) that detected events between 20 MeV and 30 GeV with a positionalaccuracy of ∼1◦. The Imaging Compton Telescope (COMPTEL) covered 1 to 30MeV with a positional accuracy of ∼2◦. Currently, Gamma ray imaging observationsof nearby galaxies are restricted due to a small number of recorded events at poorpositional accuracy.
The Fermi Gamma ray Space Telescope (hereafter Fermi), formerly called Gammaray Large Area Space Telescope or GLAST, was launched on June 11th, 2008 intoa 560 km altitude orbit. It is detecting radiation between 8 keV and 300 GeVusing the primary instrument Large Area Telescope (LAT) and the complementaryGLAST Burst Monitor (GBM). The LAT has a large field of view, over 2 steradians
50 CHAPTER 2. OBSERVING THE ELECTROMAGNETIC SPECTRUM
(one-fifth of the entire sky), can measure the locations of bright sources to within 1arcminute and is sensitive to photons from 30 MeV to greater than 300 GeV. TheGBM cover X-rays and Gamma rays between 8 keV to 30 MeV, overlapping withthe LATs lower-energies.
2.3.2 X-ray
Hard: 3 < kT < 500 keV; Soft: 0.1<kT<3 keV.The High Energy Astrophysical Observatory-2 (HEAO-2), later named Einstein,
was launched into low Earth orbit on November 13th, 1978 and operated until April,1981. It was the first X-ray mission to use focusing optics with imaging detectorsand produce angular resolution of a few arc seconds3 ( ′′) and a field-of-view of tensof arc minutes ( ′).
The Rontgen Observatory Satellite (ROSAT; Trumper 1983) was launched onJune 1st, 1990 and is currently non-operational, though still orbiting the Earth.ROSAT Position Sensitive Proportional Counter (PSPC) Soft X-ray images span-ning the energy range 0.1-2.4 keV, known as Broadband, and 0.1-0.4 keV, known asSoftband will be shown in this atlas. Typically, lower energy X-rays are referred toas ’soft’, while high energy X-rays, not surprisingly, are designated ’hard’. ROSATPSPC images have a minimum angular resolution of 25 ′′ (FWHM) over a field ofview of 2◦. ROSAT High Resolution Imager (HRI) has an angular resolution of ∼5 ′′
FWHM and a ∼30 ′ field of view.Chandra X-ray Observatory (CXO), formerly the Advanced X-ray Astrophysics
Facility or AXAF), was the U.S. follow-on to Einstein, and was launched on July23rd, 1999. Chandra was the third of NASA’s ’Great Observatories’. Chandra hasa highly elliptical orbit, 133,000 by 16,000 km, which puts it above the Van Allenbelts for ∼85% of its orbit. CXO carries a set of nested high angular resolutionmirrors, two imaging detectors (Advanced CCD Imaging Spectrometer, ACIS andHigh Resolution Camera, HRC), and two sets of transmission gratings (for spectralobservations). Important CXO features are: an order of magnitude improvementin angular resolution (above ROSAT and Einstein), good sensitivity from 0.1 to 10keV, and the capability for high spectral resolution observations over most of thisrange.
XMM-Newton was launched on December 10th, 1999, into a 48 hour ellipticalorbit with an apogee of 114,000 km, and perigee of 7000 km. It has a spectralrange of 0.1 - 12.0 keV (120 - 1 A), and its primary imager is the European PhotonImaging Cameras (EPIC).
2.3.3 Extreme Ultraviolet
Extreme (EUV): 100-912A.The Extreme Ultraviolet Explorer (EUVE) was launched on June 7th, 1992 and
re-entered on January 30th, 2002. EUVE and ROSAT Wide Field Camera (WFC)both had Extreme UV (EUV) survey imaging capabilities. However they do not
3Seconds of arc are denoted as ′′; minutes of arc as ′; degrees as ◦. See Table 7, page 279.
2.3. TELESCOPES AND INSTRUMENTS 51
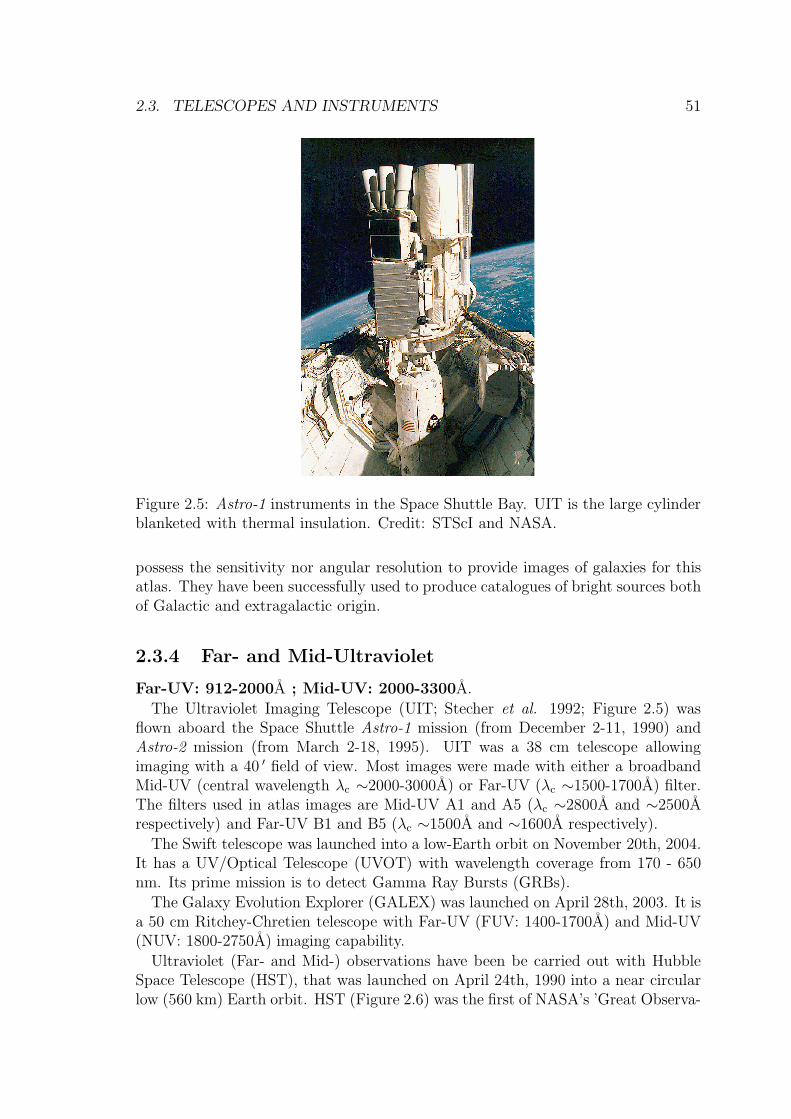
Figure 2.5: Astro-1 instruments in the Space Shuttle Bay. UIT is the large cylinderblanketed with thermal insulation. Credit: STScI and NASA.
possess the sensitivity nor angular resolution to provide images of galaxies for thisatlas. They have been successfully used to produce catalogues of bright sources bothof Galactic and extragalactic origin.
2.3.4 Far- and Mid-Ultraviolet
Far-UV: 912-2000A ; Mid-UV: 2000-3300A.
The Ultraviolet Imaging Telescope (UIT; Stecher et al. 1992; Figure 2.5) wasflown aboard the Space Shuttle Astro-1 mission (from December 2-11, 1990) andAstro-2 mission (from March 2-18, 1995). UIT was a 38 cm telescope allowingimaging with a 40 ′ field of view. Most images were made with either a broadbandMid-UV (central wavelength λc ∼2000-3000A) or Far-UV (λc ∼1500-1700A) filter.The filters used in atlas images are Mid-UV A1 and A5 (λc ∼2800A and ∼2500Arespectively) and Far-UV B1 and B5 (λc ∼1500A and ∼1600A respectively).
The Swift telescope was launched into a low-Earth orbit on November 20th, 2004.It has a UV/Optical Telescope (UVOT) with wavelength coverage from 170 - 650nm. Its prime mission is to detect Gamma Ray Bursts (GRBs).
The Galaxy Evolution Explorer (GALEX) was launched on April 28th, 2003. It isa 50 cm Ritchey-Chretien telescope with Far-UV (FUV: 1400-1700A) and Mid-UV(NUV: 1800-2750A) imaging capability.
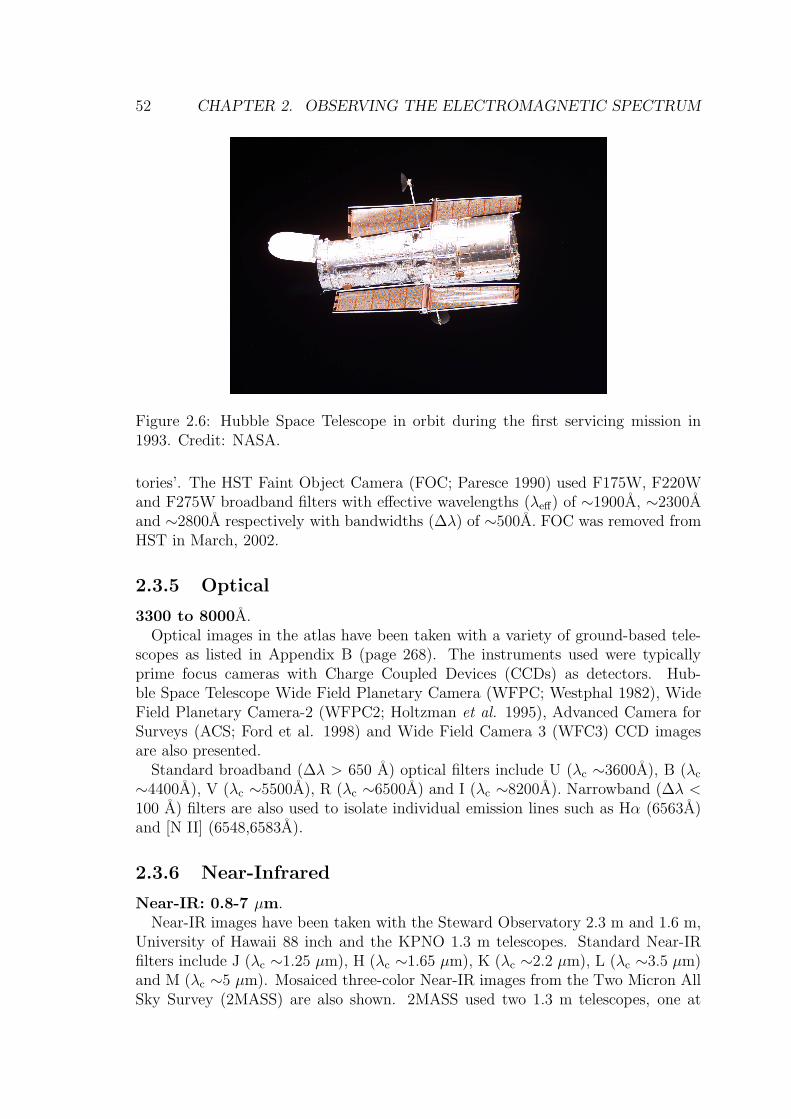
Ultraviolet (Far- and Mid-) observations have been be carried out with HubbleSpace Telescope (HST), that was launched on April 24th, 1990 into a near circularlow (560 km) Earth orbit. HST (Figure 2.6) was the first of NASA’s ’Great Observa-
52 CHAPTER 2. OBSERVING THE ELECTROMAGNETIC SPECTRUM
Figure 2.6: Hubble Space Telescope in orbit during the first servicing mission in1993. Credit: NASA.
tories’. The HST Faint Object Camera (FOC; Paresce 1990) used F175W, F220Wand F275W broadband filters with effective wavelengths (λeff) of ∼1900A, ∼2300Aand ∼2800A respectively with bandwidths (∆λ) of ∼500A. FOC was removed fromHST in March, 2002.
2.3.5 Optical
3300 to 8000A.Optical images in the atlas have been taken with a variety of ground-based tele-
scopes as listed in Appendix B (page 268). The instruments used were typicallyprime focus cameras with Charge Coupled Devices (CCDs) as detectors. Hub-ble Space Telescope Wide Field Planetary Camera (WFPC; Westphal 1982), WideField Planetary Camera-2 (WFPC2; Holtzman et al. 1995), Advanced Camera forSurveys (ACS; Ford et al. 1998) and Wide Field Camera 3 (WFC3) CCD imagesare also presented.
Standard broadband (∆λ > 650 A) optical filters include U (λc ∼3600A), B (λc
∼4400A), V (λc ∼5500A), R (λc ∼6500A) and I (λc ∼8200A). Narrowband (∆λ <100 A) filters are also used to isolate individual emission lines such as Hα (6563A)and [N II] (6548,6583A).
2.3.6 Near-Infrared
Near-IR: 0.8-7 µm.Near-IR images have been taken with the Steward Observatory 2.3 m and 1.6 m,
University of Hawaii 88 inch and the KPNO 1.3 m telescopes. Standard Near-IRfilters include J (λc ∼1.25 µm), H (λc ∼1.65 µm), K (λc ∼2.2 µm), L (λc ∼3.5 µm)and M (λc ∼5 µm). Mosaiced three-color Near-IR images from the Two Micron AllSky Survey (2MASS) are also shown. 2MASS used two 1.3 m telescopes, one at
2.3. TELESCOPES AND INSTRUMENTS 53
Mt. Hopkins, Arizona, and one at CTIO, Chile. Each telescope was equipped witha three-channel camera, each channel consisting of a 256 × 256 array of HgCdTedetectors, capable of observing the sky simultaneously at J, H, and Ks (2.17 µm).
2.3.7 Mid- and Far-Infrared
Mid-IR: 7-25 µm; Far-IR: 25-300 µm.The Infrared Astronomical Satellite (IRAS; Neugebauer et al. 1984) was launched
on January 25th, 1983 into a 900 km altitude orbit. It produced an all-sky surveycovering 96% of the sky at wavelengths of 12, 25, 60 and 100 µm. IRAS had a 0.57m diameter primary mirror and the telescope was mounted in a liquid helium cooledcryostat. The mirrors were made of beryllium and cooled to approximately 4 K. OnNovember 22nd, 1983 the survey finished due to the depletion of on-board liquidhelium.
The Infrared Space Observatory (ISO; Kessler et al. 1996) was launched onNovember 17th, 1995 and ceased observation in April 1998. ISO operated from2.5 to 240 µm. It had a 60 cm diameter primary mirror and several instrumentsincluding ISOPHOT (Lemke et al. 1996) that could perform imaging as well aspolarimetry4.
The Spitzer Space Telescope (SST; formerly SIRTF, the Space Infrared TelescopeFacility; Werner et al. 2004) was launched on August 25th, 2003 and is the fourthand final telescope in NASA’s family of ’Great Observatories’. SST is in an Earthtrailing heliocentric orbit and moves away from Earth at ∼0.1 AU5 per year. SSThas an 85 cm diameter mirror and three cryogenically cooled science instrumentscapable of performing imaging and spectroscopy between 3.6 to 160 µm. Wide field,broadband imaging is done by the Infrared Array Camera (IRAC) and the MultibandImaging Photometer for Spitzer (MIPS).
2.3.8 Submillimeter and Radio
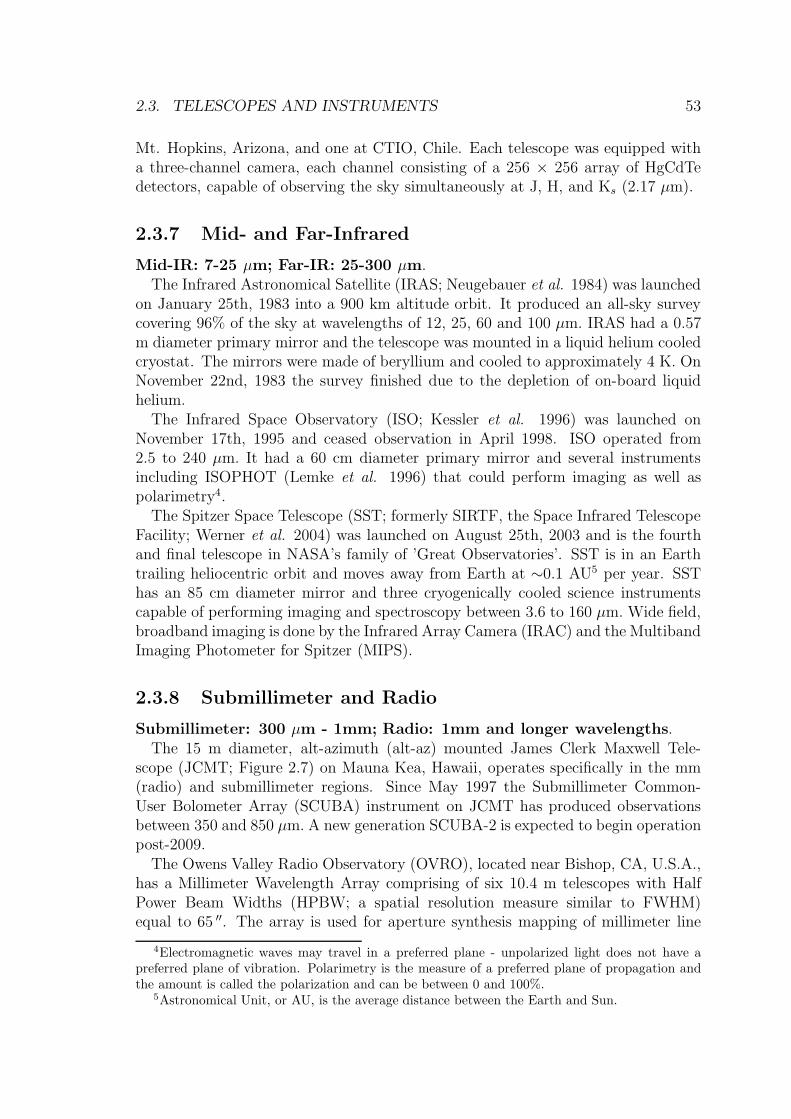
Submillimeter: 300 µm - 1mm; Radio: 1mm and longer wavelengths.The 15 m diameter, alt-azimuth (alt-az) mounted James Clerk Maxwell Tele-
scope (JCMT; Figure 2.7) on Mauna Kea, Hawaii, operates specifically in the mm(radio) and submillimeter regions. Since May 1997 the Submillimeter Common-User Bolometer Array (SCUBA) instrument on JCMT has produced observationsbetween 350 and 850 µm. A new generation SCUBA-2 is expected to begin operationpost-2009.
The Owens Valley Radio Observatory (OVRO), located near Bishop, CA, U.S.A.,has a Millimeter Wavelength Array comprising of six 10.4 m telescopes with HalfPower Beam Widths (HPBW; a spatial resolution measure similar to FWHM)equal to 65 ′′. The array is used for aperture synthesis mapping of millimeter line
4Electromagnetic waves may travel in a preferred plane - unpolarized light does not have apreferred plane of vibration. Polarimetry is the measure of a preferred plane of propagation andthe amount is called the polarization and can be between 0 and 100%.
5Astronomical Unit, or AU, is the average distance between the Earth and Sun.
54 CHAPTER 2. OBSERVING THE ELECTROMAGNETIC SPECTRUM
Figure 2.7: A rare view of the James Clerk Maxwell Telescope after the telescopemembrane had been removed in preparation for removing the Secondary MirrorUnit. Credit: James Clerk Maxwell Telescope, Mauna Kea Observatory, Hawaii.
and continuum emission in the 2.7 and 1.3 mm windows. The Columbia South-ern Millimeter-Wave Telescope is a 1.2 m diameter Cassegrain telescope located atCTIO, Chile and is described in Bronfman et al. (1988).
The Very Large Array (VLA), a 27-antenna radio telescope array is located inSocorro, New Mexico, U.S.A. The telescope consists of 25 m diameter parabolicdishes, which can be placed along a Y-shaped pattern with each of the arms being20 km long. The VLA can observe radiation between 1.3 and 22 cm and achievean angular resolution similar to a telescope of size 27 km in diameter via aperturesynthesis.
The Westerbork Synthesis Radio Telescope (WSRT) is a 3 km long array of four-teen 25 m antennas, located near Hooghalen, Netherlands. The Jodrell Bank 76 mradio telescope (now known as the Lovell Telescope) is an alt-az mounted telescopein Cheshire, England. The Effelsberg (near Bonn, Germany) 100 m radio telescopewas the world’s largest moveable radio telescope until August 2000 when the 100 m× 110 m Robert C. Byrd Green Bank Telescope in Virginia saw ’first light’.
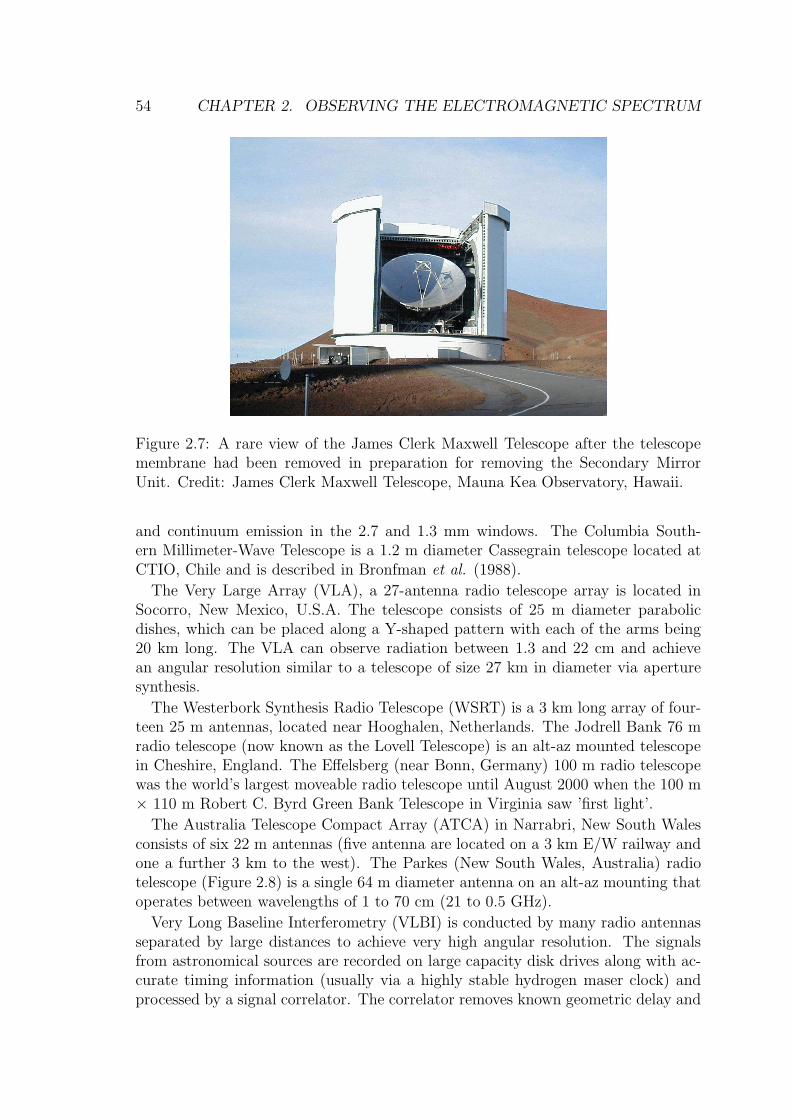
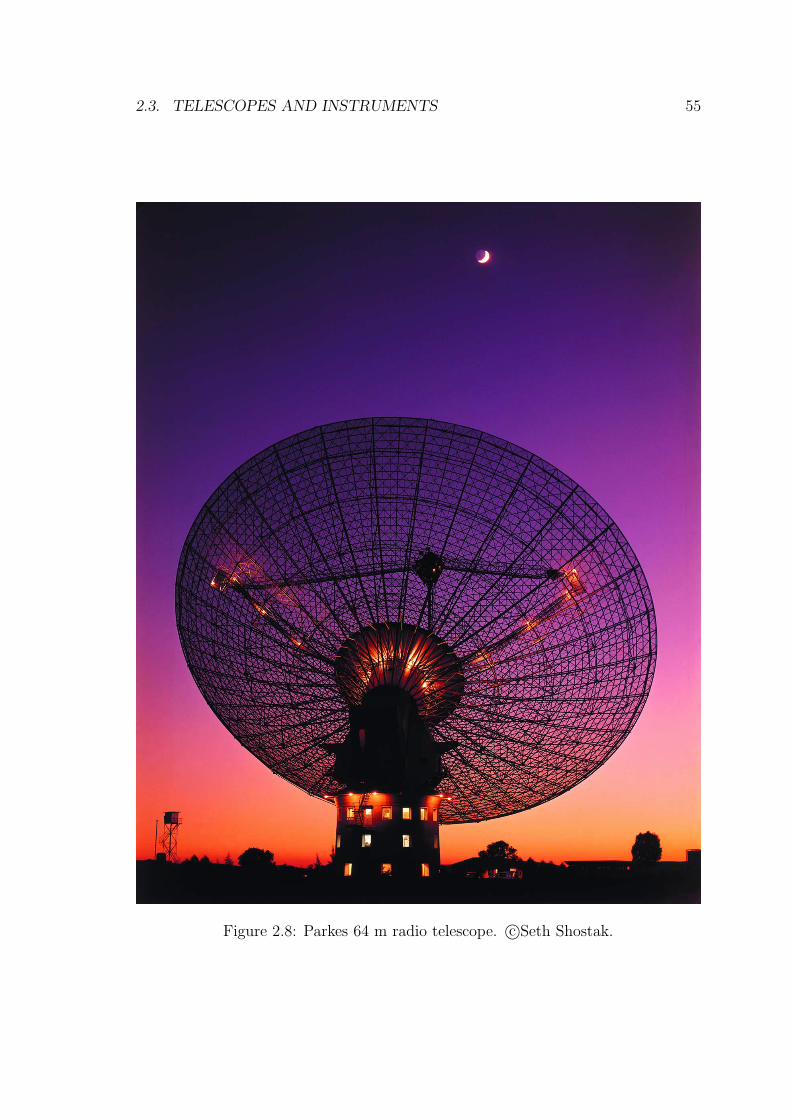
The Australia Telescope Compact Array (ATCA) in Narrabri, New South Walesconsists of six 22 m antennas (five antenna are located on a 3 km E/W railway andone a further 3 km to the west). The Parkes (New South Wales, Australia) radiotelescope (Figure 2.8) is a single 64 m diameter antenna on an alt-az mounting thatoperates between wavelengths of 1 to 70 cm (21 to 0.5 GHz).
Very Long Baseline Interferometry (VLBI) is conducted by many radio antennasseparated by large distances to achieve very high angular resolution. The signalsfrom astronomical sources are recorded on large capacity disk drives along with ac-curate timing information (usually via a highly stable hydrogen maser clock) andprocessed by a signal correlator. The correlator removes known geometric delay and
2.3. TELESCOPES AND INSTRUMENTS 55
Figure 2.8: Parkes 64 m radio telescope. c©Seth Shostak.
56 CHAPTER 2. OBSERVING THE ELECTROMAGNETIC SPECTRUM
Doppler shift due to the Earth-based motion of the antennas. The Southern Hemi-sphere VLBI Experiment (SHEVE) array was an ad hoc array of radio telescopes inthe Southern Hemisphere (mainly in Australia with occasional contributions fromSth. Africa). The Australia Telescope National Facility (ATNF) now operates theLong Baseline Array (LBA) consisting of ATCA, Mopra, and Parkes. There is anAustralian VLBI National Facility, comprising the LBA plus University of Tasmaniaantennas at Hobart and Ceduna, and the Tidbinbilla antenna.
2.4 Astronomical Sources of Radiation
The entire electromagnetic spectrum (Figure 1.6) stretches more than 15 orders ofmagnitude (a factor of 1015) from short wavelength (∼10−10 cm) high frequencyGamma rays through X-rays, Ultraviolet, Optical, Infrared, Submillimeter to thelongest wavelengths (∼105 cm) lowest frequencies of the Radio region.
The observational limits of electromagnetic radiation from astronomical objectsare not well established. At high energy, short wavelengths, TeV (where T is Tera or1012) Gamma rays have been detected from some AGN. In comparison the highestenergy cosmic ray particles (typically protons), above 1019 eV (or 107 TeV), arrive ata rate of about one particle per square kilometer per year. Low to medium energycosmic rays, up to energies of about 1018 eV, probably originate in the Galaxyvia interactions with magnetic fields. Higher energy cosmic rays are most likelyextragalactic in origin, possibly in AGN or supernovae.
At low energy, long wavelengths, radio radiation has been detected at wavelengthsof about 1.2 km (frequency 0.25 MHz; Novaco and Brown 1978). The long wave-length limit of a few km is set by absorption in the interplanetary and interstellarmedia.
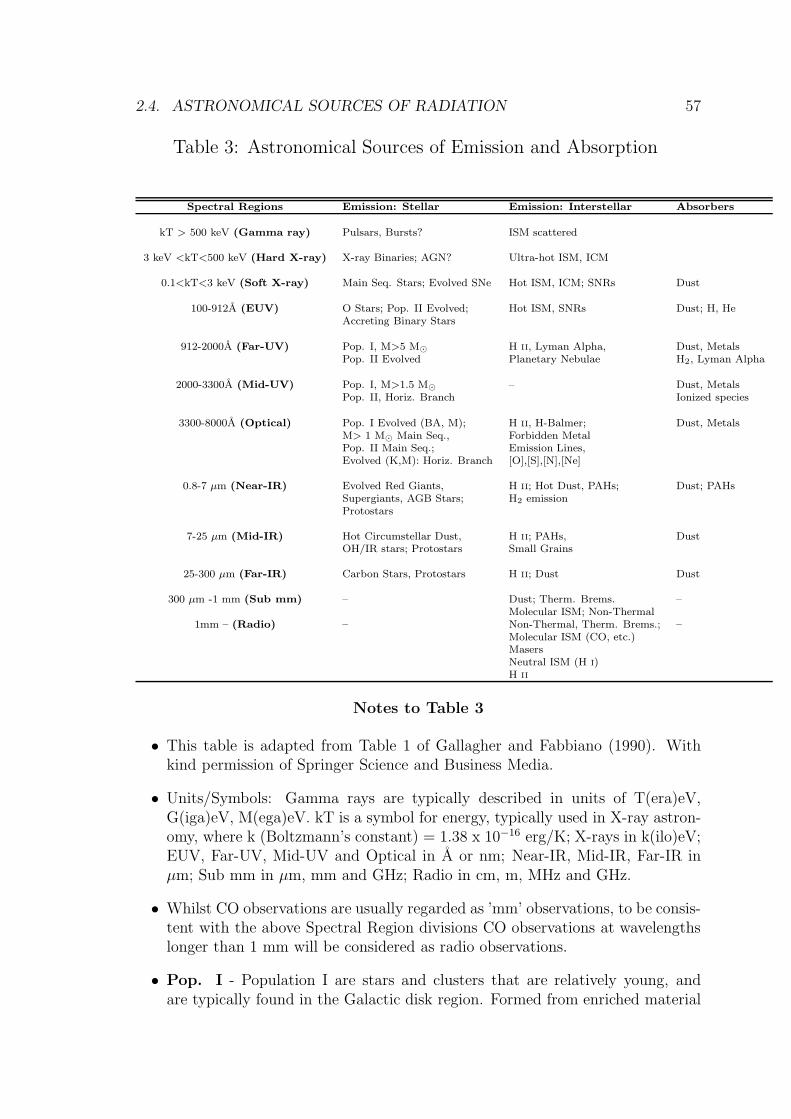
What types of objects emit radiation and in what region of the electromagneticspectrum is it detected? Table 3 (page 57) describes the main spectral regions andlists astronomical sources of emission and absorption in each region.
2.4. ASTRONOMICAL SOURCES OF RADIATION 57
Table 3: Astronomical Sources of Emission and Absorption
Spectral Regions Emission: Stellar Emission: Interstellar Absorbers
kT > 500 keV (Gamma ray) Pulsars, Bursts? ISM scattered
3 keV <kT<500 keV (Hard X-ray) X-ray Binaries; AGN? Ultra-hot ISM, ICM
0.1<kT<3 keV (Soft X-ray) Main Seq. Stars; Evolved SNe Hot ISM, ICM; SNRs Dust
100-912A (EUV) O Stars; Pop. II Evolved; Hot ISM, SNRs Dust; H, HeAccreting Binary Stars
912-2000A (Far-UV) Pop. I, M>5 M⊙ H II, Lyman Alpha, Dust, MetalsPop. II Evolved Planetary Nebulae H2, Lyman Alpha
2000-3300A (Mid-UV) Pop. I, M>1.5 M⊙ – Dust, MetalsPop. II, Horiz. Branch Ionized species
3300-8000A (Optical) Pop. I Evolved (BA, M); H II, H-Balmer; Dust, MetalsM> 1 M⊙ Main Seq., Forbidden MetalPop. II Main Seq.; Emission Lines,Evolved (K,M): Horiz. Branch [O],[S],[N],[Ne]
0.8-7 µm (Near-IR) Evolved Red Giants, H II; Hot Dust, PAHs; Dust; PAHsSupergiants, AGB Stars; H2 emissionProtostars
7-25 µm (Mid-IR) Hot Circumstellar Dust, H II; PAHs, DustOH/IR stars; Protostars Small Grains
25-300 µm (Far-IR) Carbon Stars, Protostars H II; Dust Dust
300 µm -1 mm (Sub mm) – Dust; Therm. Brems. –Molecular ISM; Non-Thermal
1mm – (Radio) – Non-Thermal, Therm. Brems.; –Molecular ISM (CO, etc.)MasersNeutral ISM (H I)H II
Notes to Table 3
• This table is adapted from Table 1 of Gallagher and Fabbiano (1990). Withkind permission of Springer Science and Business Media.
• Units/Symbols: Gamma rays are typically described in units of T(era)eV,G(iga)eV, M(ega)eV. kT is a symbol for energy, typically used in X-ray astron-omy, where k (Boltzmann’s constant) = 1.38 x 10⁻¹⁶ erg/K; X-rays in k(ilo)eV;EUV, Far-UV, Mid-UV and Optical in A or nm; Near-IR, Mid-IR, Far-IR inµm; Sub mm in µm, mm and GHz; Radio in cm, m, MHz and GHz.
• Whilst CO observations are usually regarded as ’mm’ observations, to be consis-tent with the above Spectral Region divisions CO observations at wavelengthslonger than 1 mm will be considered as radio observations.
• Pop. I - Population I are stars and clusters that are relatively young, andare typically found in the Galactic disk region. Formed from enriched material
58 CHAPTER 2. OBSERVING THE ELECTROMAGNETIC SPECTRUM
from previous stellar generations they tend to have high metallicities.6
• Pop. II - Population II are stars and Globular clusters that are relatively old,and are typically found in the spherical halo of the Galaxy. They have lowmetallicities, being formed earlier than Pop. I from less enriched material.
• X-ray Binaries - Binary star systems in which one component is a degeneratestar (e.g. white dwarf, neutron star or black hole). X-rays are emitted fromeither a gaseous accretion disk in low-mass X-ray binaries (LMXBs; when thetwo stars are of similar masses an accretion disk forms around the degener-ate star) or from an extended envelope in high-mass X-ray binaries (HMXBs;when one component is ∼10-20 M⊙ and gas flows directly onto the degeneratecomponent).
• PAHs - Polycyclic Aromatic Hydrocarbons, a component of interstellar dustmade up of small dust grains (e.g. silicates) and soot-like material. ’Hydro-carbon’ refers to a composition of C and H atoms. ’Polycyclic’ indicates themolecules have multiple loops of C atoms. ’Aromatic’ refers to the kinds ofbonds that exist between the C atoms. PAHs are formed during incompletecombustion of organic (i.e. carbon-based) material. Observations of the ’RedRectangle’ (HD 44179) nebula by Vijh, Witt, and Gordon (2004) showed blueluminescence at λ < 5000 A. The authors attribute this to fluorescence byPAH molecules with three to four aromatic rings such as anthracene (C14H10)and pyrene (C16H10). However Nayfeh, Habbal and Rao (2005) also suggestthat ultrasmall silicon nanoparticles of 1 nm in diameter could be the source ofemission.
• SNRs - A supernova remnant (SNR) is the remains of a supernova explosion.Massive stars end their lives by imploding, and the outer layers of gas are blownoutwards at velocities up to 15,000 km s−1.
You know what finally happened. ..., I concluded that we had to dis-
tinguish at least two H-R diagrams - one the normal diagram that we had
known well for some time, the other, the globular-cluster diagram.
Walter Baade
6The metallicity or metal abundance measures the amount of elements other than hydrogen orhelium in a star or gas. This is typically expressed for a star as relative to the Sun as [Fe/H] =
log10
(
NFe
NH
)
star
- log10
(
NFe
NH
)
⊙
where NFe and NH are the number of iron and hydrogen atoms per
unit volume respectively.
2.5. ORIGIN OF ASTRONOMICAL RADIATION 59
2.5 Origin of Astronomical Radiation
In the following section the main sources of astronomical radiation will be described.
2.5.1 Gamma rays
kT > 500 keV.Observations of Gamma rays are the most difficult of all multiwavelength de-
tections and accurate identification of their origin is still debatable in some cases.The detection of faint extragalactic sources is difficult because the photons have tobe detected against a high background of cosmic rays7. The angular resolution ofGamma ray telescopes is presently quite low, and optical identification of Gammaray sources (especially when associated with faint optical sources) has proven verydifficult.
However Porter et al. (2009) show for the first time an external galaxy resolved inGamma rays. The Fermi LAT has resolved the Gamma ray emission from the LMC.The LMC is observed with an integration time of 211.7 days with energies between200 MeV and 100 GeV and the Gamma ray signal is dominated by emission fromthe star forming region 30 Doradus. The overall Gamma ray emission does not seemto correlate with the molecular gas distribution but better matches the atomic H Idistribution.
Detections in other wavelengths can help pinpoint the origin of Gamma raysources. For example the Vela and Crab pulsars emit pulsed radiation in both theGamma ray and radio regions with the same periodicity, allowing certain Gammaray source identification. Pulsars can produce Gamma ray emission if material fallsonto their surface and is heated to temperatures of a few 106 K.
Strong Gamma ray sources in our Galaxy include the Galactic plane, and severalnearby pulsars (Figure 1.16 and Figure 3.5). The emission from the plane canbe accounted for by inelastic collisions between high energy cosmic rays, probablyprotons, and the nuclei of atoms and ions in interstellar gas. Such collisions resultin the production of π mesons8 which decay to two 70 MeV Gamma rays.
This decay mechanism probably explains the high energy (>100 MeV) events,whilst at lower energies Bremsstrahlung radiation (see below) could greatly con-tribute (see Longair 1997 for a detailed discussion).
The high X-ray luminosities of AGN strongly suggest that they should also besources of Gamma rays. This is now confirmed by observations. COMPTEL obser-vations suggest the existence of ’MeV quasars’ that may contribute substantially toan MeV ’bump’ in the Gamma ray background9 spectrum. EGRET observationshave discovered bright, variable Gamma ray emission from Blazars. These sources
7Energetic particles travelling close to the speed of light. Primary cosmic rays originate beyondthe Earth’s atmosphere. Secondary cosmic rays are produced when primary cosmic rays collidewith atmospheric atomic nuclei, and are detected as air showers.
8The strong nuclear force binds together protons and neutrons, involving the exchange of short-lived particles called mesons.
9The Gamma ray background is the integrated emission from sources in the Gamma ray regionthat are not resolved. These unresolved sources could be very faint or diffuse or both.
60 CHAPTER 2. OBSERVING THE ELECTROMAGNETIC SPECTRUM
are identified with highly polarized OVVs (Optically Violent Variables) in whichrelativistic beaming is most likely occurring. Even higher energy emission has beendetected from some AGN. Gamma rays exceeding 5 ±1.5 TeV have been detectedfrom Markarian10 421 (a BL Lac object; Krennrich et al. 1997) using the WhippleObservatory’s 10 m telescope in Arizona.
The Gamma ray ultra high energy emission is related to a jet or beamed energyoriginating in a putative SMBH and surrounding accretion disk. Gamma rays areproduced by the beam of relativistic particles which is ejected and collimated bystrong magnetic fields in the inner accretion disk region. The highest energy emissionis seen in such objects when the jets are viewed end-on, which is occurring in Blazarslike Markarian 421.
Whilst Gamma rays are absorbed by our atmosphere, Very-High-Energy (VHE)Gamma rays can be detected from the ground via the secondary radiation theyproduce when they strike components of the Earth’s atmosphere. This radiation isproduced as a brief flash of light that only lasts for a few billionths of a second. Thislight can be detected with large optical light collectors equipped with photomultipliertubes as on the Whipple Observatory 10 m telescope.
Gamma ray astronomy is now heavily focussed on Gamma ray Bursts (GRBs;Fishman 1995; Paczynski 1995). These intense outbursts vary in duration from afew milliseconds to a few tens of seconds. GRBs are now known to be extragalacticin nature and appear to occur in the outskirts of distant galaxies. Gamma RayBursts are discussed in more detail in Section 2.9.4.
2.5.2 X-rays
Hard: 3 keV <kT<500 keV; Soft: 0.1<kT<3 keV.
The Soft X-ray region (0.1<kT<3 keV) can also be subdivided into smaller energyregions (e.g. see the 0.2-1.5 keV CXO observation of the NGC 253 atlas images,beginning page 197). X-rays originate from a variety of physical processes.
First, gas that is hotter than 106 K is fully ionized (i.e. all electrons are dissociatedfrom their atoms). The electrons are accelerated due to proton encounters andradiate energy via the Bremsstrahlung process. This radiation is emitted by hot gasassociated with SNRs and by hot gas that surrounds many elliptical galaxies andgalaxy clusters.
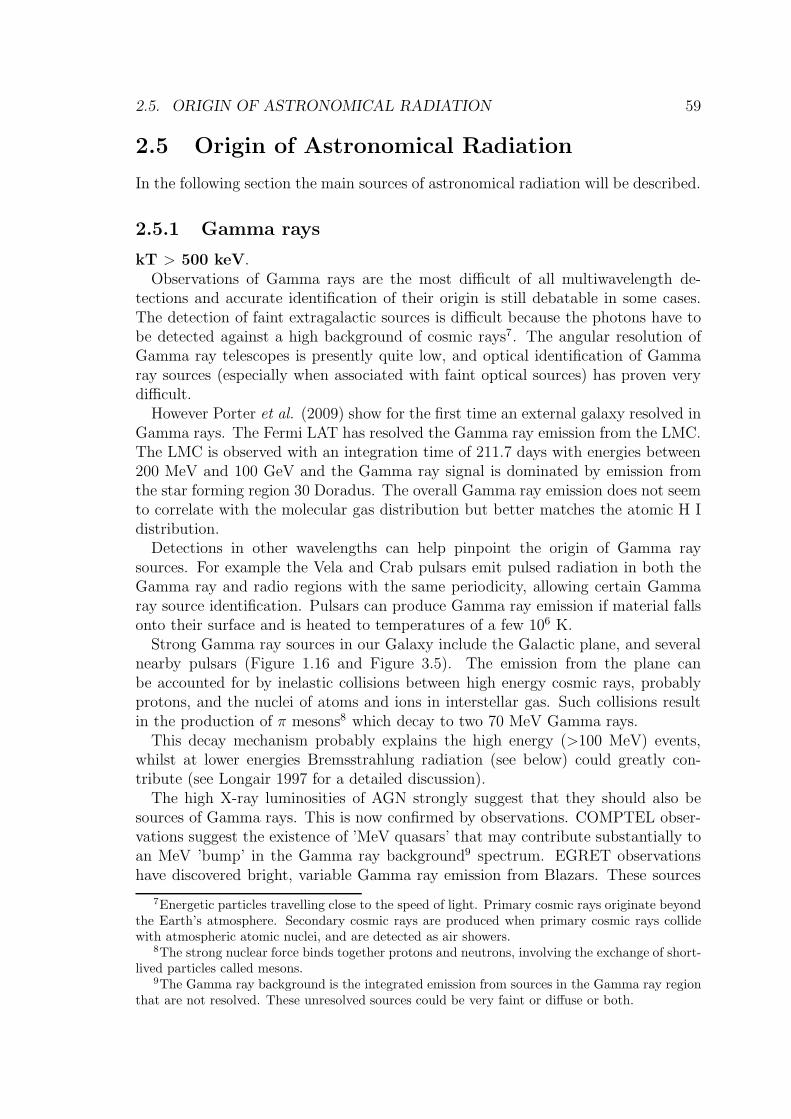
Bremsstrahlung, or Breaking Radiation, (Figure 2.9) occurs when charged parti-cles, typically electrons, are decelerated over a very short distance. At temperatureshigher than 105 K gas consists of positive ions and electrons. In Bremsstrahlung,a continuous spectrum with a characteristic profile and energy cutoff (wavelengthminimum) is produced
I(E, T) = C G(E, T) Z2 ne ni(kT)−1/2 e−E/kT
10Markarian galaxies are galaxies catalogued by the astronomer B.E. Markarian based on theirstrong continuum emission in the UV.
2.5. ORIGIN OF ASTRONOMICAL RADIATION 61
where I(E,T) is the intensity (a function of energy, E and temperature T), C is aconstant, G is the ’Gaunt factor’ (a slowly varying function), Z is the charge of thepositive ion, ne is the electron density, ni is the positive ion density.
This emission is characterized by the temperature of the gas. The higher the tem-perature, the faster the electrons, and the higher the photon energy of the radiation.Bremsstrahlung radiation is also known by astronomers as free-free emission - sincethe electron starts free and ends free.
Figure 2.9: Bremsstrahlung radiation. Credit: XXX.
Second, electrons spiraling in a magnetic field will emit synchrotron radiation.Synchrotron X-ray emission (Figure 1.14) requires very energetic, high velocity elec-trons in strong magnetic fields. An example of this process is found in the SNRCrab Nebula. The intensity is of the form
I(E) = C E−α
where intensity I is only a function of energy, E, C is a constant, and α is thespectral ’index’. Larger values of α correspond to a higher proportion of lowerenergies emitted.
Third, X-ray emission can be blackbody radiation. In this case, an object is calleda ’blackbody’ if its surface re-emits all radiation that it absorbs. The continuumemission radiated is described by only one parameter, the objects temperature. X-ray blackbody radiation is emitted from very hot objects with surface temperatures> 106 K, such as neutron stars. The intensity is given by the Planck law
I(E, T) = 2 E3 [h2c2(eE/kT − 1)]−1
where intensity is a function of energy, E and temperature T, h is Planck’s con-stant, and c is the speed of light.
Observations of the Galaxy and Local Group members suggest that much of thetotal X-ray emission from spiral galaxies originates from discrete sources such asaccreting binaries and SNRs. Diffuse emission has been detected in many spirals andoriginates from hot gas energized by shocks or outflows (e.g. caused by supernovae)in their disks. Hot, 106−7 K, gaseous halos around elliptical galaxies and clusters ofgalaxies were discovered by Einstein. These originate from accumulated ejected gas(mass loss) from the evolved stellar population, as confirmed by the enriched metal
62 CHAPTER 2. OBSERVING THE ELECTROMAGNETIC SPECTRUM
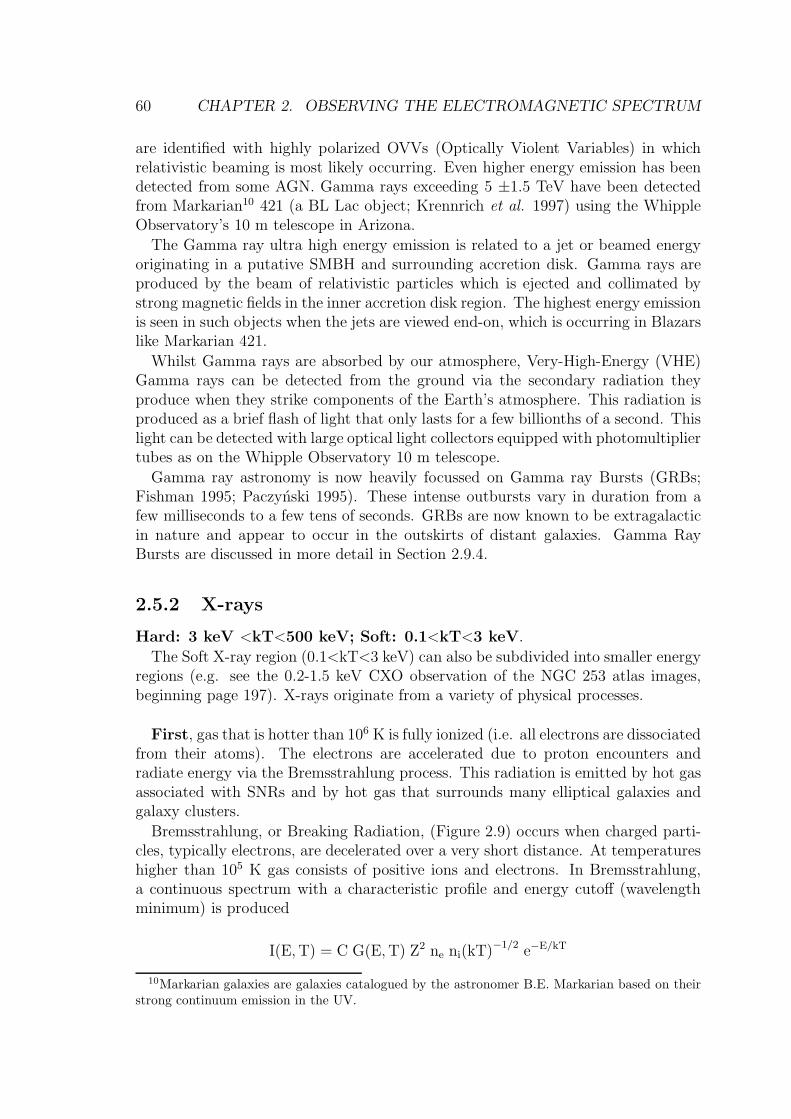
Figure 2.10: CXO X-ray image of the merging galaxies NGC 4038/9. The image is4 ′ on a side. Credit: NASA/SAO/CXC/G. Fabbiano.
content of the gas. Characteristics of elliptical galaxy X-ray emission also suggestan underlying discrete source component, most likely from accreting binaries.
Figure 2.10 shows a CXO image of the central regions of the merging galaxiesNGC 4038/9. The bright point-like sources are binary systems containing eitherneutron stars or black holes which are accreting gas from donor stars. The X-rayemission originates from accretion disks around these degenerate stars. Other moreextended X-ray emission is associated with hot gas energized by numerous supernovaexplosions, stimulated by the merger process.
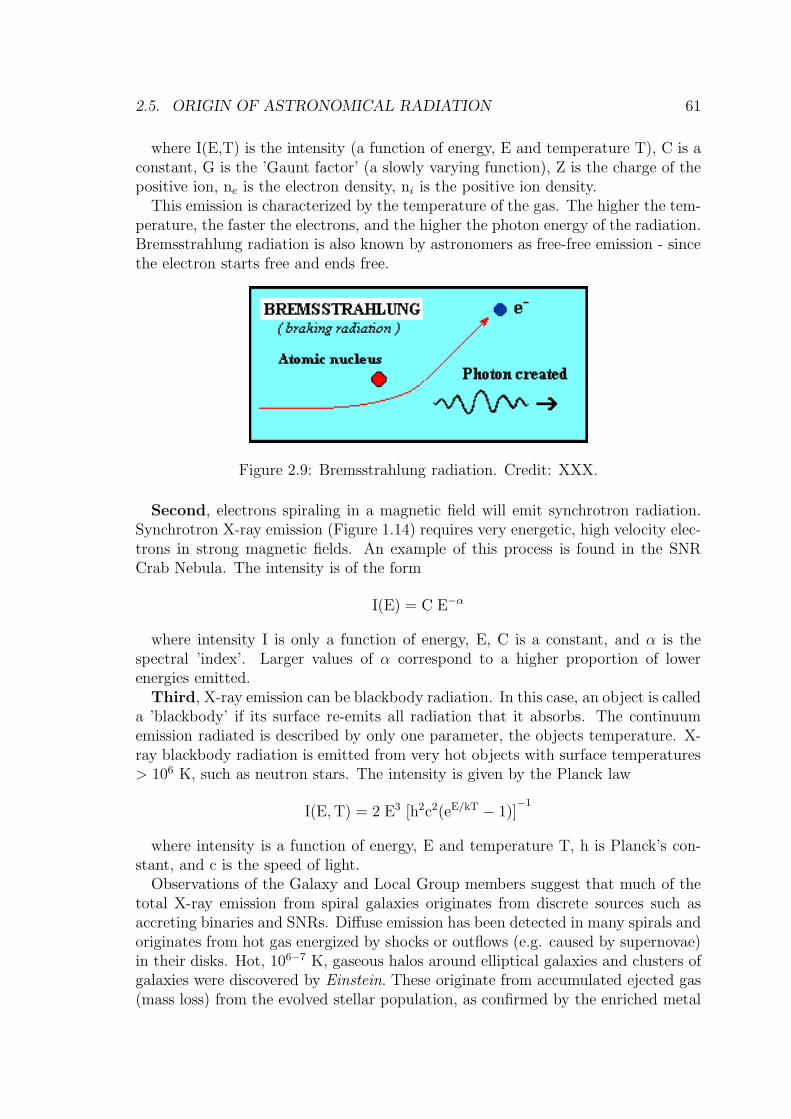
X-ray emission is also very strong in AGN and originates from a variety of sources.A component can be linked with frequently observed beamed radio and Gamma rayemission. X-ray emission with low (<1 keV) energies can be variable on timescalesas short as several hours. This emission probably originates close to the active coreof the AGN, most likely in the inner region of an accretion disk. Higher energy X-rayemission in AGN is caused by inverse Compton scattering (Figure 2.11) which is anexchange of energy between electrons and photons in dense gas although for quasarsthis component is weak or absent.
Figure 2.11: Inverse Compton Scattering. Credit: XXX
2.5. ORIGIN OF ASTRONOMICAL RADIATION 63
An important emission line is seen in many AGN at 6.4 keV due to X-rayfluorescence11 from iron at temperatures of several million K. Photons striking theaccretion disk of the AGN are absorbed by electrons of iron which then de-excite byemitting a photon of energy 6.4 keV. This Fe Kα line is an important diagnostic ofthe kinematics of accretion disk gas near the central black hole. The ASCA satellitemade a deep exposure of the Seyfert 1 galaxy MCG-6-30-15 (Tanaka et al. 1995)showing a broad Fe Kα line that would infer relativistic gas speeds of ∼100,000 kms−1 or 0.3c. The line profile is sometimes asymmetric consistent with relativisticeffects and provides compelling evidence for not only the existence of SMBHs butalso black hole spin (Miller 2007).
2.5.3 Ultraviolet
Extreme (EUV): 100-912A ; Far-UV: 912-2000A ; Mid-UV: 2000-3300A.The EUV region is dominated by emission from (in order of decreasing number
of detections in the 2nd EUVE Source Catalog) late-type stars (F to M spectralclasses), hot white dwarf stars, early-type stars (A, B spectral classes), cataclysmic12
variables and AGN (mainly Seyferts and BL Lacs). EUV observations (i.e. ROSATWFC and EUVE) consist of medium angular resolution surveys that generally detectobjects in the Galaxy.
Based on the soft X-ray properties of some AGNs, many active galaxies werepredicted to be detected in the Ultraviolet. In fact WFC detected 7 AGN (3 wereBlazars) whilst Marshall, Fruscione and Carone (1995) detected 13 AGN (7 Seyferts,5 BL Lacs and 1 quasar) in the EUVE all-sky survey. By searching the EUVE archivefor sources near known extragalactic X-ray sources, Fruscione (1996) finds that 20X-ray galaxies (12 Seyferts, 1 LINER, 6 Blazars, 1 quasar) are strong EUVE sources.High angular resolution EUV imaging of nearby galaxies does not exist.
The Ultraviolet is very rich in spectral lines. These atomic and molecular linesare useful for deriving important astrophysical information. Hot (10,000 - 40,000 K)stars emit a large fraction of their radiation in the Ultraviolet. Imaging studies inthe Far-UV and Mid-UV detect hot stars associated with star forming H II regionsand young star clusters in spiral galaxies. Spectral studies of O VI (doublet at1032A, 1038A) absorption in hot gas clouds by the FUSE satellite (launched onJune 24th, 1999 and operational until October 18th, 2007) has given importantdiagnostic information about the intergalactic medium.
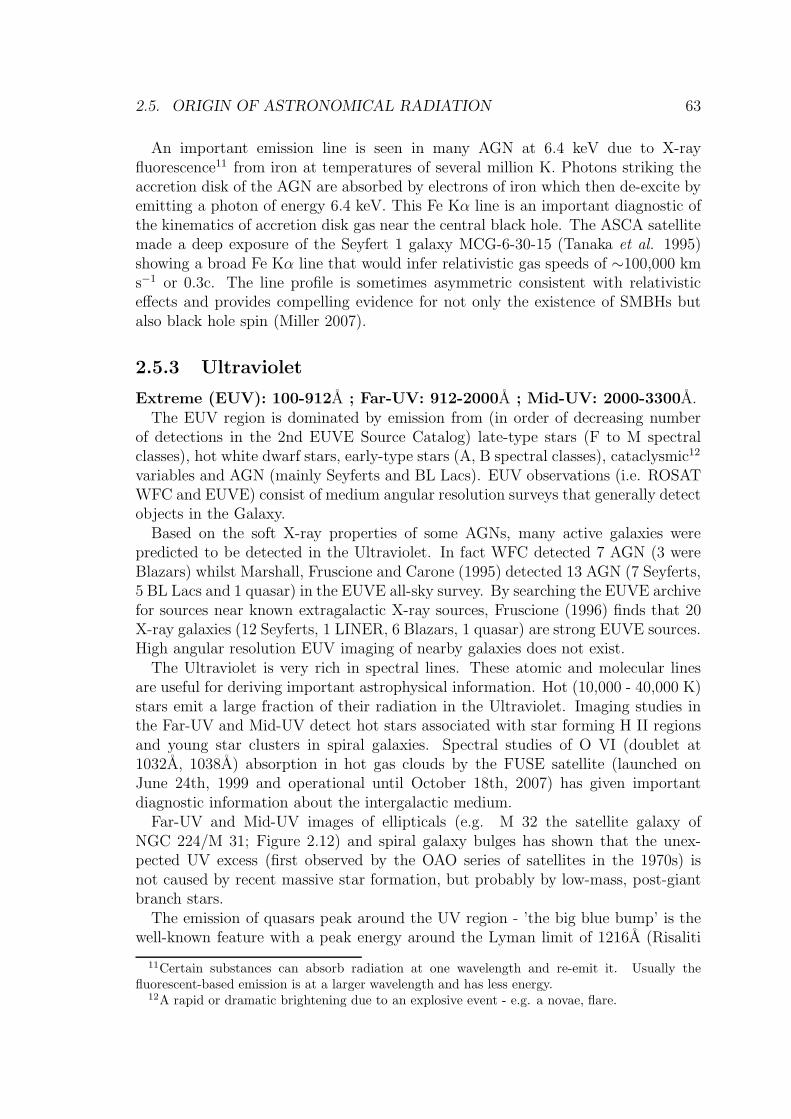
Far-UV and Mid-UV images of ellipticals (e.g. M 32 the satellite galaxy ofNGC 224/M 31; Figure 2.12) and spiral galaxy bulges has shown that the unex-pected UV excess (first observed by the OAO series of satellites in the 1970s) isnot caused by recent massive star formation, but probably by low-mass, post-giantbranch stars.
The emission of quasars peak around the UV region - ’the big blue bump’ is thewell-known feature with a peak energy around the Lyman limit of 1216A (Risaliti
11Certain substances can absorb radiation at one wavelength and re-emit it. Usually thefluorescent-based emission is at a larger wavelength and has less energy.
12A rapid or dramatic brightening due to an explosive event - e.g. a novae, flare.
64 CHAPTER 2. OBSERVING THE ELECTROMAGNETIC SPECTRUM
Figure 2.12: UV image of M 32 by STIS on HST. The nucleus is at lower, right.The UV excess seen in ellipticals and bulges originates in the observed populationof old, but hot, helium-burning stars. Credit: NASA and T. M. Brown, C. W.Bowers, R. A. Kimble, A. V. Sweigart (NASA Goddard Space Flight Center) andH. C. Ferguson (STScI).
and Elvis 2004). This peak is best described by thermal emission from accretiondisk gas displaying a wide range of temperatures.
UV radiation is greatly attenuated by dust grains. These grains are very goodabsorbers of photons which have wavelengths equal to or smaller than the size ofthe grain. Many grains have characteristic sizes of 100 nm or more which meansthat interstellar dust absorbs UV radiation very efficiently.
2.5.4 Optical
3300 to 8000A.In normal galaxies optical emission is dominated by radiation from the photo-
spheres of stars. Stars radiate in a similar fashion to a blackbody, with surfacetemperatures ranging from 3,000 K (M dwarfs) to 40,000 K (O type). Our Sun isa G dwarf type spectral class with a surface temperature of 5,800 K. Peak emissionfrom stars with temperatures of 8,700 K and 3,625 K occurs at the limits of theoptical region, 3300 and 8000A, respectively. Wien’s law for a blackbody allows usto calculate the wavelength of maximum emission
λmax =0.0029 K m
T
where λmax is the wavelength of maximum emission in meters and T is the tem-perature of the object in K. The total amount of energy radiated by a blackbody isgiven by the Stefan-Boltzmann law
F = σ T4
2.5. ORIGIN OF ASTRONOMICAL RADIATION 65
where F is the energy flux in joules m−2 s−1, σ is a constant (5.67 x 10⁻⁸ Wm−2 K−4), and T is the temperature in K. Based on these laws there are two keythings to remember. Firstly, that temperature is inversely related to λmax, hence ifyou double the surface temperature of a star, λmax will halve. Secondly, the sametemperature increase will increase the energy flux by a factor of 24 or 16.
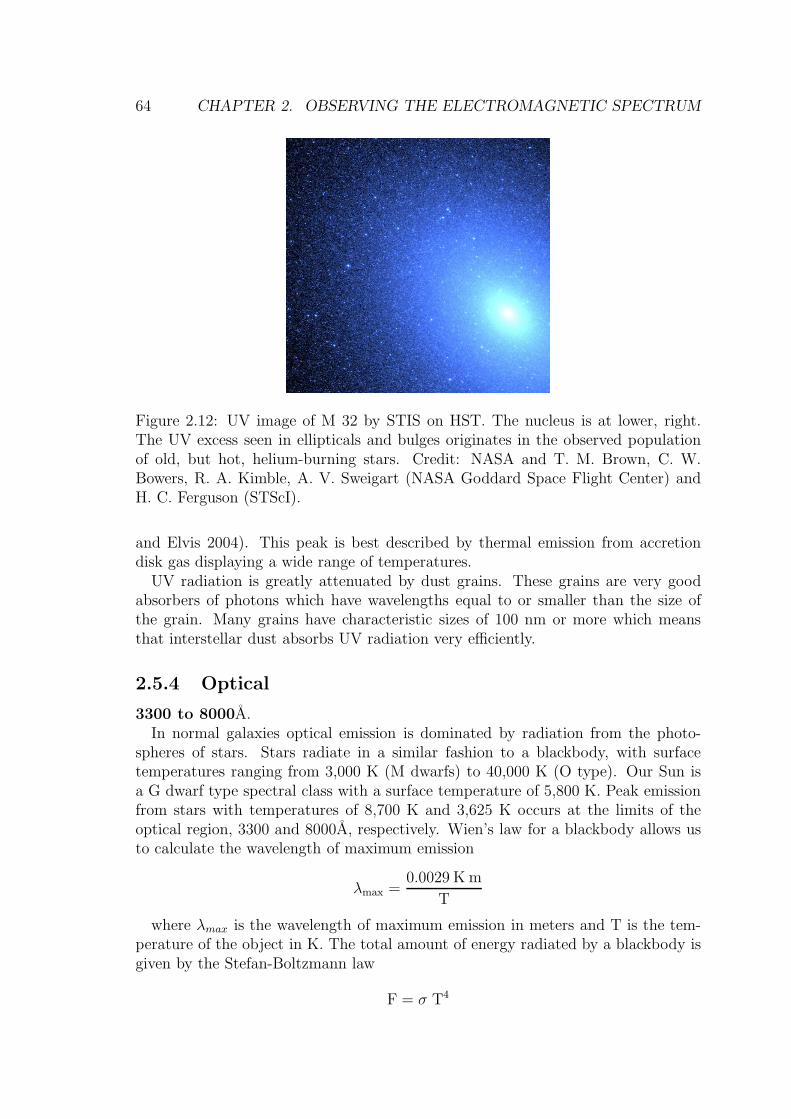
Filters can be used to isolate a narrow range of optical emission. For example,observing a spiral arm, blue light (e.g. using a ’B’ filter with λc ∼4500A) images willpreferentially record radiation from young, hot stars whilst red light (R or I with λc
> 6000A) images will be dominated by radiation from cooler, more evolved stars.Figure 2.13 shows dwarf star spectra (Jacoby, Hunter and Christian 1984) from Oto M spectral types. Notice how the energy maxima increases to longer wavelengthsin the progression from O (hot stars) to M (cooler) types.
300 400 500 600 700
0
2
4
6
8
10
12
14
16
18
20
Wavelength (nm)
Nor
mal
ized
Flu
x (F
λ) +
Con
stan
t
Dwarf Stars (Luminosity Class V)
M5v
M0vK5v
K0v
G4v
G0v
F5v
F0v
A5v
A1v
B5v
B0v
O5v
Figure 2.13: Optical Spectra of Dwarf Stars from Jacoby, Hunter and Christian(1984) showing O to M spectral types. Credit: Supplied by R. Pogge. Figurecourtesy of G. Jacoby/NOAO/AURA/NSF. Reproduced by permission of the AAS.
Radiation from warm, 104 K gas, typically found in and near star forming regions
66 CHAPTER 2. OBSERVING THE ELECTROMAGNETIC SPECTRUM
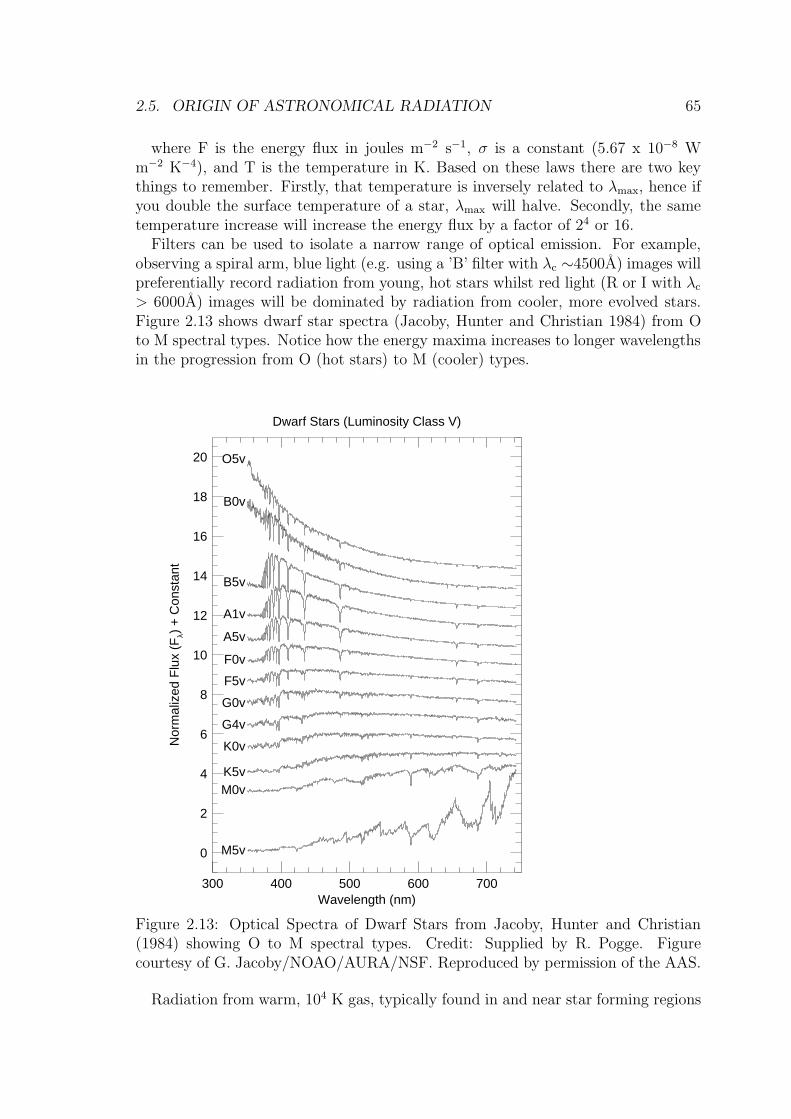
(also called H II regions), can also be detected in the optical region. This element ofthe ISM is usually detected by observing the recombination13 emission line of singlyionized hydrogen (usually denoted by Hα) at 6563A. An example of this emissionin the LMC is shown in Figure 2.14.
Figure 2.14: Hα image of the Large Magellanic Cloud. Credit: C. Smith, S. Points,the MCELS Team and NOAO/AURA/NSF.
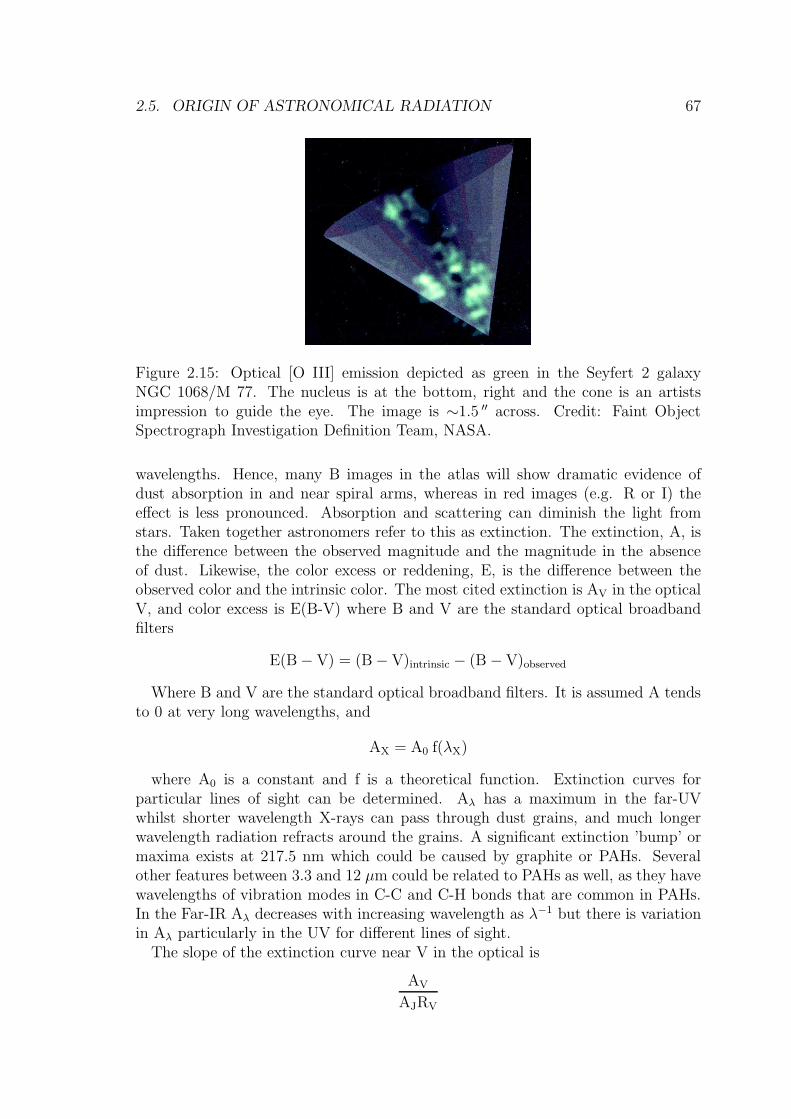
Other important diagnostic lines include the hydrogen Balmer series lines Hβ(4861A) and Hγ (4340A), and He I (5876A) and He II (4686A). Forbidden lines ofions such as the oxygen doublet [O III]14 (4959, 5007A), (Figure 2.15), the nitrogendoublet [N II] (6548, 6583A; surrounding the Hα line), the oxygen doublet [O II](3726, 3729A) and the Sulphur doublet [S II] (6716, 6731A) are also seen. H IIregions are powered by UV radiation from nearby, hot stars. This radiation isabsorbed by the gas and then re-emitted, mainly in the optical and IR regions.
Optical emission can be greatly attenuated by interstellar dust. Light is absorbedand scattered by dust particles or grains, and this attenuation is greater for shorter
13Recombination occurs when an electron is captured by an ion and energy in the form of photonsis emitted corresponding to atomic energy levels.
14[ ] indicate forbidden lines, where the ’III’ notation represents the doubly ionized species;similarly ’II’ is singly ionized, etc.
2.5. ORIGIN OF ASTRONOMICAL RADIATION 67
Figure 2.15: Optical [O III] emission depicted as green in the Seyfert 2 galaxyNGC 1068/M 77. The nucleus is at the bottom, right and the cone is an artistsimpression to guide the eye. The image is ∼1.5 ′′ across. Credit: Faint ObjectSpectrograph Investigation Definition Team, NASA.
wavelengths. Hence, many B images in the atlas will show dramatic evidence ofdust absorption in and near spiral arms, whereas in red images (e.g. R or I) theeffect is less pronounced. Absorption and scattering can diminish the light fromstars. Taken together astronomers refer to this as extinction. The extinction, A, isthe difference between the observed magnitude and the magnitude in the absenceof dust. Likewise, the color excess or reddening, E, is the difference between theobserved color and the intrinsic color. The most cited extinction is AV in the opticalV, and color excess is E(B-V) where B and V are the standard optical broadbandfilters
E(B − V) = (B − V)intrinsic − (B − V)observed
Where B and V are the standard optical broadband filters. It is assumed A tendsto 0 at very long wavelengths, and
AX = A0 f(λX)
where A0 is a constant and f is a theoretical function. Extinction curves forparticular lines of sight can be determined. Aλ has a maximum in the far-UVwhilst shorter wavelength X-rays can pass through dust grains, and much longerwavelength radiation refracts around the grains. A significant extinction ’bump’ ormaxima exists at 217.5 nm which could be caused by graphite or PAHs. Severalother features between 3.3 and 12 µm could be related to PAHs as well, as they havewavelengths of vibration modes in C-C and C-H bonds that are common in PAHs.In the Far-IR Aλ decreases with increasing wavelength as λ−1 but there is variationin Aλ particularly in the UV for different lines of sight.
The slope of the extinction curve near V in the optical is
AV
AJRV
68 CHAPTER 2. OBSERVING THE ELECTROMAGNETIC SPECTRUM
where
RV =AV
E(B − V)
Traditionally RV has been taken to be 3.1 but it can range from ∼3 (steeply in-creasing extinction into the UV) to ∼5 (slowly increasing extinction into the UV).E(B-V) is not surprisingly found to be proportional to the column density of inter-stellar hydrogen, NH, since dust and cold gas seem to co-exist in many environments.
E(B − V) =NH
5.8 x 1025 m−2
In general
E(B − V) ∼ 0.53 (d/kpc) and AV ∼ 1.6 (d/kpc)
for a line of sight of length, d, in kpc.Optical emission from AGN can be dominated by emission from their nuclei (Fig-
ure 2.15). The discovery of Seyfert galaxies was notable due to their extremelybright optical nuclei that made them resemble bright stars. Many AGN have verystrong optical emission lines originating in gas clouds. Diagnostic information de-rived from AGN emission lines provide information about the origin and excitationof such lines via starburst or non-thermal processes. For example, ratios of linestrengths (i.e. [O I]/Hα vs. [O III]/Hβ) help discriminate the origins of emissionlines between H II regions powered by UV radiation from hot, young stars and var-ious shock-front, high energy excitation processes such as supernovae, jets or gascloud-gas cloud collisions.
In many AGN both the emission lines and integrated stellar emission are swampedby much stronger synchrotron emission that increases its dominance on the totalenergy output as it progresses to longer wavelengths.
2.5.5 Infrared
Near-IR: 0.8-7 µm; Mid-IR: 7-25 µm; Far-IR: 25-300 µm.Near-IR radiation can originate from stellar (i.e. cooler K and M type star)
sources as well as being re-processed by dust. Mid-IR and Far-IR emission can bedominated by radiation from interstellar dust grains such as carbon, hydrocarbons,silicates, Polycyclic Aromatic Hydrocarbons (PAHs) heated by nearby stars. TheIRAS wavebands in the Mid-IR (12 µm and 25 µm) detect radiation which is domi-nated by non-thermal emission from small grains. The exact origin of this emissionis still uncertain, however it may be a mixture of warm (∼50 K) dust associatedwith star forming regions, and cool (∼20 K) dust associated with regions rich inatomic hydrogen, H I. The uncertainties are compounded by the unknown natureof the dust grain size and composition. Infrared ’cirrus’ is faint, wispy cloud-likeemission (first discovered in IRAS images) seen above and below the plane of theGalaxy. This is believed to be emission from dust clouds associated with nearby HI clouds.
2.5. ORIGIN OF ASTRONOMICAL RADIATION 69
Strong IR emission is detected in starburst galaxies, interacting or merging galax-ies and AGN. IR observations are particularly important in terms of determiningthe source of emitted radiation. The IR emission can be used to probe dusty areassuch as the inner regions of AGN, as well as regions of high star formation (e.g. instarbursts and mergers) that are not visible or heavily obscured in the optical.
Hydrogen recombination lines, especially Brα (4.05 µm) and Brγ (2.17 µm) ofthe Brackett series, and Pα (1.88 µm) of the Paschen series are frequently observed.Other Near-IR features include [Fe II] (1.64 µm), H2
15(J=1→0) (2.12 µm), H2
(J=2→1) (2.25 µm) and CO (2.34 µm).
2.5.6 Submillimeter
300 µm -1mm.
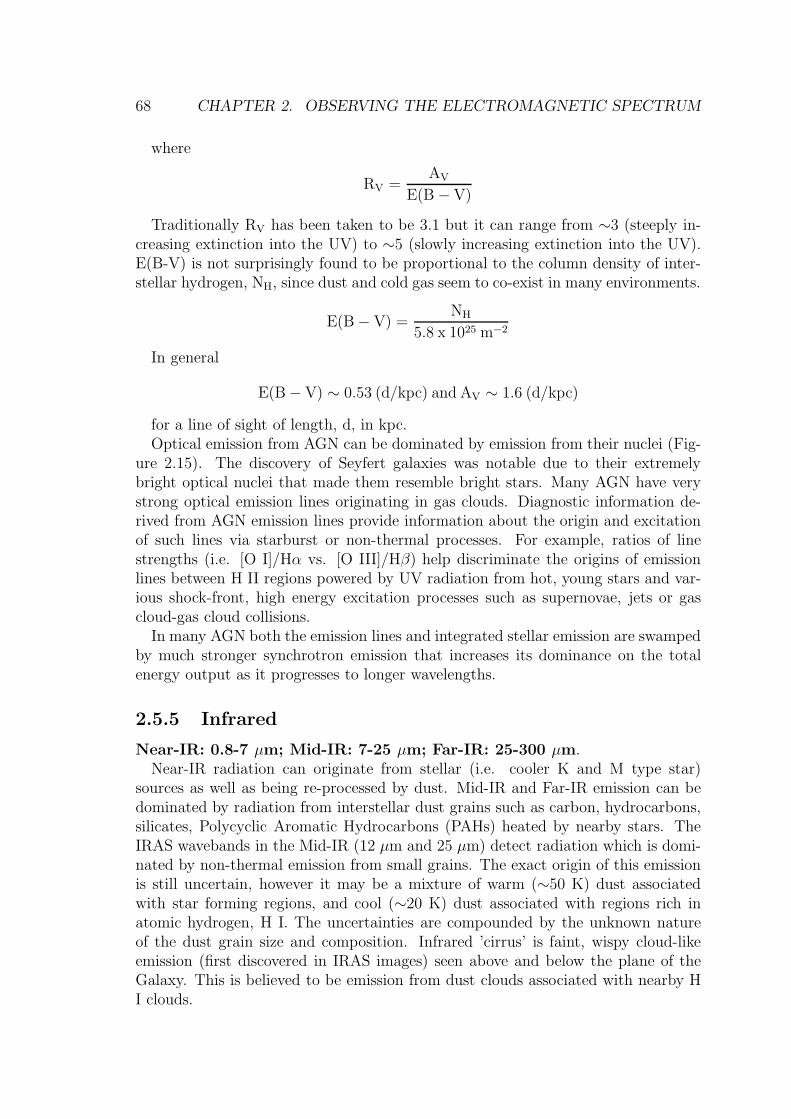
Dust dominates the source of emission in the submillimeter region. Observationsin this wavelength region have recently opened up due to innovations in instrumentsand detectors. Figure 2.16 shows an 850 µm image (Tilanus, van der Werf andIsrael 2000) of the Whirlpool galaxy, Messier 51. Spiral arm structure is clearly seenindicating the position of dusty star forming regions.
Figure 2.16: SCUBA image at 850 µm of the Whirlpool galaxy, NGC 5194 orMessier 51. NGC 5195 is seen to the north. Credit: JCMT/SCUBA. Image courtesyof R. Tilanus (JAC).
Submillimeter observations of distant starburst galaxies and AGN are very im-portant. As discussed more fully in Section 2.7, emission detected at a particularwavelength from distant galaxies originates at shorter wavelengths at the source dueto cosmological expansion. Hence submillimeter observations of distant galaxies candetect source emission in the IR. For example detection at 850 µm of a galaxy witha redshift z = 2.4 will sample emitted radiation at 250 µm, or from the Far-IR.
15Molecules move in space, at various speeds and directions. The energy and orientation ofa molecule’s tumbling motion is described as a rotational state, and these states are quantized.A molecule can spontaneously drop from its current energy state to the next lower one (i.e. atransition), converting the energy into a photon. The symbol (J=1→0) and others like it denotethe particular energy level transition.
70 CHAPTER 2. OBSERVING THE ELECTROMAGNETIC SPECTRUM
2.5.7 Radio
1mm and longer wavelengths.Radio recombination16 lines of hydrogen such as H41α (92 GHz, 0.33cm), H29α
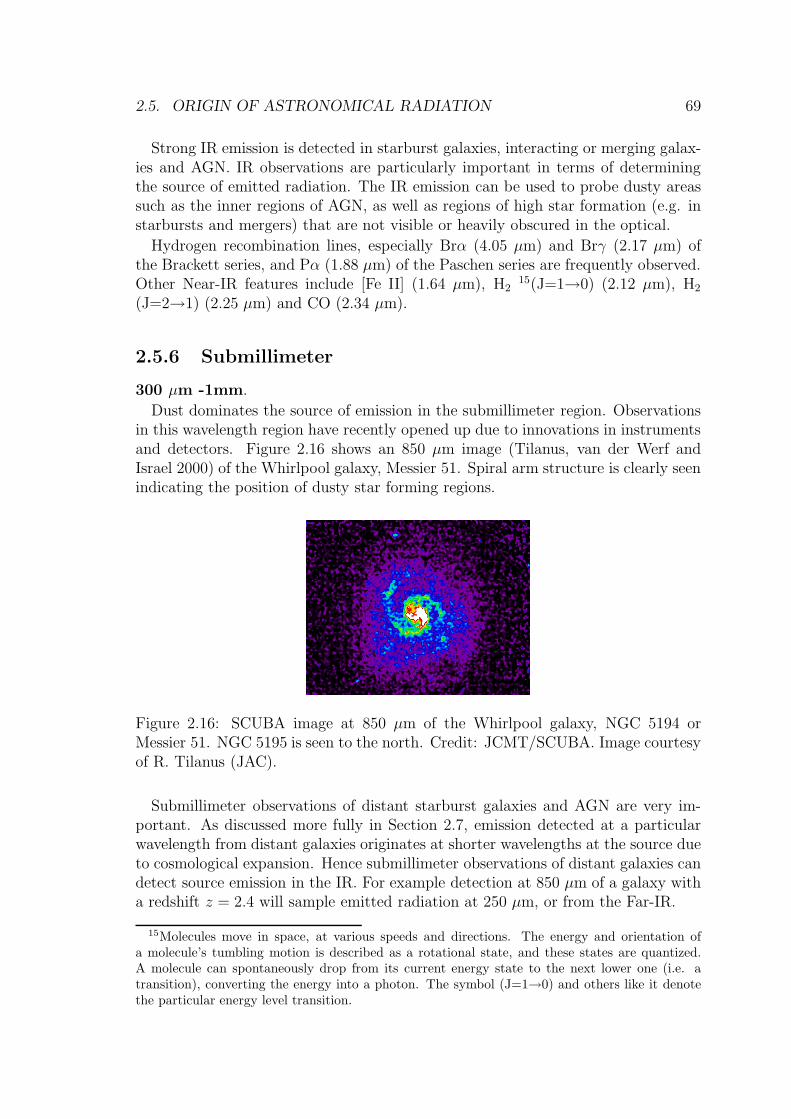
(256.3 GHz, 0.11cm), H27α (316.4 GHz) and H26α (354.5 GHz) are importantdiagnostics of ionized gas conditions such as temperatures and electron densities.Figure 2.17 shows continuum emission at 92.0 GHz near the hydrogen recombinationline of H41α in the starburst galaxy, NGC 3034/M 82.
Figure 2.17: OVRO image at 92.0 GHz of NGC 3034/M 82. Credit: OVRO. Imagecourtesy of E. Seaquist.
The measurement of CO is believed to directly indicate the mass of Giant Molecu-lar Clouds (GMCs) and can be used to estimate the amount of molecular hydrogen,H2 (that is mostly cold, 10-20 K and hence not directly observable - the 2.12 µm lineis from warm H2). Whilst the 2.6 mm CO (J=1→0) transition is most commonlyobserved, other lines such as 1.3 mm CO (J=2→1) and 0.88 mm CO (J=3→2) arestudied as well. The Galactic factor, α, for the conversion between CO flux and H2
column density17
α =NH2
SCOcm−2 K−1 km−1s
is given by (Omont 2007) as
α = (1.8 ± 0.3) × 1020 cm−2 (K km s−1)−1
16Radio recombination lines occur via transitions of electrons between two energy states withvery high quantum number n. These lines are named after the atom, the destination quantumnumber and the difference in n of the transition (α for δn = 1, β for δn = 2, etc.). An example isH41α (transition from n = 42 to n = 41 in hydrogen).
17Column densities indicate the areal density of a given species, usually quoted in atoms cm−2.Nn is the line integrated density of atoms in the nth state. Therefore NH2
is the column density ofmolecular hydrogen.
2.5. ORIGIN OF ASTRONOMICAL RADIATION 71
for large molecular clouds away (|b| > 5◦) from the Galactic plane and the molecularmass Mmol and CO flux SCO are related by
Mmol = 1.61 × 10⁴ D2Mpc SCO M⊙
Theoretical studies suggest that α could be a strong function of metallicity, densityand excitation temperature.
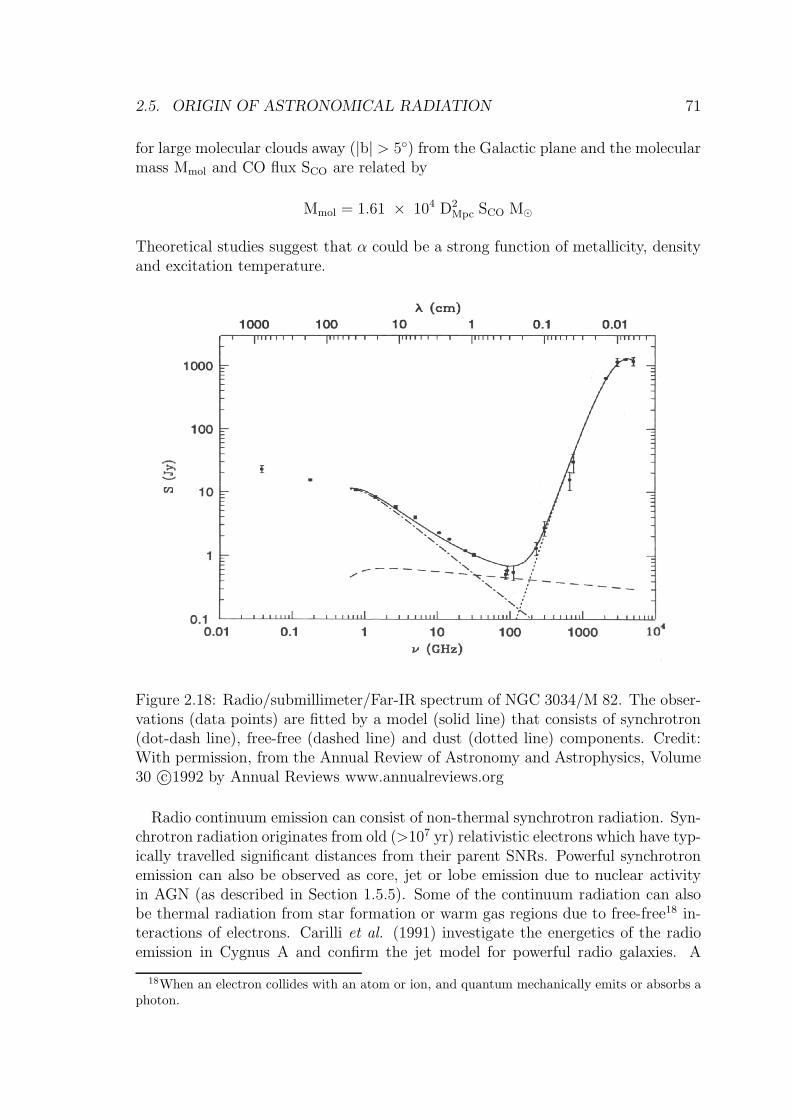
Figure 2.18: Radio/submillimeter/Far-IR spectrum of NGC 3034/M 82. The obser-vations (data points) are fitted by a model (solid line) that consists of synchrotron(dot-dash line), free-free (dashed line) and dust (dotted line) components. Credit:With permission, from the Annual Review of Astronomy and Astrophysics, Volume30 c©1992 by Annual Reviews www.annualreviews.org
Radio continuum emission can consist of non-thermal synchrotron radiation. Syn-chrotron radiation originates from old (>107 yr) relativistic electrons which have typ-ically travelled significant distances from their parent SNRs. Powerful synchrotronemission can also be observed as core, jet or lobe emission due to nuclear activityin AGN (as described in Section 1.5.5). Some of the continuum radiation can alsobe thermal radiation from star formation or warm gas regions due to free-free18 in-teractions of electrons. Carilli et al. (1991) investigate the energetics of the radioemission in Cygnus A and confirm the jet model for powerful radio galaxies. A
18When an electron collides with an atom or ion, and quantum mechanically emits or absorbs aphoton.
72 CHAPTER 2. OBSERVING THE ELECTROMAGNETIC SPECTRUM
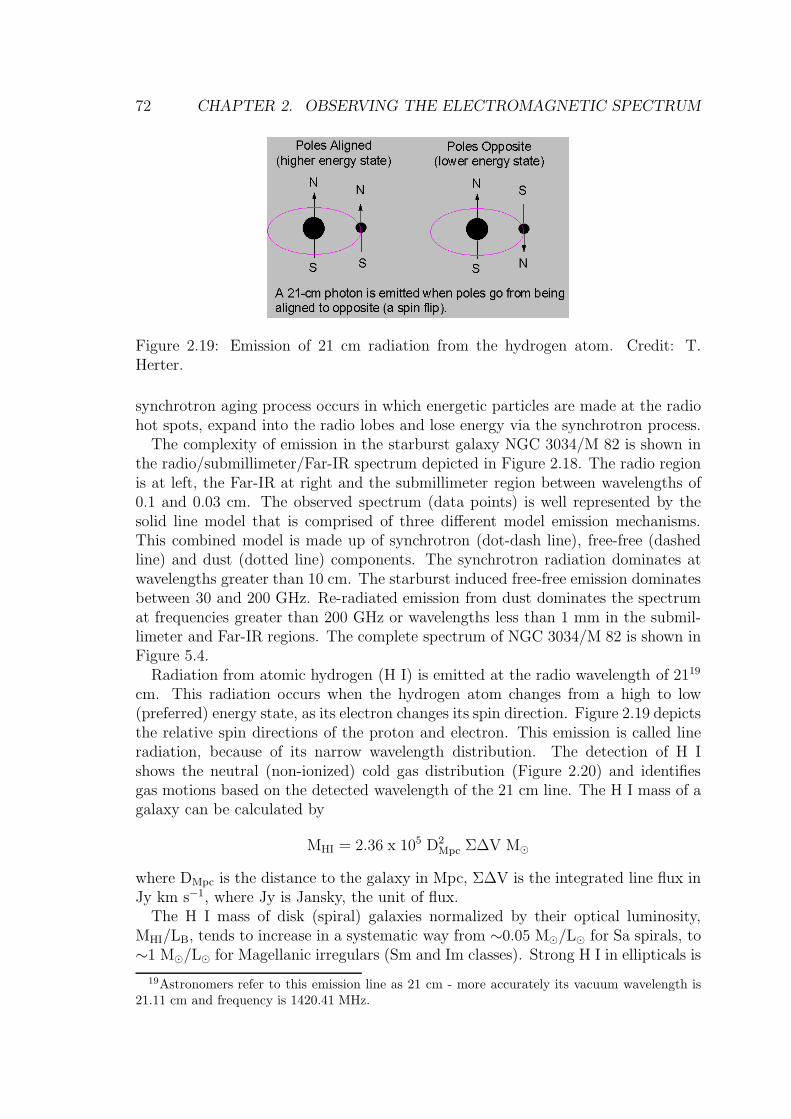
Figure 2.19: Emission of 21 cm radiation from the hydrogen atom. Credit: T.Herter.
synchrotron aging process occurs in which energetic particles are made at the radiohot spots, expand into the radio lobes and lose energy via the synchrotron process.
The complexity of emission in the starburst galaxy NGC 3034/M 82 is shown inthe radio/submillimeter/Far-IR spectrum depicted in Figure 2.18. The radio regionis at left, the Far-IR at right and the submillimeter region between wavelengths of0.1 and 0.03 cm. The observed spectrum (data points) is well represented by thesolid line model that is comprised of three different model emission mechanisms.This combined model is made up of synchrotron (dot-dash line), free-free (dashedline) and dust (dotted line) components. The synchrotron radiation dominates atwavelengths greater than 10 cm. The starburst induced free-free emission dominatesbetween 30 and 200 GHz. Re-radiated emission from dust dominates the spectrumat frequencies greater than 200 GHz or wavelengths less than 1 mm in the submil-limeter and Far-IR regions. The complete spectrum of NGC 3034/M 82 is shown inFigure 5.4.
Radiation from atomic hydrogen (H I) is emitted at the radio wavelength of 2119
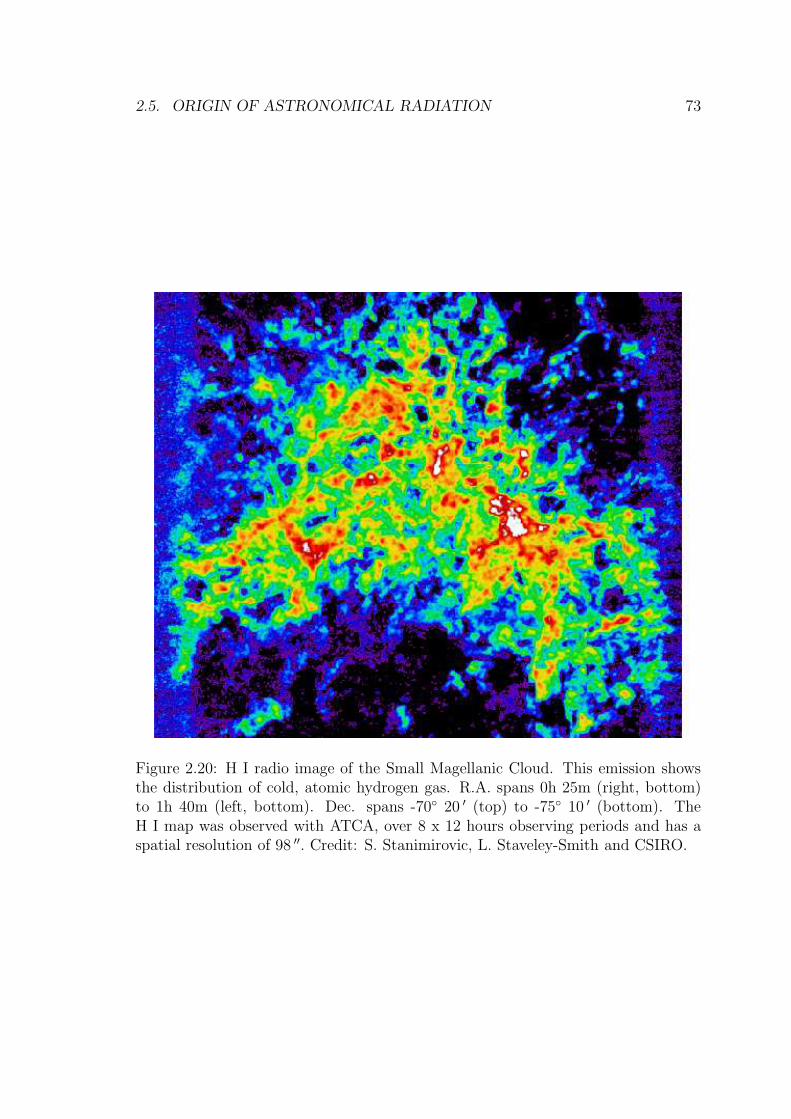
cm. This radiation occurs when the hydrogen atom changes from a high to low(preferred) energy state, as its electron changes its spin direction. Figure 2.19 depictsthe relative spin directions of the proton and electron. This emission is called lineradiation, because of its narrow wavelength distribution. The detection of H Ishows the neutral (non-ionized) cold gas distribution (Figure 2.20) and identifiesgas motions based on the detected wavelength of the 21 cm line. The H I mass of agalaxy can be calculated by
MHI = 2.36 x 10⁵ D2Mpc Σ∆V M⊙
where DMpc is the distance to the galaxy in Mpc, Σ∆V is the integrated line flux inJy km s−1, where Jy is Jansky, the unit of flux.
The H I mass of disk (spiral) galaxies normalized by their optical luminosity,MHI/LB, tends to increase in a systematic way from ∼0.05 M⊙/L⊙ for Sa spirals, to∼1 M⊙/L⊙ for Magellanic irregulars (Sm and Im classes). Strong H I in ellipticals is
19Astronomers refer to this emission line as 21 cm - more accurately its vacuum wavelength is21.11 cm and frequency is 1420.41 MHz.
2.5. ORIGIN OF ASTRONOMICAL RADIATION 73
Figure 2.20: H I radio image of the Small Magellanic Cloud. This emission showsthe distribution of cold, atomic hydrogen gas. R.A. spans 0h 25m (right, bottom)to 1h 40m (left, bottom). Dec. spans -70◦ 20 ′ (top) to -75◦ 10 ′ (bottom). TheH I map was observed with ATCA, over 8 x 12 hours observing periods and has aspatial resolution of 98 ′′. Credit: S. Stanimirovic, L. Staveley-Smith and CSIRO.
74 CHAPTER 2. OBSERVING THE ELECTROMAGNETIC SPECTRUM
not common, though H I detections suggest that such cold gas may originate fromgas rich galaxies that have merged with the elliptical.
2.6 Caveat #1: Mass versus Light and Dark Mat-
ter
I think many people initially wished that you didn’t need dark matter.
It was not a concept that people embraced enthusiastically. But I think that
the observations were undeniable enough so that most people just unenthu-
siastically adopted it.
Vera Rubin
This atlas shows images which depict various types of radiation originating inor near galaxies. However, when considering the total amount of matter in theseobjects, observations only directly detect radiation from a small fraction of the totalmass of each galaxy. Measurements of the velocities of gas (e.g. neutral hydrogen) asa function of radius in spirals, and the detection of hot, 107 K, gas around ellipticals,imply that dynamically inferred galaxy masses are a factor of ∼5 or greater thanthe masses deduced from the combined luminosities of the stars and gas. In fact theatlas galaxy NGC 2915 (page 146) has a dark matter content probably a factor of50 greater than its luminous matter, suggesting that dark matter makes up ∼98%of the total galaxy mass.
In a sense observations only detect the tip of each galactic ’iceberg’, with themajority of the mass of each galaxy remaining unseen. The first quantitative study ofthis unseen matter was carried out early in the 20th century (Oort 1932) by observingthe vertical motions of stars in our Galaxy. The local mass density near the Sunwas initially determined to be ∼0.15 M⊙ pc−3, with dark matter representing 40%of the total local mass, although by the 1980s this was shown to be an overestimate.
Early observations of the Andromeda galaxy also showed discrepancies betweendynamical and luminosity based masses. The rotation curve of NGC 224/M 31(Babcock 1939) implied a global mass-to-light ratio (M/L) of ∼14 (corrected forthe present day distance to NGC 224/M 31), which was a factor of 10 higher thanthat implied at the nucleus. The discrepancies were even larger in the case of galaxyclusters. Observations of clusters showed individual galaxies with much larger radialvelocities than could be accounted for assuming a gravitationally bound cluster.Smith (Virgo cluster; Smith 1936) and Zwicky (Coma cluster; Zwicky 1937) detecteda large mass discrepancy in these nearby clusters. In a landmark study of diskgalaxies (Freeman 1970) Ken Freeman commented on the rotation curves of M 33and NGC 300 and noted that they did not show an expected Keplerian velocitydecline20 their optical radii:
20If the total mass converges at some radii, the rotation curve would behave as V ∝ 1
r, in which
velocities at large r would eventually decline.
2.6. CAVEAT #1: MASS VERSUS LIGHT AND DARK MATTER 75
For NGC 300 and M 33 ... there must be in these galaxies additional
matter which is undetected, ... Its mass must be at least as large as the
mass of the detected galaxy, and its distribution must be quite different from
the exponential distribution which holds for the optical galaxy.
Ken Freeman
Freeman had re-kindled the question of dark matter, this time though in galaxies,and was also the first to speculate on its structure. In the mid-1970s Rubin andcolleagues observed rotation curves of spirals that were flat or even rising to largeradii that finally brought the problem to wide attention.
Theoretical models suggest large, massive dark matter halos exist around most ifnot all galaxies. The size of the halos may be very large. For example, whilst thedistance between the Galaxy and NGC 224/M 31 is ∼700 kpc and if the luminousdiameters of both galaxies are ∼40-50 kpc, (but see below) a large fraction of theintervening distance could be taken up with their individual dark matter halos. Thedark halos may even overlap.
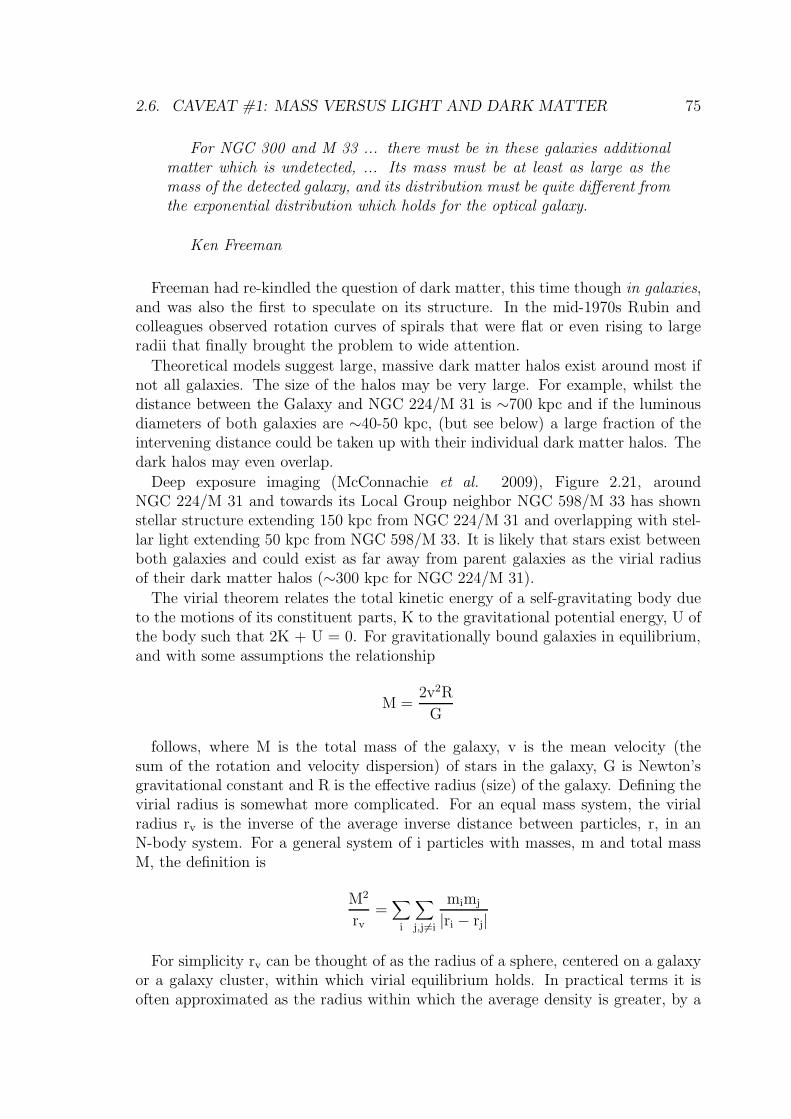
Deep exposure imaging (McConnachie et al. 2009), Figure 2.21, aroundNGC 224/M 31 and towards its Local Group neighbor NGC 598/M 33 has shownstellar structure extending 150 kpc from NGC 224/M 31 and overlapping with stel-lar light extending 50 kpc from NGC 598/M 33. It is likely that stars exist betweenboth galaxies and could exist as far away from parent galaxies as the virial radiusof their dark matter halos (∼300 kpc for NGC 224/M 31).
The virial theorem relates the total kinetic energy of a self-gravitating body dueto the motions of its constituent parts, K to the gravitational potential energy, U ofthe body such that 2K + U = 0. For gravitationally bound galaxies in equilibrium,and with some assumptions the relationship
M =2v2R
G
follows, where M is the total mass of the galaxy, v is the mean velocity (thesum of the rotation and velocity dispersion) of stars in the galaxy, G is Newton’sgravitational constant and R is the effective radius (size) of the galaxy. Defining thevirial radius is somewhat more complicated. For an equal mass system, the virialradius rv is the inverse of the average inverse distance between particles, r, in anN-body system. For a general system of i particles with masses, m and total massM, the definition is
M2
rv
=∑
i
∑
j,j 6=i
mimj
|ri − rj|
For simplicity rv can be thought of as the radius of a sphere, centered on a galaxyor a galaxy cluster, within which virial equilibrium holds. In practical terms it isoften approximated as the radius within which the average density is greater, by a
76 CHAPTER 2. OBSERVING THE ELECTROMAGNETIC SPECTRUM
Figure 2.21: Stellar density map of the Andromeda-Triangulum region. A projectionof the stellar density distribution with scale images of the disks of NGC 224/M 31(top, right) and NGC 598/M 33 (bottom, left) overlaid. Credit: A. McConnachie.The small images of M 31 and M 33 courtesy T. A. Rector, B. A. Wolpa and M.Hanna (NRAO/AUI/NSF and NOAO/AURA/NSF). Reprinted by permission fromMacmillan Publishers Ltd: Nature, vol. 461, p. 66., copyright (2009).
specified factor, than the critical21 density
ρcrit =3H2
0
8πG
where H022 is the Hubble constant. A common choice for the (over) density factor
to describe rv is 200 (early simulations suggested that the radius at a density factorof 178 is close to rv) in which case rv is approximated as r200.
The extended stellar distributions comprise both individual stars lost from eachsystem during previous nearby interactions and the destroyed remnants of dwarfgalaxies due to the tidal field of each galaxy. These observational signatures are
21The mass density below which the universe is open (positive space curvature), and abovewhich the universe is closed (negative space density) is the critical density. It is approximatelyρcrit = 1.0 x 10⁻²⁶ kg m−3.
22The linear relationship between a galaxy redshift and its distance, is commonly specified asH0 = 100h km s−1 Mpc−1, the Hubble constant. The dimensionless quantity h, until recently wastaken to be between 0.5 and 1.0, but now appears to be close to 0.72.
2.7. CAVEAT #2: LOOKING BACK TO THE BEGINNING 77
consistent with galaxy growth inside dark matter halos that grow via accretion andmergers events.
Candidates for the origin of dark matter, both of baryonic23 (e.g. black holes,brown dwarfs and white dwarfs) and non-baryonic (e.g. neutrinos with mass) forms,are numerous. Current models of dark matter and computer simulations of large-scale structure compared to observed structure suggest that the majority of darkmatter is ’cold’. Cold Dark Matter (CDM) would comprise slow moving, massiveparticles. In comparison Hot Dark Matter (HDM) would consist of fast moving, lightparticles. Experiments suggest that neutrinos could have mass and could thereforebe a candidate for HDM, but are probably not massive enough to be a dominant partof dark matter. Primack (2009) presents an overview of dark matter in relation togalaxy formation in the context of the ΛCDM ’Double Dark’ standard cosmologicalmodel. ’Darkness’ appears to rule the universe. CDM plus ’dark energy’ (denotedby Λ; the unknown force or property of the vacuum driving the acceleration of theuniverse) make up 95% of the cosmic density. The search for the origin of darkmatter continues.
2.7 Caveat #2: Looking Back to the Beginning
Detecting galaxies at cosmologically large distances introduces several observationalbiases.
Firstly, because of the expansion of the universe and the Doppler effect theiremitted radiation is detected at longer, redshifted24 wavelengths. For example, theoptical Hα emission line (emitted at λ = 6563A, in the rest-frame) in a galaxy atredshift z = 1 will be detected by a telescope at λ = (1 + z) × 6563A = 13,126A(1.3126 µm in the Near-IR).
Sources observed at different redshifts are sampled at different rest-frame wave-lengths. Photometry is performed with a fixed bandpass filter, so the effective widthof the bandpass will change with different source redshifts. The correction for thiseffect, which transforms a measurement of a source at a redshift z, into a standardmeasurement at redshift zero or the rest-frame, is called the ’K correction’. It isdependent on galaxy type and redshift.
For a source observed with an apparent magnitude mY, through the photometricbandpass Y, which has an absolute magnitude MC in an emitted frame bandpass C,the K correction KCY(z) is defined by
mY = MC + DM + KCY(z)
where DM is the distance modulus of the source, defined as
DM = 5 log10
D
10 pc
23A massive elementary particle made up of three quarks. Neutrons and protons are baryons.24The vast majority of galaxies are redshifted. A few, nearby galaxies such as NGC 224/M 31,
that are influenced by local gravitational fields, are approaching us, and their radiation isblueshifted to smaller wavelengths.
78 CHAPTER 2. OBSERVING THE ELECTROMAGNETIC SPECTRUM
and D is the source distance in pc. For galaxies that can be described by a powerlaw
Fν ∝ ν−α
where α is the power-law index and F is the specific flux then
KCY(z) = 2.5 (α − 1) log10(1 + z)
Secondly, at very large distances the inverse-square law of radiation propagationfails as the radiation surface area is no longer described by a wavefront on a normalsphere surface. A consequence of this is that the surface brightness of an extended,distant object is redshift dependent and scales as (1+z)−4. This is known as cosmo-logical or Tolman dimming. The large exponent ensures this effect is quite drasticeven at z ∼ 2 when the cosmological dimming factor of surface brightness is 81.
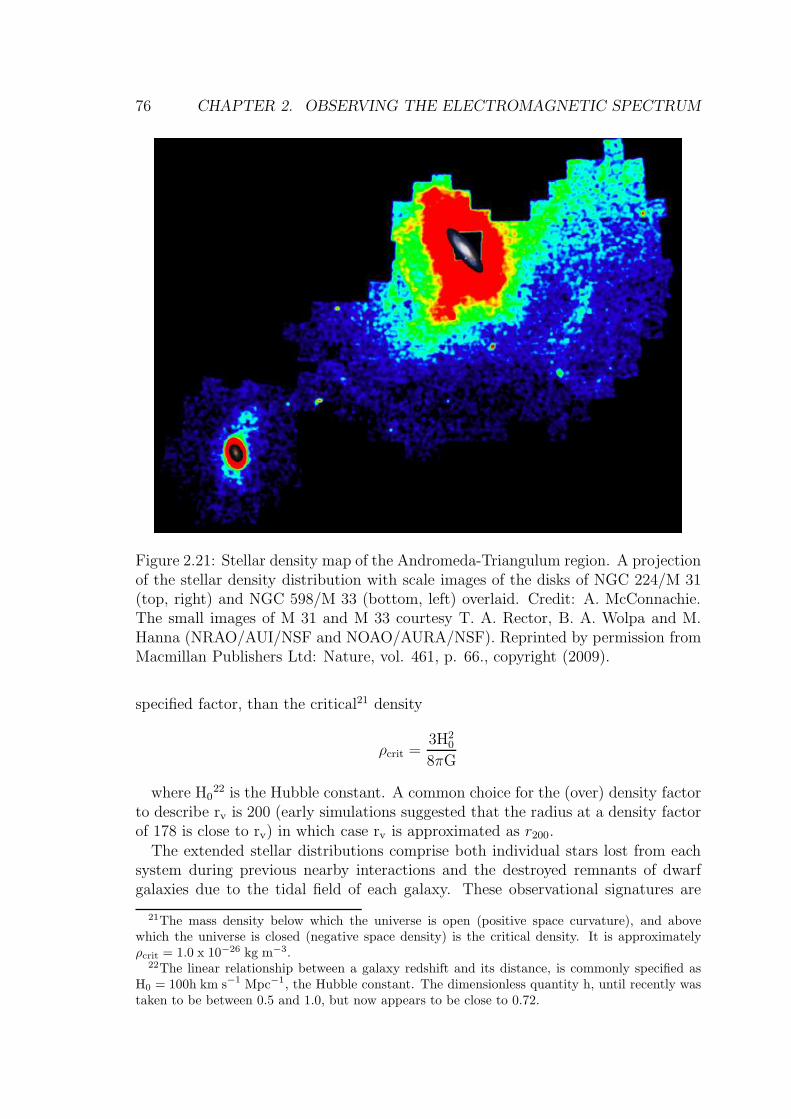
Figure 2.22: JCMT SCUBA 850 µm image of the Hubble Deep Field - North. Theradius of the field is 100 ′′. The field is centered at 12h 36m 51.2s, +62◦ 12 ′ 52.5 ′′
J2000. Five sources have been identified with galaxies. Data from Hughes et al.
(1998). Credit: Reprinted by permission from Macmillan Publishers Ltd: Nature,vol. 394, p. 241., copyright (1998).
Thirdly, there is an age or evolutionary effect. Due to the substantial light traveltimes to distant galaxies their radiation is detected when they were at much youngerages. Stellar populations evolve, thus as more and more distant galaxies are detected,the radiation from successively younger and younger populations are recorded.
A long exposure image by HST WFPC2 in the constellation of Ursa Major isknown as Hubble Deep Field-North (HDF-N). Four filters (F300W, F450W, F606W,and F814W), spanning the Mid-UV through optical to Near-IR region were com-bined to give a ’true-color’ view of the distant universe. A sight line out of ourGalaxy with a low density of foreground Galactic stars supplied a clear view. The
2.7. CAVEAT #2: LOOKING BACK TO THE BEGINNING 79
majority of objects in the image are distant galaxies, some with z ∼ 3, implyinglight travel times of ∼10 Gyr. Ignoring stellar population evolution, for galaxies atz = 3, observed in the F814W filter (λ = 8140A) observations detect emitted (atthe galaxy) radiation of λ = (8140A/1 + z) = 2035A, which is in the Mid-UV. Sucheffects have to be taken into account when observing distant objects.
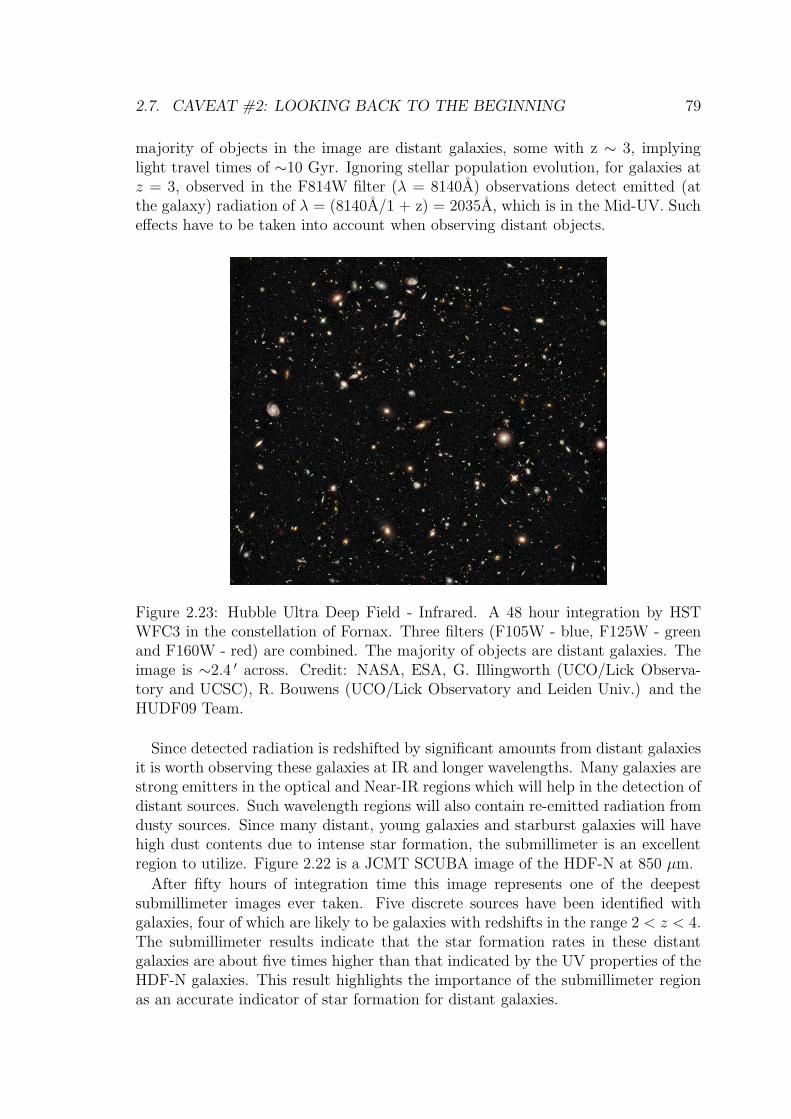
Figure 2.23: Hubble Ultra Deep Field - Infrared. A 48 hour integration by HSTWFC3 in the constellation of Fornax. Three filters (F105W - blue, F125W - greenand F160W - red) are combined. The majority of objects are distant galaxies. Theimage is ∼2.4 ′ across. Credit: NASA, ESA, G. Illingworth (UCO/Lick Observa-tory and UCSC), R. Bouwens (UCO/Lick Observatory and Leiden Univ.) and theHUDF09 Team.
Since detected radiation is redshifted by significant amounts from distant galaxiesit is worth observing these galaxies at IR and longer wavelengths. Many galaxies arestrong emitters in the optical and Near-IR regions which will help in the detection ofdistant sources. Such wavelength regions will also contain re-emitted radiation fromdusty sources. Since many distant, young galaxies and starburst galaxies will havehigh dust contents due to intense star formation, the submillimeter is an excellentregion to utilize. Figure 2.22 is a JCMT SCUBA image of the HDF-N at 850 µm.
After fifty hours of integration time this image represents one of the deepestsubmillimeter images ever taken. Five discrete sources have been identified withgalaxies, four of which are likely to be galaxies with redshifts in the range 2 < z < 4.The submillimeter results indicate that the star formation rates in these distantgalaxies are about five times higher than that indicated by the UV properties of theHDF-N galaxies. This result highlights the importance of the submillimeter regionas an accurate indicator of star formation for distant galaxies.
80 CHAPTER 2. OBSERVING THE ELECTROMAGNETIC SPECTRUM
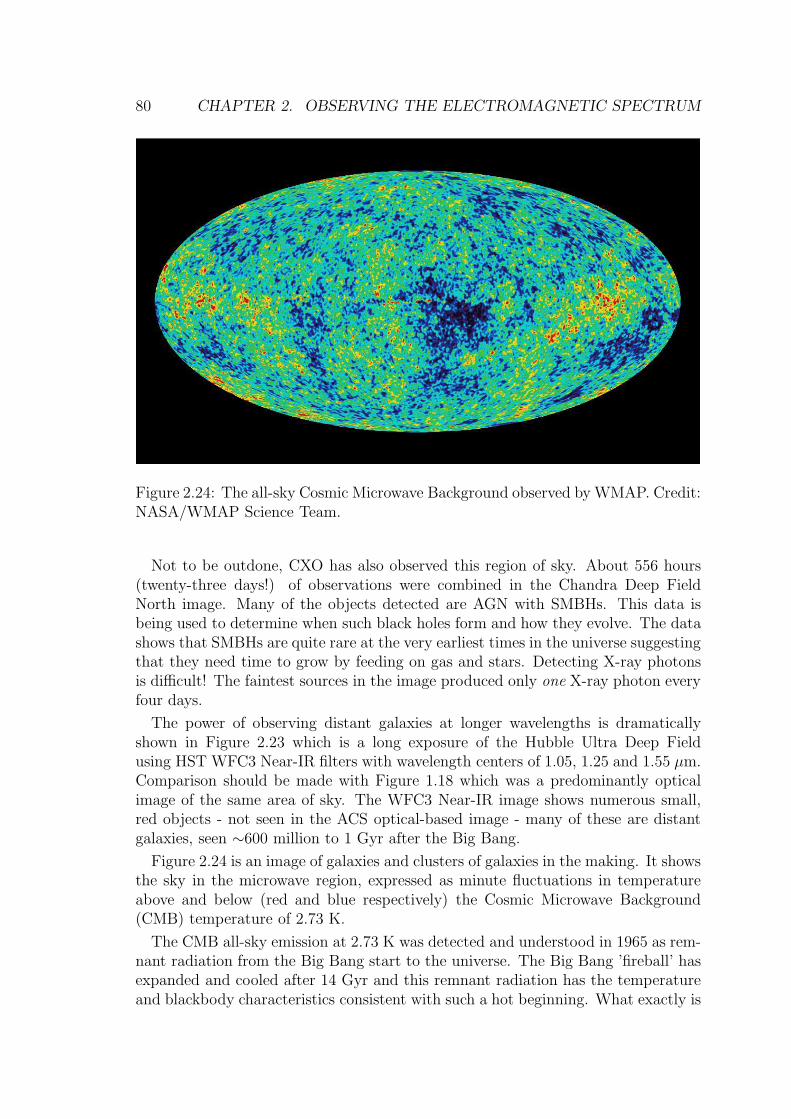
Figure 2.24: The all-sky Cosmic Microwave Background observed by WMAP. Credit:NASA/WMAP Science Team.
Not to be outdone, CXO has also observed this region of sky. About 556 hours(twenty-three days!) of observations were combined in the Chandra Deep FieldNorth image. Many of the objects detected are AGN with SMBHs. This data isbeing used to determine when such black holes form and how they evolve. The datashows that SMBHs are quite rare at the very earliest times in the universe suggestingthat they need time to grow by feeding on gas and stars. Detecting X-ray photonsis difficult! The faintest sources in the image produced only one X-ray photon everyfour days.
The power of observing distant galaxies at longer wavelengths is dramaticallyshown in Figure 2.23 which is a long exposure of the Hubble Ultra Deep Fieldusing HST WFC3 Near-IR filters with wavelength centers of 1.05, 1.25 and 1.55 µm.Comparison should be made with Figure 1.18 which was a predominantly opticalimage of the same area of sky. The WFC3 Near-IR image shows numerous small,red objects - not seen in the ACS optical-based image - many of these are distantgalaxies, seen ∼600 million to 1 Gyr after the Big Bang.
Figure 2.24 is an image of galaxies and clusters of galaxies in the making. It showsthe sky in the microwave region, expressed as minute fluctuations in temperatureabove and below (red and blue respectively) the Cosmic Microwave Background(CMB) temperature of 2.73 K.
The CMB all-sky emission at 2.73 K was detected and understood in 1965 as rem-nant radiation from the Big Bang start to the universe. The Big Bang ’fireball’ hasexpanded and cooled after 14 Gyr and this remnant radiation has the temperatureand blackbody characteristics consistent with such a hot beginning. What exactly is
2.8. CAVEAT #3: OBSERVATIONAL BIAS 81
seen in Figure 2.24? Our early universe consisted of a dense, hot ’soup’ of sub-atomicparticles and extremely high-energy photons interacting with one another. As thefireball expanded the density and temperature decreased. Small, weak density vari-ations evolved, and altered the temperature of the photons. Lower density regionsare the temperature hot spots in the CMB and higher density regions correspondto colder regions.
About 300,000 years after the Big Bang, the temperature had reduced to 3,000K which was cold enough so that sub-atomic particles (i.e. protons, neutrons, elec-trons) could combine to form atoms. Photons could then travel without significantscattering or absorption and the universe became ’transparent’. The last interac-tions of photons with matter, in particular electrons, occurred at this time (300,000years corresponds to a redshift of z ∼ 1000) and this is what is observed as theCMB. It is called the last scattering surface and it is the signature of the universe atthe time the first structures of matter formed. Gravity then took over and galaxieseventually formed. Hence the CMB is an important link between the hot, smoothearly universe devoid of galaxies and the much cooler, lumpy universe full of galaxiestoday.
In the early 1990s the Cosmic Background Explorer (COBE) satellite discoveredsmall (ten parts in a million) differences in the CMB temperature across the wholesky. These deviations are very important since they are needed if structures suchas clusters of galaxies and individual galaxies are to form. However the angularresolution of ∼7◦, for COBE was not sufficient to determine the smallest sizes ofthese deviations. In late 1998 the Balloon Observations of Millimetric Extragalac-tic Radiation and Geophysics experiment or BOOMERANG, was launched in theAntarctic and circumnavigated the continent at an altitude of ∼37 km for about10 days. BOOMERANG delivered observations with an angular resolution of ∼0.2◦
and sampled over 3% of the sky.
The Wilkinson Microwave Anisotropy Probe (WMAP) was launched on June 30th,2001 and has produced all-sky microwave maps (Figure 2.24) with BOOMERANG-like angular resolution (∼0.3◦) providing the best yet information about early uni-verse structure formation and evolution. It has provided an estimate of the ageof the universe of 13.69±0.13 Gyr as well as baryon, dark matter and dark energydensity, Hubble constant, H0 and total neutrino mass (Dunkley et al. 2009).
2.8 Caveat #3: Observational Bias
All scientific measurements have an inherent bias. The selection of a particulartelescope, instrument and detector combination will bias astronomical detections,whether it be due to the diameter of the telescope mirror, the wavelength of de-tection, the length of the observation, or the efficiency and characteristics of thedetector.
A clear-cut example of sample bias is found in most surveys of distant galaxies.Galaxies close to the detection limit (i.e. at the faint limit of the survey) will bemore luminous on average than those at a brighter limit. Simply put, towards fainter
82 CHAPTER 2. OBSERVING THE ELECTROMAGNETIC SPECTRUM
levels of detection, which usually means detecting more distant galaxies, it becomesprogressively more difficult to detect intrinsically faint objects, and the sample getsskewed towards more luminous objects. This is known as ’Malmquist bias’ and itaffects all galaxy surveys that are flux limited.
Galaxies are diffuse, extended objects. They are detected against the competingbrightness of the night sky, which is typically 23 magnitudes per square arcsecond(mag arcsec−2) in the optical B. Depending on your observational set-up, below acertain fraction of the night sky brightness no galaxy will be detected. A ’censorshipof surface brightness’ exists and until recently most studies of galaxies would tend toconcentrate on the brighter surface brightness examples. There is however increasingefforts to detect and study Low Surface Brightness (LSB) galaxies. Although there isno formal convention for defining an LSB galaxy, they typically have central surfacebrightness fainter than 23 B mag arcsec−2.
Malin 2 (page 149) is an example of a LSB galaxy. LSBs are made up of a varietyof galaxy types, from giant, gas-rich disk galaxies (i.e. Malin 2) to dwarf spheroidalgalaxies. The extreme ultra gas rich LSB galaxies have similar properties to smallgroups or clusters of galaxies, suggesting they have experienced a different evolutionhistory than their high surface brightness cousins.
2.9 Galaxy Research and Multiwavelength Ob-
servations
There are numerous areas in galaxy research that owe their existence to the powerof panchromatic observations. Many of these areas are still being pursued as openareas of research and the following sections describe a few of these areas.
2.9.1 A Unified Scheme of Active Galaxies
Attempts have been made to show that the numerous AGN classifications and prop-erties can be explained by a ’Unified Scheme’. This scheme (Antonucci 1993; Urryand Padovani 1995) suggests that the differences seen in AGN can be accounted forby observing the same type of active galaxy along different lines of sight throughdifferent orientations of a similar central structure.
In the Unified Scheme (Figure 2.25) every AGN contains an obscuring dust andgaseous doughnut-like torus around a central supermassive black hole (SMBH) thathas a surrounding thin gaseous accretion disk. Highly collimated relativistic jets areproduced at right angles to the plane of the dusty torus. Observing the nucleus viaa line of sight that intersects the plane of the torus would obscure the active core ofthe accretion disk and SMBH. It would appear as a Radio Galaxy, for an ellipticalhost galaxy, or as a Sy 2, for a spiral host galaxy.
Up to a distance of several kpc from the nucleus are the gaseous ’narrow lineregions’ (NLR) excited either by photoionization from the UV continuum of thecentral source or by shock excitation related to the jets. The gas clouds visible wouldbe predominantly far away from the nucleus, with low-density, slowly moving, having
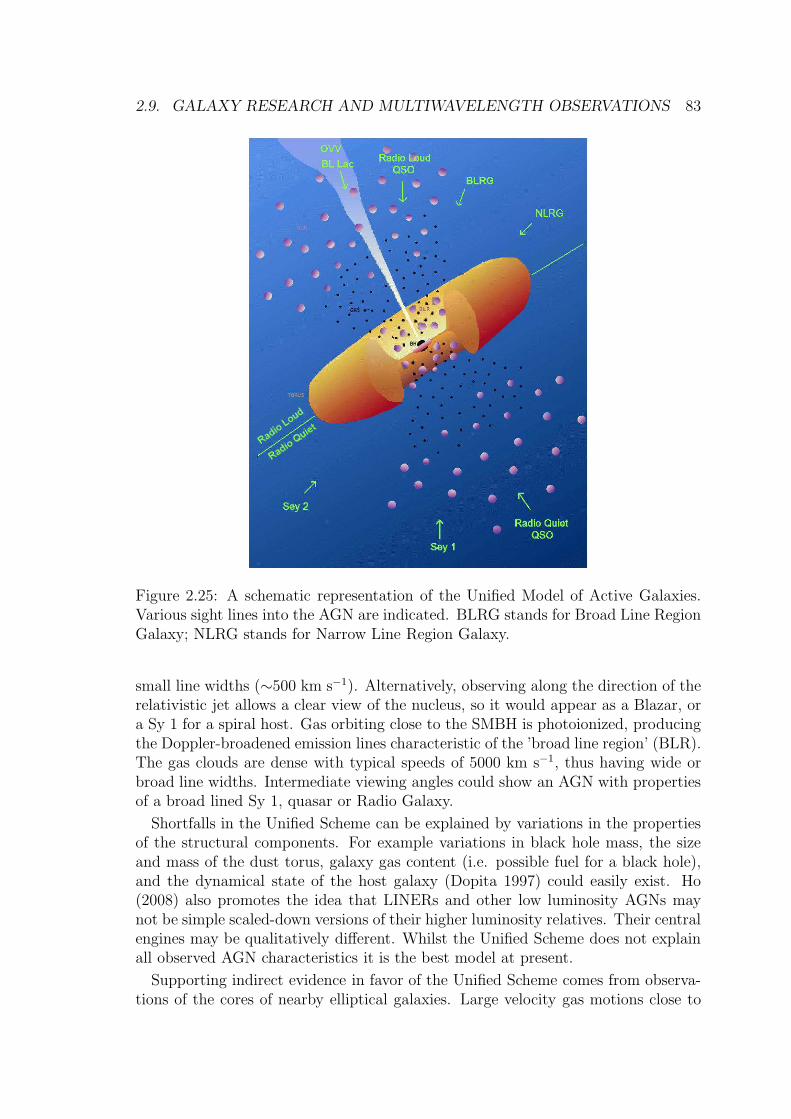
2.9. GALAXY RESEARCH AND MULTIWAVELENGTH OBSERVATIONS 83
Figure 2.25: A schematic representation of the Unified Model of Active Galaxies.Various sight lines into the AGN are indicated. BLRG stands for Broad Line RegionGalaxy; NLRG stands for Narrow Line Region Galaxy.
small line widths (∼500 km s−1). Alternatively, observing along the direction of therelativistic jet allows a clear view of the nucleus, so it would appear as a Blazar, ora Sy 1 for a spiral host. Gas orbiting close to the SMBH is photoionized, producingthe Doppler-broadened emission lines characteristic of the ’broad line region’ (BLR).The gas clouds are dense with typical speeds of 5000 km s−1, thus having wide orbroad line widths. Intermediate viewing angles could show an AGN with propertiesof a broad lined Sy 1, quasar or Radio Galaxy.
Shortfalls in the Unified Scheme can be explained by variations in the propertiesof the structural components. For example variations in black hole mass, the sizeand mass of the dust torus, galaxy gas content (i.e. possible fuel for a black hole),and the dynamical state of the host galaxy (Dopita 1997) could easily exist. Ho(2008) also promotes the idea that LINERs and other low luminosity AGNs maynot be simple scaled-down versions of their higher luminosity relatives. Their centralengines may be qualitatively different. Whilst the Unified Scheme does not explainall observed AGN characteristics it is the best model at present.
Supporting indirect evidence in favor of the Unified Scheme comes from observa-tions of the cores of nearby elliptical galaxies. Large velocity gas motions close to
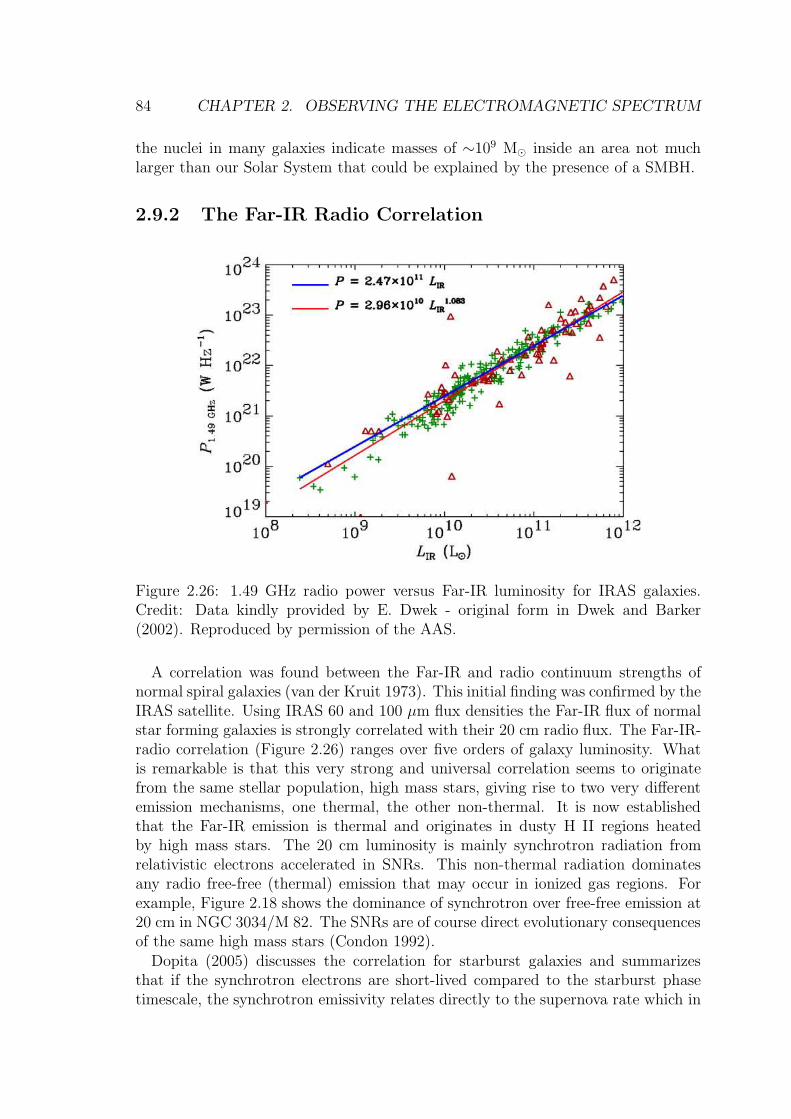
84 CHAPTER 2. OBSERVING THE ELECTROMAGNETIC SPECTRUM
the nuclei in many galaxies indicate masses of ∼109 M⊙ inside an area not muchlarger than our Solar System that could be explained by the presence of a SMBH.
2.9.2 The Far-IR Radio Correlation
Figure 2.26: 1.49 GHz radio power versus Far-IR luminosity for IRAS galaxies.Credit: Data kindly provided by E. Dwek - original form in Dwek and Barker(2002). Reproduced by permission of the AAS.
A correlation was found between the Far-IR and radio continuum strengths ofnormal spiral galaxies (van der Kruit 1973). This initial finding was confirmed by theIRAS satellite. Using IRAS 60 and 100 µm flux densities the Far-IR flux of normalstar forming galaxies is strongly correlated with their 20 cm radio flux. The Far-IR-radio correlation (Figure 2.26) ranges over five orders of galaxy luminosity. Whatis remarkable is that this very strong and universal correlation seems to originatefrom the same stellar population, high mass stars, giving rise to two very differentemission mechanisms, one thermal, the other non-thermal. It is now establishedthat the Far-IR emission is thermal and originates in dusty H II regions heatedby high mass stars. The 20 cm luminosity is mainly synchrotron radiation fromrelativistic electrons accelerated in SNRs. This non-thermal radiation dominatesany radio free-free (thermal) emission that may occur in ionized gas regions. Forexample, Figure 2.18 shows the dominance of synchrotron over free-free emission at20 cm in NGC 3034/M 82. The SNRs are of course direct evolutionary consequencesof the same high mass stars (Condon 1992).
Dopita (2005) discusses the correlation for starburst galaxies and summarizesthat if the synchrotron electrons are short-lived compared to the starburst phasetimescale, the synchrotron emissivity relates directly to the supernova rate which in
2.9. GALAXY RESEARCH AND MULTIWAVELENGTH OBSERVATIONS 85
turn should be proportional to the SFR.The linearity of the Far-IR radio correlation has been questioned. Bell (2003) has
compared the Far-UV derived star formation rates with that from the Far-IR andfound that the Far-IR traces most of the star formation in luminous ∼L∗ galaxiesbut traces only a small fraction of the star formation in faint ∼0.01L∗ galaxies. Sincethe Far-IR Radio correlation is very close to linear at low luminosities Bell (2003)suggests that the non-thermal radio flux is also decreased - which conspires to givesuch a linear correlation. This work is difficult for a number of reasons. Firstly,small numbers of low luminosity galaxies (usually selected or enhanced across non-homogeneous samples) are used in many such studies. Secondly, there are potentialproblems in relating UV-derived to other star formation rate indicators because ofthe different stellar timescales probed by the UV relative to other tracers of ionizingphotons. Calzetti et al. (2007) study star formation based on Mid-IR emission oflocal galaxies and show that their viability as SFR indicators is subject to a numberof caveats. The most robust star formation indicator combines the observed Hα and24 µm luminosities as probes of the total number of ionizing photons present in aregion.
2.9.3 A Non-Universal IMF
The initial mass function (IMF), ξ(M), describes the mass distribution of starsformed in a particular region. It takes the form of a power law
ξ(M) = c M−(1+x)
with ξ(M) existing over a range of stellar masses - these limits have been Mlower
= 0.1 M⊙ to Mupper = 125.0 M⊙ in three of the most popular IMFs (Salpeter 1955with a slope of x = 1.35; Miller and Scalo 1979; Scalo 1986). Until recently it wasassumed, possibly for simplicity, and somewhat naively, that the IMF was universal.
The results of Meurer et al. (2009) now challenge this assumption. Using alarge sample of H I selected galaxies, the ratio of Hα to Far-UV flux is found tocorrelate with the surface brightness in Hα and the optical R. It is found that LowSurface Brightness (LSB) galaxies have lower Hα to Far-UV flux ratios than highsurface brightness galaxies, and do not replicate the ratios derived from popularstar formation models using IMF parameters (as above). The authors suggest thecorrelations are systematic variations of the upper stellar mass limit and/or slope(x) of the IMF at the high mass end. Simply stated, low luminosity galaxies haveless massive stars than higher luminosity galaxies. Yet it appears that the surfacebrightness drives IMF variations more than luminosity or mass. These results implythat the rate of star formation derived is highly sensitive to the indicator used inthe measurement, as mentioned in the previous section.
2.9.4 Gamma Ray Bursts
A GRB detected on May 8th, 1997 (GRB970508) by the BeppoSAX satellite wasthe first GRB for which a secure distance could be estimated. An associated optical
86 CHAPTER 2. OBSERVING THE ELECTROMAGNETIC SPECTRUM
transient was detected 5.8 hours after the discovery (Djorgovski et al. 1997) andits brightness decline was consistent with relativistic ’fireball’ models of extremeenergy events. Spectroscopy of the optical transient (Metzger et al. 1997) showedabsorption lines due to a galaxy at a redshift of z = 0.84. The absence of Lyman-α (hydrogen) absorption in the spectrum implied that the optical transient had aredshift between 0.84 < z < 2.3. At the minimum redshift of z = 0.84, this GRBwould have a total luminosity of 7 × 1051 erg s−1. To put this in perspective, theluminosity of the brief GRB970508 event was equivalent to the optical luminosityof more than 108 galaxies similar to the Galaxy. A more recent burst, GRB090423,detected by the Swift satellite, is associated with a galaxy at z = 8.2. This impliesthat the GRB is being detected only after ∼5% of the age of the universe has expired.
Theoretical models have been proposed to explain the energy source and emissionmechanism of these bursts. Candidate models include neutron star-neutron star orblack hole-black hole mergers (or a combination of the two objects) and hypernovaethat are extremely massive stars undergoing supernovae collapse to a black hole.These models usually rely on some sort of preferential beaming of radiation alongour line-of-sight to achieve the observed extreme luminosities.
Observations have been strengthening the case for a GRB-Supernovae link. CXOdetected a spectrum of hot gas moving at 0.1c for GRB020813 containing numerouselements commonly seen in the ejecta of a supernova explosions. The data appearsto support the hypernovae model in which shock waves in jets emanating from theblack hole region produce Gamma rays and X-rays. The CXO observations detectthe radiation from the jets interacting with the expanding shells of ejected gas.
2.9.5 Magnetic Fields in Galaxies
Large-scale magnetic fields exist in spiral (grand design and flocculent25), irregularand dwarf irregular galaxies and are coherent over scales as large as 1 kpc. Theirorigin and evolution is directly linked to induction effects in the ionized ISM. Thesefields are likely driven by a large-scale dynamo action that can exist even whilstother hydromagnetic effects occur either globally (i.e. spiral arm related densitywave propagation; bars), or locally (i.e. galactic fountains, shocks) (Beck et al.
1996; Krause 2003).
Continuum radio observations allow the detection of galactic magnetic fields viasynchrotron emission. The intensity of linearly polarized emission measures the mag-netic field (Figure 2.27), after correction for Faraday rotation and depolarization26.Observations at two or more frequencies allows the correction to be computed.
Regular magnetic fields align with spiral arms but are strongest in the inter-armregions. Total field strengths are on average 8 µG27 with some inter-arm regions
25Flocculent spirals have patchy disk structures rather than clear spiral arms.26The rotation of the plane of polarization of a linearly polarized wave propagating through a
magnetized dielectric medium is known as Faraday rotation (discovered by Michael Faraday in1845). The rate at which the plane of polarization rotates is proportional to the product of theelectron number density and the parallel magnetic field strength.
27G stands for gauss, the cgs unit of measurement of a magnetic field, named after Carl Friedrich
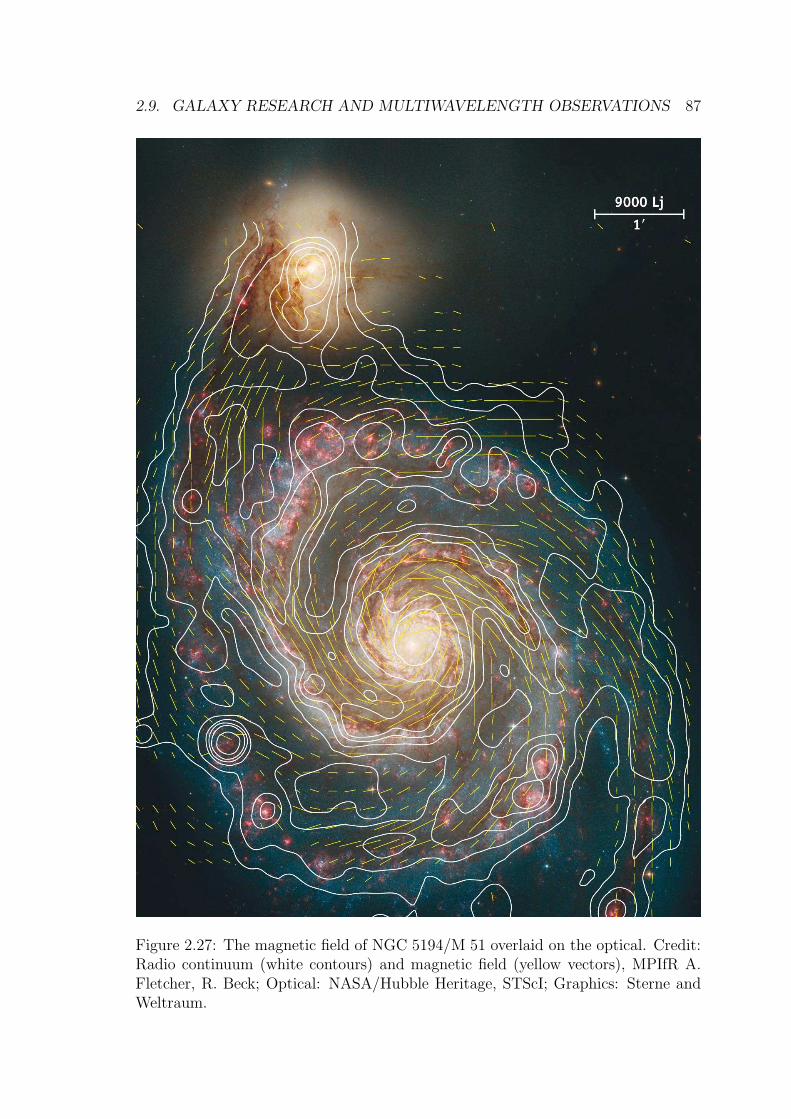
2.9. GALAXY RESEARCH AND MULTIWAVELENGTH OBSERVATIONS 87
Figure 2.27: The magnetic field of NGC 5194/M 51 overlaid on the optical. Credit:Radio continuum (white contours) and magnetic field (yellow vectors), MPIfR A.Fletcher, R. Beck; Optical: NASA/Hubble Heritage, STScI; Graphics: Sterne andWeltraum.
88 CHAPTER 2. OBSERVING THE ELECTROMAGNETIC SPECTRUM
reaching 20 µG. It is thought that higher turbulent gas velocities in the arm regionsdecreases the dynamo strength promoting greater field strength in the inter-armareas. Magnetic fields are also observed in barred galaxies, and total field strengthscorrelate with the length of the bar. Edge-on galaxies display magnetic fields thatare mainly parallel to their disks except in some galaxies with strong star formationand galactic winds.
2.10 Additional Reading
The listing is not intended to be comprehensive but will complement the text. Ad-vanced texts or papers are indicated with the † symbol.
P. A. Charles and F. D. Seward, 2010, Exploring the X-ray Universe, 2nd Edition,(Cambridge University Press, Cambridge).
J. J. Condon, 1992, Radio Emission from Normal Galaxies, Annual Review ofAstronomy and Astrophysics, 30, 575.
L. C. Ho, 2008, Nuclear Activity in Nearby Galaxies, Annual Review of Astron-omy and Astrophysics, 46, 475.
R. C. Kennicutt, Jr., 1998, Star Formation in Galaxies along the Hubble Sequence,Annual Review of Astronomy and Astrophysics, 36, 189.
I. Robson, 2009, The submillimetre revolution, Experimental Astronomy, 26(1-3), 65.
B. T. Soifer, G. Helou and M. Werner, 2008, The Spitzer View of the Extragalac-tic Universe, Annual Review of Astronomy and Astrophysics, 46, 201.
†Longair, M.S. 2009, High Energy Astrophysics, Vols. 1 and 2, (Cambridge Uni-versity Press, Cambridge).
†D. E. Osterbrock, 1989, Astrophysics of Gaseous Nebulae and Active GalacticNuclei, (University Science Books, Mill Valley, CA).
†J. A. Peacock, 1999, Cosmological Physics, (Cambridge University Press, Cam-bridge), chapters 12-14.
†L. Spitzer, 1998, Physical Processes in the Interstellar Medium, (Wiley-Interscience, New York).
Gauss (1777-1855). The Earth’s magnetic field measures about 0.5 gauss, and the surface of aneutron star has a field of about 1012 gauss