coal-financial-trends-eta research paper - carbon · pdf file"king!coal"disappoints!...
TRANSCRIPT
"King Coal" disappoints investors: recent financial trends in global coal mining Key Takeaways -‐ Coal prices down 40% since 2011
due to surging supply and slowing (or negative) demand growth
-‐ Over last three years Bloomberg Global Coal Index of 32 publicly-‐listed coal miners has lost half of its value, with leading indicators suggesting continued market pessimism
-‐ Since 2011 US coal sector has seen major bankruptcies and extensive management shake-‐ups
-‐ Having grown steadily since 2000, from 2012-‐2013 combined capex of major publicly-‐listed thermal coal producers actually declined slightly -‐ although remained 3X cash return to shareholders via dividends and share buybacks
-‐ Major diversified miners Rio Tinto, BHP Billiton, and Vale have been disposing of thermal coal assets
To complement our recent Carbon Supply Cost Curves report, this note examines recent financial trends in the global coal industry. Structural decline in thermal coal demand is diminishing the scope for profitable investment in new thermal coal mines. Producers that recognize this -‐ and adapt plans for future capital expenditures accordingly -‐ will serve investor interests. This note seeks to further dialogue between investors and coal-‐producing companies on the issues of demand risk and capital discipline. Analysts CTI: ETA: Reid Capalino Mark Fulton Andrew Grant September 22nd 2014
Executive Summary
• Coal prices are down 40% since 2011: Over the past three years coal prices around the world have fallen sharply. The current free-‐on-‐board Newcastle spot price (a key benchmark for Pacific export markets) is 40% below average 2011 prices. Over this period major coal consumers such as the US and China have seen domestic coal prices fall by a similar amount. Though the specific causes vary by market, generally coal prices are under pressure due to (1) lower-‐than-‐expected growth in coal demand (or turning negative) due to more energy efficiency, competition from other electricity sources, and regulations to limit air pollution from coal (all amid a context of low-‐to-‐moderate economic expansion); and (2) in export markets and China's domestic market, robust supply growth as projects undertaken in response to high prices of a few years ago begin to produce.
• Undermining profit margins for coal producers: Current prices are eliminating profit margins for a growing number of coal producers. In the seaborne export market, we estimate current spot prices to be below the “cash costs” of production for nearly one-‐half of total capacity and to be below the “breakeven coal price” (which includes capital costs and economic returns) for two-‐thirds of total capacity. Over half of China’s coal producers have cash costs in excess of domestic Chinese spot prices, and throughout the US higher-‐cost miners (particularly in regions such as Central Appalachia) are currently producing at a loss.
• … and returns for investors in listed coal companies: The current stressed state of coal markets is reflected in the financial performance of publicly-‐traded coal companies. From Aug 2011-‐2014, the Bloomberg Global Coal Index of 32 major publicly-‐traded coal companies declined by 56% while the MSCI World Index (a broad market benchmark) increased by 31%. In the US, over two dozen coal producers have filed for bankruptcy since 2012 (including two companies with over $1 billion in assets); during this period US coal companies have also seen widespread executive turnover, with 11 major producers replacing a CEO, Chairman, or other senior executive.

22 Sep 2014 2
• Reckoning with a $200+ billion build-‐up in coal assets: We survey 83 major publicly-‐listed coal producers, including 60 that produce thermal coal. Since 1990, capital expenditures (capex) and acquisitions by these firms have increased their combined net fixed assets by $214 billion (in real terms); thermal coal assets – chiefly in China and the US – account for over 70% of this increase (i.e. $154 billion).
• Thermal coal producers beginning to reduce capex? Crucial engagement issue for investors: Recent investments in thermal coal, however, generally have generated weak returns for shareholders. The reality of weak returns – combined with a need to hoard cash in order to maintain already weak credit ratings – provide the context for the 60 thermal coal producers in our sample modestly reducing their combined capex from 2012 to 2013. Note that combined capex for this group increased each year from 2000 to 2012. Cash allocated to the combined 2013 capex of these 60 firms, however, remained roughly 3 times the cash returned to stockholders via dividends and share repurchases. This observation underscores how engaging with thermal coal producers on capital management decisions ought to be a top priority for investors concerned with returns, especially in the context of carbon asset risk.
• Among diversified producers, Glencore Xstrata buys thermal coal assets while BHP and Rio sell: As a complement to our analysis of pure-‐play coal producers, we also examine the coal operations of four large diversified mining companies (Anglo American, BHP Billiton, Rio Tinto, and Glencore Xstrata). We note an emerging schism in this group between buyers and sellers of thermal coal assets. Both prior and subsequent to its 2012 $45 billion acquisition of Xstrata (which, at the time of acquisition, generated 25% of its revenue from thermal coal), Glencore has been snapping up thermal coal assets in South Africa, Australia, and elsewhere. In many cases, the seller of those assets has been either Rio Tinto or BHP Billiton. BHP, for its part, is in the process of trying to spin off its remaining South African thermal coal mines into a separate entity (while also notably shifting its coal-‐related capex away from thermal and toward metallurgical coal). Buying assets at low valuations can be a promising (albeit risky) strategy to generate returns, particularly if the assets in question have low production costs. Analysis in our companion reports, however, concludes that thermal coal is going into structural decline and therefore diversified companies will best serve shareholder interests by reducing exposure to thermal coal. Investors in such companies ought to prioritize engaging with management to understand company plans regarding capex and M&A related to thermal coal.
Acknowledgements The analysts would like to acknowledge the contributions of Tim Buckley (Institute for Energy Economics and Financial Analysis), Tom Sanzillo (Institute for Energy Economics and Financial Analysis), and Clyde Henderson (Energy Economics).

22 Sep 2014 3
Contents 1. Coal industry trends -‐ declining prices, squeezed margins, and executive turnover .............................. 4
2. Country-‐level context on key export and domestic markets ................................................................ 13
3. Detailed financial analysis of publicly-‐listed coal-‐mining companies .................................................... 27
4. Analysis of coal operations of four major diversified mining companies ............................................. 39
Appendix A – List of firms included in the Bloomberg Global Coal Index ..................................................... 51
Appendix B – Additional detail on our universe of coal mining companies .................................................. 52

22 Sep 2014 4
1. Coal industry trends -‐ declining prices, squeezed margins, and executive turnover Recent years have been challenging to the global coal industry. Since at least 2011 the global coal sector has shown significant financial underperformance. The most striking feature of the last few years has been the sharp decline in prices for both thermal and metallurgical coal. Focusing on the roughly 1 billion tonne1 market for thermal coal exports (in 2013 equal to 18% of global thermal coal consumption), the chart below shows average annual prices for Newcastle export thermal coal, a key benchmark price in the Pacific region.2 Having fallen sharply and then rebounded from 2008-‐2011, since 2011 Newcastle prices have been in steady decline. The August 2014 Newcastle spot price of $68/tonne is down over 40% from the average 2011 price of $121/tonne (with the year-‐to-‐date average 2014 price down nearly 40% as well). The chart below also shows the spot price of coal from the US Central Appalachian region (CAPP), a key price for coal supplied to thermal power plants in the eastern US. The August 2014 CAPP spot price of $60/ton is down over 30% from the average 2011 price of $87/ton (and down 66% from the average 2008 price of $118/ton). Forward curves show 2018 Newcastle and CAPP prices 10-‐20% above current spot prices but well below the high price levels observed in 2008 and 2011. Figure 1: Annual average prices for Newcastle export steam coal and US Central Appalachian Coal (CAPP), 2000-‐2018
Note: Values shown are annual averages of free on board (FOB) weekly prices. Newcastle prices in US$/metric tonne and US prices in $/short ton. Newcastle energy content is 6000 kcal/kg; CAPP energy content is 12,500 Btu/lb (i.e. ~6900 kcal/kg). 2014 Newcastle price averaged to end in June; for CAPP, it is average of remaining 2014 futures prices.
Source: Platts, BP, Bloomberg LP, CTI/ETA analysis 2014
1 Throughout “tonne” refers to metric tonnes and “tons” to short tons. Note that 1 metric ton = 1.10 short tons. 2 FOB Newcastle is a price for thermal coal exported out of the port of Newcastle on Australia’s eastern coast and typically shipped to China.
$0/t
$20/t
$40/t
$60/t
$80/t
$100/t
$120/t
$140/t
2000 2001 2002 2003 2004 2005 2006 2007 2008 2009 2010 2011 2012 2013 2014 2015 2016 2017 2018
Newcastle FOB ($/t) Newcastle FOB Futures ($/t) CAPP ($/t) CAPP Futures ($/t)

22 Sep 2014 5
The price declines described above have also occurred in other regional coal markets3 as well as in the market for metallurgical coal (where prices have also declined more than 40% since 2011). Though the specific causes vary by market, generally speaking thermal coal prices are under pressure due to (1) growth in coal demand slowing (or turning negative) due to more efficient use of energy, competition from other energy sources, and regulations to limit air pollution from coal (all amid a context of low-‐to-‐moderate economic expansion)4; and (2) in export markets, robust supply growth as projects undertaken in response to high prices of a few years ago begin to produce. Paragraphs below provide more detail on these trends. Figure 2: Comparing trajectories of metallurgical and thermal coal prices, 2000-‐2013 (prices rebased to 100)
Source: BP, Bloomberg LP, CTI/ETA analysis 2014
3 For coal imported into Northwest Europe, the price averaged at $147/t in 2008 and $122/t in 2008, versus $73/t today and a 2018 forward curve price of $87/t. BP, BP Statistical Review of World Energy June 2014, “Coal: prices", 2014, http://www.bp.com/statisticalreview. 4 For more discussion of these trends, see our companion paper, Carbon Tracker Initiative (CTI) and Institute for Energy Economics and Financial Analysis (IEEFA), Thermal coal demand: comparing projections and examining risks, September 2014, http://www.carbontracker.org.
523
493
343
451
577
354
0
100
200
300
400
500
600
700
Prices (reb
ased
to 100)
Newcastle thermal coal FOB priceJapan metallurgical coal import cif price

22 Sep 2014 6
Declining thermal coal prices eroding profit margins The decrease in coal prices since 2011 has caused profit margins for coal producers to diminish or, in some cases, disappear entirely. Using mine-‐level data from Wood Mackenzie’s Global Economic Model (GEM) database5, the figure below shows a 2014 supply curve for export thermal coal production capacity (including lignite). For over 1,000 mines with the potential to produce export thermal coal, the blue line shows each mine’s energy-‐adjusted “cash costs” of production6; the orange line shows each mine’s “breakeven coal price” (BECP), a measure – taking into account both cash and capital costs as well as production over the lifetime of the mine – of the price that will yield the mine owner a net present value of zero assuming a 10% real discount rate. Figure 3: Significant potential production uneconomic at current prices -‐ 2014 potential export thermal coal by cash cost and breakeven price (BECP) level, million tonnes per annum (Mtpa)
Note: BECP is breakeven coal price; NAR is net-‐as-‐received Source: Cost and supply data from Energy Economics, using Wood Mackenzie Global Economic Model; price data from Bloomberg LP, and CTI/ETA analysis 2014 BECP figures are standardized to a “Newcastle-‐equivalent price,” which takes into account differences in energy content as well as differences in the cost of transport for export mines in different countries.7 The
5 Wood Mackenzie's Global Economic Model (GEM) coal database includes detailed cost data for 1,200+ mines, http://public.woodmac.com/content/portal/energy/highlights/wk3_Nov_13/Global%20Economic%20Model%20Coal.pdf 6 In this case, costs have been standardized to a net-‐as-‐received basis of 6,000 kcal/kg. Note that, in Wood Mac’s Global Economic Model, “cash costs” include both variable and fixed costs. 7 For more discussion of this, see the methodology section of our companion paper, Carbon Tracker Initiative and Energy Transition Advisors, Carbon Supply Cost Curves: Evaluating Financial Risk to Coal Capital Expenditures, September 2014, http://www.carbontracker.org.

22 Sep 2014 7
dashed lines intersecting the cash-‐cost and BECP curves represent, as of August 2014, the Newcastle spot price (grey line)8 and 2018 forward price (purple line). Note that the August 2014 Newcastle spot price of $68/t is below the Newcastle-‐equivalent BECP for 72% of export thermal coal production capacity (i.e. 1067 Mtpa); for mines in this group, income from selling at a price of $68/t is insufficient to earn the mine owners a 10% return on their investment. The figure also illustrates the August 2014 Newcastle spot price to be below the cash costs of production for 47% of export thermal coal production capacity (i.e. 697 Mtpa); for mines in this group, a price of $68/t is insufficient to cover even the cash costs of production. Assuming that the Newcastle spot price were to increase to the 2018 forward price of $82/t, this would still fail to meet the BECP requirements for 30% of production capacity (i.e. 445 Mtpa) and fail to cover cash costs for 11% of production capacity (163 Mtpa).9 The table below provides a country-‐level breakdown of the export thermal coal production capacity that, at a price of $68/t, would be unprofitable on either a cash-‐cost or BECP basis (or both). On both the cash cost and BECP curve, a majority of production capacity over $68/t exists in China. As the world’s largest importer of thermal coal, China currently exports relatively little thermal coal (with the country having become a net importer in 2009); that said, the mines represented on the curve above do have the capacity to produce export-‐grade thermal coal (should prices justify it). Excluding the 607 Mt of potential capacity in China (currently the world’s largest net importer), the percentage of total potential export production with cash costs above the current spot price is 27%; the percentage of total production with BECPs above the current spot price is 61%. Perhaps most striking is the rightmost column in the table, showing production capacity above $68/t (Newcastle-‐equivalent BECP) as a share of each country’s total export thermal coal production capacity. In every country save for South Africa, this share is near or above 50% -‐ and, in Colombia and Russia, approaches 90%.
8 Since August thermal coal spot prices have not increased. On September 3rd, a spot contract for Australian thermal coal was concluded at $66.85/t (FOB, net calorific value of 6,000kcal/kg). This represented the lowest price in five years (i.e. since September 11th, 2009 when a deal was realized at $66.50/t). 9 That a 21% increase in the spot price can cause the amount of “out-‐of-‐the-‐money” production capacity to decline by 58-‐77% (depending on use of the BECP or cash cost curve) illustrates the implications of export thermal coal supply having a very flat (i.e. price-‐elastic) supply curve.
22 Sep 2014 8
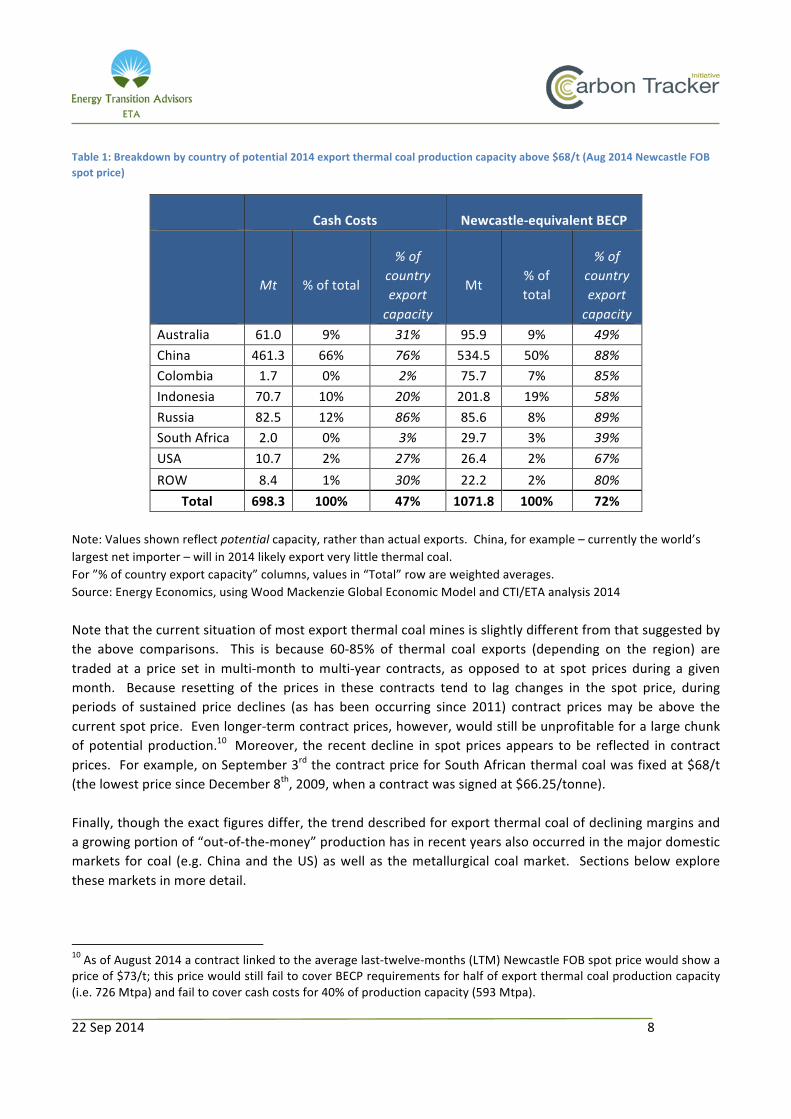
Table 1: Breakdown by country of potential 2014 export thermal coal production capacity above $68/t (Aug 2014 Newcastle FOB spot price)
Cash Costs Newcastle-‐equivalent BECP
Mt % of total
% of country export capacity
Mt % of total
% of country export capacity
Australia 61.0 9% 31% 95.9 9% 49% China 461.3 66% 76% 534.5 50% 88% Colombia 1.7 0% 2% 75.7 7% 85% Indonesia 70.7 10% 20% 201.8 19% 58% Russia 82.5 12% 86% 85.6 8% 89% South Africa 2.0 0% 3% 29.7 3% 39% USA 10.7 2% 27% 26.4 2% 67% ROW 8.4 1% 30% 22.2 2% 80%
Total 698.3 100% 47% 1071.8 100% 72% Note: Values shown reflect potential capacity, rather than actual exports. China, for example – currently the world’s largest net importer – will in 2014 likely export very little thermal coal. For ”% of country export capacity” columns, values in “Total” row are weighted averages. Source: Energy Economics, using Wood Mackenzie Global Economic Model and CTI/ETA analysis 2014 Note that the current situation of most export thermal coal mines is slightly different from that suggested by the above comparisons. This is because 60-‐85% of thermal coal exports (depending on the region) are traded at a price set in multi-‐month to multi-‐year contracts, as opposed to at spot prices during a given month. Because resetting of the prices in these contracts tend to lag changes in the spot price, during periods of sustained price declines (as has been occurring since 2011) contract prices may be above the current spot price. Even longer-‐term contract prices, however, would still be unprofitable for a large chunk of potential production.10 Moreover, the recent decline in spot prices appears to be reflected in contract prices. For example, on September 3rd the contract price for South African thermal coal was fixed at $68/t (the lowest price since December 8th, 2009, when a contract was signed at $66.25/tonne). Finally, though the exact figures differ, the trend described for export thermal coal of declining margins and a growing portion of “out-‐of-‐the-‐money” production has in recent years also occurred in the major domestic markets for coal (e.g. China and the US) as well as the metallurgical coal market. Sections below explore these markets in more detail. 10 As of August 2014 a contract linked to the average last-‐twelve-‐months (LTM) Newcastle FOB spot price would show a price of $73/t; this price would still fail to cover BECP requirements for half of export thermal coal production capacity (i.e. 726 Mtpa) and fail to cover cash costs for 40% of production capacity (593 Mtpa).
22 Sep 2014 9
Take-‐or-‐pay rail contracts, government intervention keeps unprofitable production online One of the seeming anomalies of the thermal coal export market is that mines have been very slow to curtail production in response to declining prices. As of May 2014, analysts at Citi had identified only 13 Mtpa of thermal coal mine curtailments (at mines in Indonesia, Australia, and the US)11 – versus our estimate above, even excluding China, of 200+ Mtpa of potential export production capacity with cash costs above the current Newcastle $68/tonne.12 The seemingly irrational decision of mines to keep producing at prices below their cash costs of production, however, is often the result of fixed cost obligations or government interventions that encourage continued production. In Australia, “take-‐or-‐pay” rail contracts saddle mine owners with high fixed costs irrespective of production, bolstering the incentive to keep production online.13 In Russia, major curtailments have been discouraged as a result of government interventions to freeze rail tariffs (which, for Siberian mines, are the largest variable cost item)14 and the likelihood of further assistance to protect jobs in Russia’s coal mining sector. Ignoring the possible effects of compensatory government aid (as may occur in Russia), the slowness with which thermal coal production responds to conditions of over-‐supply and low prices exacerbates the financial harm to producers who find themselves on the wrong portion of the supply curve. Having covered a bit of the industry context, the following section provides more color on recent developments for key exporters of thermal coal. Financial impacts of declining margins After delivering superior returns in the early 2000s on the back of sharp increases in coal prices, recent returns from coal mining stocks have badly lagged the broader market. The Bloomberg Global Coal Index measures the performance of the coal sector by tracking the share prices of 32 large pure-‐play coal producers.15 The figure below compares the 5-‐year performance of this index against the MSCI World Index (a proxy for overall market returns) and the MSCI World Energy Index (which, their larger market capitalizations relative to coal companies, is heavily weighted toward oil and gas companies). While since 2009 the overall market has increase in value by 64% (and the overall energy sector by nearly 50%), the coal sector has declined in value by more than 50%.
11 Citi, "Global Thermal Coal: When Cyclical Supply Met Structural Demand," 15, 13 May 2014. 12 From May – September 2014 the Newcastle spot price has declined, but note that paucity of mine closures as of May 2014 – relative to our estimate of unprofitable potential export capacity -‐ is not chiefly the result a discrepancy in timing. Using the average last-‐twelve-‐months (LTM) Newcastle spot price of $73/tonne as opposed to the current spot price of $68/tonne, there is still 200+ Mtpa of potential export production capacity with cash costs above this price. 13 The prevalence of such contracts partly explains why Citi analysts identified only 2.4 Mtpa of Australian thermal coal mine curtailments, even though the Queensland Resources Council recently estimated half of Queensland’s thermal coal production (30 Mtpa) to be operating at a cash loss and 20% of total production (12 Mt) to be operating at a loss greater than $14/t. CQ News, "Queensland's Coal Industry to Cut Costs or Close Mines," 28 Mar 2014, http://www.cqnews.com.au/news/line-‐in-‐the-‐sand-‐a-‐thin-‐one/2212255/. 14 International Energy Agency (IEA), Medium-‐Term Coal Market Report 2013: Market Trends and Projections to 2018, 42, 2013, http://www.iea.org/w/bookshop/add.aspx?id=461. 15 For a full list of firms, see Appendix A.

22 Sep 2014 10
Figure 4: Bloomberg Global Coal Index vs. the MSCI World Index and MSCI World Energy Index, Aug 2009 -‐ Aug 2014
Source: Bloomberg LP, CTI/ETA analysis 2014
Though financial performance of the coal sector over the last five years has been particularly poor, the table below shows the coal sector to have also underperformed the broader market on a 10-‐year-‐, 3-‐year, and year-‐to-‐date time scale.16 Current price-‐to-‐earnings (P/E) ratios – one measure of market sentiment on the potential for future growth in earnings – suggest continuing market skepticism about future returns in the coal sector. With “earnings” here relating to one-‐year forward earnings, as of August 2014 the Bloomberg Global Coal Index displayed a P/E ratio of 7X versus a P/E ratio of 16X for the MSCI Energy Index and 18X for the MSCI World Index. The above data points suggest that financial markets expect continuing hard times for coal.
16 Partly as a result of fluctuations in commodity prices, coal stocks have also been significantly more volatile than the broader market; since its inception in August of 2003, the Bloomberg Global Coal Index has had annualized volatility of 24%, versus 20% for the MSCI Energy Index and 14% for the MSCI World Index.
47.6
149.6
164.1
0
20
40
60
80
100
120
140
160
180
Aug-‐09
Nov-‐09
Feb-‐10
May-‐10
Aug-‐10
Nov-‐10
Feb-‐11
May-‐11
Aug-‐11
Nov-‐11
Feb-‐12
May-‐12
Aug-‐12
Nov-‐12
Feb-‐13
May-‐13
Aug-‐13
Nov-‐13
Feb-‐14
May-‐14
Aug-‐14
Inde
x Value
(reb
ased
to 100)
Bloomberg Global Coal index MSCI World Energy Index MSCI World Index

22 Sep 2014 11
Table 2: Comparing returns for the Bloomberg Global Coal Index, MSCI World Index, and MSCI World Energy Index
Source: Bloomberg, CTI/ETA analysis 2014
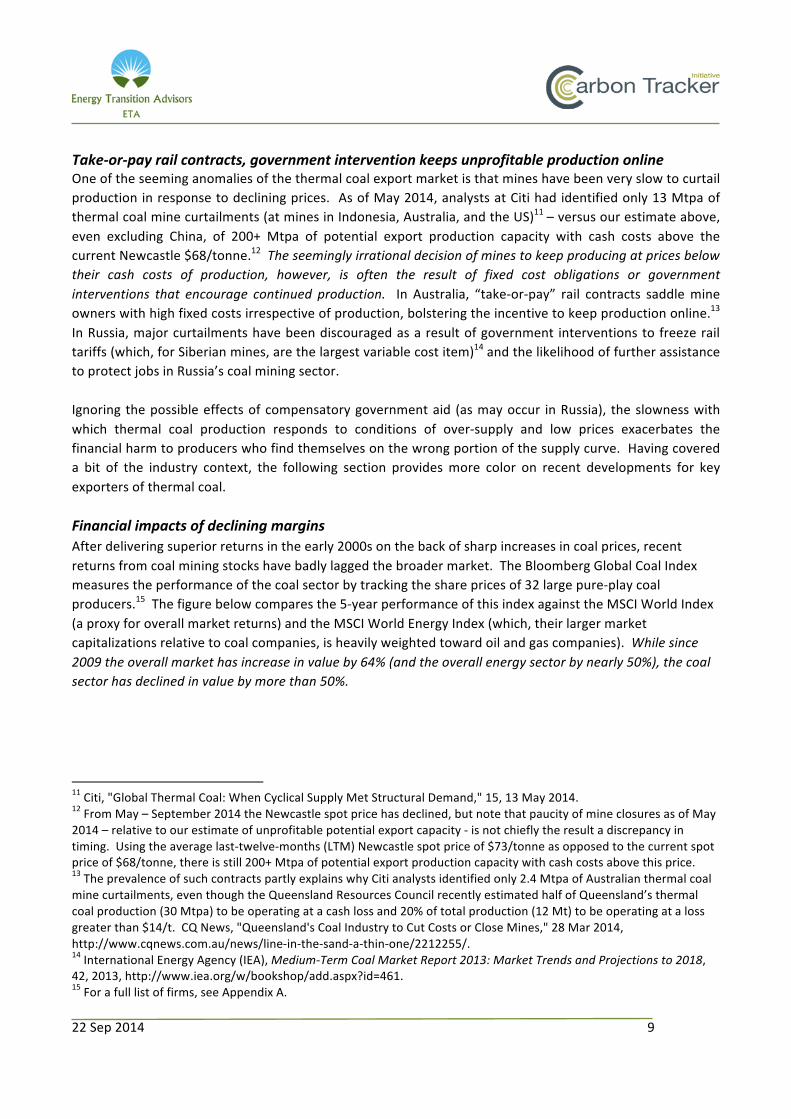
One consequence of sustained financial underperformance has been widespread turnover within the executive ranks of coal companies. From January 2012 to March 2014, the figure below annotates the trend of the SNL coal price index) with descriptions of management changes at major US coal companies. For reference, in the next section we undertake detailed financial analysis of a sample of 83 coal companies that includes 15 US companies; of these 15 companies, over the past two and a half years, six of them have replaced a CEO or other senior executive (e.g. President). Moreover, in at least one case, losses related to coal by a major diversified mining company are thought to have contributed to a CEO’s departure.17 Note that this group of six companies includes four of the five largest US coal producers (Peabody Energy, Alpha Natural Resources, Arch Coal, and CONSOL Energy). The growing unwillingness of corporate boards and investors to endure continued coal-‐related losses highlights what might be termed the “CEO risk premium” related to coal. As examples of loss-‐making investments in new coal mines continue to spread, it is plausible that boards and shareholders of companies will significantly decrease their tolerance for investment decisions that assume continued unrealistically high coal prices. The concept of the "CEO risk premium" is directly applicable to much of the detailed company-‐level financial analysis below.
17 Rhiannon Hoyle, "Rio Tinto to Sell Mozambique Coal Assets for $50 million," Wall Street Journal, July 30 2014, http://online.wsj.com/articles/rio-‐tinto-‐to-‐sell-‐mozambique-‐coal-‐assets-‐for-‐50-‐million-‐1406704712.
Bloomberg Global Coal Index MSCI World Energy Index MSCI World Index
YTD -‐1.1% 8.0% 2.7%
1 year -‐0.1% 15.2% 11.9%
3 year -‐56.2% 13.9% 31.5%
5 year -‐50.7% 49.6% 63.3%
10 year 51.6% 108.3% 66.1%since inception (8/12/2003) 136.6% 167.6% 91.8%
22 Sep 2014 12
Figure 5: Recent management changes at US coal companies
Source: SNL Financial

22 Sep 2014 13
2. Country-‐level context on key export and domestic markets To give a sense of the current export landscape for thermal coal, the table below provides detail on the top five country exporters of thermal coal. Two points emerge from this table. First, after adjusting for differences in energy content and transport costs, average Newcastle-‐equivalent BECPs of these countries exist within a relatively tight range (with Russia, the highest-‐cost supplier, having an average cost only $16/tonne higher than South Africa, the lowest-‐cost supplier).18 As discussed above, this flatness of the supply coal serves to limit margins for even lower and medium-‐cost suppliers of export thermal coal. Second, the ownership structure for export thermal coal mines varies considerably by country. Whereas mines in Indonesia are overwhelming owned by pure-‐play, publicly-‐listed coal companies, mines in Colombia are overwhelmingly controlled by publicly-‐listed diversified mining companies such as Anglo American, BHP Billiton, and Glencore Xstrata (companies that also have a significant presence in Australia and South Africa), while Russian mines are largely controlled by a combination of diversified miners and state-‐affiliated enterprises. Table 3: Detail on top five country exporters of thermal coal
2014 thermal coal export capacity (Mt)
% of global thermal coal export capacity (excluding China)*
2014 weighted average Newcastle-‐equivalent BECP (USD/tonne)
# of major pure-‐play publicly-‐listed companies that export thermal coal**
Combined market cap of those companies (billion USD)
Australia 197 23% 69 3 3.9 Colombia 89 10% 72 2 1.2 Indonesia 350 40% 70 11 13.4 Russia 96 11% 82 1*** 0.8 South Africa 76 9% 66 1 4.6
Total 808 93% 71 17 23.9
*China excluded because, despite substantial potential export capacity, since 2009 the country has been a net importer of thermal coal. **Excludes diversified mining and metals companies, which have a particularly large presence in Colombia, South Africa, and Australia (and, to some extent, in Russia). Applies threshold from our sample by including only companies with a market cap of $200 million or more (as of August 2014) *** Southern Kuzbass Coal Company produces primarily metallurgical coal. Source: Energy Economics, using Wood Mackenzie Global Economic Model and CTI/ETA analysis 2014
18 On the basis of energy-‐adjusted cash costs (i.e. not adjusting for differences in transport-‐related costs and price differences in end markets), Colombia and Indonesia move noticeably down the cost curve, and the spread between the lowest and highest-‐cost supplier widens to $30/tonne.
22 Sep 2014 14
Indonesia -‐ reckoning with oversupply No country has seen a greater impact from growth of the seaborne thermal coal market than Indonesia. Since 2000 Indonesia has increased its exports of hard thermal coal more than 7 times to over 400 Mt in 2013.19 Though the country accounts for less than 6% of global coal production, its share of the export thermal coal market is 40%, largely due to its status as the top supplier of thermal coal imports to both China and India.20 As a result of continued investment in new supply, from 2008-‐2013 Indonesian thermal coal exports grew by an average of 30 Mt annually. The Indonesian thermal coal export story, however, has recently entered into a somewhat gloomier chapter. Declining prices for both export and domestic coal -‐ partly a result of the phenomenal supply growth mentioned above -‐ are pressuring margins for Indonesian producers. Of the 11 large publicly-‐listed Indonesian thermal coal producers that we later analyze, in 2013 seven had EBIT (earnings before interest and taxes) margins in the single-‐digits. In August 2014 Standard & Poor’s declared PT Bumi Resources (one of Indonesia's largest producers) in “selective default” owing to failure to make payment on a $375 million convertible bond.21 Times are even tougher for smaller miners producing low-‐energy content coal, which Citi analysts estimate could account for up to 30% of Indonesia's total coal production.22 Indonesia's government is attempting to alleviate excess supply by capping total 2014 coal production at 397 Mt, versus total 2013 production of 421 M, albeit with little success to date.23 Growth in export supply is also projected to decline to less than 20 Mt annually from 2014-‐2020. Such changes, combined with the recent weakening of the rupiah, may bolster short-‐term profits for Indonesia's coal miners. Longer-‐term, however, there are significant hurdles to profitably expanding Indonesia's thermal coal production. These hurdles relate to the (1) low energy content of much of Indonesia's remaining thermal coal and lignite reserves (which necessitates discounts in selling price; (2) location of future mine developments, which typically will be further inland (hence increasing the capex requirements for railing this coal to Indonesian ports); and (3) potential Chinese bans on imports of low-‐quality coal (which China is considering as a way to reduce air pollution from coal).24 As Indonesia's existing mines are replaced by costlier new developments and domestic Indonesian thermal coal demand more than doubles, our supply analysis estimates that through 2035 profitable Indonesian thermal coal exports may average only 207 Mtpa25 (which, ignoring differences in energy content, is less than half of Indonesia's 2013 exports). Given the looming consolidation in Indonesia's coal sector, ownership of profitable Indonesian coal mines is likely to be limited to a shrinking number of players.
19 In all country discussion notes that historic totals on thermal coal exports are not energy-‐adjusted and, if from the IEA, exclude lignite. Yoga Rusmana and Fitri Wulandari, "New Rules in Indonesia Require Exporters to Have Licenses," Bloomberg, July 24 2014, http://www.bloomberg.com/news/2014-‐07-‐24/new-‐rules-‐in-‐indonesia-‐require-‐coal-‐exporters-‐to-‐have-‐licenses.html. 20 IEA, Medium-‐Term Coal Market Report 2013, 41. 21 David Yong, "Bumi makes second-‐attempt to avert $375 million bond default," Bloomberg, Aug 11 2014, http://www.bloomberg.com/news/2014-‐08-‐11/bumi-‐makes-‐second-‐attempt-‐to-‐avert-‐375-‐million-‐bond-‐default.html 22 Citi, "Global Thermal Coal: When Cyclical Supply Met Structural Demand," 31-‐32. 23 http://www.bloomberg.com/news/2014-‐07-‐24/new-‐rules-‐in-‐indonesia-‐require-‐coal-‐exporters-‐to-‐have-‐licenses.html Note that enforcement of this cap will be complicated by the presence of up to 60 Mt of unreported Indonesian exports. 24 http://timesofindia.indiatimes.com/home/environment/pollution/China-‐suggests-‐cap-‐on-‐coal-‐use-‐import-‐curbs-‐in-‐draft-‐air-‐pollution-‐law/articleshow/42168590.cms 25 CTI and ETA, Carbon Supply Cost Curves: Evaluating Financial Risk to Coal Capital Expenditures.

22 Sep 2014 15
Australia -‐ record numbers of delayed or cancelled projects Recently overtaken by Indonesia as the world's largest exporter of thermal coal (on both a tonnage and energy-‐adjusted basis), Australia's supply of thermal coal has nonetheless been growing strongly. From 2013-‐2015 Citi predicts Australia's thermal coal supply to expand by 29 Mt (40% of global supply growth over this period), as "brownfield" expansions of existing mines (approved during periods of $90/tonne+ prices) are completed and producers with take-‐or-‐pay rail contracts seek to lower unit costs through increased production.26 More notable is the Australian growth that has not occurred -‐ as projects planned in earlier years are delayed or abandoned as a result of declining prices, infrastructure bottlenecks, and rising prices. As of 2010 Citi tabulated 55 thermal coal projects in Australia (mostly "greenfield" projects) with a combined capacity of 368 Mt (i.e. 2.6X Australia's 2010 thermal coal exports of 140 Mt). As of May 2014, however, only 15 projects (representing 74 Mtpa of capacity) had been completed, while 28 projects (representing 177 Mtpa of capacity) had been delayed or abandoned (with the bulk of the remaining projects having received approval but not yet commenced construction).27 To put that into perspective, the combined capacity of delayed/abandoned projects since 2010 nearly equals Australia's entire 2014 thermal export capacity. Table 4: Planned projects in 2010 v Current Progress by Volume (lhs) & planned projects in 2010 v Current Progress by Number (rhs)
Project Status Thermal Capacity (Mtpa) % Project Status # of Projects % Delivered 75 20% Delivered 16 29% Construction 16 4% Construction 2 4% Approved/Committed 77 21% Approved/Committed 3 5% Ongoing 25 7% Ongoing 6 11% Delayed 114 31% Delayed 15 27% Abandoned 63 17% Abandoned 13 24%
Total 368 100% Total 55 100% Source: BREE and Citi Research
A primary barrier to expanding Australia's thermal coal exports is that current export levels are already stressing port and rail infrastructure in the states of Queensland and New South Wales (where 95%+ of Australia's coal is produced).28 The need to build new infrastructure increases capex requirements and return hurdles for new projects -‐ a point that our companion case study on the Galilee Basin brings into sharp relief. Leaving aside the financial burden of new transport infrastructure, capex for many Australian greenfield projects is rising as a result of the shift toward progressively deeper and lower-‐quality coal seams. Producer “strip ratios” measure the ratio of waste material to coal extracted. The figure below shows that from 1991
26 Citi, "Global Thermal Coal: When Cyclical Supply Met Structural Demand," 6. From 2015-‐2018, Citi estimates that Australian supply growth will decline to 16 Mt. 27 Citi, "Global Thermal Coal: When Cyclical Supply Met Structural Demand," 35. 28 CIBC, "Rio Tinto: To Be, Or(e) Not to Be," 57-‐59, June 3 2014.

22 Sep 2014 16
– 2014 strip ratios have been steady increasing for both metallurgical (“met” or “coking” coal) and thermal coal -‐ for thermal, coal from a ratio of 8:1 in 1990 (i.e. 8 tonnes of waste to one tonne of coal) to 10:1 by 2000 to 12:1 by 2010 and now at 14:1.29 Because Australia’s shallowest coal seams closest to the coast have all been mined, cost of producing thermal coal is substantially higher today than it was even five or ten years ago. Despite increased focus of producers on operating efficiencies, costs may stay high (relative to historical standards) just as prices wrestle with structural downward pressure. Figure 6: Queensland coal mining "strip ratios" by product, FY91 -‐ FY14E
Source: Queensland ROM Longer-‐term, Australia resembles Indonesia in having substantial potential new capacity that would be, largely, uneconomic at current prices. Assuming a price threshold of $75/tonne that emerges from our 2014-‐2035 supply-‐demand analysis, over the next 20 years Australia's potential export capacity is 152.6 Mtpa.30 The capex requirements of potential greenfield projects, however, preclude profitable development unless future prices stabilize near $100/tonne or above. Our companion supply analysis examines the implications of this for the many companies (including Whitehaven Coal, New Hope Coal, Yancoal Australia, Adani, GVK, BHP and Glencore Xstrata) with potential exposure to greenfield Australian thermal coal mines. Russia -‐ all about rail If for Australian producers rail costs are an issue, for Russian producers they arguably are the issue. Russia's main thermal coal export mines are in the Kuzbass region of western Siberia. The low mining costs of these mines are offset by extreme rail haul distances (4,750 km to Murmansk and 5,450–6,000 km to Pacific coast ports); these distances lead to railway tariffs of up to $30/tonne, and all-‐in rail transport costs (railway tariff, fuel, and railcar rental costs) of up to $40-‐50/tonne. Aside from having to contend with long haul distances,
29 For comparison, current strip ratios for Indonesia's four largest coal miners -‐ who, it should be noted, typically mine coal of much lower energy content -‐ range from 4.4:1 to 10.7:1. Citi," Global Thermal Coal: When Cyclical Supply Met Structural Demand," 32, Figure 60. 30 CTI and ETA, Carbon Supply Cost Curves: Evaluating Financial Risk to Coal Capital Expenditures.

22 Sep 2014 17
Russia's rail infrastructure has been beset by persistent underinvestment. The IEA estimates an investment gap of $1.4 billion per year from 2006-‐2011 leading Russian authorities in 2011 to declare 7% of Russia's entire railway system to be a bottleneck, hampering transport.31 The IEA further projects no medium-‐term improvement on this score. The primacy of rail costs in Russian coal production makes the country's thermal export supply curve extremely flat. Recent prices have put Russia's export coal mines under considerable financial duress, leading some mines to close or curtail production, and the government to temporarily freeze rail tariffs. Through 2035, our companion supply analysis estimates that a price of $75/tonne would allow the profitable export of up to only 16 Mtpa (i.e. less than half of the country's 2014 potential export capacity -‐ 80%+ of which, as noted above, does not appear profitable at current prices even on a cash-‐cost basis).32 In the short to medium term, however, there is the possibility for government aid (intended to protect jobs and local economies) to keep Russian production above this 40 Mtpa level. Colombia Colombia is distinct from the other four exporters reviewed here in (1) supplying primarily to the Atlantic rather than Pacific market (in 2012 Colombia sent over 70% of its exports to Europe and over 20% to North and South America); and (2) having production concentrated in a few large, low-‐cost, surface mines, such as Cerrejon and El Descanso (which are largely controlled by multinational diversified mining companies). Our companion supply analysis estimates that over the next twenty years these two mines have the potential to achieve combined average annual production of over 70 Mtpa, with Colombia as a whole having the potential to produce closer to 80 Mtpa.33 Over this period Colombian exports may also increasingly go to Asia, as expansion of the Panama Canal enables more cost-‐effective shipping of Colombian coal to China. South Africa In response to the emergence of the Pacific thermal coal export market, over the last decade South Africa has pivoted from sending less than 20% of its coal exports to Asia in 2003 to sending 85% in 2012.34 South Africa has, in particular, become an important supplier to the Indian market (which, like China, accepts lower-‐quality coal than do many European importers). Thanks to its competitive positioning on the global cost curve, our companion supply analysis estimates that with a price of $75/tonne South African potential thermal coal exports may decline to 56.4 Mtpa (relative to 2014 capacity of nearly 80 Mtpa).35 Despite competitive supply costs and a 30 billion tonnes of remaining reserves36, however, expansion of South Africa's thermal coal exports is constrained by (1) relatively limited remaining coal reserves in the traditional mining areas around the Witbank Coalfield; and (2) infrastructure bottlenecks (i.e. rail links to the Richards Bay Coal Export Terminal) that hamper development of other coal reserves such as those in the Waterberg coal field.
31 IEA, Medium-‐Term Coal Market Report 2013, 48-‐51. 32 CTI and ETA, Carbon Supply Cost Curves: Evaluating Financial Risk to Coal Capital Expenditures. 33 CTI and ETA, Carbon Supply Cost Curves: Evaluating Financial Risk to Coal Capital Expenditures. 34 IEA, Medium-‐Term Coal Market Report 2013, 44. 35 CTI and ETA, Carbon Supply Cost Curves: Evaluating Financial Risk to Coal Capital Expenditures. 36 BP, BP Statistical Review of World Energy June 2014, “Coal: reserves".
22 Sep 2014 18
US domestic coal market: Declining demand and prices leading to bankruptcies and weak share prices37 The past five years have been a rough time for US coal producers. 93% of total US coal consumption occurs in the electric power sector.38 Since 2008, coal consumption by US power plants has declined as a result of:
1. The 2008-‐2009 economic recession and increases in energy efficiency eliminating growth in US electricity consumption (with 2008-‐2013 retail electricity sales actually declining at a CAGR of 0.2%);
2. The shale-‐driven decrease in natural gas prices, with Henry Hub prices falling from an average of over $9/MMBtu in 2008 to under $4/MMBtu in 2013 and leading utilities to increase gas-‐fired generation at the expense of coal-‐fired generation;
3. Absence of development of new coal-‐fired plants (owing to weak economics and regulatory pressures) and closure of existing plants;
4. Increasing generation from wind and solar resources; and 5. Implementation of US Environmental Protection Agency (US EPA) regulations on air pollution from
power plants, specifically the Mercury and Air Toxics Standards (MATS), the National Ambient Air Quality Standards, and the “Clean Power Plan” limits on carbon pollution.39
From 2008-‐2013 net electricity generation from US coal-‐fired power plants declined at a 4.4%, resulting in a level of 2013 US coal consumption that was 17% lower than the 2008 level (i.e. 839 million metric tonnes in 2013, versus over 1 billion metric tonnes in 2008). Summing the projected impact of renewable and gas-‐fired plant growth, coal plant retirements, and the EPA’s Clean Power Plan to reduce carbon pollution from existing power plants, Bernstein Research estimates that by the end of the decade coal burn by US power plants will decline by as much as 228 million short tons (i.e. 207 million metric tonnes)40; this decline is equal to one-‐quarter of 2013 consumption of coal by US power plants (or roughly one-‐third of 2013 US coal production). The projected decline in US coal burn is expected to result largely from closure of existing generating capacity -‐ with the US EPA projecting retirement of nearly 180 GW of coal-‐fired power generation capacity between now and 2020.41
37 For more in-‐depth discussion of challenges facing US coal industry, see Tom Sanzillo and Cathy Kunkel, "NYC and NYS pension funds should divest coal stocks: A shrinking industry, weak upside, and wrong on climate change," IEEFA, May 8 2014, http://www.ieefa.org/wp-‐content/uploads/2014/05/NYCNYS-‐pension-‐funds-‐should-‐divest-‐coal-‐stocks-‐IEEFA-‐Final58141.pdf 38 US Energy Information Administration (EIA), "US Coal Consumption by End-‐Use Sector, 2008-‐2014," http://www.eia.gov/coal/production/quarterly/pdf/t32p01p1.pdf 39 For more discussion of these regulations, see CTI and IEEFA, Thermal coal demand: comparing projections and examining risks, Appendix C. 40 Bernstein Research, "Bernstein Energy & Power: The Coming Sea Change in Power Sector Coal and Gas Burn and Its Implications for Demand," September 2014. 41 The White House Press Office, "Presidential Memorandum -‐ Power Sector Carbon Pollution Standards", June 25 2013, http://www.whitehouse.gov/the-‐press-‐office/2013/06/25/presidential-‐memorandum-‐power-‐sector-‐carbon-‐pollution-‐standards. US Environmental Protection Agency (EPA), "EPA Fact Sheet: Clean Power Plan," http://www2.epa.gov/carbon-‐pollution-‐standards/fact-‐sheet-‐clean-‐power-‐plan-‐overview.

22 Sep 2014 19
Figure 7: US Total coal consumption and average annual CAPP spot price, 2008-‐2013
Source: Prices are for CAPP 12,500 Btu, 1.2 SO2 coal, FOB.
Source: EIA, CTI/ETA analysis 2014 Negative demand growth has led US coal producers to curb production, with annual US coal production falling 16% from 2008 to 2013 (i.e. from over 1100 million short tons in 2008 to 984 million short tons in 2013).42 Major US coal producers continue to shutter excess capacity, with Alpha Natural Resources (currently the seventh largest US coal producer by market cap) recently announcing plans to close eleven mines in West Virginia.43 These cutbacks in production, however, have been unable to prevent a decline US coal prices, with August 2014 spot prices for US Central Appalachian coal declining to $60/ton from an average 2008 price of nearly $120/ton. Moreover, despite an uptick in US coal consumption in the first half of 2014 as a result of a severe winter and a short-‐term spike in natural gas prices, headwinds for US coal producers are likely to continue. As detailed in our companion report on coal demand,44 each of the trends listed above -‐ flat electricity demand due to increasing energy efficiency initiatives, plus increasing generation from natural gas and renewables -‐ will continue or accelerate over the rest of this decade. Moreover, existing and forthcoming EPA regulations on air pollution from power plants may result in the closure of 90 GW of coal-‐fired plants by 2025 (nearly one-‐third of the US coal fleet).45 The supply-‐demand dynamics outlined above have led to serious financial dislocations for US coal producers. Recent years have seen 26 US coal companies go into bankruptcy (chiefly in Kentucky and West Virginia), including once major producers such as James River Coal and Patriot Coal Corporation (each of which, at the 42 EIA, "US Coal Production, 2008-‐2014," http://www.eia.gov/coal/production/quarterly/pdf/t1p01p1.pdf. 43 David Conti, "Emerald coal mine in Greene County to close next year," Trib Live, Aug 6 2014, http://triblive.com/news/adminpage/6568995-‐74/coal-‐emerald-‐alpha#axzz3CAkxkkGo. 44 CTI and IEEFA, Thermal coal demand: comparing projections and examining risks. 45 Bernstein Research, "Bernstein Energy & Power: The Coming Sea Change in Power Sector Coal and Gas Burn and Its Implications for Demand," September 2014.
119
6872
8772 71
0
20
40
60
80
100
120
140
0
200
400
600
800
1000
1200
2008 2009 2010 2011 2012 2013
USD
per to
n
Million tons
Electric Power Sector Other US Central Appalachian coal spot price index ‡
22 Sep 2014 20
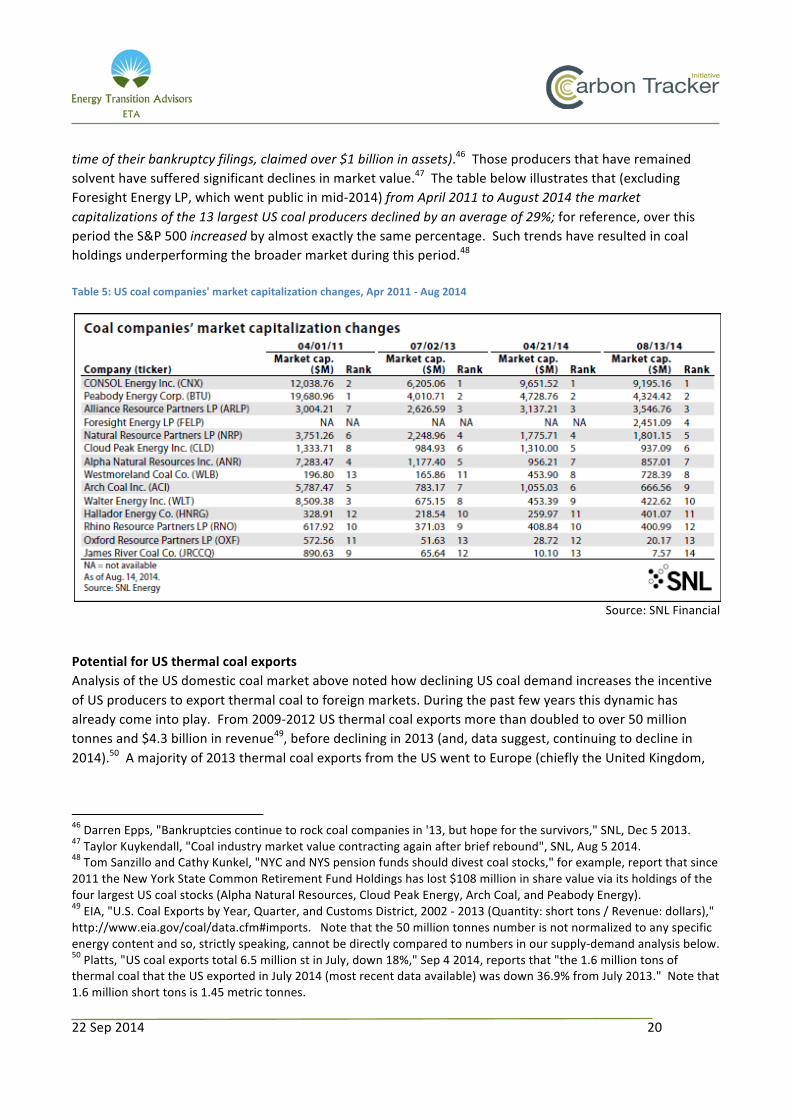
time of their bankruptcy filings, claimed over $1 billion in assets).46 Those producers that have remained solvent have suffered significant declines in market value.47 The table below illustrates that (excluding Foresight Energy LP, which went public in mid-‐2014) from April 2011 to August 2014 the market capitalizations of the 13 largest US coal producers declined by an average of 29%; for reference, over this period the S&P 500 increased by almost exactly the same percentage. Such trends have resulted in coal holdings underperforming the broader market during this period.48 Table 5: US coal companies' market capitalization changes, Apr 2011 -‐ Aug 2014
Source: SNL Financial
Potential for US thermal coal exports Analysis of the US domestic coal market above noted how declining US coal demand increases the incentive of US producers to export thermal coal to foreign markets. During the past few years this dynamic has already come into play. From 2009-‐2012 US thermal coal exports more than doubled to over 50 million tonnes and $4.3 billion in revenue49, before declining in 2013 (and, data suggest, continuing to decline in 2014).50 A majority of 2013 thermal coal exports from the US went to Europe (chiefly the United Kingdom,
46 Darren Epps, "Bankruptcies continue to rock coal companies in '13, but hope for the survivors," SNL, Dec 5 2013. 47 Taylor Kuykendall, "Coal industry market value contracting again after brief rebound", SNL, Aug 5 2014. 48 Tom Sanzillo and Cathy Kunkel, "NYC and NYS pension funds should divest coal stocks," for example, report that since 2011 the New York State Common Retirement Fund Holdings has lost $108 million in share value via its holdings of the four largest US coal stocks (Alpha Natural Resources, Cloud Peak Energy, Arch Coal, and Peabody Energy). 49 EIA, "U.S. Coal Exports by Year, Quarter, and Customs District, 2002 -‐ 2013 (Quantity: short tons / Revenue: dollars)," http://www.eia.gov/coal/data.cfm#imports. Note that the 50 million tonnes number is not normalized to any specific energy content and so, strictly speaking, cannot be directly compared to numbers in our supply-‐demand analysis below. 50 Platts, "US coal exports total 6.5 million st in July, down 18%," Sep 4 2014, reports that "the 1.6 million tons of thermal coal that the US exported in July 2014 (most recent data available) was down 36.9% from July 2013." Note that 1.6 million short tons is 1.45 metric tonnes.

22 Sep 2014 21
the Netherlands, and Italy), with only 15% reaching Pacific importers such as South Korea, Taiwan, India, Japan, and China. Figure 8: US thermal coal exports (left-‐hand side) and export revenue (right-‐hand side), 2002-‐2013
Source: EIA, CTI/ETA analysis 2014
With 2012-‐2013 US exports accounting for only 6% or so global exports, US coal miners see plenty of room for expansion. Average 2014-‐2035 potential thermal export production capacity of 163 Mtpa is 4X the 2014 level of 39 Mtpa.51 Expansion of the US potential to produce export thermal coal is heavily concentrated in the Powder River Basin (PRB), a region in Southeast Montana and Northeast Wyoming that is a center of US thermal coal production. Five large PRB mines, four of which export some amount of thermal coal already, account for over 60% of the potential incremental export production capacity that the US is projected to add through 2035 (i.e. 73.5 Mtpa of 124 Mtpa).
51 Based on analysis of data from Wood Mackenzie's GEM database. Estimates here of US potential thermal coal export production capacity are normalized to an energy content of 6,000 kcal/kg.
0.00
0.50
1.00
1.50
2.00
2.50
3.00
3.50
4.00
4.50
0.0
10.0
20.0
30.0
40.0
50.0
60.0
2002 2003 2004 2005 2006 2007 2008 2009 2010 2011 2012 2013
billion
USD
Million tonn
es
Exports (lhs) Revenue (rhs)

22 Sep 2014 22
Table 6: 60% of potential incremental US thermal coal export capacity from five large Powder River Basin mines, 2014-‐2035
Increase in thermal coal export production capacity, 2014-‐2035
Standardized BECP (Newcastle equivalent price), avg. 2014-‐2035
Black Thunder 30.3 82.1 North Antelope Rochelle 19.8 87.7 School Creek 12.8 80.9 Bull Mountain 5.8 76.1 Spring Creek 4.7 78.6
Total 73.5 N/A % of total incremental US
capacity 2014-‐2035 60%
Note: BECP is breakeven coal price.
Source: Energy Economics, using Wood Mackenzie Global Economic Model and CTI/ETA analysis 2014 Our analysis of the global market for thermal coal exports, however, questions the ability of the US thermal coal miners to profitably increase exports. Applying a threshold BECP of $75/tonne to the US supply curve for thermal coal exports yields average annual 2014-‐2035 exports of only 31.4 Mtpa52; this suggests only 20% of potential capacity to be capable of profitably exporting. Figure 9: US potential thermal coal export production capacity, 2014-‐2035
Note: BECP is breakeven coal price; NAR is net-‐as-‐received Source: Cost and supply data from Energy Economics, using Wood Mackenzie Global Economic Model; price data from Bloomberg LP, and CTI/ETA analysis 2014
52 CTI and ETA, Carbon Supply Cost Curves: Evaluating Financial Risk to Coal Capital Expenditures.
22 Sep 2014 23
Differences in the energy content of actual current US exports complicate the task of comparing our results with historic data. Even assuming relatively low average energy content for current US thermal coal exports53, however, would still suggest our projected average annual 2014-‐2035 level to be roughly 9 million tonnes (or 20%) below the current 2012 high for annual thermal coal exports. In other words, ambitious industry expansion plans notwithstanding, our analysis suggests that companies will struggle to profitably increase US thermal coal exports beyond current levels. As evidence of this, consider that the standardized, Newcastle-‐equivalent BECPs of the five large PRB mines in the table above range from $1-‐13/tonne above our $75/tonne key threshold. A large portion of this cost involves the expense of transporting PRB coal to import buyers, a topic discussed in more detail below. One caveat to be added is that the supply curve for US export thermal coal is very flat (i.e. price-‐elastic) through its middle portions. In other words, small changes in prices may notably expand the potential for profitable export. Our supply-‐demand analysis above, however, concluded that prices for export thermal coal are unlikely to stabilize at the $100+/tonne levels seen from 2008-‐2011. As a result, while long-‐term prices somewhat higher than the $75/tonne in our low-‐coal demand scenario will certainly expand the scope for US thermal coal exports, at best the mines affected will achieve marginal profitability. Challenges of geography and infrastructure Export growth ambitions for US thermal coal must contend with the twin challenges of geography and infrastructure. The Pacific region currently accounts for 75% of the global thermal coal market (in 2012, 681 of 887 Mt)54, a share that is projected to increase through 2035; as noted above, in 2013 only 15% of US exports went to the Pacific. Shipping coal to India or China from, for example, Australia or Indonesia costs less than shipping it from the west coast of the United States. Moreover, currently west coast ports are ill-‐equipped to handle a materially higher volume of coal exports. US thermal coal exports currently travel mostly through ports on the eastern or southern US (e.g. Baltimore, Norfolk, and Houston-‐Galveston), with western ports such as Seattle and Los Angeles (as well as several Canadian ports) playing a minor role.55
53 i.e. ~5000 kcal/kg, consistent with the reference energy content of PRB coal 54 IEA, Medium-‐Term Coal Market Report 2013, 41. 55 EIA, " U.S. Coal Exports by Year, Quarter, and Customs District, 2002 -‐ 2013 (Quantity: short tons / Revenue: dollars)," http://www.eia.gov/coal/data.cfm#imports.
22 Sep 2014 24
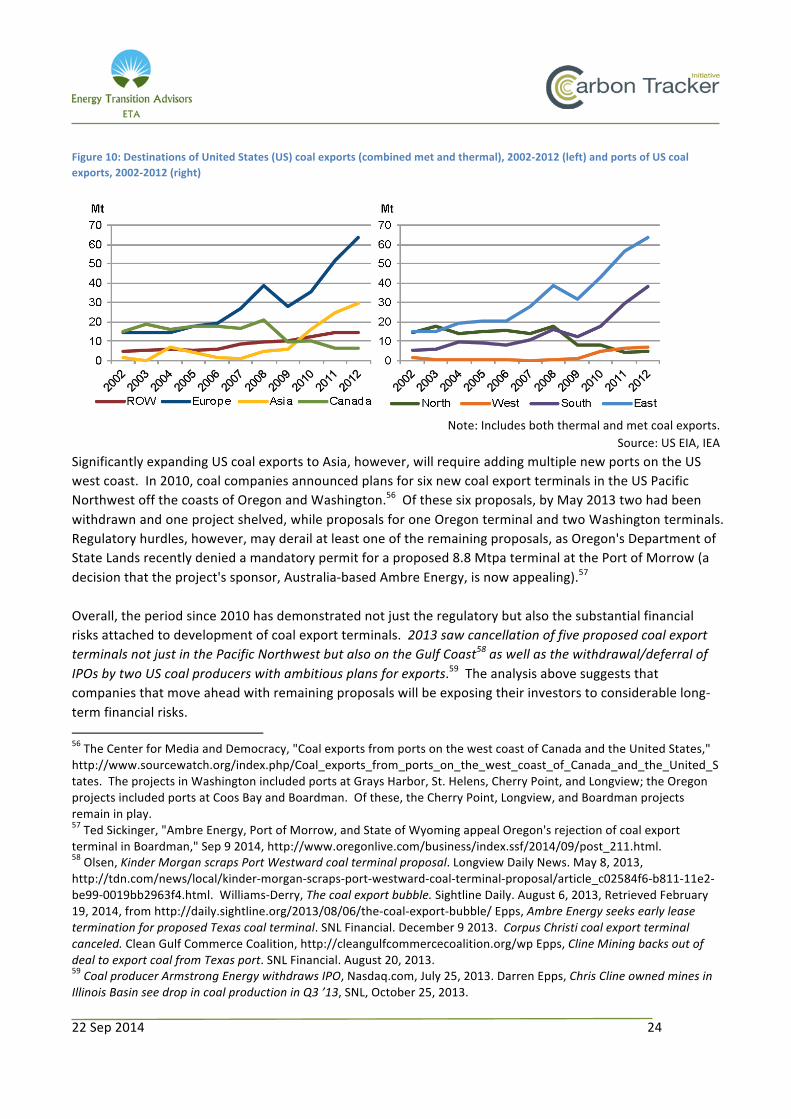
Figure 10: Destinations of United States (US) coal exports (combined met and thermal), 2002-‐2012 (left) and ports of US coal exports, 2002-‐2012 (right)
Note: Includes both thermal and met coal exports.
Source: US EIA, IEA Significantly expanding US coal exports to Asia, however, will require adding multiple new ports on the US west coast. In 2010, coal companies announced plans for six new coal export terminals in the US Pacific Northwest off the coasts of Oregon and Washington.56 Of these six proposals, by May 2013 two had been withdrawn and one project shelved, while proposals for one Oregon terminal and two Washington terminals. Regulatory hurdles, however, may derail at least one of the remaining proposals, as Oregon's Department of State Lands recently denied a mandatory permit for a proposed 8.8 Mtpa terminal at the Port of Morrow (a decision that the project's sponsor, Australia-‐based Ambre Energy, is now appealing).57 Overall, the period since 2010 has demonstrated not just the regulatory but also the substantial financial risks attached to development of coal export terminals. 2013 saw cancellation of five proposed coal export terminals not just in the Pacific Northwest but also on the Gulf Coast58 as well as the withdrawal/deferral of IPOs by two US coal producers with ambitious plans for exports.59 The analysis above suggests that companies that move ahead with remaining proposals will be exposing their investors to considerable long-‐term financial risks. 56 The Center for Media and Democracy, "Coal exports from ports on the west coast of Canada and the United States," http://www.sourcewatch.org/index.php/Coal_exports_from_ports_on_the_west_coast_of_Canada_and_the_United_States. The projects in Washington included ports at Grays Harbor, St. Helens, Cherry Point, and Longview; the Oregon projects included ports at Coos Bay and Boardman. Of these, the Cherry Point, Longview, and Boardman projects remain in play. 57 Ted Sickinger, "Ambre Energy, Port of Morrow, and State of Wyoming appeal Oregon's rejection of coal export terminal in Boardman," Sep 9 2014, http://www.oregonlive.com/business/index.ssf/2014/09/post_211.html. 58 Olsen, Kinder Morgan scraps Port Westward coal terminal proposal. Longview Daily News. May 8, 2013, http://tdn.com/news/local/kinder-‐morgan-‐scraps-‐port-‐westward-‐coal-‐terminal-‐proposal/article_c02584f6-‐b811-‐11e2-‐be99-‐0019bb2963f4.html. Williams-‐Derry, The coal export bubble. Sightline Daily. August 6, 2013, Retrieved February 19, 2014, from http://daily.sightline.org/2013/08/06/the-‐coal-‐export-‐bubble/ Epps, Ambre Energy seeks early lease termination for proposed Texas coal terminal. SNL Financial. December 9 2013. Corpus Christi coal export terminal canceled. Clean Gulf Commerce Coalition, http://cleangulfcommercecoalition.org/wp Epps, Cline Mining backs out of deal to export coal from Texas port. SNL Financial. August 20, 2013. 59 Coal producer Armstrong Energy withdraws IPO, Nasdaq.com, July 25, 2013. Darren Epps, Chris Cline owned mines in Illinois Basin see drop in coal production in Q3 ’13, SNL, October 25, 2013.

22 Sep 2014 25
China domestic coal market Relative to the US domestic coal market, in recent years China's domestic market has followed a different plotline but experienced similar trends of declining domestic prices, consolidation, and financial difficulties for producers. Key differences relative to the US include: (1) broader use of thermal coal (which China currently uses not just for power generation but also for cement, steel, and chemicals production); (2) the last five years seeing significant increases (rather than decreases) in both domestic production and consumption of coal (both up about 40% from 2008-‐2013);60 and (3) a pattern in recent years of rising coal imports (as opposed to an uptick in coal exports). Figure 11: Fixed asset investment (FAI) in China's coal sector (left-‐hand side) and annual additions of new coal production capacity (right-‐hand side)
Note: At current RMB/USD exchange rate of 0.16, estimated 2014 FAI would be $77 billion.
Source: WIND, SXCOAL, Citi Research The similarity between the two markets, however, relates to a supply-‐demand imbalance putting significant downward pressure on prices. Our companion demand report outlines how a variety of forces -‐ a change in the pace and composition of economic growth, increasing energy efficiency, rapid deployment of non-‐fossil energy sources -‐ that is permanently altering the structure of Chinese coal demand. This is occurring during a time when China's domestic coal production -‐ driven by expansion by the country's largest producers -‐ continues to increase. Even though fixed asset investment in China's coal sector peaked in 2012, already-‐committed investments continue to increase China's coal capacity -‐ by 400Mt in 2013 (i.e. 11% of China's actual 2012 production) and an estimated 300-‐350 Mt in each of 2014 and 2015.61 The result has been a plunge in China's domestic coal price, for example by nearly $20/t from just January to August of this year (during which time Shenhua Energy, one of China's largest coal producers, cut its term-‐contract price six times).
60 BP, BP Statistical Review of World Energy June 2014, “Coal: production" and "Coal: consumption." 61 Citi, "Global Thermal Coal: When Cyclical Supply Met Structural Demand," 36 and BP, BP Statistical Review of World Energy June 2014, “Coal: production."

22 Sep 2014 26
Figure 12: FOB Qinhuangdao 5500 kcal/kg net-‐as-‐received coal price ($/Mt): Jun 6 – Sep 5, 2014
Source: Platts
Price declines have resulted in a situation where 50-‐70% of Chinese coal companies are losing money62 and inventories and unsold stocks at mines have reached record levels. In response, China's National Energy Administration has mandated the closure of 1,725 mines representing 117 Mt of combined capacity (c.2% of China's total coal capacity). Analysts question whether this will do much to remedy China's supply-‐demand imbalance owing to (1) the small amount of capacity to exit; and (2) that many of these smaller, high-‐cost mines had already idled production in response to falling prices. Continued rationalization of China's coal industry may create conditions for a short-‐lived price recovery. Looking over the next twenty years, however, supply-‐demand analysis in our companion report questions the economic prospects for up to one-‐quarter of production capacity for China's domestic thermal coal capacity (i.e. 1000 Mtpa 2014-‐2035). This finding fits alongside the possibility for China to soon revert to being a net exporter of thermal coal, a topic our companion demand report explores in more detail.
62 Bloomberg News, "China to Fine Coal Miners Exceed Output Limits as Prices Drop," Aug 21 2014, http://www.bloomberg.com/news/2014-‐08-‐21/china-‐to-‐fine-‐coal-‐miners-‐exceeding-‐output-‐limits-‐as-‐prices-‐drop.html

22 Sep 2014 27
3. Detailed financial analysis of publicly-‐listed coal-‐mining companies
To examine a broader cross-‐section of firms than the 32 that are contained in the Bloomberg Global Coal Index, we survey 2000-‐2013 data on companies that the Industry Classification Benchmark (IBC) system groups into the Coal subsector.63 Out of all the companies in this category, we focus on 83 that (as of August 2014) have a market capitalization above $200 million.64 We classify companies into separate groups depending on whether they produce thermal coal, met coal, or both. Companies that produce both are classified as “met” or “thermal” only in the event that one of the two segments accounted for 75% or more of total 2013 coal revenue; otherwise the company is classified as “balanced.” The table below provides a breakdown of the companies in our universe. For additional detail, see Appendix B. Following the theme of our companion report65, our focus throughout is on the thermal coal market. Data on metallurgical coal producers is provided as a basis for comparison and is generally not explored in detail. We note that substitutes for met coal are not generally available and so demand follows steel/iron ore demand. Thermal coal is easily substitutable in power markets as discussed. Note that this universe excludes coal producers that the IBC system classifies as diversified mining and metals companies. We review a sample of the largest coal-‐producing diversified mining companies in the next section. Table 7: Summary statistics on universe of coal companies
Source: Bloomberg LP, CTI/ETA analysis 2014
Our universe of listed companies includes several that are majority-‐owned by local or national governments (e.g. Coal India, various Chinese producers). That said, the figure below illustrates that focusing on listed companies results in the underrepresentation of coal production capacity in non-‐OECD countries.66 As completely unlisted state-‐owned firms generally finance projects via funds from internal operations,
63 Basic Materials (industry) >> Basic Resources (supersector) >> Mining (sector) >> Coal (subsector). http://www.icbenchmark.com/Site/ICB_Structure 64 Though this threshold may seem low, note that the median market cap for firms in our sample is $1.2 billion; only eight companies have a market cap above $5 billion, and only three have a market cap above $10 billion. 65 CTI and ETA, Carbon Supply Cost Curves: Evaluating Financial Risk to Coal Capital Expenditures. 66 Note, though, that export-‐focused producers outside the OECD such as Indonesia, Colombia, and South Africa have a high degree of listed private-‐sector ownership. IEA, Special Report: World Energy Investment Outlook, 57, Figure 2.4, 2014.
# of Companies Combined Market Cap ($bn)
Thermal Coal Companies 44 $152.5
Met Coal Companies 23 $27.3
Balanced Coal Companies 16 $35.6
Total 83 $215.4

22 Sep 2014 28
however -‐ as opposed to via debt and equity from banks and capital markets -‐ trends related to listed firms are the relevant focal point for investors interested in carbon asset risk related to coal.
Figure 13: Ownership structure of hard coal production capacity, 2012
Source: Wood Mackenzie databases; IEA analysis
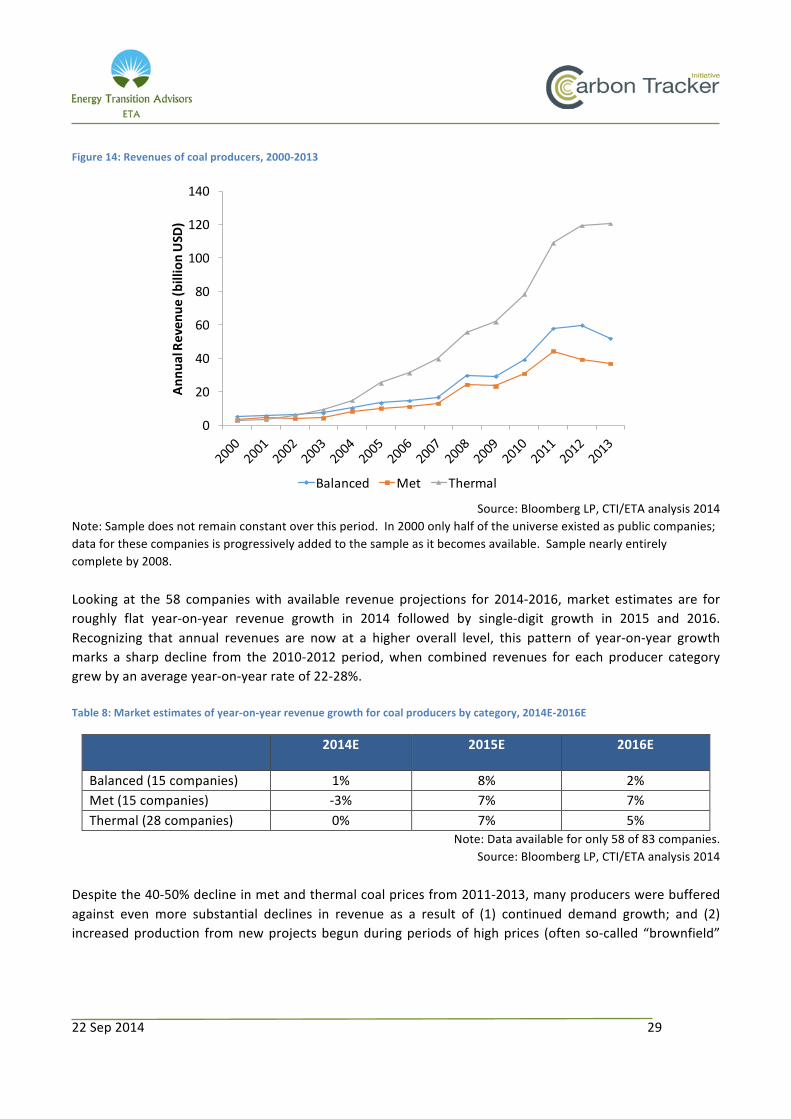
Revenues, margins, and returns on investment/shareholder equity The figure below depicts annual combined revenues by producer category for the companies in our universe. Note that part of the increase here reflects new firms coming into our sample. In 2000 only roughly half of these entities existed as publicly-‐traded companies, with the other half emerging in the public markets between 2000 and 2008 (an active time for coal-‐related initial public offerings). From 2008-‐2011, however, combined revenues for each producer category nearly doubled as a result of increasing production and the post-‐financial crisis rebound in coal prices. Relative to 2011 revenues, however, combined 2013 annual revenues were 10% lower for balanced producers, 17% lower for met producers, and only 11% higher for thermal producers.
22 Sep 2014 29
Figure 14: Revenues of coal producers, 2000-‐2013
Source: Bloomberg LP, CTI/ETA analysis 2014
Note: Sample does not remain constant over this period. In 2000 only half of the universe existed as public companies; data for these companies is progressively added to the sample as it becomes available. Sample nearly entirely complete by 2008. Looking at the 58 companies with available revenue projections for 2014-‐2016, market estimates are for roughly flat year-‐on-‐year revenue growth in 2014 followed by single-‐digit growth in 2015 and 2016. Recognizing that annual revenues are now at a higher overall level, this pattern of year-‐on-‐year growth marks a sharp decline from the 2010-‐2012 period, when combined revenues for each producer category grew by an average year-‐on-‐year rate of 22-‐28%. Table 8: Market estimates of year-‐on-‐year revenue growth for coal producers by category, 2014E-‐2016E
2014E 2015E 2016E
Balanced (15 companies) 1% 8% 2% Met (15 companies) -‐3% 7% 7% Thermal (28 companies) 0% 7% 5%
Note: Data available for only 58 of 83 companies. Source: Bloomberg LP, CTI/ETA analysis 2014
Despite the 40-‐50% decline in met and thermal coal prices from 2011-‐2013, many producers were buffered against even more substantial declines in revenue as a result of (1) continued demand growth; and (2) increased production from new projects begun during periods of high prices (often so-‐called “brownfield”
0
20
40
60
80
100
120
140An
nual Reven
ue (b
illion USD
)
Balanced Met Thermal

22 Sep 2014 30
expansions of existing mines).67 More significant than recent declines in revenue, then, have been declines in operating profits. One basic measure of operating profit is earnings before interest and taxes (EBIT); EBIT margin refers to EBIT as a share of revenue. Combining annual EBIT and revenue across each of the three producer categories, the figure below shows annual EBIT margins from 2000-‐2013.68 Note the sharp decline in EBIT margins across all three categories from 2011-‐2013. As of 2013, the combined EBIT margin for each producer category had declined to its lowest point since roughly 2003 (with the average margin for thermal producers slightly below the 2003 level). Figure 15: EBIT margin by producer category, 2000-‐2013
Source: Bloomberg LP, CTI/ETA analysis 2014
For the subset of firms with EBIT projections for 2014-‐2016, market estimates show combined EBIT margins trending up slightly for balanced and (eventually) met producers, while holding steady for thermal producers.
67 Additionally, as discussed above, due to extensive use of long-‐term contracts in at least export coal markets, prices received by producers tend to lag changes in the spot price, delaying the impact to revenues as a result of declining prices. 68 Taking a market-‐cap weighted average of the EBIT margins of individual companies within each category shows slightly different annual values but a similar trend.
0%
5%
10%
15%
20%
25%
30%
EBIT m
argin
Balanced Met Thermal

22 Sep 2014 31
Table 9: Market estimates of EBIT margins coal producers by category, 2014E-‐2016E
2014E 2015E 2016E
Balanced (10 companies) 7% 10% 12% Met (20 companies) -‐4% 5% 9% Thermal (8 companies) 17% 17% 18%
Note: Data available for only 38 of 83 companies. Source: Bloomberg LP, CTI/ETA analysis 2014 The primary driver of declining EBIT margins has been the post-‐2011 40-‐50% decline in spot prices for both met and thermal coal (which, as discussed above, continue to make their way through to long-‐term producer contracts). Additionally, however, producers in many countries have also been experiencing lower margins due to rising costs of production and declining productivity. In Australia, for example, a mining boom and resulting supply chain pressures helped to increase the cost of inputs to coal production (e.g. labor, power, and rail costs) by 7-‐20% from 2006 to 2014 (while also spurring the Australian dollar to appreciate against the US dollar by 5%).69 Moreover, Goldman Sachs estimates that after growing at a +2% CAGR from 1986-‐2001, average productivity of coal miners in the US, Australia, and China declined at a CAGR of 5% from 2002-‐2012.70 Such productivity declines are one reason that these three countries dominate the list of miners (both large and small) that recorded negative EBIT margins for 2013 – though other trends (e.g. the appreciation of the Australian dollar, which harms the bottom line of Australian exporters) also played a significant role as well.
69 CIBC, "Rio Tinto" 56. 70 Goldman Sachs, "The Thermal Coal Paradox," May 23 2014, 16.

22 Sep 2014 32
Table 10: Firms with negative EBIT margins for 2013
Company Category Country Market Cap
(USD million) 2013 EBIT margin
(%) HIDILI INDUSTRY INTL DEVELOP
Balanced China 229.6 -‐31.2
ALPHA NATURAL RESOURCES INC
Balanced US 710.5 -‐15.7
RASPADSKAYA Met Russia 394.8 -‐13.3 WALTER ENERGY INC Met US 357.4 -‐9.0 WHITEHAVEN COAL Met Australia 1500.8 -‐8.2 ARCH COAL INC Met US 675.1 -‐5.6 KINETIC MINES AND ENERGY LTD
Thermal China 478.6 -‐90.5
TAIYUAN COAL GASIFICATION
Thermal China 586.1 -‐32.9
YANCOAL AUSTRALIA LTD
Thermal Australia 232.4 -‐13.8
DATONG COAL INDUSTRY CO
Thermal China 1437.6 -‐1.5
SHANGHAI ACE CO Thermal China 614.0 -‐0.4 Source: Bloomberg LP, CTI/ETA analysis 2014
Declining EBIT margins have intensified producer focus on reducing costs as a way to improve profitability. Ironically, however, declining margins -‐ largely a result of low prices -‐ have spurred some producers to increase production as a way to maximize economies of scale and hence lower per unit costs. In the aggregate, however, such strategies work to exacerbate conditions of oversupply that are in part the cause of low margins to begin with.

22 Sep 2014 33
ROIC below WACC signals weak value-‐creation in the coal industry Declining margins have eroded the ability of coal miners to generate returns for investors. Return on invested capital (ROIC) is a measure of a firm's efficiency at directing its capital toward profitable investments.71 Comparing a company's return on capital (ROIC) with its weighted average cost of capital (WACC)72 can illuminate whether capital has been invested effectively. The figure below illustrates the evolution of ROIC for each producer category from 2000-‐2013. As expected, high (albeit volatile) coal prices from 2003-‐2011 enabled firms to enjoy average ROIC rates of 15-‐20%, versus a global average WACC for the coal sector of around 10%. Post-‐2011, however, declining coal prices and diminished margins have reduced ROIC to at or below the coal sector's global average WACC -‐ a signal of poor value-‐creation (or outright value-‐destruction) for investors. The evolution of Return on Equity (ROE) -‐ a narrower measure than ROIC which focuses just on returns for equity holders -‐ tells a similar story, with average ROE levels declining from 25-‐40% to near or below the coal sector's 10.9% global average cost of equity. Figure 16: Average Return on Invested Capital (ROIC) by producer category, 2000-‐2013
Note: Annual averages are weighted by market cap. Source: Bloomberg LP, CTI/ETA analysis 2014. WACC estimate from NYU Professor Answath Damodoran using
Bloomberg and S&P Capital IQ data.
71 ROIC is calculated as (Net income – dividends) / total capital. 72 Weighted average cost of capital measures takes into account a company's cost of equity and cost of debt, as well as its mix between equity and debt.
22 Sep 2014 34
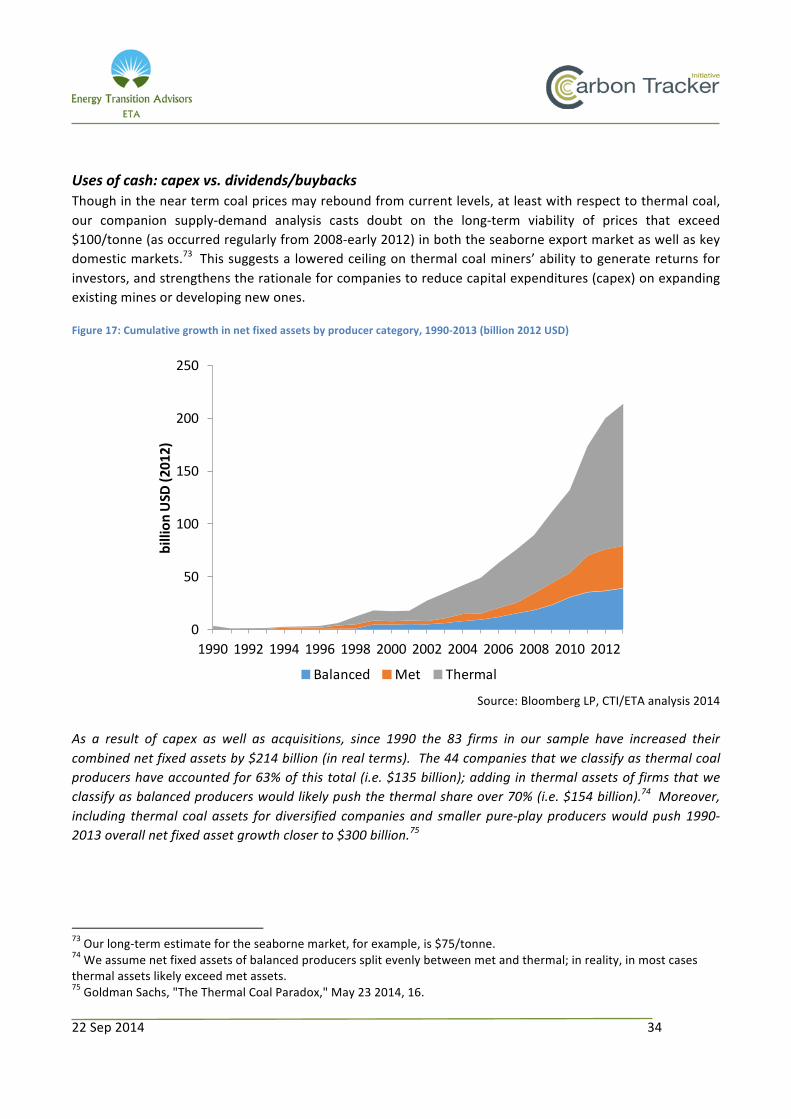
Uses of cash: capex vs. dividends/buybacks Though in the near term coal prices may rebound from current levels, at least with respect to thermal coal, our companion supply-‐demand analysis casts doubt on the long-‐term viability of prices that exceed $100/tonne (as occurred regularly from 2008-‐early 2012) in both the seaborne export market as well as key domestic markets.73 This suggests a lowered ceiling on thermal coal miners’ ability to generate returns for investors, and strengthens the rationale for companies to reduce capital expenditures (capex) on expanding existing mines or developing new ones. Figure 17: Cumulative growth in net fixed assets by producer category, 1990-‐2013 (billion 2012 USD)
Source: Bloomberg LP, CTI/ETA analysis 2014
As a result of capex as well as acquisitions, since 1990 the 83 firms in our sample have increased their combined net fixed assets by $214 billion (in real terms). The 44 companies that we classify as thermal coal producers have accounted for 63% of this total (i.e. $135 billion); adding in thermal assets of firms that we classify as balanced producers would likely push the thermal share over 70% (i.e. $154 billion).74 Moreover, including thermal coal assets for diversified companies and smaller pure-‐play producers would push 1990-‐2013 overall net fixed asset growth closer to $300 billion.75
73 Our long-‐term estimate for the seaborne market, for example, is $75/tonne. 74 We assume net fixed assets of balanced producers split evenly between met and thermal; in reality, in most cases thermal assets likely exceed met assets. 75 Goldman Sachs, "The Thermal Coal Paradox," May 23 2014, 16.
0
50
100
150
200
250
1990 1992 1994 1996 1998 2000 2002 2004 2006 2008 2010 2012
billion
USD
(2012)
Balanced Met Thermal

22 Sep 2014 35
China has dominated growth in coal assets since 1990, accounting for 67% of the overall total (i.e. $143 billion), with the vast majority of this relating to thermal coal. The US has supplied the second-‐largest share (20%, or $43 billion), with the rest of the world accounting for 16% (i.e. $29 billion). Figure 18: Cumulative growth in net fixed assets by country, 1990-‐2013 (billion 2012 USD)
Source: Bloomberg LP, CTI/ETA analysis 2014
The above figures encapsulate the challenge facing thermal coal producers. Since 2000, thermal coal miners have been adding capacity to satisfy a world where global demand for thermal coal was growing at a CAGR of 4%. They must now adjust to a world where we project global demand for thermal coal to be essentially flat through 2025 (i.e. grow at a CAGR of 0.1%) before beginning to decline from 2025-‐2035 at a CAGR of -‐0.2%.76 This transition in the rate of demand growth is undermining opportunities for profitable new thermal coal investment. Additionally, with median free cash flow77 levels sinking below total debt levels, there is a pressure to reduce capex in order to defend credit ratings.
76 CTI and IEEFA, Thermal coal demand: comparing projections and examining risks. 77 Free cash flow is calculated as operating cash flow minus capital expenditures.
0
50
100
150
200
250
1990 1992 1994 1996 1998 2000 2002 2004 2006 2008 2010 2012
billion
USD
(2012)
China US ROW

22 Sep 2014 36
Figure 19: Ratio of free cash flow to total debt (median for each producer category), 2000-‐2013
Source: Bloomberg LP, CTI/ETA analysis 2014
As a result of the above conditions, thermal coal miners have throttled down (and, at some point soon, may possibly reverse) the asset growth that has been a defining trend in the coal industry since at least 2000. The figure below illustrates that this process of slowing investment growth has already started. Since 2011 the rolling 4-‐year CAGR of total invested capital by the 44 thermal coal producers in our samples has fallen from 20% to 10% (with balanced and met producers showing a similar trend). Moreover, from 2012 to 2013 the combined capex of these 44 thermal coal producers actually decreased modestly (from $20.3 to $19.4 billion) -‐ the first such year-‐on-‐year decrease since at least 2000. Again, this trend also held across balanced and met producers.
-‐0.10X
-‐0.05X
0.00X
0.05X
0.10X
0.15X
0.20X
0.25X
0.30X
0.35X
2000 2001 2002 2003 2004 2005 2006 2007 2008 2009 2010 2011 2012 2013
Balanced Met Thermal

22 Sep 2014 37
Figure 20: Invested Capital (rolling 4-‐year CAGR), 2003-‐2013
Source: Bloomberg LP, CTI/ETA analysis 2014
Many thermal coal producers, however, have a backlog of delayed or under-‐study projects waiting to commence construction once thermal coal prices pick up. Moreover, the figure below shows that 2013 annual capex for pure-‐play thermal coal producers remained nearly 3X the return of cash to shareholders via dividends and net share repurchases (i.e. "buybacks”). For balanced producers of both met and thermal coal – who, by volume, include many of the largest coal producers78 -‐ the ratio of capex-‐to-‐dividends/buybacks was even higher (4X).79 The ratio of thermal capex to dividends and buybacks has held roughly constant since 2009. Going forward, however, slowing demand growth for thermal coal means that this ratio may have to drop even further as companies forego potentially value-‐destroying investments in favor of returning more cash to shareholders.80 Engaging with thermal coal producers on these critical capital management decisions ought to be a top priority for shareholders concerned with carbon asset risk.
78 For example, for the US this category includes three of the four largest coal producers (Peabody Energy, Arch Coal, and Alpha Natural Resources). 79 Note that neither of these is as high as the 2013 ratio for met coal producers, which was 7X. 80 Note that, in the short term, the deteriorating credit profiles for coal miners noted above may limit the ability to increase return of cash to shareholders.
0%
10%
20%
30%
40%
50%
60%
2003 2004 2005 2006 2007 2008 2009 2010 2011 2012 2013
Invested
Capita
l (Ro
lling 4-‐year C
AGR)
Balanced Met Thermal

22 Sep 2014 38
Figure 21: Capex vs. dividends + share repurchases ("buybacks") by producer category, 2000-‐ 2013
Note: Values over capex totals (e.g. “3X”) reflect aggregate ratio across all three producer categories. Source: Bloomberg LP, CTI/ETA analysis 2014
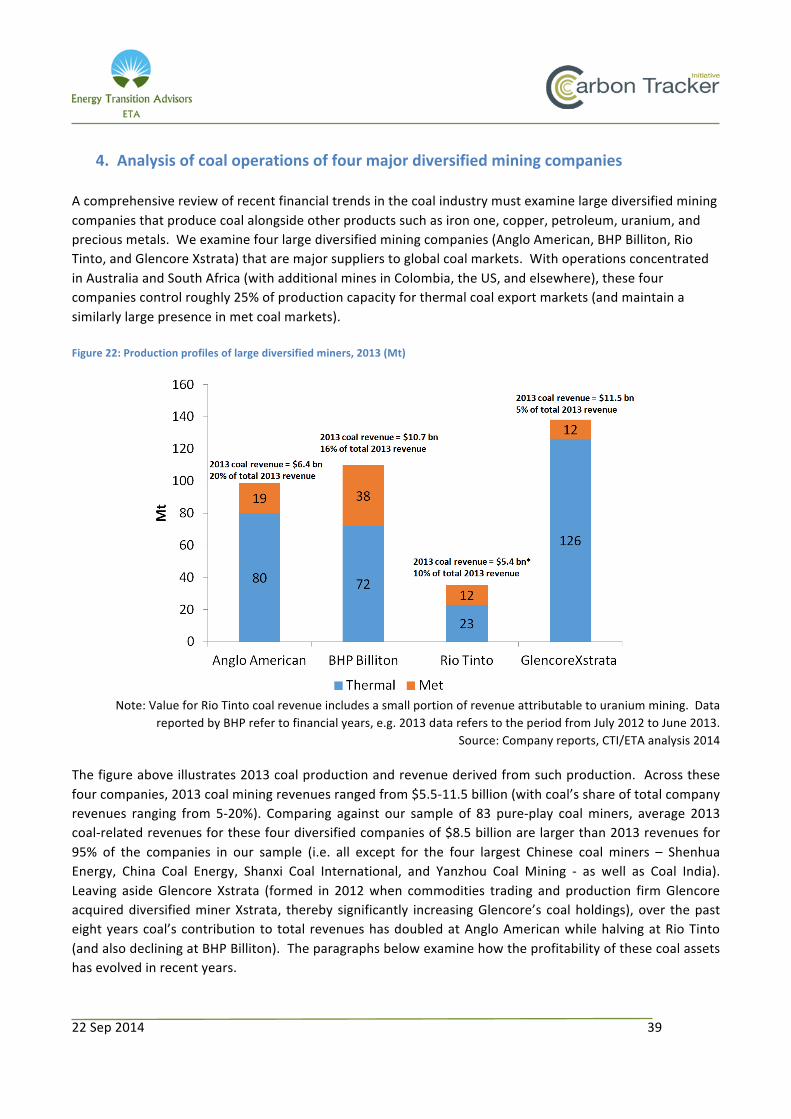
22 Sep 2014 39
4. Analysis of coal operations of four major diversified mining companies A comprehensive review of recent financial trends in the coal industry must examine large diversified mining companies that produce coal alongside other products such as iron one, copper, petroleum, uranium, and precious metals. We examine four large diversified mining companies (Anglo American, BHP Billiton, Rio Tinto, and Glencore Xstrata) that are major suppliers to global coal markets. With operations concentrated in Australia and South Africa (with additional mines in Colombia, the US, and elsewhere), these four companies control roughly 25% of production capacity for thermal coal export markets (and maintain a similarly large presence in met coal markets). Figure 22: Production profiles of large diversified miners, 2013 (Mt)
Note: Value for Rio Tinto coal revenue includes a small portion of revenue attributable to uranium mining. Data
reported by BHP refer to financial years, e.g. 2013 data refers to the period from July 2012 to June 2013. Source: Company reports, CTI/ETA analysis 2014
The figure above illustrates 2013 coal production and revenue derived from such production. Across these four companies, 2013 coal mining revenues ranged from $5.5-‐11.5 billion (with coal’s share of total company revenues ranging from 5-‐20%). Comparing against our sample of 83 pure-‐play coal miners, average 2013 coal-‐related revenues for these four diversified companies of $8.5 billion are larger than 2013 revenues for 95% of the companies in our sample (i.e. all except for the four largest Chinese coal miners – Shenhua Energy, China Coal Energy, Shanxi Coal International, and Yanzhou Coal Mining -‐ as well as Coal India). Leaving aside Glencore Xstrata (formed in 2012 when commodities trading and production firm Glencore acquired diversified miner Xstrata, thereby significantly increasing Glencore’s coal holdings), over the past eight years coal’s contribution to total revenues has doubled at Anglo American while halving at Rio Tinto (and also declining at BHP Billiton). The paragraphs below examine how the profitability of these coal assets has evolved in recent years.
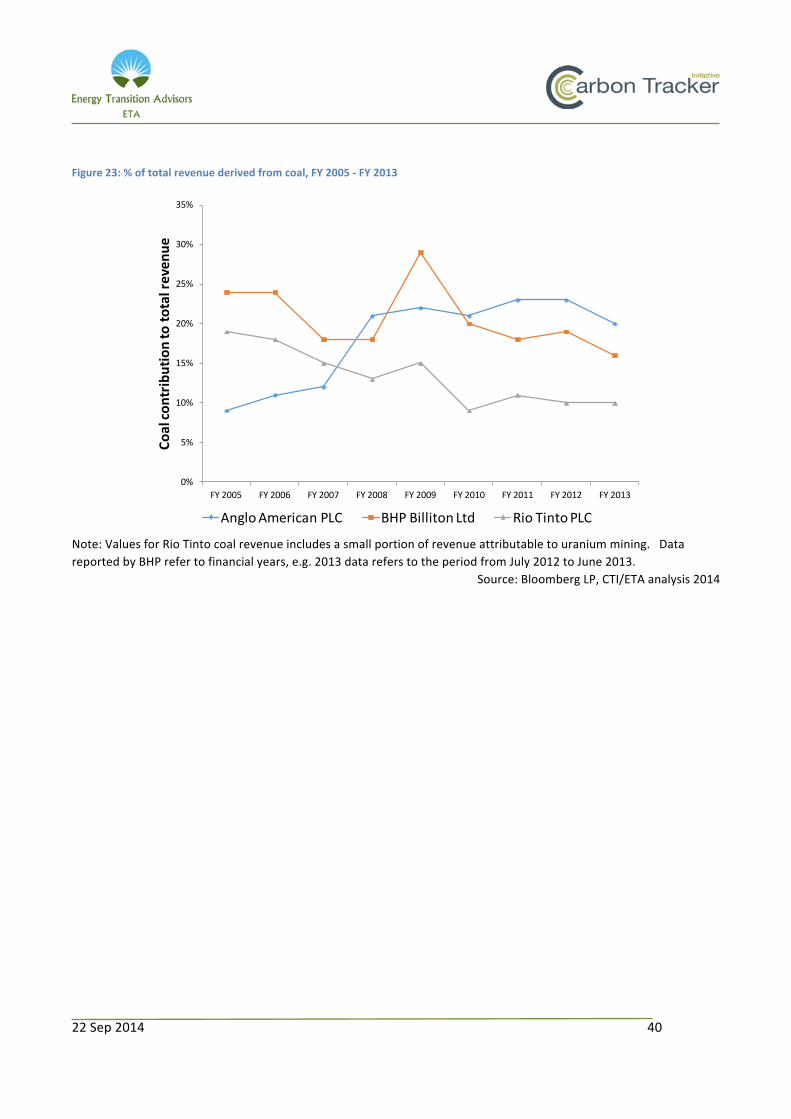
22 Sep 2014 40
Figure 23: % of total revenue derived from coal, FY 2005 -‐ FY 2013
Note: Values for Rio Tinto coal revenue includes a small portion of revenue attributable to uranium mining. Data reported by BHP refer to financial years, e.g. 2013 data refers to the period from July 2012 to June 2013.
Source: Bloomberg LP, CTI/ETA analysis 2014
0%
5%
10%
15%
20%
25%
30%
35%
FY 2005 FY 2006 FY 2007 FY 2008 FY 2009 FY 2010 FY 2011 FY 2012 FY 2013
Coal co
ntrib
ution to to
tal reven
ue
Anglo American PLC BHP Billiton Ltd Rio Tinto PLC
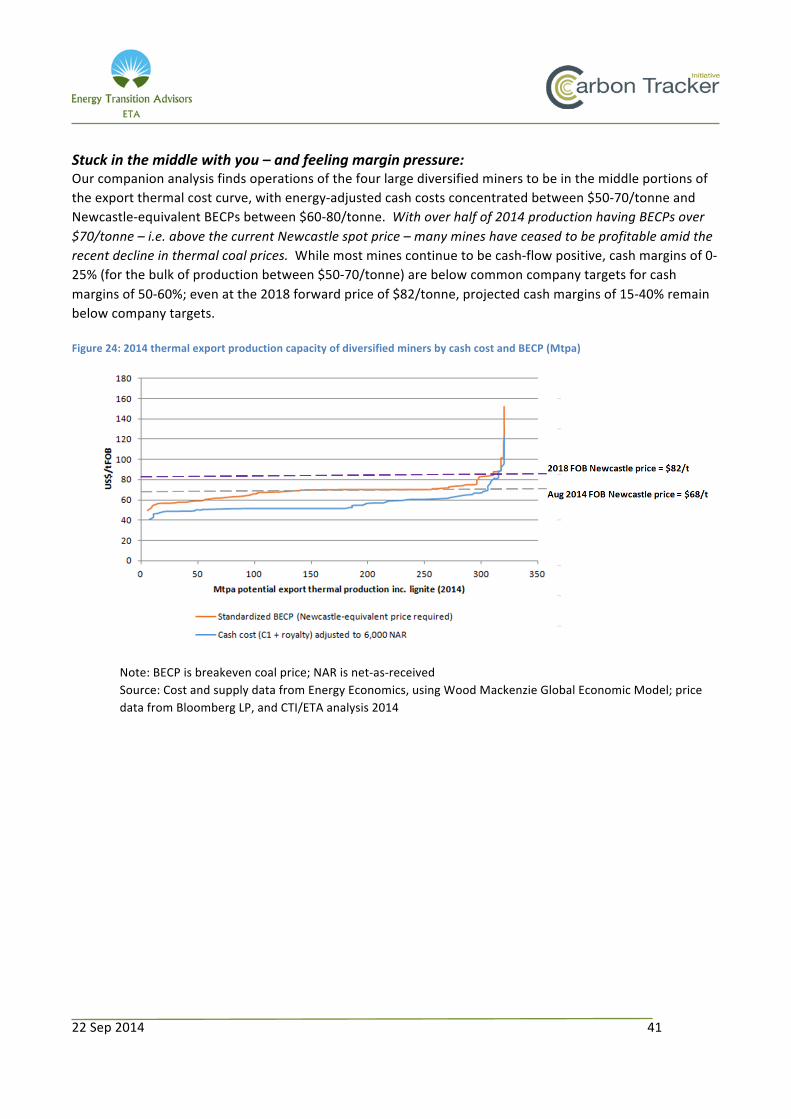
22 Sep 2014 41
Stuck in the middle with you – and feeling margin pressure: Our companion analysis finds operations of the four large diversified miners to be in the middle portions of the export thermal cost curve, with energy-‐adjusted cash costs concentrated between $50-‐70/tonne and Newcastle-‐equivalent BECPs between $60-‐80/tonne. With over half of 2014 production having BECPs over $70/tonne – i.e. above the current Newcastle spot price – many mines have ceased to be profitable amid the recent decline in thermal coal prices. While most mines continue to be cash-‐flow positive, cash margins of 0-‐25% (for the bulk of production between $50-‐70/tonne) are below common company targets for cash margins of 50-‐60%; even at the 2018 forward price of $82/tonne, projected cash margins of 15-‐40% remain below company targets. Figure 24: 2014 thermal export production capacity of diversified miners by cash cost and BECP (Mtpa)
Note: BECP is breakeven coal price; NAR is net-‐as-‐received
Source: Cost and supply data from Energy Economics, using Wood Mackenzie Global Economic Model; price data from Bloomberg LP, and CTI/ETA analysis 2014

22 Sep 2014 42
Declining profitability of coal production Coupled with instances of rising production costs (largely a result of Australian supply chain pressures and currency appreciation), the post-‐2011 decline in prices for both thermal and met coal has significantly eroded coal production profits for these four diversified miners. The average EBIT margin from coal mining for these four companies declined from 30% in 2011 to 10% in 2013, with this decline occurring across both met and thermal coal.81 Figure 25: Coal EBIT margins for many producers have declined substantially across both met and thermal coal, FY 2008 -‐ FY 2013
Note: Prior to 2013 data shown for Glencore Xstrata is just for Xstrata. Rio does not break out met vs. thermal. Data reported by BHP refer to financial years, e.g. 2013 data refers to the period from July 2012 to June 2013.
Source: Bloomberg LP, CTI/ETA analysis 2014
81 From 2011-‐2013 combined coal-‐related revenues of these producers declined by roughly 15%; declines in revenue were less dramatic than declines in EBT due to (1) use of long-‐term contracts; (2) price premiums for higher quality coal (particularly with respect to coking coal); and (3) in some cases, increased production as a result of brownfield expansions or new mines coming online.
0%
10%
20%
30%
40%
50%
60%
70%
FY 2008 FY 2009 FY 2010 FY 2011 FY 2012 FY 2013
EBIT m
argin
Anglo American PLC Coking Coal BHP Billiton Ltd Coking Coal
Glencore Xstrata Coking Coal Anglo American PLC Thermal Coal
BHP Billiton Ltd Thermal Coal Glencore Xstrata Thermal Coal
Rio Tinto (combined met and thermal)

22 Sep 2014 43
Beginnings of a capex pullback (particularly for thermal coal)? Amid the post-‐2006 surge in coal prices, the four large diversified mining companies significantly increased their coal-‐related capex. From 2006-‐2012, annual coal capex at these companies on average quadrupled. In 2013, however, combined coal-‐related capex across these four companies actually declined, from $11 billion in 2012 to $9.2 billion in 2013. More specifically, capex declined at Rio Tinto and Glencore, stayed flat at Anglo American, and increased modestly at BHP.82 Figure 26: Combined annual capex on coal mining (USD million), FY 2004 -‐ FY 2013
Note: Values for Rio Tinto include a small portion of capex related to uranium mining. Missing values reflect a lack of data. Data reported by BHP refer to financial years, e.g. 2013 data refers to the period from July 2012 to June 2013.
Source: Bloomberg LP, CTI/ETA analysis 2014
Moreover, for the two companies that disaggregate coal capex by thermal vs. metallurgical (Anglo and BHP), the last three years have seen a clear shift in the composition of coal capex away from thermal coal and toward met coal.
82 Note that FY 2013 data for BHP refers to the period from July 2012 to June 2013.

22 Sep 2014 44
Figure 27: While the composition of capex shifts toward met coal and away from thermal coal, FY 2009 -‐ FY 2013
Note: Data reported by BHP refer to financial years, e.g. 2013 data refers to the period from July 2012 to June 2013.
Source: Bloomberg LP, CTI/ETA analysis 2014 M&A activity of diversified companies Sizeable balance sheets and global production portfolios make the four companies surveyed here among the most opportunistic buyers and sellers of mining assets, including coal mining assets. As existing coal reserves of these companies expose them to price and demand trends over a decades-‐long time horizon, their merger and acquisition (M&A) activity with respect to thermal coal assets provides an interesting lens into how these companies view the medium and long-‐term economic prospects for coal, and in particular thermal coal.
0%
5%
10%
15%
20%
FY 2009 FY 2010 FY 2011 FY 2012 FY 2013% of total ca
pex de
voted to coa
l
Anglo American PLC Coking CoalBHP Billiton Ltd Coking CoalAnglo American PLC Thermal CoalBHP Billiton Ltd Thermal Coal

22 Sep 2014 45
Figure 28: Reserve lifetimes at 2013 production rates –20-‐30 years of thermal coal
Note: Estimate for Rio Tinto is combined across met and thermal. Reserves and production data from 2013 Annual Report adjusted to account for divestiture of Benga and Clermont mines; reserves and production data for Glencore Xstrata adjusted to account for acquisition of Clermont mine.
Source: company reports, ETA/CTI analysis 2014 Recognizing that there are usually many influences on such decisions (including solvency and liquidity considerations), examining trends in the diversified companies’ purchases and sales of coal mines may illuminate how management of these companies views the medium and long-‐term prospects for the coal industry. One notable trend of recent years has been a divergence within this group in merger and acquisition (M&A) activity related to thermal coal. Specifically, whereas Rio and BHP have taken to divesting thermal coal assets, Glencore Xstrata has been actively buying thermal coal mines. With the exception of Rio’s 2010 acquisition of thermal/semi-‐soft coking coal prospects in Mozambique in 2010 (which, as discussed below, Rio resold in early 2014 at a loss of $3 billion), over the last ten years Glencore has been the only one of these companies to acquire major new thermal coal mines (sometimes, as described below, the very same mines that Rio and BHP are selling).

22 Sep 2014 46
Table 11: Major coal-‐related dispositions by diversified miners, 2004-‐2014
Table 12: Major coal-‐related acquisitions by diversified miners, 2004-‐2014
Source: Thomson One, ETA/CTI analysis 2014
Rank Date Target Name Acquiror NameDeal Size inc. Net Debt (million USD)
Company Involved Type of Coal Assets Country
10/25/13 Clermont Mine Joint Venture
GS Coal Pty Ltd $1,015 RIO (seller), GLEN (buyer)
Thermal Australia
03/09/09 Rio Tinto PLC-‐Jacobs Ranch
Arch Coal Inc $764 RIO Thermal USA
03/31/10 BHP Bill iton Ltd-‐Maruwai Coal
Alam Tri Abadi PT $350 BHP Met Indonesia
02/12/10 Koornfontein Coal Mine
Optimum Coal Holdings Ltd
$87 BHP Thermal South Africa
12/19/12 BHP Navajo Coal Co
Navajo Tribal Council
$85 BHP Thermal USA
10/21/13 Riversdale-‐Coal Mine&Assets
International Coal Ventures
$50 RIO Met/Thermal Mozambique
05/16/07 Elouera Colliery Coking Coal
Gujarat NRE FCGL Pty Ltd
$40 BHP Met Australia
04/01/05 BHP AU-‐Wyong Coal Project,NSW
Korea Resources Corp
$13 BHP Thermal Australia
12/13/11 BHP Bill iton Energy Coal South
Investor Group BHP (seller), GLEN (buyer)
Thermal South Africa
08/15/14 BHP-‐Non-‐core Assets
Shareholders BHP Met/Thermal South Africa & Australia
10/03/13 Rio Tinto PLC-‐ Blair Athol
Linc Energy Ltd. RIO Thermal Australia
Rank Date Target Name Acquiror NameDeal Size inc. Net Debt (million USD)
Company Involved Type of Coal Assets Country
02/02/12 Xstrata PLC Glencore International PLC
$45,803 GLEN (buyer), RIO (seller)
Met/Thermal chiefly Australia & South Africa
12/06/10 Riversdale Mining Ltd
Rio Tinto PLC $3,661 RIO Met/Thermal Mozambique
07/17/08 New Hope-‐New Saraji Project
BHP Bill iton Mitsubishi
$2,384 BHP Met Australia
10/25/13 Clermont Mine Joint Venture
GS Coal Pty Ltd $1,015 GLEN Thermal Australia
12/21/07 Foxleigh Coal Mine Anglo American PLC
$620 AAL-‐LN Met Australia
09/01/11 Optimum Coal Holdings Ltd
Investor Group $448 GLEN Thermal South Africa
03/27/12 Optimum Coal Holdings Ltd
Investor Group $406 GLEN Thermal South Africa
08/17/11 Peace River Coal LP Anglo American PLC
$86 AAL-‐LN Met Canada
08/17/11 Peace River Coal LP Anglo American PLC
$74 AAL-‐LN Met Canada
06/29/07 Wakefield Investments(Pty)Ltd
Shanduka Coal(Pty)Ltd
$44 GLEN Met/Thermal South Africa
10/03/08 Springlake Colliery Shanduka Coal(Pty)Ltd
$17 GLEN Met/Thermal South Africa
12/13/11 BHP Bill iton Energy Coal South
Investor Group GLEN (buyer), BHP (seller)
Thermal South Africa
22 Sep 2014 47
Rio and BHP selling off and repositioning thermal coal mines The two companies that have done the most to unload thermal coal assets from their portfolios are Rio Tinto and BHP. In October 2013 Rio Tinto sold to Glencore for $1 billion+ its 50% stake in the Clermont mine in Queensland, Australia. In 2013 Rio production from Clermont amounted to nearly 6 million tonnes, accounting for 25% of Rio’s total 2013 thermal coal production; at the 2013 rate of production, Clermont’s marketable reserves were sufficient to last another 13 years.83 Moreover, Clermont was one of Rio’s lower-‐cost thermal coal mines, with a Newcastle-‐equivalent BECP of $56/tonne. Some observers have interpreted Rio’s sale of the Clermont mine to suggest skepticism about the medium-‐term economic prospects for thermal coal. The exit of Clermont from Rio’s portfolio came four years after a major divestment of assets held by Rio Tinto Energy of America (RTEA), a wholly-‐owned Rio subsidiary. From 2006-‐2008 RTEA was the third-‐largest coal producers in the US (on an energy-‐adjusted basis). In 2009, however, RTEA sold the Jacobs Ranch mine in the US Powder River basin to Arch Coal for $764 million. That same year RTEA also spun off three large surface mines in the Powder River Basin – Antelope and Cordero Rojo in Wyoming and the Spring Creek mine in Montana84 – into a separate entity (Cloud Peak Energy Inc.), which is now the third-‐largest US coal producer. Although Rio initially owned a 48% stake in Cloud Peak, in 2010 it subsequently divested this entire stake in 2010 via a secondary offering for Cloud Peak shares. Although at the time observers offered many rationales for Rio’s divestment of US thermal coal assets – including the need to pay down debt after a $38 billion acquisition of Canadian aluminum producer Alcan Inc. in 2007 – they served to significantly reduce production of thermal coal in Rio’s portfolio. Concurrent with unloading the Clermont mine in Queensland, Rio exited an ill-‐fated investment in Mozambique coal mines. In late 2010 Rio acquired two prospective thermal/met coal mines 85 in Mozambique via its $3.6 billion takeover of ASX-‐listed Riverside Mining. At the time of the acquisition, making inroads into the Mozambique’s coal prospects seemed a way for Rio to substantially grow its production of coal (particularly met coal) in a region remote from the cost inflation pressures then affecting Australia (where Rio’s coal operations are concentrated). Subsequently, however, the economic logic for these mines eroded owing to (1) infrastructure barriers to exporting coal from Mozambique (in particular, the government’s refusal, on environmental grounds, to allow Rio Tinto to ship coal via barge down the Zambeze river); (2) a serious downward revision of the total coal resources in the Benga and Zambeze mines (which, by 2013, had fallen to one-‐fifth of their 2009 levels); and (3) civil unrest within Mozambique and resulting disruptions to production. In explaining Rio’s decision to sell off its Mozambique coal mines for 1.4% of its initial purchase price,86 analysts (quite understandably) generally emphasized one or more of the above issues.87 It is worth noting, however, that at the time of sale even Rio’s downwardly revised estimates
83 Rio Tinto,"2013 Annual Report," 212-‐215, 2014, http://www.riotinto.com/documents/RT_Annual_report_2013.pdf. 84 Liezel Hill, "Rio Tinto Sells Entire Stake in Cloud Peak Energy," Dec 22 2010, http://www.miningweekly.com/article/rio-‐tinto-‐sells-‐entire-‐stake-‐in-‐cloud-‐peak-‐energy-‐2010-‐12-‐22. 85 Much of the coal from the Benga and Zambeze mines – which Rio classified as “steam coal/semi-‐soft coking coal” – can generally speaking be sold into either the thermal or met coal markets. 86 Rhiannon Hoyle, "Rio Tinto to Sell Mozambique Coal Assets for $50 million," Wall Street Journal, July 30 2014, http://online.wsj.com/articles/rio-‐tinto-‐to-‐sell-‐mozambique-‐coal-‐assets-‐for-‐50-‐million-‐1406704712. 87 Reuters, "Rio Tinto pulls plug on ill-‐fated Mozambique coal venture," Jul 30 2014, http://in.reuters.com/article/2014/07/30/rio-‐tinto-‐mozambique-‐idINKBN0FZ0R220140730.

22 Sep 2014 48
of total met/thermal coal resources in the Benga and Zambeze mines (2.3 billion tonnes) still equaled half of total coal resources from all 14 of its Australian mines88; coupled with the higher costs89 and longer timeframe for developing its Mozambique prospects, a bearish outlook on the medium and long-‐term prospects for thermal coal would certainly be consistent with the decision to sell these mines.90 In the same vein of potential retrenchment from thermal coal described above for Rio, over the past few years BHP has removed multiple thermal coal assets from its portfolio. As of writing (August 2014) BHP is in the process of spinning-‐off a collection of “non-‐core” assets that include its four remaining thermal coal mines in South Africa91, which in fiscal year 2013 (ending in June 2013) supplied 44% of BHP’s overall thermal coal production (31.6 of 72 million tonnes).92 The difference between the average Newcastle-‐equivalent BECP of these four mines ($74/tonne) and current spot prices for thermal coal (~$70/tonne for both the Newcastle and Richard Bay benchmarks93) suggests an immediate economic logic to these divestments; for fiscal year 2013 BHP’s South African thermal coal operations made a negative EBIT contribution of $34 million.94 They come, however, in the context of BHP’s moves over the past decade to reduce its exposure to thermal coal generally, and South African thermal coal in particular. Whereas ten years ago BHP produced approximately 40% of South Africa’s export thermal coal, the company has in recent years sold off major South African coal operations (e.g. via a 2010 sale of the Koornfontein coal mine to Optimum Coal Holdings and a 2011 sale of its Energy Coal South Africa assets to Glencore). In 2012 BHP also sold a major thermal coal asset in the US southwest (BHP Navajo Coal).95 Together with its pending departure from its South African thermal coal business, these moves amount to a significant downsizing of BHP’s core production base in thermal coal. Though it retains thermal coal assets in Colombia, Australia, and the US, recent asset sales and the proposed spin-‐off suggest a strong effort to reduce exposure to thermal coal.
88 Rio Tinto,"2013 Annual Report," 212-‐21. 89 Through 2025, Wood Mackenzie's Global Economic Model suggests potential capex of $1.6 billion on the Benga and Zambeze mines, which had a Newcastle-‐equivalent BECP above $100/ton. Note that his capex figure does not include the substantial transport infrastructure-‐related costs described above. Energy Economics analysis based on data from Wood Mackenzie's Global Economic Model. 90 As to the purchaser of Rio’s Mozambique assets – India Coal Ventures Limited (ICVL)– it is relevant to note that this entity was set up by the Indian government with the express purpose of acquiring coal assets abroad to satisfy coal demand of India’s state-‐owned companies. Having guaranteed state-‐owned buyers makes ICVL’s financial considerations and sensitivity to long-‐term coal price trends significantly different from those of a private-‐sector commercial mining company. All Africa, "Vale looking to sell stake in Mozambican coal assets," Aug 4 2014, http://allafrica.com/stories/201408042728.html 91 Chad Bray, "BHP Billiton to Spin Off Units, Reversing Consolidation Trend," Aug 19 2014, http://dealbook.nytimes.com/2014/08/19/bhp-‐billiton-‐to-‐spin-‐off-‐assets-‐into-‐metals-‐and-‐mining-‐company/?_php=true&_type=blogs&_r=0. BHP's four 4 thermal coal assets in South Africa (Khutala Colliery, Klipspruit Colliery, Middelburg Colliery and Wolvekrans Colliery). The spin-‐off will also house BHP's Illawarra, NSW coking coal assets. Note that at the time of writing BHP’s spin-‐off is being subject to legal review by South Africa’s government. 92 Brendan Ryan, "BHP Billiton eyes exit from thermal coal," Feb 11 2014, http://www.bdlive.co.za/business/mining/2014/02/11/bhp-‐billiton-‐eyes-‐exit-‐from-‐thermal-‐coal. 93 Note that the Richards Bay spot price is the primary spot price for export coal from South Africa. 94 Brendan Ryan, "BHP Billiton eyes exit from thermal coal." 95 Emily Guerin, "Navajo Nation's Purchase of a New Mexico coal mine is a mixed bag," High Country News, Jan 7 2014, https://www.hcn.org/blogs/goat/navajo-‐nations-‐purchase-‐of-‐a-‐new-‐mexico-‐coalmine-‐is-‐a-‐mixed-‐bag
22 Sep 2014 49
Beyond reducing exposure to thermal coal, the asset sales described above may be part of a strategy to reduce exposure to higher-‐cost thermal coal. In terms of 2014-‐2025 potential capex on thermal coal mines with a BECP above $75/tonne, absolute exposure for Rio ($5.7 billion) and BHP ($4.6 billion) exceeds exposure for Glencore ($3.7 billion) and Anglo American ($1.8 billion).96 Hence, among the major diversified companies, these two companies at the moment have the most financially risky potential capex above key price levels related to thermal coal. Glencore Xstrata increasing its exposure to thermal coal Contrary to the path traveled by Rio and BHP, Glencore Xstrata is along among the four large diversified mining companies in having recently acquired significant new thermal coal assets. The most notable step in this direction came in 2012 when the giant commodities trading firm Glencore acquired diversified miner Xstrata for $45.8 billion. At the time of the acquisition, thermal coal accounted for 26% of Xstrata’s revenue. Both prior and subsequent to the Xstrata acquisition, however, Glencore has acquired other significant thermal coal assets. Most of this activity has centered on South Africa (where, as mentioned above, Glencore has come to own many of BHP’s former thermal coal assets). As of March 2014 such acquisitions had put Glencore in control of roughly one-‐quarter of South Africa’s thermal coal export production capacity.97 Outside of South Africa, Glencore has also added to its holdings of Australian thermal coal, chiefly via its purchase of Rio Tinto’s 50% stake in the Clermont mine. Moreover, analysts have recently reported on Glenore’s plans to invest $4.75 billion to increase coal production by 21% through 2016.98 Though deteriorating market conditions have led Glencore to shelve prospective investments such as a 35 Mtpa coal export terminal in Queensland99, overall Glencore has been unique among its peer group during recent years in actively increasing its exposure to thermal coal. In seeking to explain Glencore’s recent investments in coal, some analysts have noted that such counter-‐cyclical bets have been a hallmark of the large commodities trading firm. It is also worth noting that, as of 2013, coal production (thermal + met) accounted for only 5% of Glencore’s total revenues – one-‐half of coal’s revenue share for Rio and roughly one-‐quarter of the coal’s revenue share for BHP and Anglo American. Another explanation, however, is that the mines that Glencore has been acquiring are generally reasonably well-‐positioned on the cost curve, at least with respect to our estimate of a $75/tonne long-‐term equilibrium price in the seaborne export market. For example, the Clermont mine that Glencore acquired from Rio for $1 billion in 2013 has a breakeven coal price below $70/tonne. Recognizing this provides valuable context for analyzing Glencore’s recent acquisitions. A word on Vale – another diversified miner reducing exposure to thermal coal Despite producing coal and having total 2013 revenues from all sources larger than those of Anglo American, Brazilian diversified miner Vale was not included in the above survey. This is because, relative to the other four companies, Vale both produces relatively little coal (in 2012, 5 Mt of metallurgical coal and almost 2 Mt
96 Energy Economics analysis based on data from Wood Mackenzie's GEM database. 97 Brendan Ryan, "Glencore Xstrata eyes more SA coal," Mar 5 2014, http://www.bdlive.co.za/business/mining/2014/03/05/glencore-‐xstrata-‐eyes-‐more-‐sa-‐coal 98 Arjun Sreekuma, "Why this Billionaire Still Believes in Coal," Aug 20 2014, http://www.fool.com/investing/general/2014/08/20/why-‐this-‐billionaire-‐still-‐believes-‐in-‐coal.aspx 99 Kim Christian, "Glencore Xstrata scraps Qld coal terminal," May 13 2013 Xhttp://news.smh.com.au/breaking-‐news-‐business/glencore-‐xstrata-‐scraps-‐qld-‐coal-‐terminal-‐20130513-‐2jhw6.html

22 Sep 2014 50
of thermal coal) and derives only 2.3% of its revenue from coal mines.100 Even with relatively low exposure, however, Vale has taken recent steps to reduce its exposure to thermal coal. These include:
• Closing the Integra Mine complex: Vale is the 61.2% owner and operator of the Integra Mine complex in New South Wales, which producers 4.5 Mtpa of semi-‐hard, semi-‐soft met as well as steam coal. In May 2014 Vale declared the operation “not economically feasible under current market conditions”101 and closed the mine, in the process laying off over 500 workers. Including $33 million of penalties on cancelled contracts and $30 million of remaining “take-‐or-‐pay” obligations for port and rail access, the cost to Vale from the Integra closure is estimated at $63 million.102
• Selling Colombian thermal coal mines: Declaring thermal coal not a part of the company’s “core business,” in May 2012 Vale sold two Colombian thermal coal mines as well as port and rail interests in the country to a subsidiary of Goldman Sachs for $407 million.103
• Selling stakes in mining assets in Australia and Mozambique: Since December 2013 Vale has been
trying to raise up to $1 billion by selling minority stakes in its coal proposals and mines in Australia and Mozambique (most of which produce both met and thermal coal, with the majority of value thought to relate to the met-‐coal portion of these assets).104
The above examples serve as further evidence that the prospect of continuing low returns is prompting diversified mining companies to exit thermal coal.
100 Silvia Antonioli and Clara Ferreira-‐Marques, "Miner Vale to sell 15-‐25 stake in coal operations," Reuters , Dec 5 2013, http://www.reuters.com/article/2013/12/05/vale-‐idUSL5N0JK4WS20131205 101 Vale, "Vale comments on Integra coal mine," May 16 2014, http://saladeimprensa.vale.com/en/releases/interna.asp?id=22687 102 Vicky Validakis, "Vale faces a $63 million price tag to close Integra complex: union," Jun 2 2014, Australian Mining, http://www.miningaustralia.com.au/news/vale-‐faces-‐a-‐$63-‐million-‐price-‐tag-‐to-‐close-‐integr 103 Reese Ewing, "Vale sells Colombia coal mines to Goldman Sachs-‐led group," May 29 2012, http://uk.reuters.com/article/2012/05/29/uk-‐vale-‐coal-‐idUKBRE84S00M20120529 104 Silvia Antonioli and Clara Ferreira-‐Marques, "Miner Vale to sell 15-‐25 stake in coal operations.
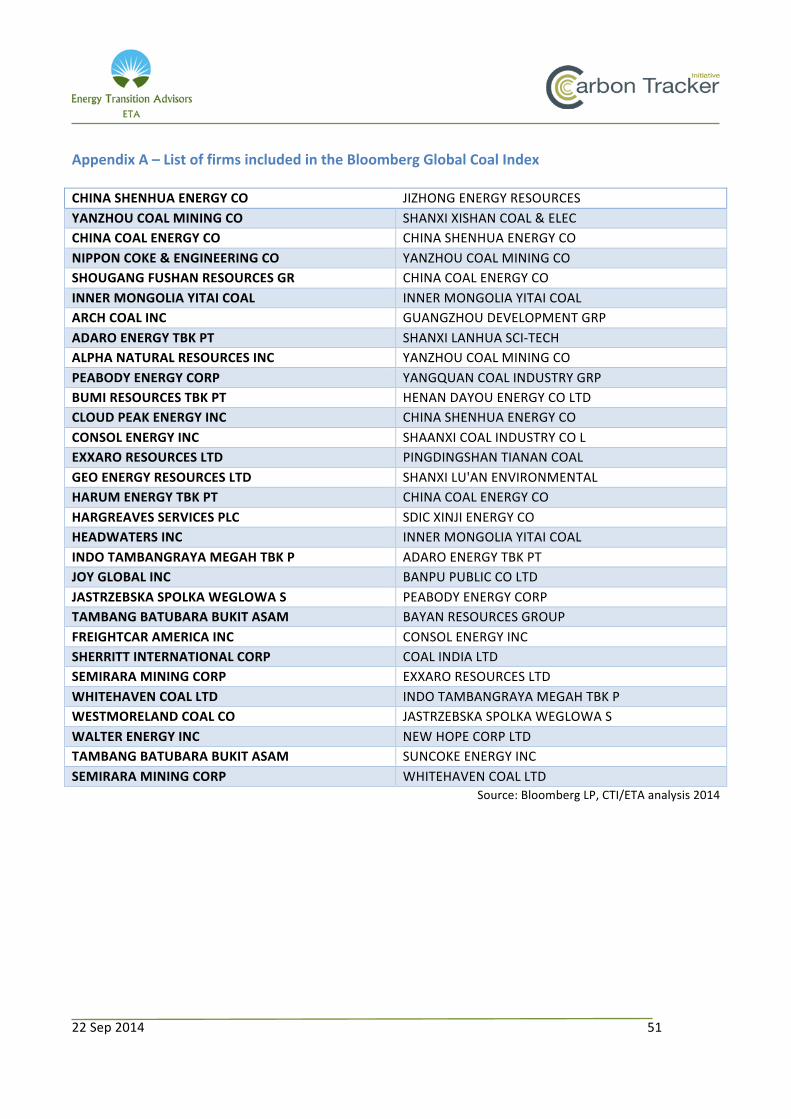
22 Sep 2014 51
Appendix A – List of firms included in the Bloomberg Global Coal Index
CHINA SHENHUA ENERGY CO JIZHONG ENERGY RESOURCES YANZHOU COAL MINING CO SHANXI XISHAN COAL & ELEC CHINA COAL ENERGY CO CHINA SHENHUA ENERGY CO NIPPON COKE & ENGINEERING CO YANZHOU COAL MINING CO SHOUGANG FUSHAN RESOURCES GR CHINA COAL ENERGY CO INNER MONGOLIA YITAI COAL INNER MONGOLIA YITAI COAL ARCH COAL INC GUANGZHOU DEVELOPMENT GRP ADARO ENERGY TBK PT SHANXI LANHUA SCI-‐TECH ALPHA NATURAL RESOURCES INC YANZHOU COAL MINING CO PEABODY ENERGY CORP YANGQUAN COAL INDUSTRY GRP BUMI RESOURCES TBK PT HENAN DAYOU ENERGY CO LTD CLOUD PEAK ENERGY INC CHINA SHENHUA ENERGY CO CONSOL ENERGY INC SHAANXI COAL INDUSTRY CO L EXXARO RESOURCES LTD PINGDINGSHAN TIANAN COAL GEO ENERGY RESOURCES LTD SHANXI LU'AN ENVIRONMENTAL HARUM ENERGY TBK PT CHINA COAL ENERGY CO HARGREAVES SERVICES PLC SDIC XINJI ENERGY CO HEADWATERS INC INNER MONGOLIA YITAI COAL INDO TAMBANGRAYA MEGAH TBK P ADARO ENERGY TBK PT JOY GLOBAL INC BANPU PUBLIC CO LTD JASTRZEBSKA SPOLKA WEGLOWA S PEABODY ENERGY CORP TAMBANG BATUBARA BUKIT ASAM BAYAN RESOURCES GROUP FREIGHTCAR AMERICA INC CONSOL ENERGY INC SHERRITT INTERNATIONAL CORP COAL INDIA LTD SEMIRARA MINING CORP EXXARO RESOURCES LTD WHITEHAVEN COAL LTD INDO TAMBANGRAYA MEGAH TBK P WESTMORELAND COAL CO JASTRZEBSKA SPOLKA WEGLOWA S WALTER ENERGY INC NEW HOPE CORP LTD TAMBANG BATUBARA BUKIT ASAM SUNCOKE ENERGY INC SEMIRARA MINING CORP WHITEHAVEN COAL LTD
Source: Bloomberg LP, CTI/ETA analysis 2014

22 Sep 2014 52
Appendix B – Additional detail on our universe of coal mining companies
Table 13: List of balanced coal companies (all market cap figures in billion USD)
China Mkt Cap US Mkt Cap Australia Mkt Cap Poland Mkt Cap
SHANXI XISHAN 2.7 CONSOL ENERGY 9.8
YANCOAL AUSTRALIA 0.2 BOGDANKA 1.3
JIZHONG ENERGY 2.2
PEABODY ENERGY 4.3
GUIZHOU PANJIA 1.7
NATURAL RESOURCE 1.8
PINGDINGSHAN 1.5
ALPHA NATURAL RE 0.7
SHANXI LANHUA-‐A 1.4
ARCH COAL INC 0.7
SDIC XINJI -‐A 1.3
RHINO RESOURCE PARTNERS 0.4
SHANXI COAL -‐A 1.3
Note: Country corresponds to exchange on which the company is listed.
Source: Bloomberg LP, CTI/ETA analysis 2014

22 Sep 2014 53
Table 14: List of thermal coal companies (all market cap figures in billion USD)
China Mkt Cap
Hong Kong
Mkt Cap
Indonesia Mkt Cap
US Mkt Cap
ROW Mkt Cap
SHANXI LU'AN 2.8
CHINA SHENHUA-‐H 46.1
ADARO ENERGY TBK 3.1
INNER MONGOLIA-‐B 4.3
WHITEHAVEN COAL 1.5
HUOLINHE COAL 1.5
CHINA COAL ENE-‐H 8.2
INDO TAMBANGRAYA 2.4
ALLIANCE HOLDING 4.1
NEW HOPE CORP LT 2.2
SHANGHAI DATUN 0.9
YANZHOU COAL-‐H 4.7
TAMBANG BATUBARA 2.1
ALLIANCE RESOURC 3.3 ENACAR 0.5
ZHENGZHOU COAL 0.7
KINETIC MINES AN 0.5
BAYAN RESOURCES 2.0
FORESIGHT ENERGY 2.6 CARVILE 0.5
XINJIANG INTL IN 0.6
HIDILI IND INTL 0.2
GOLDEN ENERGY MI 0.9
CLOUD PEAK ENERG 1.0
COAL INDIA LTD 38.4
SHANG ACE CO 0.6
BUMI RESOURCES 0.7
WESTMORELAND COA 0.7
DMCI HLDGS INC 4.6
TAIYUAN COAL G 0.6
ABM INVESTAMA TB 0.7
HALLADOR ENERGY 0.3
SEMIRARA MINING 2.9
ANYUAN COAL IN 0.6
HARUM ENERGY 0.5
GEO ENERGY 0.3
QINGHAI JINRUI 0.3
BARAMULTI SUKSES 0.4
BANPU PUB CO LTD 2.4
INDIKA ENERGY 0.3
LANNA RESOURCES 0.2
BERAU COAL ENERG 0.3
EXXARO RESOURCES 4.6
ICHOR COAL NV 0.4
Note: Country corresponds to exchange on which the company is listed. Source: Bloomberg LP, CTI/ETA analysis 2014

22 Sep 2014 54
Table 15: List of met coal companies (all market cap figures in billion USD)
China Mkt Cap
Hong Kong
Mkt Cap
Australia Mkt Cap
US Mkt Cap
Russia Mkt Cap
Poland Mkt Cap
Japan Mkt Cap
SHAANXI COAL I 6.7
SHOUGANG FUSHAN 1.3
WASHINGTON H. SOUL PATTINSON 3.3
SUNCOKE ENERGY 1.5
SOUTHERN KUZBASS 0.8 JSW 1.6
NIPPON COKE & ENERGY 0.4
YANGQUAN COAL 2.2
MONGOLIAN MINING 0.2
ATRUM COAL NL 0.2
WALTER ENERGY 0.4
RASPADSKAYA 0.4
DATONG COAL INDU 1.4
BEIJING HAOHUA 1.1
GANSU JINGYUAN 0.9
ANHUI HENGYUAN 0.9
KAILUAN ENERGY 0.9
QITAIHE BAOTAI 0.7
INNER MONGOLIA 0.7
SUNDIRO HOLDIN 0.5
SICHUAN SHENGD 0.3
HEILONGJIAN HE 0.3
SHANXI MEIJIN 0.3
Note: Country corresponds to exchange on which the company is listed.
Source: Bloomberg LP, CTI/ETA analysis 2014

22 Sep 2014 55
Figure 29 Market cap of balanced coal companies by geography (billion USD)
Note: Total for China includes companies listed on the Hong Kong exchange. Source: Bloomberg LP, CTI/ETA analysis 2014

22 Sep 2014 56
Figure 30 Market cap of thermal coal companies by geography (billion USD)
Note: Total for China includes companies listed on the Hong Kong exchange. Source: Bloomberg LP, CTI/ETA analysis 2014

22 Sep 2014 57
Figure 31 Market cap of met coal companies by geography
Note: Total for China includes companies listed on the Hong Kong exchange. Source: Bloomberg LP, CTI/ETA analysis 2014

22 Sep 2014 58
DISCLAIMERS
! The underlying supply and cost analysis in this report, prepared by CTI-‐ETA, are based on data licensed from the Global Economic Model of Wood Mackenzie Limited. Wood Mackenzie is a Global leader in commercial intelligence for the energy, metals and mining industries. They provide objective analysis on assets, companies and markets, giving clients the insights they need to make better strategic decisions. The analysis presented and the opinions expressed in this report are solely those of CTI-‐ETA.
! CTI is a non-‐profit company set-‐up to produce new thinking on climate risk. CTI publishes its research for the public good in the furtherance of CTIs not for profit objectives. Its research is provided free of charge and CTI does not seek any direct or indirect financial compensation for its research. The organization is funded by a range of European and American foundations.
o CTI is not an investment adviser, and makes no representation regarding the advisability of investing in any particular company or investment fund or other vehicle. A decision to invest in any such investment fund or other entity should not be made in reliance on any of the statements set forth in this publication.
! CTI has commissioned Energy Transition Advisors (ETA) to carry out key aspects of this research. The research is provided exclusively for CTI to serve it’s not for profit objectives. ETA is not permitted to otherwise use this research to secure any direct or indirect financial compensation. The information & analysis from ETA contained in this research report does not constitute an offer to sell securities or the solicitation of an offer to buy, or recommendation for investment in, any securities within the United States or any other jurisdiction. The information is not intended as financial advice. This research report provides general information only. The information and opinions constitute a judgment as at the date indicated and are subject to change without notice. The information may therefore not be accurate or current. The information and opinions contained in this report have been compiled or arrived at from sources believed to be reliable in good faith, but no representation or warranty, express or implied, is made by CTI or ETA as to their accuracy, completeness or correctness. Neither do CTI or ETA warrant that the information is up to date.
www.et-‐advisors.com
www.carbontracker.org
@carbonbubble