経済産業省生産動態統計年報 - meti.go.jp · (3)...
TRANSCRIPT

平 成 3 0 年
2 0 1 8
経済産業省生産動態統計年報
資源・窯業・建材統計編
YEARBOOK OF
CURRENT PRODUCTION STATISTICS
M INERAL RESOURCES AND PETROLEUM PRODUCTS ,
CERAM ICS AND BU ILD ING MATER IALS
経済産業省大臣官房調査統計グループ
Research and Statistics Department
Minister’s Secretariat
Ministry of Economy, Trade and Industry(METI)

Ⅰ.≪資源統計≫ Ⅱ.≪窯業・建材統計≫
1) 原油及び天然ガス 1) ガラス・同製品
① 製品 1 ① 板ガラス・安全ガラス・複層ガラス
② 原油生産内訳 1 及びガラス繊維製品
③ 天然ガス生産内訳 1 ② ガラス製品・ほうろう鉄器製品 29
④ 天然ガス産業別出荷・消費内訳 1 2) セメント・セメント製品 30
2) 石油製品 3) 陶磁器 31
① 製品 2 4) ファインセラミックス 32
② 半製品 3 5) その他の窯業・土石製品
3) 鉱物及びコークス ① 耐火れんが・不定形耐火物 33
① 製品 3 ② 炭素製品・研削砥石 33
② 非金属鉱物用途別販売・消費内訳 3 ③ ボード・パネル 34
③ 金鉱(精鉱) 3 6) 建築用金属製品
① 金属製建具 35
1) 原油及び天然ガス (2)製品統計表(時系列)
① 製品 4 1) ガラス・同製品
② 生産内訳 ① 板ガラス・安全ガラス・複層ガラス
a. 原油油種別 5 及びガラス繊維製品
b. 天然ガス鉱床別 5 ② ガラス製品・ほうろう鉄器製品 46
③ 出荷・消費内訳 2) セメント・セメント製品 56
a. 天然ガス産業別 5 3) 陶磁器 66
2) 石油製品 4) ファインセラミックス 75
① 製品 6 5) その他の窯業・土石製品
② 半製品 19 ① 耐火れんが・不定形耐火物 83
3) 鉱物及びコークス ② 炭素製品・研削砥石 88
① 製品 21 ③ ボード・パネル 93
② 非金属鉱物用途別販売・消費内訳 24 6) 建築用金属製品
③ 金鉱(精鉱) 26 ① 金属製建具 98
27 2.労務統計 105
27 3.生産能力統計 107
調査票様式 112
品目別接続係数について 124
公表値の修正について 125
28
(2)製品統計表(時系列)
36
2.労務統計
目 次
3.生産能力統計
利 用 上 の 注 意
統 計 表
1.生産・出荷・在庫統計
(1)製品年表
1.生産・出荷・在庫統計
(1)製品年表

Notes for utilization
Statistical tables
Ⅰ.≪Mineral resources and Ⅱ.≪Ceramics and building materials statistics≫ petroleum products statistics≫
1.Production, Shipment and Inventory
(1)Annual Commodities1) Crude oil and natural gas 1) Glass and glass products① Product 1 ① Flat glass, safety glass, multiple glass ② Crude oil production details 1 and glass fiber products③ Natural gas production details 1 ② Glass products and enameled ④ Breakdown of natural gas iron products
consumption and shipment by industry 2) Cement and cement products 30
2) Petroleum products 3) Ceramic wares 31
① Product 2 4) Fine ceramics 32
② Semi-product 3 5) Other ceramics, stone and clay products3) Metallic minerals, non-metallic minerals ① Refractory bricks and
and coke monolithic refractories ① Product 3 ② Carbon products and grinding wheels 33
② Breakdown of non-metallic minerals ③ Board and panels 34
sales and consumption by use 6) Metal products of building③ Gold ores (concentrate ore ① Metal building materials 35
production)(2)Historical Data by Commodities
1) Glass and glass products1) Crude oil and natural gas ① Flat glass, safety glass, multiple glass ① Product 4 and glass fiber products② Breakdown of production ② Glass products and enameled
a. Production by kind of crude oil 5 iron productsb. Production of natural gas by oil field 5 2) Cement and cement products 56
③ Breakdown of consumption and 3) Ceramic wares 66
shipment by industry 4) Fine ceramics 75
a. Natural gas by industry 5 5) Other ceramics, stone and clay products2) Petroleum products ① Refractory bricks and ① Product 6 monolithic refractories ② Semi-product 19 ② Carbon products and grinding wheels 88
3) Metallic minerals, non-metallic minerals ③ Board and panels 93
and coke 6) Metal products of building① Product 21 ① Metal building materials 98
② Breakdown of non-metallic minerals sales and consumption by use 2.Labor 105
③ Gold ores (concentrate oreproduction) 3.Productive capacity 107
2.Labor 27 Questionnaires 112
3.Productive capacity 27 Continuity coefficients by commodity 124
Correction of a past statistical table 125
(1)Annual Commodities
28
36
Contents
1 . Production, Shipment and Inventory
(2)Historical Data by Commodities
29
3
1
26
33
83
24
3
46

利 用 上 の 注 意 1.統計資料について
この年報は、統計法に基づく基幹統計であり、経済産業省生産動態統計調査規則により実
施された資源及び窯業・建材製品に関する調査結果を編集公表するものです。 毎月の調査結果は、「経済産業省生産動態統計月報」で公表していますが、公表後、数値につ
いて修正が行われる場合があり、この年報ではこれらの数値を修正して公表しております。
2.調査範囲について この年報に収録された統計調査の調査範囲は、次のとおりです。
調 査 票 名 調 査 の 範 囲 ◆資源・エネルギー統計関係
鉱物及びコークス月報
全ての事業所
ただし、石灰石は従事者10名以上の事業所
原油及び天然ガス月報 全ての事業所
石油製品月報 全ての事業所
◆窯業・建材統計関係
板ガラス・安全ガラス・複層ガラス及び
ガラス繊維月報 全ての事業所
ガラス製品・ほうろう鉄器月報 ガラス製品:従事者10名以上の事業所
ほうろう鉄器:従事者20名以上の事業所
セメント・セメント製品月報 セメント:全ての事業所
セメント製品:従事者30名以上の事業所
陶磁器月報 従事者10名以上の事業所
ファインセラミックス月報 従事者5名以上の事業所
耐火れんが・不定形耐火物月報 全ての事業所
炭素製品・研削砥石月報 全ての事業所
ボード・パネル月報 全ての事業所
金属製建具月報 従事者30名以上の事業所
3.調査項目の定義について
生産動態統計の各項目の定義は、次のとおりです。 (1) 製 品 ① 生 産 調査の対象事業所(以下「調査対象」という。)が、国内で実際に生産(受託生産を含む。)
した製品の数量をいいます。ただし、仕掛中の半製品は除きます。 なお、生産には調査対象で他の製品に加工又は消費するために生産したものも含みます。 ② 受 入 調査対象が生産している調査品目と同一の製品で、工場又は倉庫に次の事由により受入れた
数量をいいます。 ア.他企業から購入したもの(輸入を含む。) イ.同一企業内の他工場から受入れたもの ウ.委託生産品及び委託加工品を委託先の工場(下請工場を含む。)から受入れたもの エ.返品(戻入れ)されたもの
③ 消 費 調査対象が他の製品の原材料、加工用として消費した数量をいいます。 ④ 出 荷 調査対象及び調査対象が契約の主体となって借受けている倉庫又は保管場所から、実際に出
荷した数量をいいます。

なお、出荷数量は次の事由により、「販売」、「その他」に区分しています。 (販 売)
ア.販売業者又は消費者である他企業に直接販売したもの イ.販売することを目的として本社、営業所又は中継地などに出荷したもの ウ.受託生産品を販売業者(消費者を含む。)である委託者へ出荷したもの エ.同一調査品目を生産していない同一企業内の他工場へ出荷したもの(全くの転売品)
(その他) ア.同一調査品目を生産している同一企業内の他工場へ出荷したもの イ.同一企業内の他工場へ原材料として出荷したもの ウ.委託生産又は委託加工のための原材料として出荷したもの エ.受託生産品又は受託加工品を同一調査品目を生産している生産業者(委託者)へ出荷し
たもの オ.自家使用したもの(自工場施設などへの投資、見本用、贈答用、試験研究用など) カ.自己消費したもの(ただし、消費を調査していない場合のみ)
(販売金額) 販売数量を契約価格又は生産者販売価格により評価した金額をいいます。 ここでいう契約価格又は生産者販売価格とは、企業の販売価格から積込み料、運賃、保険
料、その他の諸掛りを除き、消費税を含めたものです。 ⑤ 月末在庫 調査対象が生産した調査品目の製品及び受入品で、調査対象及び調査対象が契約の主体とな
って借受けている倉庫又は保管場所に、実際に保管してある製品の数量をいいます。 (2) 生産能力
調査対象が実際に保有している全ての調査該当設備又は生産能力をいいます。 (3) 労 務
月末従事者数 実際に生産及び管理その他の業務に常時従事する人をいいます(出向者、派遣労働者を含む)。
4.その他
(1) 数字の単位未満は四捨五入しているため、合計と内訳又は月別と年計が必ずしも一致しな
いことがあります。
(2) この年報で使用している記号の区分は下記のとおりです。
「0」は単位未満 「-」は実績なし 「…」は不詳
「r」は訂正 「x」は秘匿 「▲」はマイナス
(3) この年報に掲載された統計を他に転載する場合は、必ず「平成30年経済産業省生産動態
統計年報 資源・窯業・建材統計編(経済産業省)」による旨を明記してください。
(4) 断層発生に伴う数値の接続について
一部調査対象事業所の数値等の見直しにより、発生年月以前の数値と発生年月以降の数値
をそのまま比較出来ない品目があります。これらの品目については、接続係数を発生年月の
前月以前の数値に乗じて、発生年月以降の数値と接続してご利用ください。
なお、接続係数表はP.124を参照してください。
(5) 平成24年年報まで掲載しておりました石油製品需給統計調査の結果については、経済産
業省資源エネルギー庁の「資源・エネルギー 統計年報」により公表されております。
5.問い合わせ先
この年報の内容についての問い合わせは、下記あてにご連絡ください。
東京都千代田区霞が関一丁目3番1号(郵便番号100-8902) 経済産業省大臣官房調査統計グループ鉱工業動態統計室
資源・窯業班
電話 03(3501)1511(代) 内線2868

Notes for utilization
1. Statistical Materials This yearbook, the Fundamental Statistics based on the Statistics Act, publishes figures compiled from the
“Monthly Report of Current Production Statistics” concerning mineral resources and petroleum products, ceramics and building materials. The monthly report publishes the results of monthly survey conducted under METI’s regulations for the Current Survey of Production. The figures contained in this yearbook reflect changes that can be made after each monthly publication.
2. Scope of Survey For items included in this yearbook, the surveys cover the following establishments:
Questionnaire name Survey scope
◆Mineral resources and Petroleum products statistics
Metallic Minerals and Coke
All business establishments excluding Limestone factories : business establishments with 10 or more persons engaged
Crude oil and natural gas All business establishments Petroleum Products All business establishments
◆Ceramics and Building materials statistics
Flat glass, Safety glass, Multiple glass and Glass fiber products All business establishments
Glass products and Enameled iron products Glass products:business establishments with 10 or more persons engaged Enameled iron products:business establishments with 20 or more persons engaged
Cement and Cement products Cement:All business establishments Cement products:Business establishments with 30 or more persons engaged
Ceramic wares Business establishments with 10 or more persons engaged
Fine ceramics Business establishments with 5 or more persons engaged
Refractory brick and Monolithic refractories All business establishments Carbon products and Grinding wheels All business establishments Board and Panels All business establishments
Metal building materials Business establishments with 30 or more persons engaged
3. Definitions of surveyed items
The definition of each item in the production statistics is as follows. (1) Product ① Production
The quantity of products actually produced “including produced as a consignee” by the establishment that is the object of the survey “hereafter, the survey object.” However, “products in process” shall be excluded. Besides, “Production” includes products as process goods or for consumption for other products in “the survey
object.” ② Reception
The quantity of products received by the factories or warehouses of “the survey object” that produces the same survey commodity items due to the following circumstances: a. Purchase from other enterprises “including imports” b. Reception from other factories belonging to the same enterprise c. The commissioned products and commission-manufactured products received from the consignees
“including subcontracted factories” d. Returned products
③ Consumption The quantity of products consumed as materials, process goods and fuels in “the survey object”

④ Shipments The quantity of products actually shipped from “the survey object's” warehouse or rental warehouse which
“the survey object” mainly uses Besides, the quantity of products is distinguished as “Sales” or “Other” in the following ways: (Sales) a. Products directly sold to distributors or other consumer enterprises b. Products shipped to the headquarters/sales offices or relay points for the purpose of selling c. Commissioned products shipped to consigners that are sales dealers “including consumers” d. Products shipped to other factories of the same enterprise which are not producing the same survey
commodity (Other)
a. Products shipped to other factories of the same enterprise which are producing the same products as the survey commodity b. Products shipped to other factories of the same enterprise as materials c. Products shipped as materials for use in the commissioned products or commission-manufactured products d. The commissioned products or commission-manufactured products shipped to the manufacturers “consigners” that are producing the same survey commodity e. Products used in-house “equipment investment for an enterprise's own factory, use for samples, use for gifts, use in testing and research” f. Products consumed in-house “only in the case of the no consumption survey item”
(Sales Value) Value as evaluated by the contract price or producer's selling price
In this case, “contract price” or “producer's selling price” are the enterprise's selling prices excluding shipping charges, transport costs, insurance costs and other costs, and including consumption tax.
⑤ Inventory at the end of the month The quantity of products produced or received by “the survey object” which are actually stored in “the survey
object's” warehouses and rental warehouses which “the survey object” mainly uses. (2) Production Capacity All facilities or production capacity under the survey actually owned by “the survey object” (3) Labor Number of persons engaged at the end of month The number of employees that actually and regularly engage in production, management or other operations including the dispatched workers. 4. Others (1) Figures are rounded down to the nearest survey unit, so there may be cases where the totals vs.
breakdowns, or yearly totals vs. monthly totals, do not necessarily agree. (2) About symbols
"0" means less than 1 unit after rounding "-" means no results recorded” "…" means results are unknown "r" means data is revised "x" means data is confidential "▲" indicates a negative number
(3) When reprinting the statistics contained in this Yearbook report in other printed matter, the fact that they are based on the Yearbook of Current Production Statistics, Mineral resources and Petroleum products, Ceramics and Building materials “Ministry of Economy, Trade and Industry” must be clearly indicated.
(4) Continuity coefficients Several goods cannot be compared before and after certain dates due to revisions of some surveyed items.
For these goods, it is necessary to multiply the figures before the break date by the connecting coefficients, and then relate these figures to the figures after the break date. For details, please refer to page124.
(5) This yearbook is published separately from Current Survey of Petroleum Products, Supply and Demand, from 2013. Please refer to the Yearbook of Mineral Resources and Petroleum Products Statistics.
5. Contact information If there are any questions about the contents of this yearbook, please contact the following:
Natural Resources and Ceramics Group, Office of Current Survey for Mining and Manufacturing, Research and Statistics Department, Minister's Secretariat, Ministry of Economy, Trade and Industry 1-3-1 Kasumigaseki, Chiyoda-ku, Tokyo 100-8902, Japan Telephone: +81-3-3501-1511, Extension 2868

資源/生産・出荷・在庫統計 1
1.生産・出荷・在庫統計 / Production, Shipment and Inventory (1) 製品年表 / Annual Commodities
1) 原油及び天然ガス / Crude oil and natural gas ① 製品 / Product
平成 3 0 年 C. Y. 2018
単位 生産数量 消費数量 販 売 Sales そ の 他(*1) 在庫数量(末)
数 量 金額(千円)
Unit QuantityValue
(thousand yen)
kl 498,892 - 504,335 25,335,740 49,744 33,819
1000m3
(基準状態) (*2) 2,706,922 124,366 4,001,506 195,517,964 256,129 207,568Natural gas (in standard condition)
② 原油生産内訳 / Crude oil production details(単位:kl)(Unit:kl)
軽 質 コンデンセート
Light crude oil Condensate
356,801 304,163
③ 天然ガス生産内訳 / Natural gas production details(単位:1000m3 基準状態)(Unit:1000m3 in standard condition)
油田ガス
構造性 水溶性
Structure type Water-soluble
29,539 2,186,744 490,639
④ 天然ガス産業別出荷・消費内訳 / Breakdown of natural gas consumption and shipment by industry(単位:1000m3 基準状態)(Unit:1000m3 in standard condition)
平成 3 0 年 C. Y. 2018
原油・天然ガス鉱業
化学工業その他の製造業
電気業 ガス業 その他産業
TotalCrude oil andnatural gas
ChemicalsOther
manufacturesPower generation Gas generation Other industries
4,382,001 367,684 614,792 519,284 479,767 2,387,450 13,024
*1: 同業者間転売は販売に含め、自家使用及び同一企業の他事業所向けは「その他出荷」に含む。
*2: 基準状態とは温度15.6℃、絶対圧101.325kPaで、水蒸気で飽和された状態をいう。
Notes1:
Notes2: Standard condition is the condition of being saturated with vapor at a temperature of 15.6℃ and an absolute pressure of 101.325 kPa.
★2ページ 「2) 石油製品 ①製品」の注意書き*1: 「消費数量(精製用燃料)」とは、製油所で加熱炉・ボイラ-・発電機などの精製用燃料として使用した数量をいう。*2: 「出荷・販売部門」とは、製油所から自社、他社を問わず販売部門へ出荷したものをいう。*3: 「出荷・転送」とは、同一企業内の他製油所に払い出したものをいう。*4: 「出荷・その他(自家使用)」とは、精製用燃料以外に自家使用したものをいう。*5: 「品種振替」とは、一度生産された製品を他の製品に振り替えたものをいう。
★page2 2) Petroleum products ① Product
Notes1:
Notes2:
Notes3:
Notes4:
Notes5:
原油Crude oil
天然ガス
品 目
Commodity
原油
出 荷 Shipments
品 目
ProductionQuantity
ConsumptionQuantity
OthersQuantity
InventoryQuantityCommodity
平成 3 0 年 C. Y. 2018
平成 3 0 年 C. Y. 2018
Crude oil
ガス田ガス・炭田ガス
品 目 Natural gas from gas field and coal field
Natural gasfrom oil field
品 目 合 計
Commodity
天然ガスNatural gas
"Conversion to another product" means that which changed a produced product to other products once.
"Shipment, others "own use"" means that which used self other than fuel for refinement.
Commodity
"Consumption quantity"fuel for use in refinery""means amount of the product which used as fuel for refinement such as boilers in a refinery.
The meaning of "shipment and sales department" is that which shipped from the refinery to the sales division.
"Shipment, transfer out" is the thing which paid in other refineries in the same company.
天然ガスNatural gas
Sales among establishments in the same trade are included in the sales. In-house use and sales to other establishments in the same industry are included in othershipment.

2 資源/生産・出荷・在庫統計
1.生産・出荷・在庫統計 / Production, Shipment and Inventory (1) 製品年表 / Annual Commodities
2) 石油製品 / Petroleum products① 製品 / Product
平成 3 0 年 C. Y. 2018
消費数量 (*1)
(精製用燃料) その他 Others
その他 (*4)(自家使用)
Unit(fuel for use in
refinery) Transfer outOthers
(own use)
kl 166,232,247 37,810,768 1,557,613 197,587,716 2,635,791 146,321 ▲ 1,531,026 5,764,658
kl 51,329,363 1,884,257 45 52,805,047 406,467 142 ▲ 7,454 707,959
kl 51,231,019 1,881,868 23 52,705,881 406,267 142 ▲ 7,454 699,697
kl 6,333,260 293,376 - 6,524,390 69,538 48 ▲ 9,942 166,671
kl 44,897,759 1,588,492 23 46,181,491 336,729 94 2,488 533,026
kl 98,344 2,389 22 99,166 200 - - 8,262
kl 16,445,082 27,184,915 27,110 42,259,892 149,000 1,931 ▲ 979,116 1,079,156Naphtha total
kl 16,415,052 27,180,965 - 42,259,128 149,000 3 ▲ 975,166 1,078,101
kl 30,030 3,950 27,110 764 - 1,928 ▲ 3,950 1,055
kl 14,825,453 588,906 - 15,019,416 309,497 - ▲ 68,588 595,433
kl 14,038,274 2,535,153 25,445 15,576,907 484,298 22,066 ▲ 276,876 1,027,294
kl 40,222,876 1,870,268 208 41,254,669 755,702 750 ▲ 3,525 954,560
kl 29,371,199 3,747,269 1,504,805 30,671,785 530,827 121,432 ▲ 195,467 1,400,256
kl 12,301,824 424,983 17,752 12,468,839 157,222 7,806 ▲ 3,390 388,148
kl 17,069,375 3,322,286 1,487,053 18,202,946 373,605 113,626 ▲ 192,077 1,012,108
kl 2,455,926 217,754 - 2,617,326 15,346 17,578 ▲ 1,314 180,625
t 68,951 10,594 - 81,585 - - - 2,686
t 2,799,694 118,711 - 1,995,531 87,503 823,044 - 170,587
t 4,049,894 2,155,594 186,590 5,267,854 249,984 - ▲ 468,760 219,058
t 2,152,053 1,011,236 16,249 3,066,287 51,478 - ▲ 15,528 78,490
t 1,897,841 1,144,358 170,341 2,201,567 198,506 - ▲ 453,232 140,568
t 1,297,291 233,642 308,219 777,624 - 442,166 - 13,430
t 1,697,355 565 - 1,692,009 - 24 - 109,712
kl 562,468 3,285 109,789 451,911 - - - 20,345
kl 14,501,938 - - 4,432,006 10,069,932 - - -
kl 9,014,010 315,853 8,867,706 462,159 - - - -
注: *1~5は1ページを参照。
Notes: Please refer to page 1 for the fifth from the first of "notes".
その他の石油製品Other petroleum products
精製及び混合原料油Refining material and blending component oil
石油ガスOff gas
B.BButane・Butylene
オイルコークスPetroleum coke
回収いおうRecovered sulfur
アスファルトAsphalt
液化石油ガスLiquefied petroleum gas total
P.P 、 P.BPropane・Propylene and Propane・Butane
B・C重油Fuel oil B・C
潤滑油Lubricating oil
パラフィンParaffin wax
軽油Gas oil
重油Fuel oil total
A重油Fuel oil A
その他用ナフサUse for others
ジェット燃料油Jet fuel
灯油Kerosene
Regular motor gasoline
その他用ガソリンUse for others
ナフサ
石油化学用ナフサNaphtha for petrochemical use
Gasoline total
自動車用ガソリンMotor gasoline total
自動車用高級ガソリンPremium motor gasoline
自動車用並級ガソリン
Commodity
燃料油Main petroleum products total
ガソリン
出 荷 Shipments
品 目 単位 生産数量 受入数量販売部門
(*2)転送 (*3)
在庫数量(末)Consumption
QuantityProductionQuantity
ReceiptQuantity
To salesdepartment
Conversion toanother product
InventoryQuantity
品種振替(*5)
資源/生産・出荷・在庫統計 3
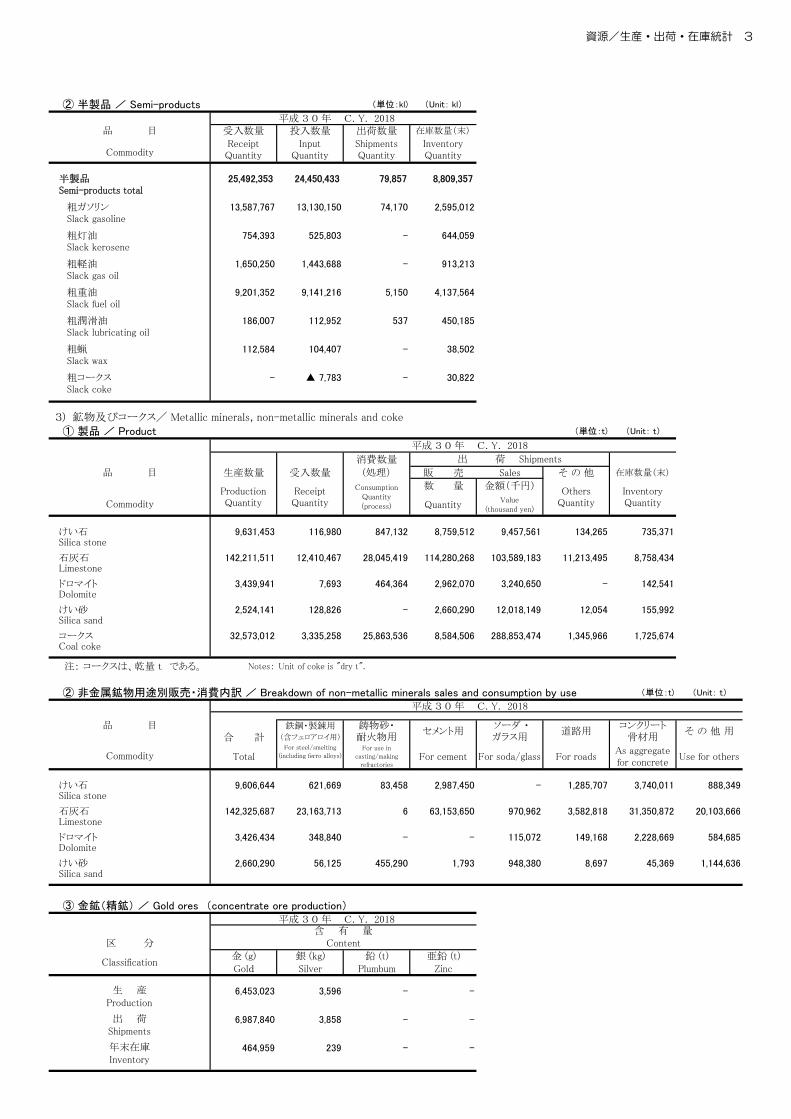
② 半製品 / Semi-products (単位:kl) (Unit: kl)
平成 3 0 年 C. Y. 2018受入数量 投入数量 出荷数量 在庫数量(末)
25,492,353 24,450,433 79,857 8,809,357
13,587,767 13,130,150 74,170 2,595,012
754,393 525,803 - 644,059
1,650,250 1,443,688 - 913,213
9,201,352 9,141,216 5,150 4,137,564
186,007 112,952 537 450,185
112,584 104,407 - 38,502
- ▲ 7,783 - 30,822
3) 鉱物及びコークス/ Metallic minerals, non-metallic minerals and coke① 製品 / Product (単位:t) (Unit: t)
平成 3 0 年 C. Y. 2018
消費数量
生産数量 受入数量 (処理) 販 売 Sales そ の 他 在庫数量(末)
数 量 金額(千円)
QuantityValue
(thousand yen)
9,631,453 116,980 847,132 8,759,512 9,457,561 134,265 735,371
142,211,511 12,410,467 28,045,419 114,280,268 103,589,183 11,213,495 8,758,434
3,439,941 7,693 464,364 2,962,070 3,240,650 - 142,541
2,524,141 128,826 - 2,660,290 12,018,149 12,054 155,992
32,573,012 3,335,258 25,863,536 8,584,506 288,853,474 1,345,966 1,725,674
注: コークスは、乾量 t である。 Notes: Unit of coke is "dry t".
② 非金属鉱物用途別販売・消費内訳 / Breakdown of non-metallic minerals sales and consumption by use (単位:t) (Unit: t)
平成 3 0 年 C. Y. 2018
鉄鋼・製錬用
合 計 (含フェロアロイ用)
TotalFor steel/smelting
(including ferro alloys)For use in
casting/makingrefractories
For cement For soda/glass For roadsAs aggregatefor concrete
Use for others
9,606,644 621,669 83,458 2,987,450 - 1,285,707 3,740,011 888,349
142,325,687 23,163,713 6 63,153,650 970,962 3,582,818 31,350,872 20,103,666
3,426,434 348,840 - - 115,072 149,168 2,228,669 584,685
2,660,290 56,125 455,290 1,793 948,380 8,697 45,369 1,144,636
③ 金鉱(精鉱) / Gold ores (concentrate ore production)平成 3 0 年 C. Y. 2018
金 (g) 銀 (kg) 鉛 (t) 亜鉛 (t)
Gold Silver Plumbum Zinc
6,453,023 3,596 - -
6,987,840 3,858 - -
464,959 239 - -Inventory
ドロマイトDolomite
けい砂Silica sand
区 分
年末在庫
生 産Production
Content
ドロマイトDolomite
けい砂Silica sand
コークス Coal coke
品 目 鋳物砂・耐火物用
セメント用
粗蝋Slack wax
粗コークスSlack coke
けい石Silica stone
品 目
Commodity
粗軽油Slack gas oil
粗重油Slack fuel oil
粗潤滑油Slack lubricating oil
半製品Semi-products total
粗ガソリンSlack gasoline
粗灯油Slack kerosene
品 目
ReceiptQuantity
InputQuantity
ShipmentsQuantity
InventoryQuantityCommodity
出 荷 Shipments
ProductionQuantity
ReceiptQuantity
ConsumptionQuantity(process)
OthersQuantity
InventoryQuantity
ソーダ ・ガラス用
道路用コンクリート
骨材用
石灰石Limestone
そ の 他 用
出 荷Shipments
Classification
Commodity
含 有 量
けい石Silica stone
石灰石Limestone
4 資源/生産・出荷・在庫統計
1.生産・出荷・在庫統計 / Production, Shipment and Inventory
(2) 時系列表 / Historical Data by Commodities 1) 原油及び天然ガス / Crude oil and natural gas ① 製品 / Product
(単位:kl) (Unit:kl)
生産数量 消費数量 数量計 販 売 Sales その他 在庫数量(末)
年 月ProductionQuantity
ConsumptionQuantity
Total数 量
Quantity
金額(千円)Value
(thousand yen)
OthersQuantity
InventoryQuantity
平成 26 年 644,129 - 705,524 634,800 43,911,680 70,724 39,908 C.Y. 201427 596,300 - 662,506 595,849 25,176,460 66,657 36,479 201528 548,915 - 606,127 547,096 16,752,187 59,031 36,698 201629 561,522 - 615,668 559,865 22,501,324 55,803 35,777 201730 498,892 - 554,079 504,335 25,335,740 49,744 33,819 2018
平成 28 年度 549,314 - 613,182 554,945 19,296,624 58,237 34,682 F.Y. 201629 546,473 - 600,192 545,658 22,876,539 54,534 30,933 2017
30 年 1~ 3月 133,896 - 157,977 143,825 6,797,687 14,152 30,933 Q1 2018 4~ 6 121,095 - 126,598 115,847 5,610,247 10,751 35,653 Q2 7~ 9 124,874 - 140,976 126,106 6,624,527 14,870 28,252 Q310~12 119,027 - 128,528 118,557 6,303,279 9,971 33,819 Q4
30 年 1月 45,883 - 62,163 55,727 2,646,569 6,436 31,702 Jan. 2018 2 42,136 - 44,153 39,772 1,859,061 4,381 32,949 Feb. 3 45,877 - 51,661 48,326 2,292,057 3,335 30,933 Mar. 4 40,293 - 44,739 38,648 1,794,837 6,091 32,489 Apr. 5 38,366 - 38,533 36,166 1,756,244 2,367 33,493 May 6 42,436 - 43,326 41,033 2,059,166 2,293 35,653 Jun.
7 42,503 - 50,662 44,273 2,293,227 6,389 29,944 Jul. 8 42,285 - 43,436 39,803 2,070,800 3,633 32,027 Aug. 9 40,086 - 46,878 42,030 2,260,500 4,848 28,252 Sep.10 37,895 - 41,828 39,433 2,140,119 2,395 29,019 Oct.11 39,401 - 46,911 42,516 2,258,366 4,395 30,680 Nov.12 41,731 - 39,789 36,608 1,904,794 3,181 33,819 Dec.
(単位:1000m3(基準状態))(Unit:1000m3 in standard condition)
出 荷 Shipments
生産数量 消費数量 数量計 販 売 Sales その他 在庫数量(末)
年 月ProductionQuantity
ConsumptionQuantity
Total数 量
Quantity
金額(千円)Value
(thousand yen)
OthersQuantity
InventoryQuantity
平成 26 年 2,822,463 118,240 4,210,411 3,814,167 206,080,157 396,244 247,636 C.Y. 201427 2,734,177 114,123 4,056,747 3,691,462 194,771,028 365,285 255,979 201528 2,754,211 119,290 4,061,631 3,743,505 165,840,112 318,126 235,886 201629 3,007,932 127,443 4,275,965 3,989,043 177,626,121 286,922 228,136 201730 2,706,922 124,366 4,257,635 4,001,506 195,517,964 256,129 207,568 2018
平成 28 年度 2,797,235 122,657 4,113,361 3,806,046 162,681,152 307,315 205,248 F.Y. 201629 2,925,598 126,070 4,284,760 3,999,823 180,401,528 284,937 207,869 2017
30 年 1~ 3月 748,677 36,307 1,256,272 1,185,766 54,716,373 70,506 207,869 Q1 2018 4~ 6 639,179 29,619 932,467 875,336 41,863,986 57,131 221,223 Q2 7~ 9 666,264 30,369 975,499 913,367 44,405,363 62,132 227,481 Q310~12 652,802 28,071 1,093,397 1,027,037 54,532,242 66,360 207,568 Q4
30 年 1月 264,297 12,555 440,639 416,382 19,226,587 24,257 216,073 Jan. 2018 2 234,831 11,486 412,504 390,162 18,256,971 22,342 208,656 Feb. 3 249,549 12,266 403,129 379,222 17,232,815 23,907 207,869 Mar. 4 224,197 10,282 325,768 303,629 14,331,455 22,139 212,934 Apr. 5 199,136 9,350 298,999 282,247 13,612,187 16,752 215,152 May 6 215,846 9,987 307,700 289,460 13,920,344 18,240 221,223 Jun.
7 233,561 10,234 334,717 311,155 14,840,554 23,562 227,893 Jul. 8 222,858 10,455 327,969 306,074 14,879,295 21,895 230,341 Aug. 9 209,845 9,680 312,813 296,138 14,685,514 16,675 227,481 Sep.10 196,040 5,436 323,731 303,208 15,376,527 20,523 231,287 Oct.11 222,509 10,546 358,175 334,694 17,673,913 23,481 223,168 Nov.12 234,253 12,089 411,491 389,135 21,481,802 22,356 207,568 Dec.
原油Crude oil
出 荷 Shipments
Year, Quarter and Month
天然ガスNatural gas
Year, Quarter and Month
資源/生産・出荷・在庫統計 5
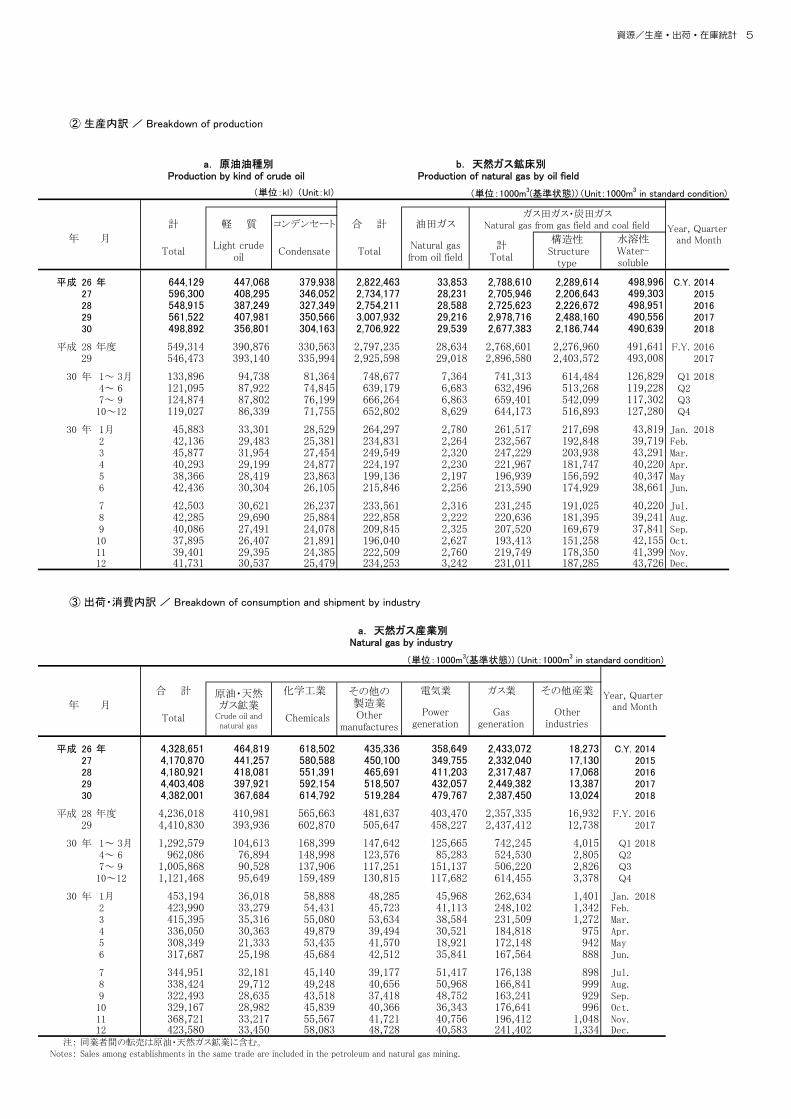
1.生産・出荷・在庫統計 / Production, Shipment and Inventory
(2) 時系列表 / Historical Data by Commodities 1) 原油及び天然ガス / Crude oil and natural gas ② 生産内訳 / Breakdown of production
(単位:kl) (Unit:kl) (単位:1000m3(基準状態))(Unit:1000m3 in standard condition)
計 軽 質 コンデンセート 合 計 油田ガス
年 月Total
Light crudeoil
Condensate TotalNatural gasfrom oil field
計Total
構造性 Structure
type
平成 26 年 644,129 447,068 379,938 2,822,463 33,853 2,788,610 2,289,614 C.Y. 201427 596,300 408,295 346,052 2,734,177 28,231 2,705,946 2,206,643 201528 548,915 387,249 327,349 2,754,211 28,588 2,725,623 2,226,672 201629 561,522 407,981 350,566 3,007,932 29,216 2,978,716 2,488,160 201730 498,892 356,801 304,163 2,706,922 29,539 2,677,383 2,186,744 2018
平成 28 年度 549,314 390,876 330,563 2,797,235 28,634 2,768,601 2,276,960 F.Y. 201629 546,473 393,140 335,994 2,925,598 29,018 2,896,580 2,403,572 2017
30 年 1~ 3月 133,896 94,738 81,364 748,677 7,364 741,313 614,484 Q1 2018 4~ 6 121,095 87,922 74,845 639,179 6,683 632,496 513,268 Q2 7~ 9 124,874 87,802 76,199 666,264 6,863 659,401 542,099 Q310~12 119,027 86,339 71,755 652,802 8,629 644,173 516,893 Q4
30 年 1月 45,883 33,301 28,529 264,297 2,780 261,517 217,698 Jan. 2018 2 42,136 29,483 25,381 234,831 2,264 232,567 192,848 Feb. 3 45,877 31,954 27,454 249,549 2,320 247,229 203,938 Mar. 4 40,293 29,199 24,877 224,197 2,230 221,967 181,747 Apr. 5 38,366 28,419 23,863 199,136 2,197 196,939 156,592 May 6 42,436 30,304 26,105 215,846 2,256 213,590 174,929 Jun.
7 42,503 30,621 26,237 233,561 2,316 231,245 191,025 Jul. 8 42,285 29,690 25,884 222,858 2,222 220,636 181,395 Aug. 9 40,086 27,491 24,078 209,845 2,325 207,520 169,679 Sep.10 37,895 26,407 21,891 196,040 2,627 193,413 151,258 Oct.11 39,401 29,395 24,385 222,509 2,760 219,749 178,350 Nov.12 41,731 30,537 25,479 234,253 3,242 231,011 187,285 Dec.
③ 出荷・消費内訳 / Breakdown of consumption and shipment by industry
(単位:1000m3(基準状態))(Unit:1000m3 in standard condition)
合 計 化学工業 電気業 ガス業 その他産業
年 月Total Chemicals
Powergeneration
Gasgeneration
Otherindustries
平成 26 年 4,328,651 464,819 618,502 435,336 358,649 2,433,072 18,273 C.Y. 201427 4,170,870 441,257 580,588 450,100 349,755 2,332,040 17,130 201528 4,180,921 418,081 551,391 465,691 411,203 2,317,487 17,068 201629 4,403,408 397,921 592,154 518,507 432,057 2,449,382 13,387 201730 4,382,001 367,684 614,792 519,284 479,767 2,387,450 13,024 2018
平成 28 年度 4,236,018 410,981 565,663 481,637 403,470 2,357,335 16,932 F.Y. 201629 4,410,830 393,936 602,870 505,647 458,227 2,437,412 12,738 2017
30 年 1~ 3月 1,292,579 104,613 168,399 147,642 125,665 742,245 4,015 Q1 2018 4~ 6 962,086 76,894 148,998 123,576 85,283 524,530 2,805 Q2 7~ 9 1,005,868 90,528 137,906 117,251 151,137 506,220 2,826 Q310~12 1,121,468 95,649 159,489 130,815 117,682 614,455 3,378 Q4
30 年 1月 453,194 36,018 58,888 48,285 45,968 262,634 1,401 Jan. 2018 2 423,990 33,279 54,431 45,723 41,113 248,102 1,342 Feb. 3 415,395 35,316 55,080 53,634 38,584 231,509 1,272 Mar. 4 336,050 30,363 49,879 39,494 30,521 184,818 975 Apr. 5 308,349 21,333 53,435 41,570 18,921 172,148 942 May 6 317,687 25,198 45,684 42,512 35,841 167,564 888 Jun.
7 344,951 32,181 45,140 39,177 51,417 176,138 898 Jul. 8 338,424 29,712 49,248 40,656 50,968 166,841 999 Aug. 9 322,493 28,635 43,518 37,418 48,752 163,241 929 Sep.10 329,167 28,982 45,839 40,366 36,343 176,641 996 Oct.11 368,721 33,217 55,567 41,721 40,756 196,412 1,048 Nov.12 423,580 33,450 58,083 48,728 40,583 241,402 1,334 Dec.
注: 同業者間の転売は原油・天然ガス鉱業に含む。Notes: Sales among establishments in the same trade are included in the petroleum and natural gas mining.
498,951490,556
a. 原油油種別Production by kind of crude oil
b. 天然ガス鉱床別Production of natural gas by oil field
Year, Quarter and Month
ガス田ガス・炭田ガスNatural gas from gas field and coal field
水溶性Water-soluble
498,996499,303
42,155
39,24137,841
119,228117,302
490,639
491,641
39,71943,29140,22040,347
a. 天然ガス産業別Natural gas by industry
127,280
43,819
38,661
40,220
Year, Quarter and Month
原油・天然ガス鉱業
Crude oil andnatural gas
その他の製造業Other
manufactures
493,008
126,829
41,39943,726

6 資源/生産・出荷・在庫統計
1.生産・出荷・在庫統計 / Production, Shipment and Inventory
(2) 時系列表 / Historical Data by Commodities 2) 石油製品 / Petroleum products ① 製品 / Product
(単位:kl) (Unit:kl)
生産数量 受入数量 販売部門 その他 Others 品種振替 在庫数量(末)
年 月ProductionQuantity
ReceiptQuantity
Consumption(fuel for use in
refinery)
To Salesdepartment
転送Transfer out
その他(自家使用)
Others(own use)
Conversion toanotherproduct
InventoryQuantity
平成 26 年 179,631,102 34,893,737 1,615,939 207,910,421 2,987,829 279,522 ▲ 1,379,145 6,509,731 C.Y. 201427 178,849,970 39,872,527 1,537,216 211,677,599 3,639,622 165,975 ▲ 2,040,360 r6,130,015 201528 180,232,109 35,941,502 1,507,076 209,191,930 4,474,205 184,543 ▲ 1,547,027 r5,216,858 201629 175,133,561 36,627,909 1,560,476 205,821,411 2,768,330 135,050 ▲ 1,578,806 r5,138,118 201730 166,232,247 37,810,768 1,557,613 197,587,716 2,635,791 146,321 ▲ 1,531,026 5,764,658 2018
平成 28 年度 179,238,977 36,002,099 1,491,931 207,680,124 4,283,908 173,345 ▲ 1,628,585 r4,990,214 F.Y. 201629 172,818,375 37,020,183 1,594,461 203,940,368 2,426,286 148,877 ▲ 1,604,214 5,140,649 2017
30 年 1~ 3月 44,483,627 9,979,343 450,259 52,975,176 615,403 41,559 ▲ 363,650 5,140,649 Q1 2018 4~ 6 37,990,151 9,166,809 341,203 45,482,745 872,900 34,045 ▲ 578,687 5,004,668 Q2 7~ 9 41,564,908 8,752,901 317,395 48,251,024 471,016 36,933 ▲ 255,431 6,027,991 Q310~12 42,193,561 9,911,715 448,756 50,878,771 676,472 33,784 ▲ 333,258 5,764,658 Q4
30 年 1月 15,186,378 3,368,254 157,130 18,038,601 181,272 21,938 ▲ 90,974 5,196,917 Jan. 2018 2 13,951,794 3,262,214 146,325 17,285,565 226,572 10,547 ▲ 141,932 4,594,837 Feb. 3 15,345,455 3,348,875 146,804 17,651,010 207,559 9,074 ▲ 130,744 5,140,649 Mar. 4 13,514,054 3,125,594 120,437 15,881,479 160,055 12,734 ▲ 176,934 5,432,482 Apr. 5 12,977,121 3,261,526 102,645 15,571,159 415,703 9,397 ▲ 211,305 5,366,336 May 6 11,498,976 2,779,689 118,121 14,030,107 297,142 11,914 ▲ 190,448 5,004,668 Jun.
7 13,337,777 2,964,024 101,908 15,794,772 157,279 17,296 ▲ 73,283 5,173,445 Jul. 8 14,470,301 2,891,464 102,429 16,499,612 123,686 10,557 ▲ 75,984 5,736,856 Aug. 9 13,756,830 2,897,413 113,058 15,956,640 190,051 9,080 ▲ 106,164 6,027,991 Sep.10 12,757,180 3,408,447 148,071 16,026,760 263,964 6,056 ▲ 157,761 5,593,472 Oct.11 14,161,147 3,296,722 144,188 16,426,885 218,619 10,124 ▲ 81,832 6,171,752 Nov.12 15,275,234 3,206,546 156,497 18,425,126 193,889 17,604 ▲ 93,665 5,764,658 Dec.
(単位:kl) (Unit:kl)
生産数量 受入数量 販売部門 その他 Others 品種振替 在庫数量(末)
年 月ProductionQuantity
ReceiptQuantity
Consumption(fuel for use in
refinery)
To salesdepartment
転送Transfer out
その他(自家使用)
Others(own use)
Conversion toanotherproduct
InventoryQuantity
平成 26 年 53,540,222 1,963,520 193 55,275,726 417,072 204 ▲ 5,151 718,449 C.Y. 201427 54,350,628 2,752,636 276 56,401,537 649,770 156 ▲ 30,252 738,774 201528 54,109,061 2,202,846 121 55,181,991 1,051,706 150 ▲ 29,364 740,900 201629 53,737,984 1,379,477 297 54,648,750 508,753 160 ▲ 1,290 708,950 201730 51,329,363 1,884,257 45 52,805,047 406,467 142 ▲ 7,454 707,959 2018
平成 28 年度 53,715,282 1,973,437 301 54,646,271 918,773 162 ▲ 29,761 844,821 F.Y. 201629 53,228,989 1,292,307 118 54,203,251 368,905 154 ▲ 10,834 790,323 2017
30 年 1~ 3月 13,097,973 265,419 27 13,196,646 60,820 40 ▲ 9,941 790,323 Q1 2018 4~ 6 12,201,947 566,641 5 12,662,008 162,004 28 - 741,162 Q2 7~ 9 13,322,856 565,369 8 13,693,425 111,015 40 2,488 846,137 Q310~12 12,706,587 486,828 5 13,252,968 72,628 34 ▲ 1 707,959 Q4
30 年 1月 4,533,835 90,036 - 4,488,930 13,700 14 - 824,480 Jan. 2018 2 4,116,473 81,010 13 4,138,768 37,540 8 - 840,475 Feb. 3 4,447,665 94,373 14 4,568,948 9,580 18 ▲ 9,941 790,323 Mar. 4 4,151,843 211,740 1 4,270,764 22,000 4 - 861,788 Apr. 5 4,307,986 158,471 3 4,366,602 85,683 17 - 878,011 May 6 3,742,118 196,430 1 4,024,642 54,321 7 - 741,162 Jun.
7 4,414,155 131,690 3 4,549,414 32,401 16 2,488 714,380 Jul. 8 4,634,614 201,214 2 4,764,057 22,780 10 - 770,632 Aug. 9 4,274,087 232,465 3 4,379,954 55,834 14 - 846,137 Sep.10 3,945,933 265,994 1 4,212,421 50,012 9 - 796,498 Oct.11 4,140,522 122,236 3 4,194,189 13,116 14 ▲ 1 850,236 Nov.12 4,620,132 98,598 1 4,846,358 9,500 11 - 707,959 Dec.
燃料油 (1)~(10)Main petroleum products total
消費数量(精製用燃料)
出 荷 Shipments
Year, Quarter and Month
ガソリン (1)~(3)Gasoline total
消費数量(精製用燃料)
出 荷 Shipments
Year, Quarter and Month

資源/生産・出荷・在庫統計 7
1.生産・出荷・在庫統計 / Production, Shipment and Inventory
(2) 時系列表 / Historical Data by Commodities 2) 石油製品 / Petroleum products ① 製品(続き) / Product (continued)
(単位:kl) (Unit:kl)
生産数量 受入数量 販売部門 その他 Others 品種振替 在庫数量(末)
年 月ProductionQuantity
ReceiptQuantity
Consumption(fuel for use in
refinery)
To Salesdepartment
転送Transfer out
その他(自家使用)
Others(own use)
Conversion toanotherproduct
InventoryQuantity
平成 26 年 53,442,171 1,960,620 26 55,172,511 416,642 204 ▲ 5,149 712,534 C.Y. 201427 54,248,717 2,749,715 36 56,298,169 649,540 155 ▲ 30,213 731,909 201528 54,010,801 2,188,820 35 55,080,397 1,051,216 128 ▲ 19,353 733,960 201629 53,636,706 1,376,527 28 54,546,022 508,363 143 ▲ 488 702,003 201730 51,231,019 1,881,868 23 52,705,881 406,267 142 ▲ 7,454 699,697 2018
平成 28 年度 53,615,285 1,959,978 35 54,541,805 918,483 131 ▲ 19,353 838,892 F.Y. 201629 53,131,600 1,289,374 27 54,105,013 368,515 150 ▲ 10,429 783,215 2017
30 年 1~ 3月 13,075,416 264,927 5 13,173,785 60,820 40 ▲ 9,941 783,215 Q1 2018 4~ 6 12,176,466 565,709 5 12,636,903 161,804 28 - 732,947 Q2 7~ 9 13,300,479 564,887 8 13,669,313 111,015 40 2,488 839,189 Q310~12 12,678,658 486,345 5 13,225,880 72,628 34 ▲ 1 699,697 Q4
30 年 1月 4,526,476 89,877 - 4,482,391 13,700 14 - 816,557 Jan. 2018 2 4,109,909 80,859 2 4,132,008 37,540 8 - 832,609 Feb. 3 4,439,031 94,191 3 4,559,386 9,580 18 ▲ 9,941 783,215 Mar. 4 4,143,453 211,571 1 4,262,497 22,000 4 - 854,388 Apr. 5 4,299,681 157,876 3 4,357,140 85,483 17 - 871,374 May 6 3,733,332 196,262 1 4,017,266 54,321 7 - 732,947 Jun.
7 4,408,511 131,546 3 4,541,442 32,401 16 2,488 708,350 Jul. 8 4,625,995 201,062 2 4,756,101 22,780 10 - 763,791 Aug. 9 4,265,973 232,279 3 4,371,770 55,834 14 - 839,189 Sep.10 3,935,796 265,827 1 4,203,062 50,012 9 - 788,614 Oct.11 4,132,301 122,057 3 4,185,589 13,116 14 ▲ 1 842,553 Nov.12 4,610,561 98,461 1 4,837,229 9,500 11 - 699,697 Dec.
(単位:kl) (Unit:kl)
生産数量 受入数量 販売部門 その他 Others 品種振替 在庫数量(末)
年 月ProductionQuantity
ReceiptQuantity
Consumption(fuel for use in
refinery)
To salesdepartment
転送Transfer out
その他(自家使用)
Others(own use)
Conversion toanotherproduct
InventoryQuantity
平成 26 年 6,857,943 477,323 - 7,276,875 98,744 100 ▲ 3,414 170,189 C.Y. 201427 7,221,468 574,701 - 7,669,479 106,518 72 ▲ 625 186,947 201528 6,333,279 458,029 - 6,652,877 155,325 49 ▲ 19,375 141,678 201629 6,001,673 321,705 - 6,261,242 56,018 52 - 147,256 201730 6,333,260 293,376 - 6,524,390 69,538 48 ▲ 9,942 166,671 2018
平成 28 年度 6,165,206 429,245 - 6,419,512 159,613 53 ▲ 19,353 153,899 F.Y. 201629 6,082,795 317,938 - 6,334,319 47,090 53 ▲ 9,941 161,533 2017
30 年 1~ 3月 1,619,319 73,774 - 1,656,558 9,640 15 ▲ 9,941 161,533 Q1 2018 4~ 6 1,600,060 75,337 - 1,631,489 20,480 8 - 184,670 Q2 7~ 9 1,565,812 75,518 - 1,633,583 25,991 14 - 167,861 Q310~12 1,548,069 68,747 - 1,602,760 13,427 11 ▲ 1 166,671 Q4
30 年 1月 589,570 30,718 - 570,735 3,700 6 - 192,099 Jan. 2018 2 496,981 24,094 - 535,957 5,040 - - 171,351 Feb. 3 532,768 18,962 - 549,866 900 9 ▲ 9,941 161,533 Mar. 4 538,811 24,139 - 565,537 2,930 - - 155,882 Apr. 5 561,928 31,836 - 582,216 10,900 8 - 156,499 May 6 499,321 19,362 - 483,736 6,650 - - 184,670 Jun.
7 505,488 15,468 - 543,612 500 8 - 161,905 Jul. 8 522,138 25,499 - 546,155 5,500 - - 158,562 Aug. 9 538,186 34,551 - 543,816 19,991 6 - 167,861 Sep.10 455,129 32,591 - 465,657 9,311 2 - 180,138 Oct.11 453,024 15,684 - 493,804 2,616 6 ▲ 1 152,000 Nov.12 639,916 20,472 - 643,299 1,500 3 - 166,671 Dec.
自動車用ガソリン (1)~(2)Motor gasoline total
消費数量(精製用燃料)
出 荷 Shipments
Year, Quarter and Month
自動車用高級ガソリン (1)Premium motor gasoline
消費数量(精製用燃料)
出 荷 Shipments
Year, Quarter and Month
8 資源/生産・出荷・在庫統計
1.生産・出荷・在庫統計 / Production, Shipment and Inventory
(2) 時系列表 / Historical Data by Commodities 2) 石油製品 / Petroleum products ① 製品(続き) / Product (continued)
(単位:kl) (Unit:kl)
生産数量 受入数量 販売部門 その他 Others 品種振替 在庫数量(末)
年 月ProductionQuantity
ReceiptQuantity
Consumption(fuel for use in
refinery)
To Salesdepartment
転送Transfer out
その他(自家使用)
Others(own use)
Conversion toanotherproduct
InventoryQuantity
平成 26 年 46,584,228 1,483,297 26 47,895,636 317,898 104 ▲ 1,735 542,345 C.Y. 201427 47,027,249 2,175,014 36 48,628,690 543,022 83 ▲ 29,588 544,962 201528 47,677,522 1,730,791 35 48,427,520 895,891 79 22 592,282 201629 47,635,033 1,054,822 28 48,284,780 452,345 91 ▲ 488 554,747 201730 44,897,759 1,588,492 23 46,181,491 336,729 94 2,488 533,026 2018
平成 28 年度 47,450,079 1,530,733 35 48,122,293 758,870 78 - 684,993 F.Y. 201629 47,048,805 971,436 27 47,770,694 321,425 97 ▲ 488 621,682 2017
30 年 1~ 3月 11,456,097 191,153 5 11,517,227 51,180 25 - 621,682 Q1 2018 4~ 6 10,576,406 490,372 5 11,005,414 141,324 20 - 548,277 Q2 7~ 9 11,734,667 489,369 8 12,035,730 85,024 26 2,488 671,328 Q310~12 11,130,589 417,598 5 11,623,120 59,201 23 - 533,026 Q4
30 年 1月 3,936,906 59,159 - 3,911,656 10,000 8 - 624,458 Jan. 2018 2 3,612,928 56,765 2 3,596,051 32,500 8 - 661,258 Feb. 3 3,906,263 75,229 3 4,009,520 8,680 9 - 621,682 Mar. 4 3,604,642 187,432 1 3,696,960 19,070 4 - 698,506 Apr. 5 3,737,753 126,040 3 3,774,924 74,583 9 - 714,875 May 6 3,234,011 176,900 1 3,533,530 47,671 7 - 548,277 Jun.
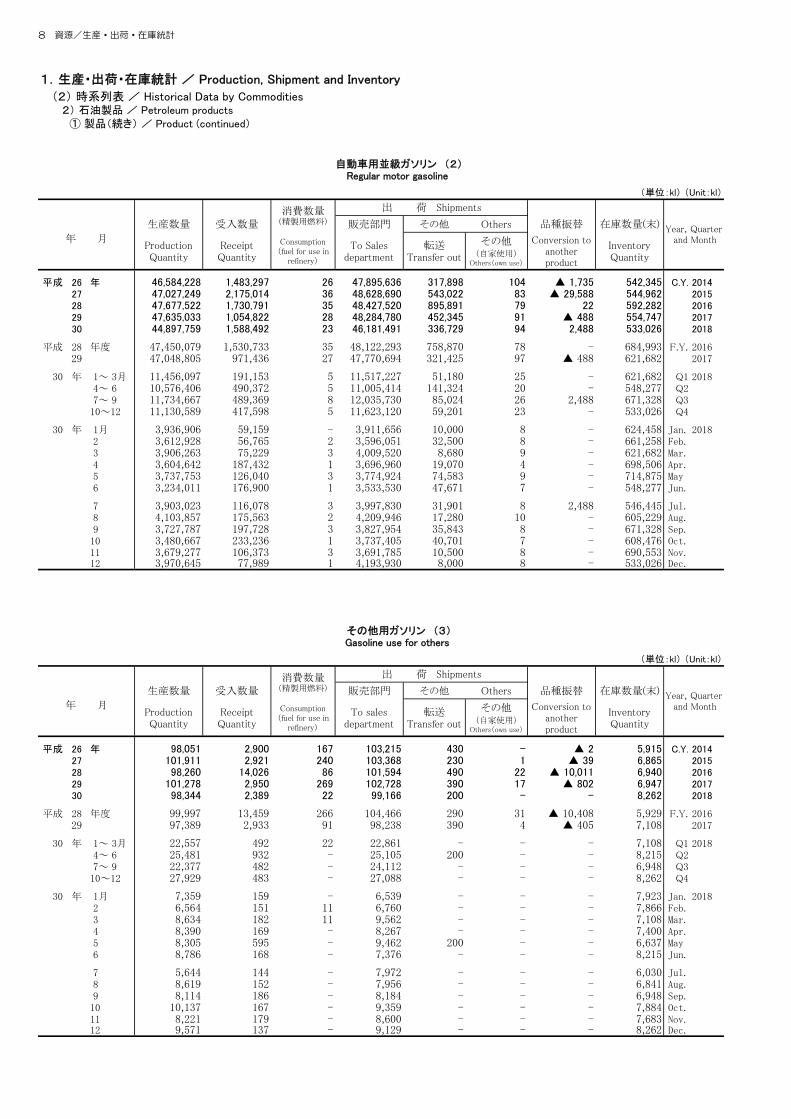
7 3,903,023 116,078 3 3,997,830 31,901 8 2,488 546,445 Jul. 8 4,103,857 175,563 2 4,209,946 17,280 10 - 605,229 Aug. 9 3,727,787 197,728 3 3,827,954 35,843 8 - 671,328 Sep.10 3,480,667 233,236 1 3,737,405 40,701 7 - 608,476 Oct.11 3,679,277 106,373 3 3,691,785 10,500 8 - 690,553 Nov.12 3,970,645 77,989 1 4,193,930 8,000 8 - 533,026 Dec.
(単位:kl) (Unit:kl)
生産数量 受入数量 販売部門 その他 Others 品種振替 在庫数量(末)
年 月ProductionQuantity
ReceiptQuantity
Consumption(fuel for use in
refinery)
To salesdepartment
転送Transfer out
その他(自家使用)
Others(own use)
Conversion toanotherproduct
InventoryQuantity
平成 26 年 98,051 2,900 167 103,215 430 - ▲ 2 5,915 C.Y. 201427 101,911 2,921 240 103,368 230 1 ▲ 39 6,865 201528 98,260 14,026 86 101,594 490 22 ▲ 10,011 6,940 201629 101,278 2,950 269 102,728 390 17 ▲ 802 6,947 201730 98,344 2,389 22 99,166 200 - - 8,262 2018
平成 28 年度 99,997 13,459 266 104,466 290 31 ▲ 10,408 5,929 F.Y. 201629 97,389 2,933 91 98,238 390 4 ▲ 405 7,108 2017
30 年 1~ 3月 22,557 492 22 22,861 - - - 7,108 Q1 2018 4~ 6 25,481 932 - 25,105 200 - - 8,215 Q2 7~ 9 22,377 482 - 24,112 - - - 6,948 Q310~12 27,929 483 - 27,088 - - - 8,262 Q4
30 年 1月 7,359 159 - 6,539 - - - 7,923 Jan. 2018 2 6,564 151 11 6,760 - - - 7,866 Feb. 3 8,634 182 11 9,562 - - - 7,108 Mar. 4 8,390 169 - 8,267 - - - 7,400 Apr. 5 8,305 595 - 9,462 200 - - 6,637 May 6 8,786 168 - 7,376 - - - 8,215 Jun.
7 5,644 144 - 7,972 - - - 6,030 Jul. 8 8,619 152 - 7,956 - - - 6,841 Aug. 9 8,114 186 - 8,184 - - - 6,948 Sep.10 10,137 167 - 9,359 - - - 7,884 Oct.11 8,221 179 - 8,600 - - - 7,683 Nov.12 9,571 137 - 9,129 - - - 8,262 Dec.
自動車用並級ガソリン (2)Regular motor gasoline
消費数量(精製用燃料)
出 荷 Shipments
Year, Quarter and Month
その他用ガソリン (3)Gasoline use for others
消費数量(精製用燃料)
出 荷 Shipments
Year, Quarter and Month

資源/生産・出荷・在庫統計 9
1.生産・出荷・在庫統計 / Production, Shipment and Inventory
(2) 時系列表 / Historical Data by Commodities 2) 石油製品 / Petroleum products ① 製品(続き) / Product (continued)
(単位:kl) (Unit:kl)
生産数量 受入数量 販売部門 その他 Others 品種振替 在庫数量(末)
年 月ProductionQuantity
ReceiptQuantity
Consumption(fuel for use in
refinery)
To Salesdepartment
転送Transfer out
その他(自家使用)
Others(own use)
Conversion toanotherproduct
InventoryQuantity
平成 26 年 18,300,452 22,664,639 37,354 39,423,209 200,253 2,179 ▲ 963,133 1,251,682 C.Y. 201427 19,205,713 26,161,699 55,857 43,829,670 200,701 1,930 ▲ 1,455,268 1,072,141 201528 20,001,795 25,372,569 28,728 44,177,613 242,550 2,043 ▲ 1,053,568 935,703 201629 18,790,748 27,520,358 29,807 45,175,036 172,814 2,691 ▲ 980,038 876,338 201730 16,445,082 27,184,915 27,110 42,259,892 149,000 1,931 ▲ 979,116 1,079,156 2018
平成 28 年度 20,013,265 25,848,387 28,386 44,600,412 216,812 2,253 ▲ 1,088,558 1,110,919 F.Y. 201629 18,037,831 27,458,487 28,635 44,243,465 186,195 2,486 ▲ 1,004,278 1,132,931 2017
30 年 1~ 3月 4,580,008 6,931,787 6,549 10,935,691 54,384 470 ▲ 256,137 1,132,931 Q1 2018 4~ 6 3,546,889 6,497,020 5,674 9,791,548 42,583 782 ▲ 389,291 943,854 Q2 7~ 9 4,054,360 6,478,098 7,225 10,136,813 19,431 320 ▲ 140,227 1,169,742 Q310~12 4,263,825 7,278,010 7,662 11,395,840 32,602 359 ▲ 193,461 1,079,156 Q4
30 年 1月 1,576,910 2,508,460 1,545 3,839,753 16,082 226 ▲ 63,163 1,041,190 Jan. 2018 2 1,372,138 2,137,470 3,257 3,469,108 13,091 243 ▲ 121,466 942,986 Feb. 3 1,630,960 2,285,857 1,747 3,626,830 25,211 1 ▲ 71,508 1,132,931 Mar. 4 1,476,801 2,303,644 1,554 3,731,950 11,701 234 ▲ 129,792 1,037,626 Apr. 5 1,178,422 2,306,083 2,030 3,357,363 16,801 282 ▲ 147,527 996,865 May 6 891,666 1,887,293 2,090 2,702,235 14,081 266 ▲ 111,972 943,854 Jun.
7 1,222,442 2,238,074 2,448 3,313,900 8,620 154 ▲ 41,381 1,036,232 Jul. 8 1,421,726 2,084,010 2,338 3,436,857 6,010 166 ▲ 40,017 1,055,778 Aug. 9 1,410,192 2,156,014 2,439 3,386,056 4,801 - ▲ 58,829 1,169,742 Sep.10 1,280,574 2,333,998 2,572 3,587,435 4,010 - ▲ 106,448 1,082,058 Oct.11 1,475,997 2,545,776 2,474 3,838,124 19,901 44 ▲ 40,276 1,202,555 Nov.12 1,507,254 2,398,236 2,616 3,970,281 8,691 315 ▲ 46,737 1,079,156 Dec.
(単位:kl) (Unit:kl)
生産数量 受入数量 販売部門 その他 Others 品種振替 在庫数量(末)
年 月ProductionQuantity
ReceiptQuantity
Consumption(fuel for use in
refinery)
To salesdepartment
転送Transfer out
その他(自家使用)
Others(own use)
Conversion toanotherproduct
InventoryQuantity
平成 26 年 18,199,794 22,631,947 10,526 39,352,929 200,253 4 ▲ 930,441 1,249,219 C.Y. 201427 19,071,470 26,161,699 29,276 43,723,256 200,701 5 ▲ 1,455,785 1,069,839 201528 19,933,899 25,372,569 2,100 44,136,515 242,550 4 ▲ 1,054,696 934,142 201629 18,758,302 27,507,358 - 45,174,351 172,814 4 ▲ 967,038 875,510 201730 16,415,052 27,180,965 - 42,259,128 149,000 3 ▲ 975,166 1,078,101 2018
平成 28 年度 19,965,524 25,848,387 2,100 44,581,730 216,812 4 ▲ 1,088,558 1,108,421 F.Y. 201629 18,007,722 27,441,537 - 44,242,857 186,195 3 ▲ 987,328 1,132,050 2017
30 年 1~ 3月 4,572,716 6,927,837 - 10,935,470 54,384 1 ▲ 252,187 1,132,050 Q1 2018 4~ 6 3,539,478 6,497,020 - 9,791,300 42,583 1 ▲ 389,291 942,266 Q2 7~ 9 4,045,823 6,478,098 - 10,136,744 19,431 - ▲ 140,227 1,167,231 Q310~12 4,257,035 7,278,010 - 11,395,614 32,602 1 ▲ 193,461 1,078,101 Q4
30 年 1月 1,574,988 2,506,460 - 3,839,692 16,082 - ▲ 61,163 1,040,273 Jan. 2018 2 1,368,710 2,135,520 - 3,469,032 13,091 - ▲ 119,516 942,217 Feb. 3 1,629,018 2,285,857 - 3,626,746 25,211 1 ▲ 71,508 1,132,050 Mar. 4 1,474,307 2,303,644 - 3,731,870 11,701 - ▲ 129,792 1,036,120 Apr. 5 1,175,901 2,306,083 - 3,357,277 16,801 1 ▲ 147,527 995,235 May 6 889,270 1,887,293 - 2,702,153 14,081 - ▲ 111,972 942,266 Jun.
7 1,219,971 2,238,074 - 3,313,833 8,620 - ▲ 41,381 1,034,842 Jul. 8 1,418,590 2,084,010 - 3,436,855 6,010 - ▲ 40,017 1,053,758 Aug. 9 1,407,262 2,156,014 - 3,386,056 4,801 - ▲ 58,829 1,167,231 Sep.10 1,278,432 2,333,998 - 3,587,372 4,010 - ▲ 106,448 1,080,040 Oct.11 1,473,758 2,545,776 - 3,838,045 19,901 - ▲ 40,276 1,200,895 Nov.12 1,504,845 2,398,236 - 3,970,197 8,691 1 ▲ 46,737 1,078,101 Dec.
ナフサ (4)~(5)Naphtha total
消費数量(精製用燃料)
出 荷 Shipments
Year, Quarter and Month
石油化学用ナフサ (4)Naphtha for petrochemical use
消費数量(精製用燃料)
出 荷 Shipments
Year, Quarter and Month

10 資源/生産・出荷・在庫統計
1.生産・出荷・在庫統計 / Production, Shipment and Inventory
(2) 時系列表 / Historical Data by Commodities 2) 石油製品 / Petroleum products ① 製品(続き) / Product (continued)
(単位:kl) (Unit:kl)
生産数量 受入数量 販売部門 その他 Others 品種振替 在庫数量(末)
年 月ProductionQuantity
ReceiptQuantity
Consumption(fuel for use in
refinery)
To Salesdepartment
転送Transfer out
その他(自家使用)
Others(own use)
Conversion toanotherproduct
InventoryQuantity
平成 26 年 100,658 32,692 26,828 70,280 - 2,175 ▲ 32,692 2,463 C.Y. 201427 134,243 - 26,581 106,414 - 1,925 517 2,302 201528 67,896 - 26,628 41,098 - 2,039 1,128 1,561 201629 32,446 13,000 29,807 685 - 2,687 ▲ 13,000 828 201730 30,030 3,950 27,110 764 - 1,928 ▲ 3,950 1,055 2018
平成 28 年度 47,741 - 26,286 18,682 - 2,249 - 2,498 F.Y. 201629 30,109 16,950 28,635 608 - 2,483 ▲ 16,950 881 2017
30 年 1~ 3月 7,292 3,950 6,549 221 - 469 ▲ 3,950 881 Q1 2018 4~ 6 7,411 - 5,674 248 - 781 - 1,588 Q2 7~ 9 8,537 - 7,225 69 - 320 - 2,511 Q310~12 6,790 - 7,662 226 - 358 - 1,055 Q4
30 年 1月 1,922 2,000 1,545 61 - 226 ▲ 2,000 917 Jan. 2018 2 3,428 1,950 3,257 76 - 243 ▲ 1,950 769 Feb. 3 1,942 - 1,747 84 - - - 881 Mar. 4 2,494 - 1,554 80 - 234 - 1,506 Apr. 5 2,521 - 2,030 86 - 281 - 1,630 May 6 2,396 - 2,090 82 - 266 - 1,588 Jun.
7 2,471 - 2,448 67 - 154 - 1,390 Jul. 8 3,136 - 2,338 2 - 166 - 2,020 Aug. 9 2,930 - 2,439 - - - - 2,511 Sep.10 2,142 - 2,572 63 - - - 2,018 Oct.11 2,239 - 2,474 79 - 44 - 1,660 Nov.12 2,409 - 2,616 84 - 314 - 1,055 Dec.
(単位:kl) (Unit:kl)
生産数量 受入数量 販売部門 その他 Others 品種振替 在庫数量(末)
年 月ProductionQuantity
ReceiptQuantity
Consumption(fuel for use in
refinery)
To salesdepartment
転送Transfer out
その他(自家使用)
Others(own use)
Conversion toanotherproduct
InventoryQuantity
平成 26 年 15,277,964 333,931 - 15,304,126 205,231 - 4,431 629,975 C.Y. 201427 15,946,408 601,570 64 16,290,231 251,774 - 90,383 r647,151 201528 15,864,487 648,605 41 16,269,427 429,640 - 102,023 r526,018 201629 15,144,484 517,386 - 15,334,091 245,208 - ▲ 3,022 r575,366 201730 14,825,453 588,906 - 15,019,416 309,497 - ▲ 68,588 595,433 2018
平成 28 年度 15,905,222 806,861 41 16,373,204 408,623 - 83,478 r510,190 F.Y. 201629 14,678,610 462,146 - 14,865,069 219,659 - ▲ 22,349 521,816 2017
30 年 1~ 3月 2,856,287 241,632 - 3,065,063 66,292 - ▲ 20,807 521,816 Q1 2018 4~ 6 4,146,039 82,243 - 4,120,504 50,007 - ▲ 1,678 578,960 Q2 7~ 9 4,499,402 70,718 - 4,453,227 56,092 - ▲ 20,626 620,137 Q310~12 3,323,725 194,313 - 3,380,622 137,106 - ▲ 25,477 595,433 Q4
30 年 1月 846,099 33,825 - 985,959 25,001 - - 444,382 Jan. 2018 2 847,431 120,055 - 1,013,105 31,661 - ▲ 19,573 347,822 Feb. 3 1,162,757 87,752 - 1,065,999 9,630 - ▲ 1,234 521,816 Mar. 4 1,370,434 11,502 - 1,237,256 - - ▲ 411 666,504 Apr. 5 1,403,267 17,501 - 1,500,492 15,000 - ▲ 469 571,502 May 6 1,372,338 53,240 - 1,382,756 35,007 - ▲ 798 578,960 Jun.
7 1,532,878 21,455 - 1,520,747 17,520 - 6,868 602,128 Jul. 8 1,596,933 17,242 - 1,524,805 9,651 - - 682,310 Aug. 9 1,369,591 32,021 - 1,407,675 28,921 - ▲ 27,494 620,137 Sep.10 1,018,706 33,174 - 1,165,331 30,771 - ▲ 202 475,898 Oct.11 1,198,118 103,445 - 1,065,941 51,492 - ▲ 25,275 635,061 Nov.12 1,106,901 57,694 - 1,149,350 54,843 - - 595,433 Dec.
その他用ナフサ (5)Naphtha use for others
消費数量(精製用燃料)
出 荷 Shipments
Year, Quarter and Month
ジェット燃料油 (6)Jet fuel
消費数量(精製用燃料)
出 荷 Shipments
Year, Quarter and Month
資源/生産・出荷・在庫統計 11
1.生産・出荷・在庫統計 / Production, Shipment and Inventory
(2) 時系列表 / Historical Data by Commodities 2) 石油製品 / Petroleum products ① 製品(続き) / Product (continued)
(単位:kl) (Unit:kl)
生産数量 受入数量 販売部門 その他 Others 品種振替 在庫数量(末)
年 月ProductionQuantity
ReceiptQuantity
Consumption(fuel for use in
refinery)
To Salesdepartment
転送Transfer out
その他(自家使用)
Others(own use)
Conversion toanotherproduct
InventoryQuantity
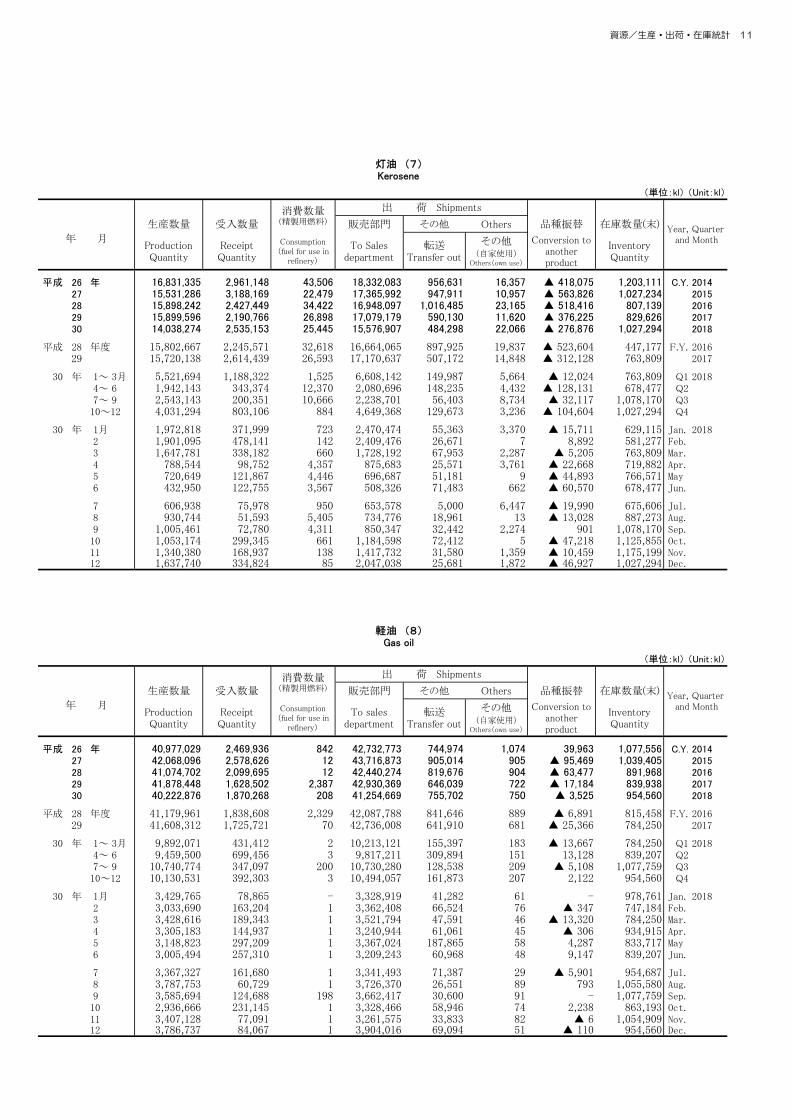
平成 26 年 16,831,335 2,961,148 43,506 18,332,083 956,631 16,357 ▲ 418,075 1,203,111 C.Y. 201427 15,531,286 3,188,169 22,479 17,365,992 947,911 10,957 ▲ 563,826 1,027,234 201528 15,898,242 2,427,449 34,422 16,948,097 1,016,485 23,165 ▲ 518,416 807,139 201629 15,899,596 2,190,766 26,898 17,079,179 590,130 11,620 ▲ 376,225 829,626 201730 14,038,274 2,535,153 25,445 15,576,907 484,298 22,066 ▲ 276,876 1,027,294 2018
平成 28 年度 15,802,667 2,245,571 32,618 16,664,065 897,925 19,837 ▲ 523,604 447,177 F.Y. 201629 15,720,138 2,614,439 26,593 17,170,637 507,172 14,848 ▲ 312,128 763,809 2017
30 年 1~ 3月 5,521,694 1,188,322 1,525 6,608,142 149,987 5,664 ▲ 12,024 763,809 Q1 2018 4~ 6 1,942,143 343,374 12,370 2,080,696 148,235 4,432 ▲ 128,131 678,477 Q2 7~ 9 2,543,143 200,351 10,666 2,238,701 56,403 8,734 ▲ 32,117 1,078,170 Q310~12 4,031,294 803,106 884 4,649,368 129,673 3,236 ▲ 104,604 1,027,294 Q4
30 年 1月 1,972,818 371,999 723 2,470,474 55,363 3,370 ▲ 15,711 629,115 Jan. 2018 2 1,901,095 478,141 142 2,409,476 26,671 7 8,892 581,277 Feb. 3 1,647,781 338,182 660 1,728,192 67,953 2,287 ▲ 5,205 763,809 Mar. 4 788,544 98,752 4,357 875,683 25,571 3,761 ▲ 22,668 719,882 Apr. 5 720,649 121,867 4,446 696,687 51,181 9 ▲ 44,893 766,571 May 6 432,950 122,755 3,567 508,326 71,483 662 ▲ 60,570 678,477 Jun.
7 606,938 75,978 950 653,578 5,000 6,447 ▲ 19,990 675,606 Jul. 8 930,744 51,593 5,405 734,776 18,961 13 ▲ 13,028 887,273 Aug. 9 1,005,461 72,780 4,311 850,347 32,442 2,274 901 1,078,170 Sep.10 1,053,174 299,345 661 1,184,598 72,412 5 ▲ 47,218 1,125,855 Oct.11 1,340,380 168,937 138 1,417,732 31,580 1,359 ▲ 10,459 1,175,199 Nov.12 1,637,740 334,824 85 2,047,038 25,681 1,872 ▲ 46,927 1,027,294 Dec.
(単位:kl) (Unit:kl)
生産数量 受入数量 販売部門 その他 Others 品種振替 在庫数量(末)
年 月ProductionQuantity
ReceiptQuantity
Consumption(fuel for use in
refinery)
To salesdepartment
転送Transfer out
その他(自家使用)
Others(own use)
Conversion toanotherproduct
InventoryQuantity
平成 26 年 40,977,029 2,469,936 842 42,732,773 744,974 1,074 39,963 1,077,556 C.Y. 201427 42,068,096 2,578,626 12 43,716,873 905,014 905 ▲ 95,469 1,039,405 201528 41,074,702 2,099,695 12 42,440,274 819,676 904 ▲ 63,477 891,968 201629 41,878,448 1,628,502 2,387 42,930,369 646,039 722 ▲ 17,184 839,938 201730 40,222,876 1,870,268 208 41,254,669 755,702 750 ▲ 3,525 954,560 2018
平成 28 年度 41,179,961 1,838,608 2,329 42,087,788 841,646 889 ▲ 6,891 815,458 F.Y. 201629 41,608,312 1,725,721 70 42,736,008 641,910 681 ▲ 25,366 784,250 2017
30 年 1~ 3月 9,892,071 431,412 2 10,213,121 155,397 183 ▲ 13,667 784,250 Q1 2018 4~ 6 9,459,500 699,456 3 9,817,211 309,894 151 13,128 839,207 Q2 7~ 9 10,740,774 347,097 200 10,730,280 128,538 209 ▲ 5,108 1,077,759 Q310~12 10,130,531 392,303 3 10,494,057 161,873 207 2,122 954,560 Q4
30 年 1月 3,429,765 78,865 - 3,328,919 41,282 61 - 978,761 Jan. 2018 2 3,033,690 163,204 1 3,362,408 66,524 76 ▲ 347 747,184 Feb. 3 3,428,616 189,343 1 3,521,794 47,591 46 ▲ 13,320 784,250 Mar. 4 3,305,183 144,937 1 3,240,944 61,061 45 ▲ 306 934,915 Apr. 5 3,148,823 297,209 1 3,367,024 187,865 58 4,287 833,717 May 6 3,005,494 257,310 1 3,209,243 60,968 48 9,147 839,207 Jun.
7 3,367,327 161,680 1 3,341,493 71,387 29 ▲ 5,901 954,687 Jul. 8 3,787,753 60,729 1 3,726,370 26,551 89 793 1,055,580 Aug. 9 3,585,694 124,688 198 3,662,417 30,600 91 - 1,077,759 Sep.10 2,936,666 231,145 1 3,328,466 58,946 74 2,238 863,193 Oct.11 3,407,128 77,091 1 3,261,575 33,833 82 ▲ 6 1,054,909 Nov.12 3,786,737 84,067 1 3,904,016 69,094 51 ▲ 110 954,560 Dec.
灯油 (7)Kerosene
消費数量(精製用燃料)
出 荷 Shipments
Year, Quarter and Month
軽油 (8)Gas oil
消費数量(精製用燃料)
出 荷 Shipments
Year, Quarter and Month

12 資源/生産・出荷・在庫統計
1.生産・出荷・在庫統計 / Production, Shipment and Inventory
(2) 時系列表 / Historical Data by Commodities 2) 石油製品 / Petroleum products ① 製品(続き) / Product (continued)
(単位:kl) (Unit:kl)
生産数量 受入数量 販売部門 その他 Others 品種振替 在庫数量(末)
年 月ProductionQuantity
ReceiptQuantity
Consumption(fuel for use in
refinery)
To salesdepartment
転送Transfer out
その他(自家使用)
Others(own use)
Conversion toanotherproduct
InventoryQuantity
平成 26 年 34,704,100 4,500,563 1,534,044 36,842,504 463,668 259,708 ▲ 37,180 1,628,958 C.Y. 201427 31,747,839 4,589,827 1,458,528 34,073,296 684,452 152,027 14,072 1,605,310 201528 33,283,822 3,190,338 1,443,752 34,174,528 914,148 158,281 15,775 1,315,130 201629 29,682,301 3,391,420 1,501,087 30,653,986 605,386 119,857 ▲ 201,047 1,307,900 201730 29,371,199 3,747,269 1,504,805 30,671,785 530,827 121,432 ▲ 195,467 1,400,256 2018
平成 28 年度 32,622,580 3,289,235 1,428,256 33,308,384 1,000,129 150,204 ▲ 63,249 1,261,649 F.Y. 201629 29,544,495 3,467,083 1,539,045 30,721,938 502,445 130,708 ▲ 229,259 1,147,520 2017
30 年 1~ 3月 8,535,594 920,771 442,156 8,956,513 128,523 35,202 ▲ 51,074 1,147,520 Q1 2018 4~ 6 6,693,633 978,075 323,151 7,010,778 160,177 28,652 ▲ 72,715 1,223,008 Q2 7~ 9 6,404,373 1,091,268 299,296 6,998,578 99,537 27,630 ▲ 59,841 1,236,046 Q310~12 7,737,599 757,155 440,202 7,705,916 142,590 29,948 ▲ 11,837 1,400,256 Q4
30 年 1月 2,826,951 285,069 154,862 2,924,566 29,844 18,267 ▲ 12,100 1,278,989 Jan. 2018 2 2,680,967 282,334 142,912 2,892,700 51,085 10,213 ▲ 9,438 1,135,093 Feb. 3 3,027,676 353,368 144,382 3,139,247 47,594 6,722 ▲ 29,536 1,147,520 Mar. 4 2,421,249 355,019 114,524 2,524,882 39,722 8,690 ▲ 23,757 1,211,767 Apr. 5 2,217,974 360,395 96,165 2,282,991 59,173 9,031 ▲ 22,703 1,319,670 May 6 2,054,410 262,661 112,462 2,202,905 61,282 10,931 ▲ 26,255 1,223,008 Jun.
7 2,194,037 335,147 98,506 2,415,640 22,351 10,650 ▲ 15,367 1,190,412 Jul. 8 2,098,531 476,676 94,683 2,312,747 39,733 10,279 ▲ 23,732 1,285,283 Aug. 9 2,111,805 279,445 106,107 2,270,191 37,453 6,701 ▲ 20,742 1,236,046 Sep.10 2,522,127 244,791 144,836 2,548,509 47,813 5,968 ▲ 6,131 1,249,970 Oct.11 2,599,002 279,237 141,572 2,649,324 68,697 8,625 ▲ 5,815 1,253,792 Nov.12 2,616,470 233,127 153,794 2,508,083 26,080 15,355 109 1,400,256 Dec.
(単位:kl) (Unit:kl)
生産数量 受入数量 販売部門 その他 Others 品種振替 在庫数量(末)
年 月ProductionQuantity
ReceiptQuantity
Consumption(fuel for use in
refinery)
To salesdepartment
転送Transfer out
その他(自家使用)
Others(own use)
Conversion toanotherproduct
InventoryQuantity
平成 26 年 13,579,769 532,353 39,695 13,714,991 266,208 86,627 10,410 375,750 C.Y. 201427 12,887,985 515,524 42,696 13,147,984 281,997 31,259 98,937 371,491 201528 12,826,699 369,009 24,929 12,967,270 288,375 3,241 68,726 320,497 201629 12,607,827 304,428 36,630 12,701,039 171,522 7,008 388 317,445 201730 12,301,824 424,983 17,752 12,468,839 157,222 7,806 ▲ 3,390 388,148 2018
平成 28 年度 12,891,612 337,364 23,676 12,845,895 320,774 2,957 8,909 332,900 F.Y. 201629 12,507,154 317,360 34,861 12,721,600 112,065 8,493 570 281,439 2017
30 年 1~ 3月 3,833,831 94,155 3,732 3,926,720 31,475 2,044 465 281,439 Q1 2018 4~ 6 2,649,848 127,534 5,583 2,673,465 60,934 2,274 378 317,312 Q2 7~ 9 2,595,544 77,200 3,031 2,641,729 24,151 1,699 ▲ 1,190 318,714 Q310~12 3,222,601 126,094 5,406 3,226,925 40,662 1,789 ▲ 3,043 388,148 Q4
30 年 1月 1,343,615 32,954 1,451 1,358,532 11,212 1,324 39 321,318 Jan. 2018 2 1,281,696 23,556 1,007 1,349,907 13,722 241 397 261,954 Feb. 3 1,208,520 37,645 1,274 1,218,281 6,541 479 29 281,439 Mar. 4 980,516 27,489 1,767 968,107 4,800 459 24 314,439 Apr. 5 843,209 49,259 2,722 888,228 25,932 269 354 290,217 May 6 826,123 50,786 1,094 817,130 30,202 1,546 - 317,312 Jun.
7 862,398 25,187 992 891,019 8,370 1,215 6,000 309,819 Jul. 8 899,309 19,726 799 872,032 7,131 248 397 349,029 Aug. 9 833,837 32,287 1,240 878,678 8,650 236 ▲ 7,587 318,714 Sep.10 945,078 47,649 1,297 952,303 14,701 254 ▲ 3,238 339,332 Oct.11 1,094,525 41,019 3,217 1,099,968 16,771 438 86 353,935 Nov.12 1,182,998 37,426 892 1,174,654 9,190 1,097 109 388,148 Dec.
重油 (9)~(10)Fuel oil total
消費数量(精製用燃料)
出 荷 Shipments
Year, Quarter and Month
A重油 (9)Fuel oil A
消費数量(精製用燃料)
出 荷 Shipments
Year, Quarter and Month

資源/生産・出荷・在庫統計 13
1.生産・出荷・在庫統計 / Production, Shipment and Inventory
(2) 時系列表 / Historical Data by Commodities 2) 石油製品 / Petroleum products ① 製品(続き) / Products (continued)
(単位:kl) (Unit:kl)
生産数量 受入数量 販売部門 その他 Others 品種振替 在庫数量(末)
年 月ProductionQuantity
ReceiptQuantity
Consumption(fuel for use in
refinery)
To salesdepartment
転送Transfer out
その他(自家使用)
Others(own use)
Conversion toanotherproduct
InventoryQuantity
平成 26 年 21,124,331 3,968,210 1,494,349 23,127,513 197,460 173,081 ▲ 47,590 1,253,208 C.Y. 201427 18,859,854 4,074,303 1,415,832 20,925,312 402,455 120,768 ▲ 84,865 1,233,819 201528 20,457,123 2,821,329 1,418,823 21,207,258 625,773 155,040 ▲ 52,951 994,633 201629 17,074,474 3,086,992 1,464,457 17,952,947 433,864 112,849 ▲ 201,435 990,455 201730 17,069,375 3,322,286 1,487,053 18,202,946 373,605 113,626 ▲ 192,077 1,012,108 2018
平成 28 年度 19,730,968 2,951,871 1,404,580 20,462,489 679,355 147,247 ▲ 72,158 928,749 F.Y. 201629 17,037,341 3,149,723 1,504,184 18,000,338 390,380 122,215 ▲ 229,829 866,081 2017
30 年 1~ 3月 4,701,763 826,616 438,424 5,029,793 97,048 33,158 ▲ 51,539 866,081 Q1 2018 4~ 6 4,043,785 850,541 317,568 4,337,313 99,243 26,378 ▲ 73,093 905,696 Q2 7~ 9 3,808,829 1,014,068 296,265 4,356,849 75,386 25,931 ▲ 58,651 917,332 Q310~12 4,514,998 631,061 434,796 4,478,991 101,928 28,159 ▲ 8,794 1,012,108 Q4
30 年 1月 1,483,336 252,115 153,411 1,566,034 18,632 16,943 ▲ 12,139 957,671 Jan. 2018 2 1,399,271 258,778 141,905 1,542,793 37,363 9,972 ▲ 9,835 873,139 Feb. 3 1,819,156 315,723 143,108 1,920,966 41,053 6,243 ▲ 29,565 866,081 Mar. 4 1,440,733 327,530 112,757 1,556,775 34,922 8,231 ▲ 23,781 897,328 Apr. 5 1,374,765 311,136 93,443 1,394,763 33,241 8,762 ▲ 23,057 1,029,453 May 6 1,228,287 211,875 111,368 1,385,775 31,080 9,385 ▲ 26,255 905,696 Jun.
7 1,331,639 309,960 97,514 1,524,621 13,981 9,435 ▲ 21,367 880,593 Jul. 8 1,199,222 456,950 93,884 1,440,715 32,602 10,031 ▲ 24,129 936,254 Aug. 9 1,277,968 247,158 104,867 1,391,513 28,803 6,465 ▲ 13,155 917,332 Sep.10 1,577,049 197,142 143,539 1,596,206 33,112 5,714 ▲ 2,893 910,638 Oct.11 1,504,477 238,218 138,355 1,549,356 51,926 8,187 ▲ 5,901 899,857 Nov.12 1,433,472 195,701 152,902 1,333,429 16,890 14,258 - 1,012,108 Dec.
(単位:kl) (Unit:kl)
生産数量 受入数量 販売部門 その他 Others 品種振替 在庫数量(末)
年 月ProductionQuantity
ReceiptQuantity
Consumption(fuel for use in
refinery)
To salesdepartment
転送Transfer out
その他(自家使用)
Others(own use)
Conversion toanotherproduct
InventoryQuantity
平成 26 年 2,445,327 241,598 4,303 2,624,628 17,372 12,494 ▲ 101 227,673 C.Y. 201427 2,362,669 248,427 - 2,581,396 18,500 9,459 ▲ 94 226,065 201528 2,497,103 222,657 - 2,689,933 12,904 10,550 ▲ 5,271 224,533 201629 2,215,066 231,950 5,062 2,472,077 14,142 12,162 ▲ 7,575 158,777 201730 2,455,926 217,754 - 2,617,326 15,346 17,578 ▲ 1,314 180,625 2018
平成 28 年度 2,470,284 227,212 2,336 2,662,348 13,299 10,957 ▲ 10,762 217,520 F.Y. 201629 2,197,797 230,119 2,726 2,444,573 13,868 13,025 ▲ 2,219 167,024 2017
30 年 1~ 3月 586,477 57,434 - 628,727 3,230 3,517 ▲ 159 167,024 Q1 2018 4~ 6 650,261 51,796 - 695,932 4,502 4,763 ▲ 17 163,790 Q2 7~ 9 643,147 48,485 - 667,795 2,890 4,761 ▲ 1,111 178,819 Q310~12 576,041 60,039 - 624,872 4,724 4,537 ▲ 27 180,625 Q4
30 年 1月 181,473 20,337 - 199,052 718 1,180 ▲ 157 159,513 Jan. 2018 2 199,145 18,467 - 212,375 1,423 1,137 ▲ 1 162,157 Feb. 3 205,859 18,630 - 217,300 1,089 1,200 ▲ 1 167,024 Mar. 4 229,854 17,795 - 237,377 1,500 2,472 ▲ 3 173,285 Apr. 5 215,145 16,754 - 222,030 1,363 1,147 ▲ 8 180,621 May 6 205,262 17,247 - 236,525 1,639 1,144 ▲ 6 163,790 Jun.
7 213,118 12,754 - 213,788 1,127 1,484 ▲ 5 173,214 Jul. 8 215,193 23,309 - 227,306 1,152 1,527 ▲ 1,106 180,583 Aug. 9 214,836 12,422 - 226,701 611 1,750 - 178,819 Sep.10 187,512 22,930 - 214,552 1,456 1,884 ▲ 14 171,318 Oct.11 202,401 17,747 - 196,411 2,017 1,862 ▲ 10 191,131 Nov.12 186,128 19,362 - 213,909 1,251 791 ▲ 3 180,625 Dec.
B・C重油 (10)Fuel oil B・C
消費数量(精製用燃料)
出 荷 Shipments
Year, Quarter and Month
潤滑油 (11)Lubricating oil
消費数量(精製用燃料)
出 荷 Shipments
Year, Quarter and Month

14 資源/生産・出荷・在庫統計
1.生産・出荷・在庫統計 / Production, Shipment and Inventory
(2) 時系列表 / Historical Data by Commodities 2) 石油製品 / Petroleum products ① 製品(続き) / Product (continued)
(単位: t ) (Unit: t )
生産数量 受入数量 販売部門 その他 Others 品種振替 在庫数量(末)
年 月ProductionQuantity
ReceiptQuantity
Consumption(fuel for use in
refinery)
To salesdepartment
転送Transfer out
その他(自家使用)
Others(own use)
Conversion toanotherproduct
InventoryQuantity
平成 26 年 60,772 10,119 - 72,317 - - ▲ 1,000 5,332 C.Y. 201427 65,855 11,690 - 76,733 - - - 6,329 201528 58,254 15,498 - 75,031 - - ▲ 1,376 4,010 201629 64,205 14,572 - 77,656 - - ▲ 278 4,428 201730 68,951 10,594 - 81,585 - - - 2,686 2018
平成 28 年度 58,498 18,837 - 78,471 - - ▲ 278 2,673 F.Y. 201629 63,755 13,305 - 75,609 - - - 3,962 2017
30 年 1~ 3月 15,938 3,512 - 20,025 - - - 3,962 Q1 2018 4~ 6 17,138 - - 17,501 - - - 3,669 Q2 7~ 9 16,166 4,028 - 19,064 - - - 4,904 Q310~12 19,709 3,054 - 24,995 - - - 2,686 Q4
30 年 1月 6,150 2,069 - 8,609 - - - 4,072 Jan. 2018 2 5,048 - - 5,517 - - - 3,640 Feb. 3 4,740 1,443 - 5,899 - - - 3,962 Mar. 4 6,668 - - 5,706 - - - 4,965 Apr. 5 2,694 - - 2,629 - - - 5,053 May 6 7,776 - - 9,166 - - - 3,669 Jun.
7 4,173 1,564 - 4,978 - - - 4,470 Jul. 8 3,354 2,464 - 5,448 - - - 4,880 Aug. 9 8,639 - - 8,638 - - - 4,904 Sep.10 6,156 1,650 - 10,611 - - - 2,092 Oct.11 4,463 1,404 - 6,053 - - - 1,897 Nov.12 9,090 - - 8,331 - - - 2,686 Dec.
(単位: t ) (Unit: t )
生産数量 受入数量 販売部門 その他 Others 品種振替 在庫数量(末)
年 月ProductionQuantity
ReceiptQuantity
Consumption(fuel for use in
refinery)
To salesdepartment
転送Transfer out
その他(自家使用)
Others(own use)
Conversion toanotherproduct
InventoryQuantity
平成 26 年 3,428,094 168,718 45,351 2,123,809 81,004 1,341,380 ▲ 3,287 155,919 C.Y. 201427 3,267,793 134,709 46,947 2,096,096 84,347 1,158,525 ▲ 1,724 174,888 201528 3,205,341 147,341 38,617 2,146,217 91,874 1,087,232 ▲ 11,949 153,821 201629 3,172,921 148,524 - 2,139,051 90,520 1,101,254 ▲ 997 152,660 201730 2,799,694 118,711 - 1,995,531 87,503 823,044 - 170,587 2018
平成 28 年度 3,249,069 149,328 29,161 2,160,678 110,040 1,118,980 ▲ 6,427 137,207 F.Y. 201629 3,051,119 150,691 - 2,061,881 75,807 1,034,452 ▲ 252 174,463 2017
30 年 1~ 3月 777,656 51,376 - 528,546 17,540 262,164 - 174,463 Q1 2018 4~ 6 622,703 19,111 - 452,315 20,922 193,302 - 151,314 Q2 7~ 9 689,137 15,221 - 487,190 25,730 181,176 - 162,241 Q310~12 710,198 33,003 - 527,480 23,311 186,402 - 170,587 Q4
30 年 1月 276,081 18,068 - 153,899 4,122 122,536 - 166,603 Jan. 2018 2 240,442 14,057 - 174,816 8,284 88,062 - 150,470 Feb. 3 261,133 19,251 - 199,831 5,134 51,566 - 174,463 Mar. 4 196,356 5,004 - 151,939 8,465 41,077 - 174,857 Apr. 5 232,512 8,103 - 164,584 12,457 78,674 - 160,164 May 6 193,835 6,004 - 135,792 - 73,551 - 151,314 Jun.
7 240,466 3,101 - 145,372 20,606 70,470 - 158,978 Jul. 8 224,613 6,165 - 161,374 5,124 78,941 - 143,751 Aug. 9 224,058 5,955 - 180,444 - 31,765 - 162,241 Sep.10 204,058 9,018 - 197,968 - 23,629 - 154,527 Oct.11 182,326 10,003 - 175,446 3,968 42,326 - 125,541 Nov.12 323,814 13,982 - 154,066 19,343 120,447 - 170,587 Dec.
パラフィン (12)Paraffin wax
消費数量(精製用燃料)
出 荷 Shipments
Year, Quarter and Month
アスファルト (13)Asphalt
消費数量(精製用燃料)
出 荷 Shipments
Year, Quarter and Month

資源/生産・出荷・在庫統計 15
1.生産・出荷・在庫統計 / Production, Shipment and Inventory
(2) 時系列表 / Historical Data by Commodities 2) 石油製品 / Petroleum products ① 製品(続き) / Product (continued)
(単位: t ) (Unit: t )
生産数量 受入数量 販売部門 その他 Others 品種振替 在庫数量(末)
年 月ProductionQuantity
ReceiptQuantity
Consumption(fuel for use in
refinery)
To salesdepartment
転送Transfer out
その他(自家使用)
Others(own use)
Conversion toanotherproduct
InventoryQuantity
平成 26 年 4,369,790 3,143,030 226,981 6,479,124 425,610 - ▲ 373,208 201,648 C.Y. 201427 4,374,652 2,721,977 278,287 6,190,361 290,290 6,469 ▲ 329,862 190,504 201528 4,202,628 2,174,934 225,452 5,373,700 309,859 - ▲ 446,476 198,378 201629 4,521,167 1,931,642 204,293 5,593,091 266,972 - ▲ 370,111 199,706 201730 4,049,894 2,155,594 186,590 5,267,854 249,984 - ▲ 468,760 219,058 2018
平成 28 年度 4,268,059 2,066,592 230,095 5,359,667 303,050 - ▲ 443,676 200,165 F.Y. 201629 4,480,614 1,973,080 187,747 5,598,866 259,083 - ▲ 388,186 205,792 2017
30 年 1~ 3月 1,068,906 600,497 50,021 1,425,100 63,053 - ▲ 123,081 205,792 Q1 2018 4~ 6 1,020,564 452,049 51,752 1,280,649 57,668 - ▲ 99,003 188,031 Q2 7~ 9 1,074,761 472,912 36,482 1,301,052 68,316 - ▲ 88,824 235,512 Q310~12 885,663 630,136 48,335 1,261,053 60,947 - ▲ 157,852 219,058 Q4
30 年 1月 390,490 179,324 17,444 488,807 22,649 - ▲ 43,353 197,302 Jan. 2018 2 315,302 221,654 15,413 457,183 20,758 - ▲ 38,899 200,493 Feb. 3 363,114 199,519 17,164 479,110 19,646 - ▲ 40,829 205,792 Mar. 4 380,181 180,126 16,775 477,153 17,648 - ▲ 32,446 220,904 Apr. 5 354,320 134,476 16,581 445,026 15,727 - ▲ 32,594 199,706 May 6 286,063 137,447 18,396 358,470 24,293 - ▲ 33,963 188,031 Jun.
7 350,420 175,535 15,172 442,789 23,685 - ▲ 27,144 204,848 Jul. 8 372,030 156,359 13,432 432,098 22,036 - ▲ 30,931 233,311 Aug. 9 352,311 141,018 7,878 426,165 22,595 - ▲ 30,749 235,512 Sep.10 245,158 184,248 13,367 374,662 19,758 - ▲ 56,534 201,699 Oct.11 319,634 189,759 15,248 422,652 17,958 - ▲ 41,773 209,312 Nov.12 320,871 256,129 19,720 463,739 23,231 - ▲ 59,545 219,058 Dec.
(単位: t ) (Unit: t )
生産数量 受入数量 販売部門 その他 Others 品種振替 在庫数量(末)
年 月ProductionQuantity
ReceiptQuantity
Consumption(fuel for use in
refinery)
To salesdepartment
転送Transfer out
その他(自家使用)
Others(own use)
Conversion toanotherproduct
InventoryQuantity
平成 26 年 2,254,296 1,601,222 51,915 3,665,977 123,670 - ▲ 7,152 79,776 C.Y. 201427 2,323,714 1,262,981 41,605 3,467,654 64,853 6,469 ▲ 7,495 71,546 201528 2,228,195 972,341 22,196 3,083,584 68,910 - ▲ 11,157 78,110 201629 2,303,782 931,003 16,685 3,150,727 58,438 - ▲ 8,242 70,076 201730 2,152,053 1,011,236 16,249 3,066,287 51,478 - ▲ 15,528 78,490 2018
平成 28 年度 2,222,752 932,219 19,822 3,054,727 68,323 - ▲ 6,270 77,852 F.Y. 201629 2,302,144 955,117 16,734 3,172,367 54,712 - ▲ 11,710 73,308 2017
30 年 1~ 3月 587,471 312,479 3,928 875,909 12,451 - ▲ 4,074 73,308 Q1 2018 4~ 6 521,652 227,601 3,006 733,810 8,754 - ▲ 8,621 66,620 Q2 7~ 9 517,433 203,769 5,919 682,001 14,442 - ▲ 633 82,555 Q310~12 525,497 267,387 3,396 774,567 15,831 - ▲ 2,200 78,490 Q4
30 年 1月 207,721 99,743 1,473 299,908 5,826 - ▲ 91 70,364 Jan. 2018 2 182,014 111,177 1,435 285,717 3,722 - ▲ 72 71,920 Feb. 3 197,736 101,559 1,020 290,284 2,903 - ▲ 3,911 73,308 Mar. 4 199,781 81,962 1,354 270,899 1,357 - ▲ 4,726 76,568 Apr. 5 179,617 74,201 384 256,611 2,591 - ▲ 2,627 68,015 May 6 142,254 71,438 1,268 206,300 4,806 - ▲ 1,268 66,620 Jun.
7 170,198 73,142 2,353 228,676 4,722 - ▲ 440 74,355 Jul. 8 180,799 63,294 2,074 234,055 4,903 - ▲ 95 76,954 Aug. 9 166,436 67,333 1,492 219,270 4,817 - ▲ 98 82,555 Sep.10 145,415 74,637 1,915 215,527 4,472 - ▲ 1,330 81,464 Oct.11 186,032 82,459 988 260,354 5,703 - ▲ 531 79,593 Nov.12 194,050 110,291 493 298,686 5,656 - ▲ 339 78,490 Dec.
液化石油ガス (14)~(15)Liquefied petroleum gas total
消費数量(精製用燃料)
出 荷 Shipments
Year, Quarter and Month
P.P、P.B (14)Propane・Propylene and Propane・Butane
消費数量(精製用燃料)
出 荷 Shipments
Year, Quarter and Month

16 資源/生産・出荷・在庫統計
1.生産・出荷・在庫統計 / Production, Shipment and Inventory
(2) 時系列表 / Historical Data by Commodities 2) 石油製品 / Petroleum products ① 製品(続き) / Product (continued)
(単位: t ) (Unit: t )
生産数量 受入数量 販売部門 その他 Others 品種振替 在庫数量(末)
年 月ProductionQuantity
ReceiptQuantity
Consumption(fuel for use in
refinery)
To salesdepartment
転送Transfer out
その他(自家使用)
Others(own use)
Conversion toanotherproduct
InventoryQuantity
平成 26 年 2,115,494 1,541,808 175,066 2,813,147 301,940 - ▲ 366,056 121,872 C.Y. 201427 2,050,938 1,458,996 236,682 2,722,707 225,437 - ▲ 322,367 118,958 201528 1,974,433 1,202,593 203,256 2,290,116 240,949 - ▲ 435,319 120,268 201629 2,217,385 1,000,639 187,608 2,442,364 208,534 - ▲ 361,869 129,630 201730 1,897,841 1,144,358 170,341 2,201,567 198,506 - ▲ 453,232 140,568 2018
平成 28 年度 2,045,307 1,134,373 210,273 2,304,940 234,727 - ▲ 437,406 122,313 F.Y. 201629 2,178,470 1,017,963 171,013 2,426,499 204,371 - ▲ 376,476 132,484 2017
30 年 1~ 3月 481,435 288,018 46,093 549,191 50,602 - ▲ 119,007 132,484 Q1 2018 4~ 6 498,912 224,448 48,746 546,839 48,914 - ▲ 90,382 121,411 Q2 7~ 9 557,328 269,143 30,563 619,051 53,874 - ▲ 88,191 152,957 Q310~12 360,166 362,749 44,939 486,486 45,116 - ▲ 155,652 140,568 Q4
30 年 1月 182,769 79,581 15,971 188,899 16,823 - ▲ 43,262 126,938 Jan. 2018 2 133,288 110,477 13,978 171,466 17,036 - ▲ 38,827 128,573 Feb. 3 165,378 97,960 16,144 188,826 16,743 - ▲ 36,918 132,484 Mar. 4 180,400 98,164 15,421 206,254 16,291 - ▲ 27,720 144,336 Apr. 5 174,703 60,275 16,197 188,415 13,136 - ▲ 29,967 131,691 May 6 143,809 66,009 17,128 152,170 19,487 - ▲ 32,695 121,411 Jun.
7 180,222 102,393 12,819 214,113 18,963 - ▲ 26,704 130,493 Jul. 8 191,231 93,065 11,358 198,043 17,133 - ▲ 30,836 156,357 Aug. 9 185,875 73,685 6,386 206,895 17,778 - ▲ 30,651 152,957 Sep.10 99,743 109,611 11,452 159,135 15,286 - ▲ 55,204 120,235 Oct.11 133,602 107,300 14,260 162,298 12,255 - ▲ 41,242 129,719 Nov.12 126,821 145,838 19,227 165,053 17,575 - ▲ 59,206 140,568 Dec.
(単位: t ) (Unit: t )
生産数量 受入数量 販売部門 その他 Others 品種振替 在庫数量(末)
年 月ProductionQuantity
ReceiptQuantity
Consumption(fuel for use in
refinery)
To salesdepartment
転送Transfer out
その他(自家使用)
Others(own use)
Conversion toanotherproduct
InventoryQuantity
平成 26 年 1,099,571 - 143,662 762,862 - 191,321 ▲ 1,506 14,239 C.Y. 201427 1,213,358 - 168,236 858,380 - 182,800 ▲ 213 17,968 201528 1,229,040 - 193,053 861,462 - 177,872 - 14,621 201629 1,319,355 99,983 166,809 959,053 - 297,591 - 10,506 201730 1,297,291 233,642 308,219 777,624 - 442,166 - 13,430 2018
平成 28 年度 1,266,548 - 181,912 883,033 - 200,552 - 13,833 F.Y. 201629 1,319,684 158,630 160,175 969,486 - 349,290 - 13,196 2017
30 年 1~ 3月 333,627 58,647 38,802 257,002 - 93,780 - 13,196 Q1 2018 4~ 6 392,706 76,981 100,255 220,673 - 143,225 - 18,730 Q2 7~ 9 348,895 70,928 135,692 155,455 - 129,478 - 17,928 Q310~12 222,063 27,086 33,470 144,494 - 75,683 - 13,430 Q4
30 年 1月 123,324 27,646 20,682 81,151 - 48,805 - 10,838 Jan. 2018 2 92,794 - 17,384 75,504 - - - 10,744 Feb. 3 117,509 31,001 736 100,347 - 44,975 - 13,196 Mar. 4 132,478 41,740 24,775 84,649 - 64,765 - 13,225 Apr. 5 141,748 - 39,057 81,488 - 19,877 - 14,551 May 6 118,480 35,241 36,423 54,536 - 58,583 - 18,730 Jun.
7 134,366 43,171 56,008 60,928 - 64,547 - 14,784 Jul. 8 126,729 27,757 47,928 56,625 - 49,915 - 14,802 Aug. 9 87,800 - 31,756 37,902 - 15,016 - 17,928 Sep.10 48,347 - 9,976 23,688 - 18,766 - 13,845 Oct.11 72,717 - 3,724 52,173 - 18,915 - 11,750 Nov.12 100,999 27,086 19,770 68,633 - 38,002 - 13,430 Dec.
B・B (15)Butane・Butylene
消費数量(精製用燃料)
出 荷 Shipments
Year, Quarter and Month
オイルコークス (16)Petroleum coke
消費数量(精製用燃料)
出 荷 Shipments
Year, Quarter and Month

資源/生産・出荷・在庫統計 17
1.生産・出荷・在庫統計 / Production, Shipment and Inventory
(2) 時系列表 / Historical Data by Commodities 2) 石油製品 / Petroleum products ① 製品(続き) / Product (continued)
(単位: t ) (Unit: t )
生産数量 受入数量 販売部門 その他 Others 品種振替 在庫数量(末)
年 月ProductionQuantity
ReceiptQuantity
Consumption(fuel for use in
refinery)
To salesdepartment
転送Transfer out
その他(自家使用)
Others(own use)
Conversion toanotherproduct
InventoryQuantity
平成 26 年 1,750,938 523 - 1,763,160 - 28 - 98,764 C.Y. 201427 1,733,338 330 - 1,720,406 - 24 ▲ 5 112,359 201528 1,817,790 574 - 1,834,550 - 24 - 98,985 201629 1,788,620 461 - 1,790,196 - 24 ▲ 45 101,776 201730 1,697,355 565 - 1,692,009 - 24 - 109,712 2018
平成 28 年度 1,812,262 575 - 1,865,996 - 24 - 121,805 F.Y. 201629 1,756,598 479 - 1,775,801 - 24 ▲ 45 106,223 2017
30 年 1~ 3月 458,664 179 - 454,931 - 6 - 106,223 Q1 2018 4~ 6 398,650 113 - 417,136 - 6 - 88,672 Q2 7~ 9 435,447 133 - 410,917 - 6 - 113,627 Q310~12 404,594 140 - 409,025 - 6 - 109,712 Q4
30 年 1月 164,680 64 - 159,612 - 2 - 107,088 Jan. 2018 2 143,200 59 - 138,181 - 2 - 112,441 Feb. 3 150,784 56 - 157,138 - 2 - 106,223 Mar. 4 146,918 34 - 137,372 - 2 - 116,175 Apr. 5 134,621 39 - 145,073 - 2 - 106,023 May 6 117,111 40 - 134,691 - 2 - 88,672 Jun.
7 143,221 43 - 133,059 - 2 - 99,023 Jul. 8 159,543 45 - 140,048 - 2 - 118,657 Aug. 9 132,683 45 - 137,810 - 2 - 113,627 Sep.10 114,585 43 - 144,056 - 2 - 84,326 Oct.11 138,091 45 - 133,628 - 2 - 88,994 Nov.12 151,918 52 - 131,341 - 2 - 109,712 Dec.
(単位: kl ) (Unit: kl )
生産数量 受入数量 販売部門 その他 Others 品種振替 在庫数量(末)
年 月ProductionQuantity
ReceiptQuantity
Consumption(fuel for use in
refinery)
To salesdepartment
転送Transfer out
その他(自家使用)
Others(own use)
Conversion toanotherproduct
InventoryQuantity
平成 26 年 517,620 9,846 69,248 461,240 - - - 20,855 C.Y. 201427 489,692 10,066 59,418 443,698 - - - 17,627 201528 562,000 7,437 66,448 504,874 - - - 15,943 201629 512,972 3,219 60,538 455,113 - - - 16,386 201730 562,468 3,285 109,789 451,911 - - - 20,345 2018
平成 28 年度 571,629 5,646 67,793 513,326 - - - 16,760 F.Y. 201629 516,799 3,306 70,937 444,134 - - - 21,731 2017
30 年 1~ 3月 149,748 816 28,159 117,041 - - - 21,731 Q1 2018 4~ 6 146,129 853 23,804 122,214 - - - 22,650 Q2 7~ 9 146,705 781 34,267 112,061 - - - 23,814 Q310~12 119,886 835 23,559 100,595 - - - 20,345 Q4
30 年 1月 51,544 283 7,745 39,402 - - - 21,050 Jan. 2018 2 46,484 256 9,103 36,756 - - - 21,938 Feb. 3 51,720 277 11,311 40,883 - - - 21,731 Mar. 4 50,839 268 8,500 39,308 - - - 25,009 Apr. 5 47,939 309 8,387 41,560 - - - 23,302 May 6 47,351 276 6,917 41,346 - - - 22,650 Jun.
7 49,127 257 11,531 37,469 - - - 23,032 Jul. 8 48,605 280 10,932 37,196 - - - 23,783 Aug. 9 48,973 244 11,804 37,396 - - - 23,814 Sep.10 20,196 275 397 24,765 - - - 19,123 Oct.11 50,379 270 10,749 40,359 - - - 18,650 Nov.12 49,311 290 12,413 35,471 - - - 20,345 Dec.
回収いおう (17)Recovered sulfur
消費数量(精製用燃料)
出 荷 Shipments
Year, Quarter and Month
その他の石油製品 (18)Other petroleum products
消費数量(精製用燃料)
出 荷 Shipments
Year, Quarter and Month

18 資源/生産・出荷・在庫統計
1.生産・出荷・在庫統計 / Production, Shipment and Inventory
(2) 時系列表 / Historical Data by Commodities 2) 石油製品 / Petroleum products ① 製品(続き) / Product (continued)
(単位: kl ) (Unit: kl )
生産数量 受入数量 販売部門 その他 Others 品種振替 在庫数量(末)
年 月ProductionQuantity
ReceiptQuantity
Consumption(fuel for use in
refinery)
To salesdepartment
転送Transfer out
その他(自家使用)
Others(own use)
Conversion toanotherproduct
InventoryQuantity
平成 26 年 13,800,035 - - 3,645,954 10,150,914 3,167 - - C.Y. 201427 14,792,118 - - 4,634,653 10,157,465 - - - 201528 14,423,194 - - 4,542,747 9,880,447 - - - 201629 15,391,958 - - 4,910,108 10,481,850 - - - 201730 14,501,938 - - 4,432,006 10,069,932 - - - 2018
平成 28 年度 14,406,592 - - 4,520,312 9,886,280 - - - F.Y. 201629 15,272,019 - - 4,897,028 10,374,991 - - - 2017
30 年 1~ 3月 3,309,321 - - 1,044,414 2,264,907 - - - Q1 2018 4~ 6 3,704,065 - - 1,050,082 2,653,983 - - - Q2 7~ 9 3,675,778 - - 1,201,155 2,474,623 - - - Q310~12 3,812,774 - - 1,136,355 2,676,419 - - - Q4
30 年 1月 1,086,160 - - 301,335 784,825 - - - Jan. 2018 2 1,046,609 - - 364,670 681,939 - - - Feb. 3 1,176,552 - - 378,409 798,143 - - - Mar. 4 1,208,793 - - 378,425 830,368 - - - Apr. 5 1,216,301 - - 351,938 864,363 - - - May 6 1,278,971 - - 319,719 959,252 - - - Jun.
7 1,344,028 - - 370,970 973,058 - - - Jul. 8 1,199,926 - - 399,293 800,633 - - - Aug. 9 1,131,824 - - 430,892 700,932 - - - Sep.10 1,160,498 - - 379,497 781,001 - - - Oct.11 1,338,629 - - 365,869 972,760 - - - Nov.12 1,313,647 - - 390,989 922,658 - - - Dec.
(単位: kl ) (Unit: kl )
生産数量 受入数量 販売部門 その他 Others 品種振替 在庫数量(末)
年 月ProductionQuantity
ReceiptQuantity
Consumption(fuel for use in
refinery)
To salesdepartment
転送Transfer out
その他(自家使用)
Others(own use)
Conversion toanotherproduct
InventoryQuantity
平成 26 年 9,005,964 338,932 9,067,233 276,893 - 769 - - C.Y. 201427 9,322,235 373,694 9,194,807 500,525 - 597 - - 201528 9,333,891 360,997 9,201,032 493,224 - 632 - - 201629 9,314,024 305,358 9,202,668 416,537 - 183 - - 201730 9,014,010 315,853 8,867,706 462,159 - - - - 2018
平成 28 年度 9,303,617 336,794 9,194,380 445,400 - 632 - - F.Y. 201629 9,208,527 309,096 9,102,739 414,880 - 9 - - 2017
30 年 1~ 3月 2,323,281 88,996 2,301,765 110,512 - - - - Q1 2018 4~ 6 2,064,451 72,750 2,045,175 92,025 - - - - Q2 7~ 9 2,370,596 61,771 2,306,318 126,050 - - - - Q310~12 2,255,682 92,336 2,214,448 133,572 - - - - Q4
30 年 1月 809,547 32,550 806,949 35,148 - - - - Jan. 2018 2 712,844 26,651 705,976 33,519 - - - - Feb. 3 800,890 29,795 788,840 41,845 - - - - Mar. 4 749,940 27,456 748,915 28,481 - - - - Apr. 5 697,743 20,541 691,776 26,507 - - - - May 6 616,768 24,753 604,484 37,037 - - - - Jun.
7 770,507 30,152 757,404 43,255 - - - - Jul. 8 841,388 16,467 815,196 42,659 - - - - Aug. 9 758,701 15,152 733,718 40,136 - - - - Sep.10 681,105 29,030 662,096 48,040 - - - - Oct.11 759,864 31,249 748,507 42,606 - - - - Nov.12 814,713 32,057 803,845 42,926 - - - - Dec.
精製及び混合原料油 (19)Refining material and blending component oil
消費数量(精製用燃料)
出 荷 Shipments
Year, Quarter and Month
石油ガス (20)Off gas
消費数量(精製用燃料)
出 荷 Shipments
Year, Quarter and Month

資源/生産・出荷・在庫統計 19
1.生産・出荷・在庫統計 / Production, Shipment and Inventory
(2) 時系列表 / Historical Data by Commodities 2) 石油製品 / Petroleum products ② 半製品 / Semi-product
(単位: kl ) (Unit: kl )
受入数量 投入数量 出荷数量 在庫数量(末) 受入数量 投入数量 出荷数量 在庫数量(末)
年 月ReceiptQuantity
InputQuantity
ShipmentQuantity
InventoryQuantity
ReceiptQuantity
InputQuantity
ShipmentQuantity
InventoryQuantity
平成 26 年 22,474,400 22,709,726 300,766 8,939,773 12,114,315 11,781,592 296,302 2,680,854 C.Y. 201427 24,736,091 24,842,462 69,407 8,748,743 12,911,582 12,976,476 65,988 2,533,874 201528 24,384,797 24,549,241 96,416 8,411,657 13,046,674 12,995,786 92,503 2,482,336 201629 25,631,341 26,119,218 80,420 7,844,377 13,467,755 13,661,783 76,367 2,211,771 201730 25,492,353 24,450,433 79,857 8,809,357 13,587,767 13,130,150 74,170 2,595,012 2018
平成 28 年度 24,363,414 24,132,527 96,629 8,021,104 13,136,844 13,184,759 92,522 2,493,495 F.Y. 201629 25,526,672 26,039,421 75,319 7,434,225 13,387,583 13,405,792 71,570 2,403,571 2017
30 年 1~ 3月 5,795,275 6,189,959 16,035 7,434,225 3,183,539 2,976,410 15,275 2,403,571 Q1 2018 4~ 6 6,516,605 5,601,885 20,096 8,330,292 3,622,293 3,501,345 18,043 2,506,382 Q2 7~ 9 6,347,604 5,598,526 26,617 9,053,147 3,321,332 3,380,260 24,746 2,422,672 Q310~12 6,832,869 7,060,063 17,109 8,809,357 3,460,603 3,272,135 16,106 2,595,012 Q4
30 年 1月 1,971,066 1,803,345 8,248 8,004,247 1,091,237 1,026,001 8,002 2,268,994 Jan. 2018 2 1,806,220 2,133,254 5,589 7,671,556 984,450 845,027 5,402 2,403,007 Feb. 3 2,017,989 2,253,360 2,198 7,434,225 1,107,852 1,105,382 1,871 2,403,571 Mar. 4 2,275,599 1,480,856 336 8,228,839 1,310,601 1,135,138 - 2,578,953 Apr. 5 2,254,623 1,957,816 4,411 8,521,201 1,289,370 1,316,604 3,040 2,548,670 May 6 1,986,383 2,163,213 15,349 8,330,292 1,022,322 1,049,603 15,003 2,506,382 Jun.
7 2,144,016 1,825,189 7,325 8,641,721 1,082,201 1,004,251 6,972 2,577,344 Jul. 8 2,131,191 1,646,426 12,692 9,113,498 1,170,626 1,139,070 11,483 2,597,400 Aug. 9 2,072,397 2,126,911 6,600 9,053,147 1,068,505 1,236,939 6,291 2,422,672 Sep.10 2,295,044 2,490,508 4,361 8,853,449 1,159,471 1,179,248 4,001 2,398,889 Oct.11 2,252,718 1,946,204 5,456 9,154,863 1,149,008 1,027,940 5,132 2,514,817 Nov.12 2,285,107 2,623,351 7,292 8,809,357 1,152,124 1,064,947 6,973 2,595,012 Dec.
(単位: kl ) (Unit: kl )
受入数量 投入数量 出荷数量 在庫数量(末) 受入数量 投入数量 出荷数量 在庫数量(末)
年 月ReceiptQuantity
InputQuantity
ShipmentQuantity
InventoryQuantity
ReceiptQuantity
InputQuantity
ShipmentQuantity
InventoryQuantity
平成 26 年 719,487 852,890 - 559,538 1,665,990 1,676,464 - 953,624 C.Y. 201427 951,257 884,284 - 626,519 1,881,499 1,956,472 - 878,664 201528 965,955 1,049,157 - 543,318 1,352,422 1,422,614 - 773,382 201629 928,321 1,056,175 - 415,464 1,685,964 1,752,708 - 706,638 201730 754,393 525,803 - 644,059 1,650,250 1,443,688 - 913,213 2018
平成 28 年度 985,545 958,910 - 493,502 1,312,104 1,219,899 - 685,279 F.Y. 201629 845,937 914,608 - 424,832 1,776,171 1,821,981 - 639,471 2017
30 年 1~ 3月 108,289 98,923 - 424,832 382,374 449,541 - 639,471 Q1 2018 4~ 6 246,182 101,538 - 569,475 342,234 265,675 - 716,037 Q2 7~ 9 169,322 67,517 - 671,282 391,734 175,002 - 932,769 Q310~12 230,600 257,825 - 644,059 533,908 553,470 - 913,213 Q4
30 年 1月 46,470 ▲ 8,016 - 469,953 132,270 138,976 - 699,930 Jan. 2018 2 45,673 157,676 - 357,949 124,778 171,830 - 652,879 Feb. 3 16,146 ▲ 50,737 - 424,832 125,326 138,735 - 639,471 Mar. 4 82,349 ▲ 43,165 - 550,345 104,823 ▲ 30,861 - 775,158 Apr. 5 77,769 88,356 - 539,759 107,626 81,494 - 801,294 May 6 86,064 56,347 - 569,475 129,785 215,042 - 716,037 Jun.
7 51,774 7,125 - 614,125 139,177 1,797 - 853,417 Jul. 8 35,585 ▲ 52,337 - 702,048 128,480 4,192 - 977,706 Aug. 9 81,963 112,729 - 671,282 124,077 169,013 - 932,769 Sep.10 78,186 131,389 - 618,080 186,632 241,604 - 877,799 Oct.11 72,893 27,983 - 662,989 171,088 42,551 - 1,006,339 Nov.12 79,521 98,453 - 644,059 176,188 269,315 - 913,213 Dec.
半製品 (1)~(7)Semi-products total
粗灯油 (2)Slack kerosene
Year, Quarter and Month
粗ガソリン (1)Slack gasoline
Year, Quarter and Month
粗軽油 (3)Slack gas oil

20 資源/生産・出荷・在庫統計
1.生産・出荷・在庫統計 / Production, Shipment and Inventory
(2) 時系列表 / Historical Data by Commodities 2) 石油製品 / Petroleum products ② 半製品(続き) / Semi-product (continued)
(単位: kl ) (Unit: kl )
受入数量 投入数量 出荷数量 在庫数量(末) 受入数量 投入数量 出荷数量 在庫数量(末)
年 月ReceiptQuantity
InputQuantity
ShipmentQuantity
InventoryQuantity
ReceiptQuantity
InputQuantity
ShipmentQuantity
InventoryQuantity
平成 26 年 7,524,627 7,979,678 3,487 4,176,350 380,919 354,867 977 508,395 C.Y. 201427 8,531,711 8,504,148 2,604 4,202,649 385,352 435,524 815 456,892 201528 8,585,414 8,642,021 2,989 4,112,059 343,646 349,498 924 449,896 201629 9,150,092 9,180,833 3,347 4,079,467 315,875 387,081 706 377,673 201730 9,201,352 9,141,216 5,150 4,137,564 186,007 112,952 537 450,185 2018
平成 28 年度 8,483,964 8,336,664 3,239 3,836,109 353,985 342,555 868 459,600 F.Y. 201629 9,167,243 9,501,949 3,119 3,499,836 264,644 313,041 630 410,351 2017
30 年 1~ 3月 2,055,544 2,635,155 641 3,499,836 42,477 9,679 119 410,351 Q1 2018 4~ 6 2,240,454 1,674,785 1,887 4,065,150 47,730 36,363 166 421,551 Q2 7~ 9 2,380,171 1,919,724 1,726 4,524,302 46,946 11,809 145 456,539 Q310~12 2,525,183 2,911,552 896 4,137,564 48,854 55,101 107 450,185 Q4
30 年 1月 675,973 657,816 213 4,097,818 15,521 ▲ 21,528 33 414,689 Jan. 2018 2 628,966 942,095 166 3,784,465 14,751 14,352 21 415,066 Feb. 3 750,605 1,035,244 262 3,499,836 12,205 16,855 65 410,351 Mar. 4 752,184 396,922 303 3,855,083 16,471 14,213 33 412,574 Apr. 5 753,719 451,931 1,289 4,155,550 21,903 13,867 82 420,529 May 6 734,551 825,932 295 4,065,150 9,356 8,283 51 421,551 Jun.
7 851,004 800,458 324 4,115,316 13,124 7,351 29 427,293 Jul. 8 752,915 535,290 1,144 4,331,516 20,478 3,205 65 444,500 Aug. 9 776,252 583,976 258 4,524,302 13,344 1,253 51 456,539 Sep.10 838,460 916,944 343 4,445,601 17,725 20,155 17 454,095 Oct.11 837,592 810,530 275 4,472,750 13,437 36,648 49 430,835 Nov.12 849,131 1,184,078 278 4,137,564 17,692 ▲ 1,702 41 450,185 Dec.
(単位: kl ) (Unit: kl )
受入数量 投入数量 出荷数量 在庫数量(末) 受入数量 投入数量 出荷数量 在庫数量(末)
年 月ReceiptQuantity
InputQuantity
ShipmentQuantity
InventoryQuantity
ReceiptQuantity
InputQuantity
ShipmentQuantity
InventoryQuantity
平成 26 年 69,062 71,325 - 31,187 - ▲ 7,090 - 29,825 C.Y. 201427 74,690 78,056 - 27,821 - 7,502 - 22,324 201528 90,686 88,304 - 30,203 - 1,861 - 20,463 201629 83,334 83,212 - 30,325 - ▲ 2,574 - 23,039 201730 112,584 104,407 - 38,502 - ▲ 7,783 - 30,822 2018
平成 28 年度 90,972 89,132 - 30,685 - 608 - 22,434 F.Y. 201629 85,094 81,592 - 34,187 - 458 - 21,977 2017
30 年 1~ 3月 23,052 19,190 - 34,187 - 1,061 - 21,977 Q1 2018 4~ 6 17,712 19,070 - 32,829 - 3,109 - 18,868 Q2 7~ 9 38,099 38,006 - 32,922 - 6,208 - 12,661 Q310~12 33,721 28,141 - 38,502 - ▲ 18,161 - 30,822 Q4
30 年 1月 9,595 7,274 - 32,646 - 2,822 - 20,217 Jan. 2018 2 7,602 5,659 - 34,589 - ▲ 3,385 - 23,601 Feb. 3 5,855 6,257 - 34,187 - 1,624 - 21,977 Mar. 4 9,171 8,879 - 34,479 - ▲ 270 - 22,247 Apr. 5 4,236 2,436 - 36,279 - 3,128 - 19,120 May 6 4,305 7,755 - 32,829 - 251 - 18,868 Jun.
7 6,736 8,792 - 30,773 - ▲ 4,585 - 23,453 Jul. 8 23,107 12,690 - 41,190 - 4,316 - 19,138 Aug. 9 8,256 16,524 - 32,922 - 6,477 - 12,661 Sep.10 14,570 9,362 - 38,130 - ▲ 8,194 - 20,855 Oct.11 8,700 8,358 - 38,472 - ▲ 7,806 - 28,661 Nov.12 10,451 10,421 - 38,502 - ▲ 2,161 - 30,822 Dec.
Year, Quarter and Month
粗重油 (4)Slack fuel oil
粗潤滑油 (5)Slack lubricating oil
Year, Quarter and Month
粗蝋 (6)Slack wax
粗コークス (7)Slack coke

資源/生産・出荷・在庫統計 21
1.生産・出荷・在庫統計 / Production, Shipment and Inventory
(2) 時系列表 / Historical Data by Commodities 3) 鉱物及びコークス / Metallic minerals, non-metallic minerals and coke ① 製品 / Product
(単位: t ) (Unit: t )
生産数量 受入数量 消費(処理) 販 売 Sales その他 在庫数量(末)
年 月ProductionQuantity
ReceiptQuantity
Consumption(process)
数 量Quantity
金額(千円)Value
(thousand yen)
OthersQuantity
InventoryQuantity
平成 26 年 9,495,927 137,400 798,745 8,689,458 8,999,241 147,824 531,841 C.Y. 201427 8,988,066 123,382 720,486 8,259,640 8,961,407 137,660 642,991 201528 9,068,044 113,770 760,273 8,279,419 8,703,635 116,120 665,426 201629 9,261,063 111,000 808,844 8,360,119 8,853,660 116,680 751,474 201730 9,631,453 116,980 847,132 8,759,512 9,457,561 134,265 735,371 2018
平成 28 年度 9,181,337 111,800 763,510 8,373,636 8,800,301 113,580 632,071 F.Y. 201629 9,285,619 109,090 839,224 8,335,306 8,869,231 114,770 713,890 2017
30 年 1~ 3月 2,264,717 7,890 208,110 2,070,603 2,219,988 7,890 713,890 Q1 2018 4~ 6 2,441,147 39,720 195,073 2,215,558 2,382,034 39,765 744,366 Q2 7~ 9 2,426,827 31,250 211,009 2,144,849 2,313,837 35,270 811,271 Q310~12 2,498,762 38,120 232,940 2,328,502 2,541,702 51,340 735,371 Q4
30 年 1月 694,687 - 64,184 621,057 644,955 - 737,331 Jan. 2018 2 705,680 - 65,259 679,022 745,315 - 698,731 Feb. 3 864,350 7,890 78,667 770,524 829,718 7,890 713,890 Mar. 4 839,735 12,750 65,996 774,417 858,641 11,580 714,386 Apr. 5 811,247 13,440 59,857 723,639 755,391 14,055 741,522 May 6 790,165 13,530 69,220 717,502 768,002 14,130 744,366 Jun.
7 825,855 10,770 70,346 735,767 814,886 11,320 763,548 Jul. 8 782,428 9,190 67,249 695,525 735,180 10,850 781,523 Aug. 9 818,544 11,290 73,414 713,557 763,771 13,100 811,271 Sep.10 862,637 11,520 76,440 788,245 879,512 18,190 802,552 Oct.11 849,521 11,740 84,387 780,361 813,915 17,785 781,280 Nov.12 786,604 14,860 72,113 759,896 848,275 15,365 735,371 Dec.
(単位: t ) (Unit: t )
生産数量 受入数量 消費(処理) 販 売 Sales その他 在庫数量(末)
年 月ProductionQuantity
ReceiptQuantity
Consumption(process)
数 量Quantity
金額(千円)Value
(thousand yen)
OthersQuantity
InventoryQuantity
平成 26 年 148,088,002 10,671,447 28,624,502 119,209,515 102,161,024 9,481,227 9,042,505 C.Y. 201427 142,916,418 11,872,546 28,286,007 115,207,155 101,527,054 10,254,165 9,153,313 201528 139,331,640 12,289,973 27,526,753 111,780,677 99,645,034 10,777,187 9,787,749 201629 141,633,594 12,683,053 29,029,498 113,372,633 101,833,633 11,200,139 9,572,565 201730 142,211,511 12,410,467 28,045,419 114,280,268 103,589,183 11,213,495 8,758,434 2018
平成 28 年度 139,129,305 12,653,993 27,865,352 111,700,204 99,594,566 11,071,999 9,810,384 F.Y. 201629 140,998,542 12,949,752 28,687,852 113,031,611 101,999,515 11,518,299 8,661,345 2017
30 年 1~ 3月 34,332,624 3,340,068 6,851,878 27,647,954 25,019,685 2,971,121 8,661,345 Q1 2018 4~ 6 34,805,967 2,864,812 6,559,901 28,219,499 25,731,061 2,616,895 8,677,567 Q2 7~ 9 35,517,310 2,817,470 7,320,102 28,078,103 25,768,663 2,585,433 8,818,039 Q310~12 37,555,610 3,388,117 7,313,538 30,334,712 27,069,774 3,040,046 8,758,434 Q4
30 年 1月 10,743,620 1,004,816 2,142,770 8,737,306 7,857,302 893,205 8,610,340 Jan. 2018 2 10,983,313 1,063,030 2,128,438 8,854,366 8,093,792 960,771 8,586,655 Feb. 3 12,605,691 1,272,222 2,580,670 10,056,282 9,068,591 1,117,145 8,661,345 Mar. 4 11,368,122 1,015,424 1,902,439 9,586,114 8,355,775 903,666 8,532,634 Apr. 5 11,754,214 985,882 2,351,626 9,336,547 8,739,397 927,282 8,602,267 May 6 11,683,631 863,506 2,305,836 9,296,838 8,635,889 785,947 8,677,567 Jun.
7 11,684,072 955,910 2,547,522 9,311,617 8,606,260 856,147 8,484,087 Jul. 8 11,933,000 924,531 2,462,121 9,391,467 8,504,033 841,094 8,597,927 Aug. 9 11,900,238 937,029 2,310,459 9,375,019 8,658,370 888,192 8,818,039 Sep.10 12,367,064 1,123,548 2,287,199 10,275,114 9,062,139 984,637 8,628,138 Oct.11 12,578,200 1,107,256 2,346,270 10,159,881 9,172,238 1,006,293 8,675,818 Nov.12 12,610,346 1,157,313 2,680,069 9,899,717 8,835,397 1,049,116 8,758,434 Dec.
けい石Silica stone
出 荷 Shipments
Year, Quarter and Month
石灰石Limestone
出 荷 Shipments
Year, Quarter and Month

22 資源/生産・出荷・在庫統計
1.生産・出荷・在庫統計 / Production, Shipment and Inventory
(2) 時系列表 / Historical Data by Commodities 3) 鉱物及びコークス / Metallic minerals, non-metallic minerals and coke ① 製品(続き) / Product (continued)
(単位: t ) (Unit: t )
生産数量 受入数量 消費(処理) 販 売 Sales その他 在庫数量(末)
年 月ProductionQuantity
ReceiptQuantity
Consumption(process)
数 量Quantity
金額(千円)Value
(thousand yen)
OthersQuantity
InventoryQuantity
平成 26 年 3,446,452 5,722 486,195 3,013,281 3,208,328 - 164,306 C.Y. 201427 3,365,928 5,367 452,700 2,904,847 3,182,333 - 178,054 201528 3,222,885 4,471 483,605 2,739,420 3,031,723 - 182,385 201629 3,359,444 5,623 498,195 2,927,387 3,176,020 - 121,870 201730 3,439,941 7,693 464,364 2,962,070 3,240,650 - 142,541 2018
平成 28 年度 3,303,107 4,211 491,678 2,815,564 3,057,156 - 180,280 F.Y. 201629 3,332,289 6,126 486,609 2,907,461 3,213,976 - 124,625 2017
30 年 1~ 3月 867,567 1,285 115,655 750,442 853,610 - 124,625 Q1 2018 4~ 6 894,822 1,323 123,154 766,202 819,823 - 131,414 Q2 7~ 9 822,951 3,280 115,964 703,909 789,782 - 137,243 Q310~12 854,601 1,805 109,591 741,517 777,435 - 142,541 Q4
30 年 1月 269,235 331 37,151 236,022 300,938 - 118,263 Jan. 2018 2 272,388 341 33,368 235,727 248,226 - 121,897 Feb. 3 325,944 613 45,136 278,693 304,446 - 124,625 Mar. 4 296,789 507 45,511 251,490 288,410 - 124,920 Apr. 5 279,107 457 40,482 243,513 261,762 - 120,489 May 6 318,926 359 37,161 271,199 269,651 - 131,414 Jun.
7 278,135 850 37,711 256,771 284,641 - 115,518 Jul. 8 260,519 1,721 38,677 214,662 240,384 - 124,289 Aug. 9 284,297 709 39,576 232,476 264,757 - 137,243 Sep.10 292,833 182 35,501 258,510 282,994 - 136,247 Oct.11 286,594 1,053 34,845 251,139 261,812 - 137,910 Nov.12 275,174 570 39,245 231,868 232,629 - 142,541 Dec.
(単位: t ) (Unit: t )
生産数量 受入数量 消費(処理) 販 売 Sales その他 在庫数量(末)
年 月ProductionQuantity
ReceiptQuantity
Consumption(process)
数 量Quantity
金額(千円)Value
(thousand yen)
OthersQuantity
InventoryQuantity
平成 26 年 2,923,389 162,366 - 3,079,476 11,623,871 22,515 191,139 C.Y. 201427 2,834,790 158,071 - 2,979,959 11,653,165 17,336 183,346 201528 2,762,208 151,962 - 2,892,594 11,608,892 14,727 187,559 201629 2,694,788 133,625 - 2,825,321 11,991,693 13,922 175,695 201730 2,524,141 128,826 - 2,660,290 12,018,149 12,054 155,992 2018
平成 28 年度 2,690,036 156,289 - 2,824,758 11,607,491 14,859 197,427 F.Y. 201629 2,661,679 121,165 - 2,793,143 12,031,271 12,882 173,382 2017
30 年 1~ 3月 626,145 27,902 - 653,188 2,953,008 3,138 173,382 Q1 2018 4~ 6 636,147 37,602 - 669,566 3,007,019 3,818 173,751 Q2 7~ 9 622,367 31,797 - 658,687 2,937,219 2,173 166,617 Q310~12 639,482 31,525 - 678,849 3,120,903 2,925 155,992 Q4
30 年 1月 186,384 8,891 - 194,215 890,029 746 176,594 Jan. 2018 2 214,332 9,083 - 223,581 1,002,221 1,085 174,741 Feb. 3 225,429 9,928 - 235,392 1,060,758 1,307 173,382 Mar. 4 218,210 12,802 - 232,154 1,033,036 1,351 170,830 Apr. 5 203,863 13,541 - 213,680 950,864 1,501 173,069 May 6 214,074 11,259 - 223,732 1,023,119 966 173,751 Jun.
7 219,311 10,134 - 233,080 1,038,575 858 169,002 Jul. 8 211,697 10,694 - 221,989 944,264 674 168,469 Aug. 9 191,359 10,969 - 203,618 954,380 641 166,617 Sep.10 229,365 12,177 - 243,141 1,127,682 861 164,214 Oct.11 215,951 10,412 - 223,997 1,028,868 1,069 165,975 Nov.12 194,166 8,936 - 211,711 964,353 995 155,992 Dec.
ドロマイトDolomite
出 荷 Shipments
Year, Quarter and Month
けい砂Silica sand
出 荷 Shipments
Year, Quarter and Month

資源/生産・出荷・在庫統計 23
1.生産・出荷・在庫統計 / Production, Shipment and Inventory
(2) 時系列表 / Historical Data by Commodities 3) 鉱物及びコークス / Metallic minerals, non-metallic minerals and coke ① 製品(続き) / Product (continued)
(単位:乾量t ) (Unit: Dry t )
生産数量 受入数量 消費(処理) 販 売 Sales その他 在庫数量(末)
年 月ProductionQuantity
ReceiptQuantity
Consumption(process)
数 量Quantity
金額(千円)Value
(thousand yen)
OthersQuantity
InventoryQuantity
平成 26 年 34,162,696 4,153,442 28,280,534 8,458,295 170,175,005 1,235,519 1,520,832 C.Y. 201427 32,402,060 4,608,572 26,738,350 8,804,316 183,219,151 1,400,154 1,550,989 201528 33,158,781 3,469,353 26,505,064 8,601,731 174,488,551 1,244,917 1,720,292 201629 32,738,674 2,836,604 25,753,239 8,533,396 275,816,697 1,225,515 1,677,226 201730 32,573,012 3,335,258 25,863,536 8,584,506 288,853,474 1,345,966 1,725,674 2018
平成 28 年度 33,137,967 3,155,217 26,194,856 8,500,186 198,697,072 1,246,381 1,748,371 F.Y. 201629 32,587,247 2,925,033 25,895,446 8,563,796 280,861,340 1,238,025 1,532,671 2017
30 年 1~ 3月 8,041,673 793,370 6,515,148 2,104,491 71,137,041 331,942 1,532,671 Q1 2018 4~ 6 8,198,450 899,433 6,474,046 2,218,459 76,387,056 346,866 1,572,190 Q2 7~ 9 8,133,169 816,413 6,499,515 2,041,091 68,210,434 313,305 1,662,519 Q310~12 8,199,720 826,042 6,374,827 2,220,465 73,118,943 353,853 1,725,674 Q4
30 年 1月 2,782,338 286,536 2,246,838 695,000 23,165,243 102,087 1,700,179 Jan. 2018 2 2,489,653 227,519 2,026,579 682,391 22,978,708 107,674 1,594,800 Feb. 3 2,769,682 279,315 2,241,731 727,100 24,993,090 122,181 1,532,671 Mar. 4 2,698,864 299,526 2,119,746 701,046 24,105,492 125,101 1,574,084 Apr. 5 2,805,794 344,868 2,245,774 761,514 26,378,674 123,008 1,590,169 May 6 2,693,792 255,039 2,108,526 755,899 25,902,890 98,757 1,572,190 Jun.
7 2,664,634 233,670 2,135,887 654,779 22,015,506 101,850 1,576,698 Jul. 8 2,801,313 284,003 2,243,081 660,452 21,560,596 114,148 1,642,548 Aug. 9 2,667,222 298,740 2,120,547 725,860 24,634,332 97,307 1,662,519 Sep.10 2,793,621 246,898 2,132,259 714,087 23,542,221 102,167 1,739,937 Oct.11 2,643,640 300,061 2,104,940 751,522 25,240,916 126,897 1,699,078 Nov.12 2,762,459 279,083 2,137,628 754,856 24,335,806 124,789 1,725,674 Dec.
コークスCoal coke
出 荷 Shipments
Year, Quarter and Month

24 資源/生産・出荷・在庫統計
1.生産・出荷・在庫統計 / Production, Shipment and Inventory
(2) 時系列表 / Historical Data by Commodities 3) 鉱物及びコークス / Metallic minerals, non-metallic minerals and coke ② 非金属鉱物用途別販売・消費内訳 / Breakdown of non-metallic minerals sales and consumption by use
(単位: t ) (Unit: t )
合 計
年 月Total
For use incasting/making
refractoriesFor cement
Forsoda/glass
For roadsAs aggregatefor concrete
Use for others
平成 26 年 9,488,203 697,159 59,703 2,875,216 - 1,046,096 3,844,214 965,815 C.Y. 201427 8,980,126 705,924 52,647 2,623,999 - 1,140,426 3,564,019 893,111 201528 9,039,692 689,033 73,121 2,682,442 - 1,167,493 3,556,186 871,417 201629 9,168,963 621,385 36,033 2,774,421 - 1,165,668 3,617,174 954,282 201730 9,606,644 621,669 83,458 2,987,450 - 1,285,707 3,740,011 888,349 2018
平成 28 年度 9,137,146 662,680 39,933 2,674,471 - 1,200,522 3,620,352 939,188 F.Y. 201629 9,174,530 601,439 75,496 2,860,975 - 1,151,635 3,577,597 907,388 2017
30 年 1~ 3月 2,278,713 130,668 47,689 709,091 - 323,869 863,563 203,833 Q1 2018 4~ 6 2,410,631 159,961 11,132 710,574 - 350,334 979,922 198,708 Q2 7~ 9 2,355,858 149,547 12,726 747,592 - 371,538 883,112 191,343 Q310~12 2,561,442 181,493 11,911 820,193 - 239,966 1,013,414 294,465 Q4
30 年 1月 685,241 44,424 14,252 211,789 - 105,072 242,170 67,534 Jan. 2018 2 744,281 43,686 23,838 225,957 - 93,102 289,163 68,535 Feb. 3 849,191 42,558 9,599 271,345 - 125,695 332,230 67,764 Mar. 4 840,413 61,554 4,832 250,665 - 132,554 325,882 64,926 Apr. 5 783,496 42,895 2,980 235,638 - 114,404 320,761 66,818 May 6 786,722 55,512 3,320 224,271 - 103,376 333,279 66,964 Jun.
7 806,113 51,940 3,391 243,287 - 118,287 325,038 64,170 Jul. 8 762,774 51,526 4,575 253,111 - 124,463 266,442 62,657 Aug. 9 786,971 46,081 4,760 251,194 - 128,788 291,632 64,516 Sep.10 864,685 66,448 5,161 257,321 - 85,534 338,905 111,316 Oct.11 864,748 55,209 3,523 283,552 - 72,757 341,449 108,258 Nov.12 832,009 59,836 3,227 279,320 - 81,675 333,060 74,891 Dec.
(単位: t ) (Unit: t )
合 計
年 月Total
For use incasting/making
refractoriesFor cement
Forsoda/glass
For roadsAs aggregatefor concrete
Use for others
平成 26 年 147,834,017 24,215,731 9 65,002,707 1,052,755 3,897,097 32,830,433 20,835,285 C.Y. 201427 143,493,162 23,667,261 9 63,540,219 974,680 3,309,971 31,161,305 20,839,717 201528 139,307,430 23,239,701 9 61,864,494 945,025 3,278,076 29,670,577 20,309,548 201629 142,402,131 22,988,362 9 64,088,130 963,684 3,510,371 30,377,660 20,473,915 201730 142,325,687 23,163,713 6 63,153,650 970,962 3,582,818 31,350,872 20,103,666 2018
平成 28 年度 139,565,556 23,147,159 9 62,149,462 961,684 3,416,197 29,729,487 20,161,558 F.Y. 201629 141,719,463 22,780,280 6 63,575,227 965,072 3,527,145 30,405,070 20,466,663 2017
30 年 1~ 3月 34,499,832 5,679,397 - 15,218,629 249,997 984,532 7,392,078 4,975,199 Q1 2018 4~ 6 34,779,400 5,658,005 3 15,144,821 246,837 891,019 7,788,941 5,049,774 Q2 7~ 9 35,398,205 5,764,565 3 16,048,191 222,279 802,166 7,530,427 5,030,574 Q310~12 37,648,250 6,061,746 - 16,742,009 251,849 905,101 8,639,426 5,048,119 Q4
30 年 1月 10,880,076 1,879,339 - 4,815,872 85,400 266,746 2,245,905 1,586,814 Jan. 2018 2 10,982,804 1,808,763 - 4,704,130 75,009 336,655 2,454,995 1,603,252 Feb. 3 12,636,952 1,991,295 - 5,698,627 89,588 381,131 2,691,178 1,785,133 Mar. 4 11,488,553 1,819,403 - 4,996,533 79,262 306,408 2,583,789 1,703,158 Apr. 5 11,688,173 1,977,597 - 5,103,831 84,279 302,246 2,536,882 1,683,338 May 6 11,602,674 1,861,005 3 5,044,457 83,296 282,365 2,668,270 1,663,278 Jun.
7 11,859,139 1,795,608 - 5,476,469 52,269 279,252 2,594,772 1,660,769 Jul. 8 11,853,588 1,996,327 - 5,368,415 85,689 264,815 2,445,825 1,692,517 Aug. 9 11,685,478 1,972,630 3 5,203,307 84,321 258,099 2,489,830 1,677,288 Sep.10 12,562,313 2,020,088 - 5,607,785 87,312 295,191 2,886,784 1,665,153 Oct.11 12,506,151 1,954,847 - 5,495,734 84,737 310,274 2,965,197 1,695,362 Nov.12 12,579,786 2,086,811 - 5,638,490 79,800 299,636 2,787,445 1,687,604 Dec.
けい石Silica stone
その他用Year, Quarter and Month
鉄鋼・製錬用(含む
フェロアロイ用)For steel/smelting(including ferro-
alloys)
鋳物砂・耐火物用
セメント用 ソーダ・ガラス用
道路用 コンクリート骨材用
石灰石Limestone
Year, Quarter and Month
鉄鋼・製錬用(含む
フェロアロイ用)For steel/smelting(including ferro-
alloys)
鋳物砂・耐火物用
セメント用 ソーダ・ガラス用
道路用 コンクリート骨材用
その他用

資源/生産・出荷・在庫統計 25
1.生産・出荷・在庫統計 / Production, Shipment and Inventory
(2) 時系列表 / Historical Data by Commodities 3) 鉱物及びコークス / Metallic minerals, non-metallic minerals and coke ② 非金属鉱物用途別販売・消費内訳(続き) / Breakdown of non-metallic minerals sales and consumption by use (continued)
(単位: t ) (Unit: t )
合 計
年 月Total
For use incasting/making
refractoriesFor cement
Forsoda/glass
For roadsAs aggregatefor concrete
Use for others
平成 26 年 3,499,476 407,070 - - 130,498 128,107 2,142,116 691,685 C.Y. 201427 3,357,547 387,020 - - 121,175 123,557 2,083,125 642,670 201528 3,223,025 397,507 - - 121,951 119,104 1,943,932 640,531 201629 3,425,582 374,809 10 - 126,419 136,027 2,175,410 612,907 201730 3,426,434 348,840 - - 115,072 149,168 2,228,669 584,685 2018
平成 28 年度 3,307,242 395,856 10 - 117,605 126,689 2,025,343 641,739 F.Y. 201629 3,394,070 371,100 - - 127,450 134,529 2,167,597 593,394 2017
30 年 1~ 3月 866,097 93,558 - - 28,564 36,937 562,481 144,557 Q1 2018 4~ 6 889,356 92,258 - - 31,038 40,821 570,552 154,687 Q2 7~ 9 819,873 84,856 - - 29,825 33,830 527,222 144,140 Q310~12 851,108 78,168 - - 25,645 37,580 568,414 141,301 Q4
30 年 1月 273,173 30,162 - - 9,856 10,807 179,486 42,862 Jan. 2018 2 269,095 28,419 - - 9,011 12,464 172,792 46,409 Feb. 3 323,829 34,977 - - 9,697 13,666 210,203 55,286 Mar. 4 297,001 32,089 - - 8,972 10,364 187,805 57,771 Apr. 5 283,995 32,327 - - 10,108 10,571 181,708 49,281 May 6 308,360 27,842 - - 11,958 19,886 201,039 47,635 Jun.
7 294,482 29,002 - - 11,482 10,795 195,423 47,780 Jul. 8 253,339 29,444 - - 9,134 10,926 159,844 43,991 Aug. 9 272,052 26,410 - - 9,209 12,109 171,955 52,369 Sep.10 294,011 24,549 - - 9,075 13,531 194,517 52,339 Oct.11 285,984 25,599 - - 8,690 12,325 193,060 46,310 Nov.12 271,113 28,020 - - 7,880 11,724 180,837 42,652 Dec.
(単位: t ) (Unit: t )
合 計
年 月Total
For use incasting/making
refractoriesFor cement
Forsoda/glass
For roadsAs aggregatefor concrete
Use for others
平成 26 年 3,079,476 89,071 465,835 2,325 1,015,235 8,116 107,755 1,391,139 C.Y. 201427 2,979,959 89,879 428,832 4,742 1,072,003 7,475 82,113 1,294,915 201528 2,892,594 75,373 407,754 4,589 1,188,174 5,919 78,924 1,131,861 201629 2,825,321 80,080 439,034 2,116 1,058,836 5,962 50,934 1,188,359 201730 2,660,290 56,125 455,290 1,793 948,380 8,697 45,369 1,144,636 2018
平成 28 年度 2,824,758 75,972 404,217 3,727 1,160,088 5,899 76,460 1,098,395 F.Y. 201629 2,793,143 72,481 453,265 2,107 1,010,358 5,588 45,813 1,203,531 2017
30 年 1~ 3月 653,188 7,568 112,254 302 227,855 960 12,455 291,794 Q1 2018 4~ 6 669,566 13,350 107,481 486 239,331 2,236 12,561 294,121 Q2 7~ 9 658,687 18,272 110,105 484 237,795 2,419 11,558 278,054 Q310~12 678,849 16,935 125,450 521 243,399 3,082 8,795 280,667 Q4
30 年 1月 194,215 2,933 29,838 70 70,708 125 3,539 87,002 Jan. 2018 2 223,581 2,918 38,786 58 79,179 230 3,779 98,631 Feb. 3 235,392 1,717 43,630 174 77,968 605 5,137 106,161 Mar. 4 232,154 6,109 34,390 143 84,977 864 4,231 101,440 Apr. 5 213,680 2,897 36,069 151 75,855 614 4,202 93,892 May 6 223,732 4,344 37,022 192 78,499 758 4,128 98,789 Jun.
7 233,080 5,599 39,517 143 84,967 816 4,884 97,154 Jul. 8 221,989 6,788 33,132 214 82,545 845 4,228 94,237 Aug. 9 203,618 5,885 37,456 127 70,283 758 2,446 86,663 Sep.10 243,141 6,098 44,585 131 88,506 1,210 3,238 99,373 Oct.11 223,997 4,838 43,343 210 81,885 1,008 2,689 90,024 Nov.12 211,711 5,999 37,522 180 73,008 864 2,868 91,270 Dec.
ドロマイトDolomite
鉄鋼・製錬用(含む
フェロアロイ用)For steel/smelting(including ferro-
alloys)
鋳物砂・耐火物用
セメント用 ソーダ・ガラス用
道路用 コンクリート骨材用
道路用 コンクリート骨材用
その他用
Year, Quarter and Month
その他用
けい砂Silica sand
Year, Quarter and Month
鉄鋼・製錬用(含む
フェロアロイ用)For steel/smelting(including ferro-
alloys)
鋳物砂・耐火物用
セメント用 ソーダ・ガラス用

26 資源/生産・出荷・在庫統計
1.生産・出荷・在庫統計 / Production, Shipment and Inventory
(2) 時系列表 / Historical Data by Commodities 3) 鉱物及びコークス / Metallic minerals, non-metallic minerals and coke ③ 金鉱(精鉱) / Gold ores (concentrate ore production)
金 銀 鉛 亜鉛 銀 鉛 亜鉛
年 月Gold(g)
Silver(kg)
Plumbum(t)
Zinc(t)
Silver(kg)
Plumbum(t)
Zinc(t)
平成 26 年 7,113,642 3,541 - - 3,594 - - C.Y. 201427 7,698,924 4,616 - - 4,686 - - 201528 6,455,414 5,076 - - 5,156 - - 201629 6,369,413 3,408 - - 3,185 - - 201730 6,453,023 3,596 - - 3,858 - - 2018
平成 28 年度 6,690,565 4,359 - - 4,248 - - F.Y. 201629 6,345,906 3,310 - - 3,346 - - 2017
30 年 1~ 3月 1,958,895 978 - - 1,047 - - Q1 2018 4~ 6 1,284,293 726 - - 900 - - Q2 7~ 9 1,697,534 1,054 - - 1,049 - - Q310~12 1,512,301 838 - - 862 - - Q4
30 年 1月 1,111,798 549 - - 479 - - Jan. 2018 2 662,248 331 - - 373 - - Feb. 3 184,849 98 - - 195 - - Mar. 4 273,269 137 - - 272 - - Apr. 5 416,593 235 - - 295 - - May 6 594,431 354 - - 333 - - Jun.
7 462,809 302 - - 298 - - Jul. 8 589,437 390 - - 384 - - Aug. 9 645,288 362 - - 367 - - Sep.10 604,203 363 - - 342 - - Oct.11 598,516 316 - - 315 - - Nov.12 309,582 159 - - 205 - - Dec.
金 銀 鉛 亜鉛
年 月Gold(g)
Silver(kg)
Plumbum(t)
Zinc(t)
平成 26 年 820,744 428 - - C.Y. 201427 705,278 358 - - 201528 524,863 278 - - 201629 999,777 501 - - 201730 464,959 239 - - 2018
平成 28 年度 936,168 468 - - F.Y. 201629 817,502 432 - - 2017
30 年 1~ 3月 817,502 432 - - Q1 2018 4~ 6 484,406 258 - - Q2 7~ 9 521,174 263 - - Q310~12 464,959 239 - - Q4
30 年 1月 1,103,814 571 - - Jan. 2018 2 1,003,564 529 - - Feb. 3 817,502 432 - - Mar. 4 564,663 297 - - Apr. 5 455,436 237 - - May 6 484,406 258 - - Jun.
7 505,722 262 - - Jul. 8 514,818 268 - - Aug. 9 521,174 263 - - Sep.10 566,616 284 - - Oct.11 567,840 285 - - Nov.12 464,959 239 - - Dec.
生産 (精鉱)Production (concentrate)
Content
Year, Quarter and Month
Content
1,568,516
1,007,761
7,219,2567,814,3906,635,8295,894,499
6,464,572
2,141,1701,617,3881,660,766
含有量
762,498370,911526,107525,820565,461
441,493
出荷 (精鉱)Shipments (concentrate)
含有量
金
Gold(g)
含有量
6,987,840
6,427,383
580,341638,932558,761597,292412,463
在庫 (精鉱)Inventory (concentrate)
Content
Year, Quarter and Month

資源/労務統計・生産能力統計 27
2.労務統計 / Labor
(単位:人) (Unit:persons)
年 月当該部門 事業所全体 事業所 石油製品部門 事業所
The divisionThe entire
establishmentThe entire
establishmentPetroleum products
The entireestablishment
平成 26 年 5,959 37,815 2,670 9,655 11,412 2014
27 6,197 39,239 2,669 9,428 11,180 2015
28 6,267 39,776 2,692 9,404 11,020 2016
29 6,304 40,033 2,609 9,469 11,523 2017
30 6,372 42,649 2,604 10,043 11,868 2018
平成 30年 1月 6,265 39,934 2,626 9,461 11,506 Jan. 2018
2 6,258 39,852 2,616 9,448 11,497 Feb.
3 6,255 39,810 2,604 9,818 11,655 Mar.
4 6,310 42,784 2,579 9,953 11,835 Apr.
5 6,331 42,876 2,573 10,047 11,951 May
6 6,353 42,967 2,581 10,096 11,961 Jun.
7 6,390 42,832 2,569 10,137 11,970 Jul.
8 6,409 42,708 2,573 10,143 11,968 Aug.
9 6,404 42,651 2,581 10,130 11,964 Sep.
10 6,389 42,705 2,611 10,103 11,945 Oct.
11 6,380 42,623 2,611 10,099 11,931 Nov.
12 6,372 42,649 2,604 10,043 11,868 Dec.
3.生産能力統計 / Productive capacity statistics
年 月 生産能力(乾量:t)Capacity(Dry:t)
稼 働 率Operating
ratio(%)
平成 26 年 3,998,884 69.6 C.Y. 2014
27 4,053,884 66.8 2015
28 4,050,884 69.3 2016
29 4,047,884 68.7 2017
30 4,044,884 68.4 2018
平成 28 年度 4,050,884 69.5 F.Y. 2016
29 4,047,884 68.4 2017
30 年 1 ~ 3月 4,047,884 68.4 Q1 2018
4 ~ 6 3,914,492 69.0 Q2
7 ~ 9 3,914,492 67.8 Q3
10~12 4,044,884 68.3 Q4
平成 30年 1月 4,047,884 68.7 Jan. 2018
2 3,656,105 68.1 Feb.
3 4,047,884 68.4 Mar.
4 3,914,492 68.9 Apr.
5 4,044,884 69.4 May
6 3,914,492 68.8 Jun.
7 4,044,884 65.9 Jul.
8 4,044,884 69.3 Aug. 9 3,914,492 68.1 Sep.10 4,044,884 69.1 Oct.11 3,914,492 67.5 Nov.12 4,044,884 68.3 Dec.
鉱物及びコークス
1,083
1,083
Year andMonth
1,073
Metallic minerals, non-metallicminerals and coke
Crude oil andnatural gas
1,080
原油及び天然ガス 石油製品
Crude oil and natural gas Petroleum products
原油及び天然ガス部門
1,070
1,066
1,061
1,057
1,057
1,060
1,070
コークス
Coal coke
Year and Month
1,057
1,052
1,054
1,047
1,066
1,071

28 窯業/生産・出荷・在庫統計
1.生産・出荷・在庫統計 / Production, Shipment and Inventory (1) 製品年表 / Annual Commodities
1) ガラス・同製品 / Glass and glass products
① 板ガラス・安全ガラス・複層ガラス及びガラス繊維製品 / Flat glass, safety glass, multiple glass and glass fiber products平成 3 0 年 C. Y. 2018
出 荷 Shipments
単 位 生産数量 受入数量 消費数量 販 売 Sales その他 在庫数量(末)
Unit ProductionQuantity
ReceiptQuantity
ConsumptionQuantity
数量Quantity
金額(千円)Value
(thousand yen)
OthersQuantity
InventoryQuantity
換算箱 (blocks) 26,452,751 4,419,930 2,241,773 24,218,491 82,804,419 3,495,578 6,051,118
m2 61,409,061 11,977,057 … 61,260,640 301,564,059 11,529,964 3,674,814
m2 46,344,923 4,796,784 … 46,521,789 228,434,631 4,047,759 3,560,679
m2 17,358,893 2,614,275 … 17,151,209 116,733,030 2,675,013 1,245,874
m2 14,853,670 519,130 … 14,783,051 99,227,317 446,700 1,188,430
m2 2,505,223 2,095,145 … 2,368,158 17,505,713 2,228,313 57,444
m2 28,986,030 2,182,509 … 29,370,580 111,701,601 1,372,746 2,314,805
m2 15,064,138 7,180,273 … 14,738,851 73,129,428 7,482,205 114,135
kg 417,496,359 134,663,609 26,603,044 502,494,270 175,184,682 17,500,211 61,004,966
kg 204,709,077 21,233,807 1,012,445 217,879,218 73,455,452 8,914,260 14,685,506
kg 162,532,517 19,315,941 578,000 176,275,263 55,428,319 6,899,967 10,613,905
kg 21,280,048 954,314 44,000 21,516,472 9,484,381 662,863 2,030,567
kg 20,896,512 963,552 390,445 20,087,483 8,542,752 1,351,430 2,041,034
kg 212,787,282 113,429,802 25,590,599 284,615,052 101,729,230 8,585,951 46,319,460
kg 57,634,988 15,203,461 7,602,007 61,544,916 10,860,833 56,940 11,463,580
kg 109,669,994 60,256,946 1,587,734 165,511,640 30,812,745 4,990 25,235,723
kg 11,974,802 9,225,849 5,391 20,034,449 4,922,150 89 2,312,025
kg 8,885,331 24,478,319 15,697,769 11,992,288 11,234,853 5,652,268 3,178,517
kg 14,380,317 3,239,934 687,992 14,467,266 33,444,854 2,581,953 2,564,383
kg 10,241,850 1,025,293 9,706 11,064,493 10,453,795 289,711 1,565,232
*: 板ガラスの換算箱は、厚さ2mm、面積9.29平方メートル(100平方フィート)を基準に換算した箱数である。
Notes: The blocks of "flat glass" are the number of boxes converted on the basis of 2 mm in thickness, 9.29 m2 (100 square feet) in area.
品 目
Commodity
板ガラス (*)Flat glass
安全ガラス・複層ガラスSafety and multiple glass
安全ガラスSafety glass
合わせガラスLaminated glass
自動車用及び鉄道車両用合わせガラスLaminated glass for road vehicles andrailway rolling stock
その他の合わせガラスOther laminated glass
強化ガラスTempered glass
複層ガラスMultiple glass
ガラス繊維製品Glass fiber products
ガラス短繊維製品Glass fiber wool products
フェルトGlass fiber wool felts
ボードGlass fiber wool boards
その他のガラス短繊維製品Other glass fiber wool products
ガラス長繊維製品Glass fiber continuous textiles
ロービングGlass fiber rovings
チョップドストランドGlass fiber chopped strand
マットGlass fiber mats
糸Glass fiber yarn
布Glass fiber cloth
その他のガラス長繊維製品Other glass fiber continuous textiles

窯業/生産・出荷・在庫統計 29
1.生産・出荷・在庫統計 / Production, Shipment and Inventory (1) 製品年表 / Annual Commodities 1) ガラス・同製品 / Glass and glass products ② ガラス製品・ほうろう鉄器製品 / Glass products and enameled iron products
平成 3 0 年 C. Y. 2018
出 荷 Shipments
単 位 生産数量 受入数量 販 売 Sales その他 在庫数量(末)
Unit ProductionQuantity
ReceiptQuantity
数量Quantity
金額(千円)Value
(thousand yen)
OthersQuantity
InventoryQuantity
t 25,590 12,955 32,987 26,235,723 3,188 10,066
t 21,180 12,201 28,706 6,524,016 2,531 7,798
t 3,565 552 3,262 17,087,308 657 995
t 845 202 1,019 2,624,399 - 1,273
t x x x x x x
1000m2 36,313 5,042 44,175 69,924,913 - 9,916
1000m2 x x x x x x
t 1,155,965 103,988 1,135,573 119,575,691 114,649 248,262
t 598,581 70,298 586,883 58,744,818 76,929 142,053
t 354,971 55,687 347,315 37,811,662 59,661 83,303
t 149,237 13,365 144,697 12,138,357 14,973 36,383
t 94,373 1,246 94,871 8,794,799 2,295 22,367
t 286,232 24,468 289,763 28,726,231 25,855 53,211
t 23,673 234 22,049 9,655,423 79 5,682
t 247,479 8,988 236,878 22,449,219 11,786 47,316
t 32,906 - 32,591 21,068,440 374 16,699
t 16,031 - 16,065 10,048,631 201 10,008
t 16,875 - 16,526 11,019,809 173 6,691
t 75,848 21,165 61,401 41,342,963 33,446 14,014
t 36,276 10 14,418 13,380,049 21,813 791
品 目
Commodity
ガラス製品 Glass products
基礎製品Glass foundation products
電球類用・電子管用ガラスバルブ(管・棒を含む)Glass bulbs for electric lamp and tube
光学用ガラス素地Optical glass blanks
照明・信号用ガラスレンズGlass lenses for lighting or signal
理化学・医学用ガラスLaboratory and medical glass
無アルカリガラス基板Nonalkali glass substrates
化学強化ガラスChemically strengthened glass
容器類Glass containers
飲料用Beverage bottles
酒類用びんAlcoholic beverage bottles
清涼飲料用びんSoft drink bottles
し好・滋養飲料用びんFancy drink bottles
食料用・調味料用容器Food or seasoning containers
化粧品用容器Cosmetic containers
薬びんMedicine bottles
台所・食卓用品Tablewares and kitchenwares
コップTumblers
その他の台所・食卓用品Other tablewares and kitchenwares
その他のガラス製品Other glass products
ほうろう鉄器製品Enameled iron products

30 窯業/生産・出荷・在庫統計
1.生産・出荷・在庫統計 / Production, Shipment and Inventory (1) 製品年表 / Annual Commodities
2) セメント・セメント製品 / Cement and cement products
平成 3 0 年 C. Y. 2018
出 荷 Shipments
単 位 生産数量 受入数量 消費数量 販 売 Sales その他 在庫数量(末)
Unit ProductionQuantity
ReceiptQuantity
ConsumptionQuantity
数量Quantity
金額(千円)Value
(thousand yen)
OthersQuantity
InventoryQuantity
t 55,307,402 1,606,136 1,702,237 54,100,793 377,177,926 966,752 1,217,711
t 42,159,508 1,520,676 828,419 41,828,358 294,552,356 877,207 988,093
t 4,159,147 12,865 … 3,945,625 34,104,917 45,795 162,141
t 38,000,361 1,507,811 828,419 37,882,733 260,447,439 831,412 825,952
t 11,253,323 28,803 873,818 10,348,655 69,883,178 69,059 182,096
t 1,894,571 56,657 … 1,923,780 12,742,392 20,486 47,522
t 51,013,883 3,735,492 46,554,125 4,516,040 17,818,968 3,685,439 682,681
t 1,999,587 56,723 … 2,025,304 74,593,979 62,533 349,574
t 178,221 13,878 … 169,829 8,191,440 21,870 66,127
t 467,371 7,617 … 477,751 30,004,684 10,298 97,022
t 1,353,995 35,228 … 1,377,724 36,397,855 30,365 186,425
1000個(1000n) 63,207 1,813 … 66,634 12,937,906 308 5,728
t 599,331 23,773 … 635,092 9,742,140 24,456 226,036
t 2,352,695 130,712 … 2,543,004 63,075,239 38,881 857,372
t 690,048 1,421 … 667,917 19,541,037 444 133,412
t 125,994 2 … 118,707 4,936,902 8 28,050
t 564,054 1,419 … 549,210 14,604,135 436 105,362
1000枚(1000sheets)
19,442 12,961 … 25,580 44,536,064 6,890 2,852
m3 1,568,045 18,085 … 1,546,925 50,858,961 30,652 55,933
*:Notes:
品 目
Commodity
セメントCement
ポルトランドセメントPortland cement
早強・中庸熱High early strength and moderate heatportland cement
普 通Ordinary portland cement
高炉セメントPortland blastfurnace cement
その他のセメントOther cement
クリンカClinker
セメント製品Cement products
遠心力鉄筋コンクリート製品Centrifugal reinforcedconcreteproducts
遠心力鉄筋コンクリート管Centrifugal reinforcedconcrete pipes
遠心力鉄筋コンクリートポールCentrifugal reinforcedconcrete poles
遠心力鉄筋コンクリートパイルCentrifugal reinforcedconcrete piles
空洞コンクリートブロック (*)Hollow concrete blocks
護岸用コンクリートブロックConcrete blocks for bank protection
道路用コンクリート製品Concrete products for road
プレストレストコンクリート製品Prestressed concrete products
はり ・ けたBeam and crossbeam
その他のプレストレストコンクリート製品Other prestressed concrete products
木毛・木片セメント板Wood wool and wooden chip cementboard
気泡コンクリート製品Autoclaved light weight concreteproducts
空洞コンクリートブロックの換算基準は半切ブロックは2個をもって1個とし、異形ブロックは標準形に換算したものである。The conversion standard of hollow concrete blocks: two pieces of half-cut block are counted as one. And special shape blocks are converted to the standard form.
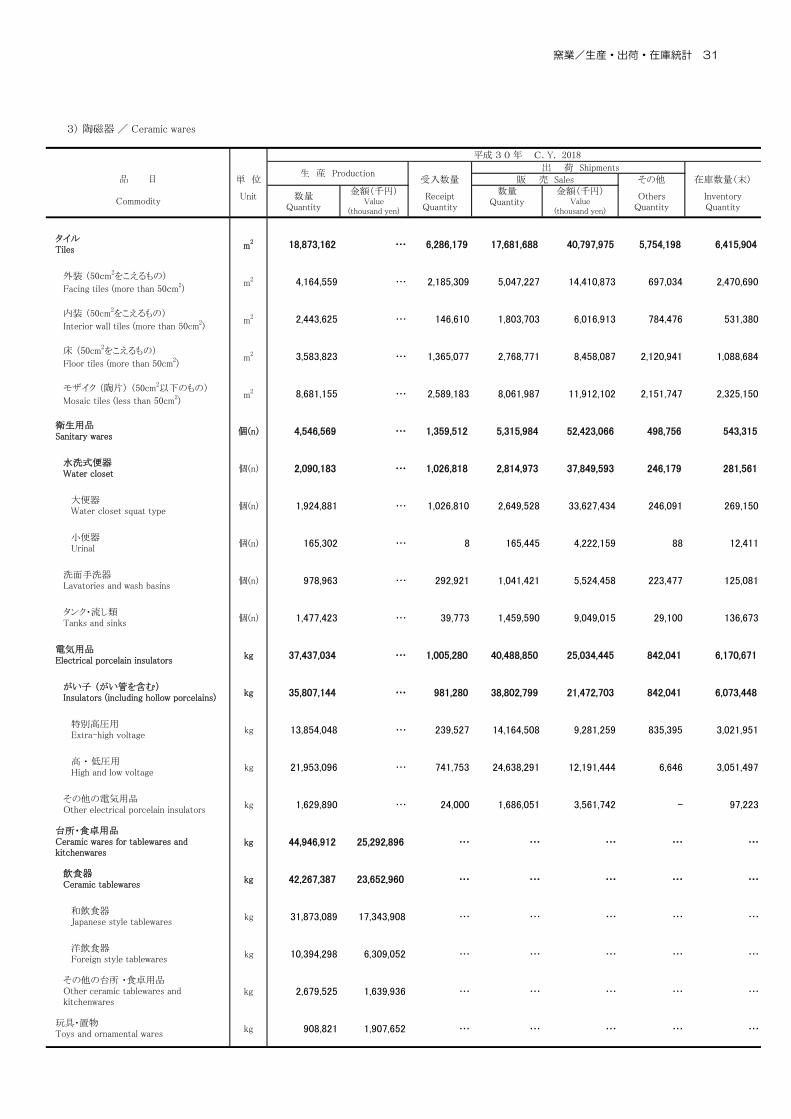
窯業/生産・出荷・在庫統計 31
1.生産・出荷・在庫統計 / Production, Shipment and Inventory (1) 製品年表 / Annual Commodities 3) 陶磁器 / Ceramic wares
平成 3 0 年 C. Y. 2018
出 荷 Shipments
単 位 受入数量 販 売 Sales その他 在庫数量(末)
Unit 数量Quantity
金額(千円)Value
(thousand yen)
ReceiptQuantity
数量Quantity
金額(千円)Value
(thousand yen)
OthersQuantity
InventoryQuantity
m2 18,873,162 … 6,286,179 17,681,688 40,797,975 5,754,198 6,415,904
m2 4,164,559 … 2,185,309 5,047,227 14,410,873 697,034 2,470,690
m2 2,443,625 … 146,610 1,803,703 6,016,913 784,476 531,380
m2 3,583,823 … 1,365,077 2,768,771 8,458,087 2,120,941 1,088,684
m2 8,681,155 … 2,589,183 8,061,987 11,912,102 2,151,747 2,325,150
個(n) 4,546,569 … 1,359,512 5,315,984 52,423,066 498,756 543,315
個(n) 2,090,183 … 1,026,818 2,814,973 37,849,593 246,179 281,561
個(n) 1,924,881 … 1,026,810 2,649,528 33,627,434 246,091 269,150
個(n) 165,302 … 8 165,445 4,222,159 88 12,411
個(n) 978,963 … 292,921 1,041,421 5,524,458 223,477 125,081
個(n) 1,477,423 … 39,773 1,459,590 9,049,015 29,100 136,673
kg 37,437,034 … 1,005,280 40,488,850 25,034,445 842,041 6,170,671
kg 35,807,144 … 981,280 38,802,799 21,472,703 842,041 6,073,448
kg 13,854,048 … 239,527 14,164,508 9,281,259 835,395 3,021,951
kg 21,953,096 … 741,753 24,638,291 12,191,444 6,646 3,051,497
kg 1,629,890 … 24,000 1,686,051 3,561,742 - 97,223
kg 44,946,912 25,292,896 … … … … …
kg 42,267,387 23,652,960 … … … … …
kg 31,873,089 17,343,908 … … … … …
kg 10,394,298 6,309,052 … … … … …
kg 2,679,525 1,639,936 … … … … …
kg 908,821 1,907,652 … … … … …
生 産 Production品 目
Commodity
タイルTiles
外装 (50cm2をこえるもの)
Facing tiles (more than 50cm2)
内装 (50cm2をこえるもの)
Interior wall tiles (more than 50cm2)
床 (50cm2をこえるもの)
Floor tiles (more than 50cm2)
モザイク (陶片) (50cm2以下のもの)
Mosaic tiles (less than 50cm2)
衛生用品Sanitary wares
水洗式便器Water closet
大便器Water closet squat type
小便器Urinal
洗面手洗器Lavatories and wash basins
タンク・流し類Tanks and sinks
電気用品Electrical porcelain insulators
がい子 (がい管を含む)Insulators (including hollow porcelains)
特別高圧用Extra-high voltage
高 ・ 低圧用High and low voltage
その他の電気用品Other electrical porcelain insulators
台所・食卓用品Ceramic wares for tablewares andkitchenwares
飲食器Ceramic tablewares
和飲食器Japanese style tablewares
洋飲食器Foreign style tablewares
その他の台所 ・食卓用品Other ceramic tablewares andkitchenwares
玩具・置物Toys and ornamental wares

32 窯業/生産・出荷・在庫統計
1.生産・出荷・在庫統計 / Production, Shipment and Inventory (1) 製品年表 / Annual Commodities
4) ファインセラミックス / Fine ceramics
平成 3 0 年 C. Y. 2018
出 荷 Shipments
単 位 生産数量 販 売 Sales その他 在庫数量(末)
Unit ProductionQuantity
数量Quantity
金額(百万円)Value
(millions yen)
OthersQuantity
InventoryQuantity
1000個(1000n)
34,160,523 33,868,450 497,207 1,463 1,278,353
1000個(1000n)
13,331,132 13,121,415 136,777 - 803,234
1000個(1000n)
54,131 52,516 13,016 - 3,205
1000個(1000n)
13,277,001 13,068,899 123,761 - 800,029
1000個(1000n)
4,762,011 4,766,424 16,586 1,055 303,495
1000個(1000n)
15,250,092 15,168,012 153,587 408 133,445
1000個(1000n)
355,743 361,733 148,694 - 9,422
1000個(1000n)
202 213 6,731 - 131
1000個(1000n)
461,343 450,653 34,832 - 28,626
1000個(1000n)
1,486,764 1,464,005 199,741 28,992 61,152
㎏ 16,449,127 16,083,173 55,358 85,886 1,710,658
1000個(1000n)
262,063 261,366 33,239 - 8,413
1000個(1000n)
106,089 106,062 39,681 1,645 9,207
1000個(1000n)
605,608 614,026 70,369 1,766 11,610
1000個(1000n)
513,004 482,551 56,452 25,581 31,922
品 目
Commodity
機能材For functional use
パッケージCeramic packages
集積回路用For integrated circuits use
機能回路用For functional circuits use
基板 (白基板)Ceramic substrates
圧電機能素子Piezoelectric ceramic devices
ガスセンサ素子Gas sensor devices
生体用部材Bioceramics
その他の機能材Other ceramic products for functional use
構造材 (除く触媒担体・セラミックフィルタ)For structural use(except ceramic catalyst supports andceramic filter)
触媒担体・セラミックフィルタCeramic catalyst supports and ceramicfilter
耐熱材Heat‐resisting materials
工具材Ceramic tools
耐摩耗・耐食材Wear resisting materials and corrosionresisting materials
その他の構造材Other materials for structural use

窯業/生産・出荷・在庫統計 33
1.生産・出荷・在庫統計 / Production, Shipment and Inventory (1) 製品年表 / Annual Commodities 5) その他の窯業・土石製品 / Other ceramics, stone and clay products
① 耐火れんが・不定形耐火物 / Refractory bricks and monolithic refractories
平成 3 0 年 C. Y. 2018
出 荷 Shipments
単 位 生産数量 受入数量 販 売 Sales その他 在庫数量(末)
Unit ProductionQuantity
ReceiptQuantity
数量Quantity
金額(千円)Value
(thousand yen)
OthersQuantity
InventoryQuantity
t 358,672 214,891 560,627 140,842,335 5,384 86,893
t 69,564 41,880 108,078 11,220,664 247 14,955
t 98,912 26,545 122,581 44,675,665 2,060 19,540
t 147,594 119,487 258,488 56,566,724 2,560 41,774
t 5,437 681 5,692 6,099,935 308 1,604
t 37,165 26,298 65,788 22,279,347 209 9,020
t 718,617 84,797 782,317 86,396,290 18,251 36,037
t 327,478 12,672 323,313 39,897,915 15,581 19,068
t 195,108 38,584 231,858 15,932,612 867 7,067
t 196,031 33,541 227,146 30,565,763 1,803 9,902
② 炭素製品・研削砥石 / Carbon products and grinding wheels
平成 3 0 年 C. Y. 2018
出 荷 Shipments
単 位 生産数量 受入数量 消費数量 販 売 Sales その他 在庫数量(末)
Unit ProductionQuantity
ReceiptQuantity
ConsumptionQuantity
数量Quantity
金額(千円)Value
(thousand yen)
OthersQuantity
InventoryQuantity
t 229,997 2,009 6,199 224,033 266,359,981 3,136 12,962
t 166,890 17 3,963 163,973 135,275,314 236 9,782
t 123,155 17 - 123,787 123,455,360 236 8,852
t 43,735 - 3,963 40,186 11,819,954 - 930
kg 4,208,285 26,992 5 4,227,954 12,966,392 - 368,618
kg 40,234,758 802,973 - 40,480,373 56,792,992 677,015 215,463
kg 18,663,935 1,161,965 2,236,323 15,351,347 61,325,283 2,223,229 2,595,900
t 38,197 5,739 … 40,612 50,300,792 3,447 3,544
t 12,297 2,410 … 13,562 20,544,103 955 1,416
t 25,900 3,329 … 27,050 29,756,689 2,492 2,128
品 目
Commodity
耐火れんが (不定形耐火物を除く)Refractory bricks
粘土質Fireclay refractory bricks
高アルミナ質 (電鋳品を含む)Highalumina refractory bricks(including electrically casted highalumina refractory bricks)
塩基性れんが (ドロマイト質を含む)Basic refractory bricks(including dolomitic refractory bricks)
ジルコン (ジルコニアを含む)Zircon bricks(including zirconia bricks)
その他の耐火れんがOther refractory bricks
不定形耐火物Monolithic refractories total
キャスタブル耐火物Castable refractories
吹付材耐火物Gunning refractories
その他の不定形耐火物Other monolithic refractories
品 目
Commodity
炭素製品Carbon products
電極Carbonaceous electrodes
人造黒鉛電極 (丸形)Artificial graphite electrodes (circle)
その他の電極 (連続自焼式電極ペーストを含む)Other solidity carbonaceous(including soderberg paste)
ブラシBrushes
特殊炭素製品Carbon specialties products
炭素繊維Carbon fiber
研削砥石Grinding wheels
ビトリファイド法砥石Vitrified grinding wheels
レジノイド法砥石Resinoid grinding wheels

34 窯業/生産・出荷・在庫統計
1.生産・出荷・在庫統計 / Production, Shipment and Inventory (1) 製品年表 / Annual Commodities
5) その他の窯業・土石製品 / Other ceramics, stone and clay products
③ ボード・パネル / Board and panels平成 3 0 年 C. Y. 2018
出 荷 Shipments
単 位 生産数量 受入数量 消費数量 販 売 Sales その他 在庫数量(末)
Unit ProductionQuantity
ReceiptQuantity
ConsumptionQuantity
数量Quantity
金額(千円)Value
(thousand yen)
OthersQuantity
InventoryQuantity
m2 499,586,129 - … 500,326,956 80,468,635 398,177 23,490,493
m2 107,562,468 13,088,471 10,090,091 92,755,843 26,606,404 17,635,667 9,669,636
( m3 ) 773,015 … … … … … …
m2 x x x x x x x
( m3 ) x … … … … … …
m2 56,141,738 1,002,389 10,090,091 45,984,269 15,574,797 2,224,727 4,250,741
( m3 ) 395,727 … … … … … …
m2 x x x x x x x
( m3 ) x … … … … … …
m2 72,457,361 169,076 4,191,487 67,871,935 38,751,402 430,991 4,607,887
( m3 ) 1,069,369 … … … … … …
m2 15,181,118 … … 15,182,481 62,934,711 - 703,964
m2 616,342 … … 632,928 6,419,224 - 329,399
m2 6,179,466 … … 6,162,929 38,119,215 - 203,902
m2 8,385,310 … … 8,386,624 18,396,272 - 170,663
品 目
Commodity
せっこうボードGypsum board
繊維板 (*1)Fiberboard
硬質Hard fiberboard
中質Medium density fiberboard
軟質Insulation fiberboard
パーティクルボード (*1)Particle board
プレハブ建築用パネルPanels for prefabricated construction
コンクリート系パネル (*2)Concrete panels
軽量鉄骨系パネルLight weight reinforced steel panels
木質系パネルWooden panels
*1:*2:
繊維板及びパーティクルボードの「生産」欄下段の数値は換算値(m3)である。
コンクリート系パネルには、気泡コンクリート製品(ALC製品)は含まない。
Notes1:2:
Figures on the lower line of "production" column of fiber boards and particle boards are converted figures(m3).
Concrete base panels do not include "autoclaved lightweight concrete products (ALC products)".
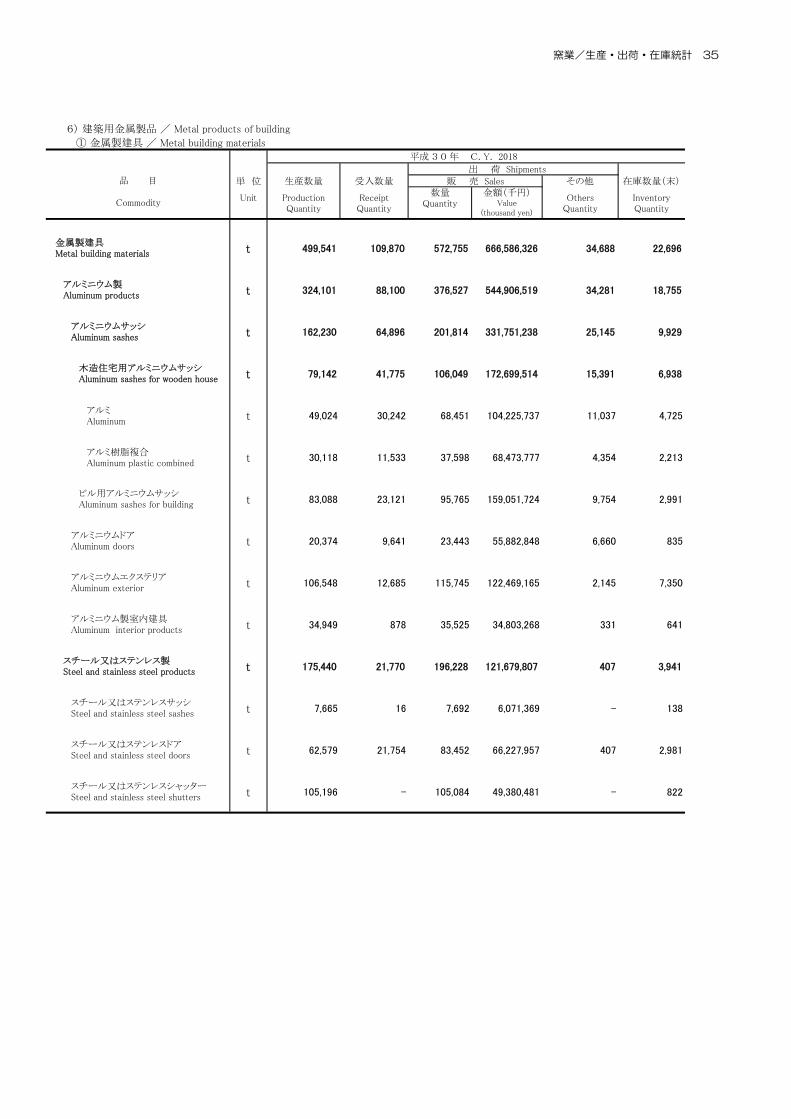
窯業/生産・出荷・在庫統計 35
1.生産・出荷・在庫統計 / Production, Shipment and Inventory (1) 製品年表 / Annual Commodities 6) 建築用金属製品 / Metal products of building
① 金属製建具 / Metal building materials
平成 3 0 年 C. Y. 2018
出 荷 Shipments
単 位 生産数量 受入数量 販 売 Sales その他 在庫数量(末)
Unit ProductionQuantity
ReceiptQuantity
数量Quantity
金額(千円)Value
(thousand yen)
OthersQuantity
InventoryQuantity
t 499,541 109,870 572,755 666,586,326 34,688 22,696
t 324,101 88,100 376,527 544,906,519 34,281 18,755
t 162,230 64,896 201,814 331,751,238 25,145 9,929
t 79,142 41,775 106,049 172,699,514 15,391 6,938
アルミAluminum t 49,024 30,242 68,451 104,225,737 11,037 4,725
アルミ樹脂複合Aluminum plastic combined t 30,118 11,533 37,598 68,473,777 4,354 2,213
t 83,088 23,121 95,765 159,051,724 9,754 2,991
t 20,374 9,641 23,443 55,882,848 6,660 835
t 106,548 12,685 115,745 122,469,165 2,145 7,350
t 34,949 878 35,525 34,803,268 331 641
t 175,440 21,770 196,228 121,679,807 407 3,941
t 7,665 16 7,692 6,071,369 - 138
t 62,579 21,754 83,452 66,227,957 407 2,981
t 105,196 - 105,084 49,380,481 - 822
品 目
Commodity
金属製建具Metal building materials
アルミニウム製Aluminum products
アルミニウムサッシAluminum sashes
木造住宅用アルミニウムサッシAluminum sashes for wooden house
ビル用アルミニウムサッシAluminum sashes for building
スチール又はステンレスシャッターSteel and stainless steel shutters
アルミニウムドアAluminum doors
アルミニウムエクステリアAluminum exterior
アルミニウム製室内建具Aluminum interior products
スチール又はステンレス製Steel and stainless steel products
スチール又はステンレスサッシSteel and stainless steel sashes
スチール又はステンレスドアSteel and stainless steel doors

36 窯業/生産・出荷・在庫統計
1.生産・出荷・在庫統計 / Production, Shipment and Inventory
(2) 時系列表 / Historical Data by Commodities 1) ガラス・同製品 / Glass and glass products ① 板ガラス・安全ガラス・複層ガラス及びガラス繊維製品 / Flat glass, safety glass, multiple glass and glass fiber products
(単位:換算箱) (Unit:blocks)
出 荷 Shipments
生産数量 受入数量 消費数量 販 売 Sales その他 在庫数量(末)
年 月ProductionQuantity
ReceiptQuantity
ConsumptionQuantity
数 量Quantity
金額(千円)Value
(thousand yen)
OthersQuantity
InventoryQuantity
平成 26 年 25,188,560 3,976,607 1,922,604 24,268,457 83,912,390 2,934,262 4,545,834 C.Y. 201427 25,663,849 3,471,849 1,908,750 23,106,792 80,827,775 3,054,514 5,510,110 201528 24,767,100 3,990,103 2,100,713 23,618,714 81,582,569 3,158,569 5,387,569 201629 25,464,856 5,041,099 2,197,567 24,193,761 84,279,393 4,167,669 5,217,617 201730 26,452,751 4,419,930 2,241,773 24,218,491 82,804,419 3,495,578 6,051,118 2018
平成 28 年度 24,788,949 4,328,774 2,136,295 23,866,648 82,381,041 3,434,304 5,270,105 F.Y. 201629 25,671,805 4,922,643 2,210,401 24,216,689 84,370,212 4,056,929 5,262,658 2017
30 年 1~ 3月 6,292,171 1,145,450 504,822 5,956,081 20,812,028 909,672 5,262,658 Q1 2018 4~ 6 6,869,755 1,024,469 526,653 5,810,434 20,006,777 813,534 5,987,466 Q2 7~ 9 6,634,501 1,123,239 622,636 5,820,431 19,742,357 855,843 6,425,038 Q310~12 6,656,324 1,126,772 587,662 6,631,545 22,243,257 916,529 6,051,118 Q4
30 年 1月 2,190,947 398,175 198,102 1,879,339 6,608,905 347,000 5,377,810 Jan. 2018 2 2,003,685 377,683 148,219 1,878,694 6,649,605 300,271 5,426,738 Feb. 3 2,097,539 369,592 158,501 2,198,048 7,553,518 262,401 5,262,658 Mar. 4 2,163,617 297,086 180,727 1,932,416 6,701,413 256,355 5,343,443 Apr. 5 2,337,083 327,654 166,064 1,893,037 6,412,634 238,805 5,704,971 May 6 2,369,055 399,729 179,862 1,984,981 6,892,730 318,374 5,987,466 Jun.
7 2,368,255 402,267 221,535 2,015,647 6,947,042 322,204 6,192,919 Jul. 8 2,030,668 347,917 204,253 1,791,440 6,035,737 218,323 6,351,277 Aug. 9 2,235,578 373,055 196,848 2,013,344 6,759,578 315,316 6,425,038 Sep.10 2,366,214 404,751 208,208 2,287,066 7,691,662 335,631 6,356,607 Oct.11 2,174,915 364,056 194,217 2,237,117 7,504,621 288,541 6,169,131 Nov.12 2,115,195 357,965 185,237 2,107,362 7,046,974 292,357 6,051,118 Dec.
注: 板ガラスの換算箱は、厚さ2mm、面積9.29平方メートル(100平方フィート)を基準に換算した箱数である。
Notes: Conversion boxes are the number of boxes converted on the basis of 2 mm in thickness, 9.29 m2 (100 square feet) in area.
(単位:m2) (Unit:m2)
出 荷 Shipments
生産数量 受入数量 消費数量 販 売 Sales その他 在庫数量(末)
年 月ProductionQuantity
ReceiptQuantity
ConsumptionQuantity
数 量Quantity
金額(千円)Value
(thousand yen)
OthersQuantity
InventoryQuantity
平成 26 年 63,162,424 11,196,737 … 61,041,416 282,958,677 13,121,806 3,572,976 C.Y. 201427 59,193,500 11,502,705 … 59,032,177 280,595,061 11,809,300 3,390,715 201528 58,585,890 11,669,974 … 58,974,138 284,648,422 11,141,665 3,494,238 201629 60,659,501 11,847,452 … 61,250,757 295,174,903 11,564,431 3,147,818 201730 61,409,061 11,977,057 … 61,260,640 301,564,059 11,529,964 3,674,814 2018
平成 28 年度 59,057,728 11,781,068 … 59,615,678 287,486,269 11,294,788 3,028,839 F.Y. 201629 60,872,991 11,706,733 … 61,183,867 295,840,016 11,430,721 2,918,602 2017
30 年 1~ 3月 15,019,691 2,696,542 … 15,301,749 74,135,124 2,594,742 2,918,602 Q1 2018 4~ 6 14,886,560 2,823,274 … 14,687,156 72,438,106 2,725,948 3,207,020 Q2 7~ 9 14,867,236 3,016,267 … 14,692,800 72,555,299 2,944,000 3,448,258 Q310~12 16,635,574 3,440,974 … 16,578,935 82,435,530 3,265,274 3,674,814 Q4
30 年 1月 4,803,420 881,296 … 4,651,383 22,502,611 846,704 3,289,643 Jan. 2018 2 4,855,523 882,207 … 5,067,021 24,568,236 839,989 3,118,374 Feb. 3 5,360,748 933,039 … 5,583,345 27,064,277 908,049 2,918,602 Mar. 4 5,019,602 906,199 … 4,802,983 23,554,982 884,599 3,154,894 Apr. 5 4,680,720 935,317 … 4,735,684 23,385,910 895,181 3,137,165 May 6 5,186,238 981,758 … 5,148,489 25,497,214 946,168 3,207,020 Jun.
7 5,278,752 1,034,339 … 5,113,903 25,110,170 1,034,851 3,369,548 Jul. 8 4,500,339 958,807 … 4,482,820 22,223,347 944,864 3,399,815 Aug. 9 5,088,145 1,023,121 … 5,096,077 25,221,782 964,285 3,448,258 Sep.10 5,616,587 1,168,188 … 5,728,602 28,503,119 1,128,419 3,374,266 Oct.11 5,675,387 1,176,297 … 5,742,655 28,576,481 1,116,622 3,364,537 Nov.12 5,343,600 1,096,489 … 5,107,678 25,355,930 1,020,233 3,674,814 Dec.
板ガラス (1)Flat glass
Year, Quarter and Month
安全ガラス・複層ガラス (2)~(5)Safety and multiple glass
Year, Quarter and Month

窯業/生産・出荷・在庫統計 37
1.生産・出荷・在庫統計 / Production, Shipment and Inventory
(2) 時系列表 / Historical Data by Commodities 1) ガラス・同製品 / Glass and glass products ① 板ガラス・安全ガラス・複層ガラス及びガラス繊維製品(続き) / Flat glass, safety glass, multiple glass and glass fiber products (continued)
(単位:m2) (Unit:m2)
出 荷 Shipments
生産数量 受入数量 消費数量 販 売 Sales その他 在庫数量(末)
年 月ProductionQuantity
ReceiptQuantity
ConsumptionQuantity
数 量Quantity
金額(千円)Value
(thousand yen)
OthersQuantity
InventoryQuantity
平成 26 年 46,681,421 3,574,492 … 45,195,533 208,188,103 4,882,810 3,466,265 C.Y. 201427 43,467,452 4,190,949 … 43,860,801 207,702,439 3,973,994 3,283,591 201528 43,366,295 4,378,010 … 43,957,589 212,094,230 3,678,045 3,381,687 201629 45,115,313 4,525,370 … 46,194,633 222,176,723 3,774,802 3,041,242 201730 46,344,923 4,796,784 … 46,521,789 228,434,631 4,047,759 3,560,679 2018
平成 28 年度 43,706,070 4,434,762 … 44,542,996 214,811,549 3,699,640 2,922,383 F.Y. 201629 45,607,095 4,491,108 … 46,353,314 223,747,119 3,784,177 2,827,418 2017
30 年 1~ 3月 11,664,922 1,116,626 … 12,025,456 58,193,410 923,407 2,827,418 Q1 2018 4~ 6 11,192,651 1,119,028 … 11,101,708 54,748,467 934,767 3,099,826 Q2 7~ 9 11,109,684 1,198,190 … 11,006,788 54,120,176 1,068,816 3,330,452 Q310~12 12,377,666 1,362,940 … 12,387,837 61,372,578 1,120,769 3,560,679 Q4
30 年 1月 3,703,349 364,000 … 3,573,445 17,241,375 303,160 3,187,346 Jan. 2018 2 3,792,179 377,605 … 4,028,430 19,509,567 301,685 3,026,082 Feb. 3 4,169,394 375,021 … 4,423,581 21,442,468 318,562 2,827,418 Mar. 4 3,832,320 362,245 … 3,655,584 17,913,708 306,789 3,058,672 Apr. 5 3,431,100 363,858 … 3,522,928 17,442,023 296,306 3,033,470 May 6 3,929,231 392,925 … 3,923,196 19,392,736 331,672 3,099,826 Jun.
7 3,949,518 401,740 … 3,823,517 18,670,139 371,856 3,255,163 Jul. 8 3,318,508 387,250 … 3,323,733 16,433,902 352,250 3,284,392 Aug. 9 3,841,658 409,200 … 3,859,538 19,016,135 344,710 3,330,452 Sep.10 4,133,630 455,463 … 4,278,669 21,189,224 389,147 3,251,183 Oct.11 4,214,046 465,088 … 4,303,271 21,357,592 383,475 3,243,021 Nov.12 4,029,990 442,389 … 3,805,897 18,825,762 348,147 3,560,679 Dec.
(単位:m2) (Unit:m2)
出 荷 Shipments
生産数量 受入数量 消費数量 販 売 Sales その他 在庫数量(末)
年 月ProductionQuantity
ReceiptQuantity
ConsumptionQuantity
数 量Quantity
金額(千円)Value
(thousand yen)
OthersQuantity
InventoryQuantity
平成 26 年 15,275,956 1,804,420 … 14,864,658 99,742,881 2,209,009 1,193,841 C.Y. 201427 15,101,863 2,142,099 … 14,924,567 100,522,008 2,267,387 1,253,454 201528 15,239,858 2,419,394 … 15,208,274 104,763,694 2,381,398 1,325,162 201629 16,217,090 2,392,030 … 16,317,990 110,139,616 2,475,879 1,142,427 201730 17,358,893 2,614,275 … 17,151,209 116,733,030 2,675,013 1,245,874 2018
平成 28 年度 15,472,221 2,473,627 … 15,466,209 106,170,953 2,419,739 1,195,304 F.Y. 201629 16,639,266 2,365,912 … 16,567,828 111,724,267 2,485,434 1,104,200 2017
30 年 1~ 3月 4,352,707 583,201 … 4,328,560 29,137,579 600,951 1,104,200 Q1 2018 4~ 6 4,159,015 619,166 … 4,135,705 28,222,079 630,335 1,116,727 Q2 7~ 9 4,198,206 678,201 … 4,073,663 27,778,532 716,512 1,203,344 Q310~12 4,648,965 733,707 … 4,613,281 31,594,840 727,215 1,245,874 Q4
30 年 1月 1,358,365 185,192 … 1,282,421 8,597,959 191,005 1,167,678 Jan. 2018 2 1,412,001 199,149 … 1,444,578 9,747,467 198,406 1,135,973 Feb. 3 1,582,341 198,860 … 1,601,561 10,792,153 211,540 1,104,200 Mar. 4 1,417,667 197,040 … 1,350,821 9,205,376 207,296 1,160,917 Apr. 5 1,259,569 207,442 … 1,323,841 9,031,065 197,138 1,107,078 May 6 1,481,779 214,684 … 1,461,043 9,985,638 225,901 1,116,727 Jun.
7 1,475,961 225,031 … 1,404,142 9,492,234 247,094 1,166,610 Jul. 8 1,283,245 226,805 … 1,232,307 8,454,664 241,329 1,203,153 Aug. 9 1,439,000 226,365 … 1,437,214 9,831,634 228,089 1,203,344 Sep.10 1,602,157 238,115 … 1,593,998 10,924,078 253,450 1,196,296 Oct.11 1,558,413 251,870 … 1,602,494 11,016,929 253,318 1,150,894 Nov.12 1,488,395 243,722 … 1,416,789 9,653,833 220,447 1,245,874 Dec.
安全ガラス (2)~(4)Safety glass
Year, Quarter and Month
合わせガラス (2)~(3)Laminated glass
Year, Quarter and Month

38 窯業/生産・出荷・在庫統計
1.生産・出荷・在庫統計 / Production, Shipment and Inventory
(2) 時系列表 / Historical Data by Commodities 1) ガラス・同製品 / Glass and glass products ① 板ガラス・安全ガラス・複層ガラス及びガラス繊維製品(続き) / Flat glass, safety glass, multiple glass and glass fiber products (continued)
(単位:m2) (Unit:m2)
出 荷 Shipments
生産数量 受入数量 消費数量 販 売 Sales その他 在庫数量(末)
年 月ProductionQuantity
ReceiptQuantity
ConsumptionQuantity
数 量Quantity
金額(千円)Value
(thousand yen)
OthersQuantity
InventoryQuantity
平成 26 年 12,786,245 302,601 … 12,880,405 84,531,532 200,522 1,131,711 C.Y. 201427 12,564,048 317,037 … 12,598,710 84,017,605 221,735 1,199,927 201528 12,784,575 406,894 … 12,888,053 87,510,773 238,036 1,266,838 201629 13,701,608 395,565 … 13,985,817 93,058,023 290,843 1,088,893 201730 14,853,670 519,130 … 14,783,051 99,227,317 446,700 1,188,430 2018
平成 28 年度 12,967,648 399,356 … 13,080,557 88,580,554 242,285 1,131,275 F.Y. 201629 14,154,884 404,786 … 14,277,058 94,958,392 322,612 1,047,787 2017
30 年 1~ 3月 3,773,959 112,651 … 3,785,058 25,159,793 98,030 1,047,787 Q1 2018 4~ 6 3,575,465 130,266 … 3,590,627 24,211,972 103,941 1,059,333 Q2 7~ 9 3,554,771 131,380 … 3,486,543 23,423,999 121,408 1,137,914 Q310~12 3,949,475 144,833 … 3,920,823 26,431,553 123,321 1,188,430 Q4
30 年 1月 1,167,876 32,155 … 1,097,623 7,263,366 29,399 1,117,020 Jan. 2018 2 1,224,844 39,250 … 1,268,882 8,460,880 34,444 1,077,916 Feb. 3 1,381,239 41,246 … 1,418,553 9,435,547 34,187 1,047,787 Mar. 4 1,229,488 44,105 … 1,178,732 7,925,396 36,456 1,106,318 Apr. 5 1,075,584 43,967 … 1,142,696 7,715,137 33,046 1,050,255 May 6 1,270,393 42,194 … 1,269,199 8,571,439 34,439 1,059,333 Jun.
7 1,249,536 41,221 … 1,200,874 7,991,968 39,407 1,109,934 Jul. 8 1,071,567 38,727 … 1,042,586 7,049,812 38,340 1,139,430 Aug. 9 1,233,668 51,432 … 1,243,083 8,382,219 43,661 1,137,914 Sep.10 1,359,812 42,522 … 1,360,999 9,176,843 46,825 1,132,552 Oct.11 1,327,577 50,085 … 1,366,605 9,256,868 42,272 1,101,463 Nov.12 1,262,086 52,226 … 1,193,219 7,997,842 34,224 1,188,430 Dec.
(単位:m2) (Unit:m2)
出 荷 Shipments
生産数量 受入数量 消費数量 販 売 Sales その他 在庫数量(末)
年 月ProductionQuantity
ReceiptQuantity
ConsumptionQuantity
数 量Quantity
金額(千円)Value
(thousand yen)
OthersQuantity
InventoryQuantity
平成 26 年 2,489,711 1,501,819 … 1,984,253 15,211,349 2,008,487 62,130 C.Y. 201427 2,537,815 1,825,062 … 2,325,857 16,504,403 2,045,652 53,527 201528 2,455,283 2,012,500 … 2,320,221 17,252,921 2,143,362 58,324 201629 2,515,482 1,996,465 … 2,332,173 17,081,593 2,185,036 53,534 201730 2,505,223 2,095,145 … 2,368,158 17,505,713 2,228,313 57,444 2018
平成 28 年度 2,504,573 2,074,271 … 2,385,652 17,590,399 2,177,454 64,029 F.Y. 201629 2,484,382 1,961,126 … 2,290,770 16,765,875 2,162,822 56,413 2017
30 年 1~ 3月 578,748 470,550 … 543,502 3,977,786 502,921 56,413 Q1 2018 4~ 6 583,550 488,900 … 545,078 4,010,107 526,394 57,394 Q2 7~ 9 643,435 546,821 … 587,120 4,354,533 595,104 65,430 Q310~12 699,490 588,874 … 692,458 5,163,287 603,894 57,444 Q4
30 年 1月 190,489 153,037 … 184,798 1,334,593 161,606 50,658 Jan. 2018 2 187,157 159,899 … 175,696 1,286,587 163,962 58,057 Feb. 3 201,102 157,614 … 183,008 1,356,606 177,353 56,413 Mar. 4 188,179 152,935 … 172,089 1,279,980 170,840 54,599 Apr. 5 183,985 163,475 … 181,145 1,315,928 164,092 56,823 May 6 211,386 172,490 … 191,844 1,414,199 191,462 57,394 Jun.
7 226,425 183,810 … 203,268 1,500,266 207,687 56,676 Jul. 8 211,678 188,078 … 189,721 1,404,852 202,989 63,723 Aug. 9 205,332 174,933 … 194,131 1,449,415 184,428 65,430 Sep.10 242,345 195,593 … 232,999 1,747,235 206,625 63,744 Oct.11 230,836 201,785 … 235,889 1,760,061 211,046 49,431 Nov.12 226,309 191,496 … 223,570 1,655,991 186,223 57,444 Dec.
自動車用及び鉄道車両用合わせガラス (2)Laminated glass for road vehicles and railway rolling stock
Year, Quarter and Month
その他の合わせガラス (3)Other laminated glass
Year, Quarter and Month

窯業/生産・出荷・在庫統計 39
1.生産・出荷・在庫統計 / Production, Shipment and Inventory
(2) 時系列表 / Historical Data by Commodities 1) ガラス・同製品 / Glass and glass products ① 板ガラス・安全ガラス・複層ガラス及びガラス繊維製品(続き) / Flat glass, safety glass, multiple glass and glass fiber products (continued)
(単位:m2) (Unit:m2)
出 荷 Shipments
生産数量 受入数量 消費数量 販 売 Sales その他 在庫数量(末)
年 月ProductionQuantity
ReceiptQuantity
ConsumptionQuantity
数 量Quantity
金額(千円)Value
(thousand yen)
OthersQuantity
InventoryQuantity
平成 26 年 31,405,465 1,770,072 … 30,330,875 108,445,222 2,673,801 2,272,424 C.Y. 201427 28,365,589 2,048,850 … 28,936,234 107,180,431 1,706,607 2,030,137 201528 28,126,437 1,958,616 … 28,749,315 107,330,536 1,296,647 2,056,525 201629 28,898,223 2,133,340 … 29,876,643 112,037,107 1,298,923 1,898,815 201730 28,986,030 2,182,509 … 29,370,580 111,701,601 1,372,746 2,314,805 2018
平成 28 年度 28,233,849 1,961,135 … 29,076,787 108,640,596 1,279,901 1,727,079 F.Y. 201629 28,967,829 2,125,196 … 29,785,486 112,022,852 1,298,743 1,723,218 2017
30 年 1~ 3月 7,312,215 533,425 … 7,696,896 29,055,831 322,456 1,723,218 Q1 2018 4~ 6 7,033,636 499,862 … 6,966,003 26,526,388 304,432 1,983,099 Q2 7~ 9 6,911,478 519,989 … 6,933,125 26,341,644 352,304 2,127,108 Q310~12 7,728,701 629,233 … 7,774,556 29,777,738 393,554 2,314,805 Q4
30 年 1月 2,344,984 178,808 … 2,291,024 8,643,416 112,155 2,019,668 Jan. 2018 2 2,380,178 178,456 … 2,583,852 9,762,100 103,279 1,890,109 Feb. 3 2,587,053 176,161 … 2,822,020 10,650,315 107,022 1,723,218 Mar. 4 2,414,653 165,205 … 2,304,763 8,708,332 99,493 1,897,755 Apr. 5 2,171,531 156,416 … 2,199,087 8,410,958 99,168 1,926,392 May 6 2,447,452 178,241 … 2,462,153 9,407,098 105,771 1,983,099 Jun.
7 2,473,557 176,709 … 2,419,375 9,177,905 124,762 2,088,553 Jul. 8 2,035,263 160,445 … 2,091,426 7,979,238 110,921 2,081,239 Aug. 9 2,402,658 182,835 … 2,422,324 9,184,501 116,621 2,127,108 Sep.10 2,531,473 217,348 … 2,684,671 10,265,146 135,697 2,054,887 Oct.11 2,655,633 213,218 … 2,700,777 10,340,663 130,157 2,092,127 Nov.12 2,541,595 198,667 … 2,389,108 9,171,929 127,700 2,314,805 Dec.
(単位:m2) (Unit:m2)
出 荷 Shipments
生産数量 受入数量 消費数量 販 売 Sales その他 在庫数量(末)
年 月ProductionQuantity
ReceiptQuantity
ConsumptionQuantity
数 量Quantity
金額(千円)Value
(thousand yen)
OthersQuantity
InventoryQuantity
平成 26 年 16,481,003 7,622,245 … 15,845,883 74,770,574 8,238,996 106,711 C.Y. 201427 15,726,048 7,311,756 … 15,171,376 72,892,622 7,835,306 107,124 201528 15,219,595 7,291,964 … 15,016,549 72,554,192 7,463,620 112,551 201629 15,544,188 7,322,082 … 15,056,124 72,998,180 7,789,629 106,576 201730 15,064,138 7,180,273 … 14,738,851 73,129,428 7,482,205 114,135 2018
平成 28 年度 15,351,658 7,346,306 … 15,072,682 72,674,720 7,595,148 106,456 F.Y. 201629 15,265,896 7,215,625 … 14,830,553 72,092,897 7,646,544 91,184 2017
30 年 1~ 3月 3,354,769 1,579,916 … 3,276,293 15,941,714 1,671,335 91,184 Q1 2018 4~ 6 3,693,909 1,704,246 … 3,585,448 17,689,639 1,791,181 107,194 Q2 7~ 9 3,757,552 1,818,077 … 3,686,012 18,435,123 1,875,184 117,806 Q310~12 4,257,908 2,078,034 … 4,191,098 21,062,952 2,144,505 114,135 Q4
30 年 1月 1,100,071 517,296 … 1,077,938 5,261,236 543,544 102,297 Jan. 2018 2 1,063,344 504,602 … 1,038,591 5,058,669 538,304 92,292 Feb. 3 1,191,354 558,018 … 1,159,764 5,621,809 589,487 91,184 Mar. 4 1,187,282 543,954 … 1,147,399 5,641,274 577,810 96,222 Apr. 5 1,249,620 571,459 … 1,212,756 5,943,887 598,875 103,695 May 6 1,257,007 588,833 … 1,225,293 6,104,478 614,496 107,194 Jun.
7 1,329,234 632,599 … 1,290,386 6,440,031 662,995 114,385 Jul. 8 1,181,831 571,557 … 1,159,087 5,789,445 592,614 115,423 Aug. 9 1,246,487 613,921 … 1,236,539 6,205,647 619,575 117,806 Sep.10 1,482,957 712,725 … 1,449,933 7,313,895 739,272 123,083 Oct.11 1,461,341 711,209 … 1,439,384 7,218,889 733,147 121,516 Nov.12 1,313,610 654,100 … 1,301,781 6,530,168 672,086 114,135 Dec.
強化ガラス (4)Tempered glass
Year, Quarter and Month
複層ガラス (5)Multiple glass
Year, Quarter and Month

40 窯業/生産・出荷・在庫統計
1.生産・出荷・在庫統計 / Production, Shipment and Inventory
(2) 時系列表 / Historical Data by Commodities 1) ガラス・同製品 / Glass and glass products ① 板ガラス・安全ガラス・複層ガラス及びガラス繊維製品(続き) / Flat glass, safety glass, multiple glass and glass fiber products (continued)
(単位: kg ) (Unit: kg )
出 荷 Shipments
生産数量 受入数量 消費数量 販 売 Sales その他 在庫数量(末)
年 月ProductionQuantity
ReceiptQuantity
ConsumptionQuantity
数 量Quantity
金額(千円)Value
(thousand yen)
OthersQuantity
InventoryQuantity
平成 26 年 467,464,050 108,852,978 34,746,526 521,661,474 172,933,088 22,211,217 54,025,699 C.Y. 201427 438,450,473 117,211,917 28,104,177 515,759,202 173,815,042 15,667,442 48,828,407 201528 420,047,818 134,575,124 28,316,239 511,936,427 173,828,939 16,845,890 46,186,823 201629 441,303,155 141,479,187 25,985,640 527,207,193 179,777,096 20,443,357 55,508,741 201730 417,496,359 134,663,609 26,603,044 502,494,270 175,184,682 17,500,211 61,004,966 2018
平成 28 年度 423,092,922 136,262,658 27,851,460 519,102,383 175,520,868 17,111,144 45,832,703 F.Y. 201629 439,568,581 143,858,363 26,223,904 519,838,089 177,452,274 20,477,872 62,877,579 2017
30 年 1~ 3月 108,612,306 35,847,742 6,921,786 125,483,188 42,832,441 4,669,421 62,877,579 Q1 2018 4~ 6 96,102,529 34,700,632 6,738,648 123,595,349 42,595,785 4,973,453 58,357,378 Q2 7~ 9 104,321,533 31,516,563 6,831,200 122,174,946 43,338,246 3,991,153 61,186,160 Q310~12 108,459,991 32,598,672 6,111,410 131,240,787 46,418,210 3,866,184 61,004,966 Q4
30 年 1月 38,515,609 12,429,119 2,248,856 41,497,338 14,072,108 1,603,049 61,093,638 Jan. 2018 2 35,165,489 11,425,787 2,183,980 40,450,642 13,786,094 1,427,336 63,620,352 Feb. 3 34,931,208 11,992,836 2,488,950 43,535,208 14,974,239 1,639,036 62,877,579 Mar. 4 31,548,287 11,243,755 2,187,128 41,247,285 14,063,474 1,501,319 60,729,921 Apr. 5 31,406,684 11,701,310 2,229,366 40,137,431 13,915,145 1,734,004 59,730,629 May 6 33,147,558 11,755,567 2,322,154 42,210,633 14,617,166 1,738,130 58,357,378 Jun.
7 36,606,380 11,270,994 2,178,547 41,494,639 14,625,152 1,472,451 61,085,415 Jul. 8 32,971,041 10,256,291 2,406,627 39,561,838 14,142,987 1,328,802 61,011,467 Aug. 9 34,744,112 9,989,278 2,246,026 41,118,469 14,570,107 1,189,900 61,186,160 Sep.10 37,325,665 11,312,212 2,095,341 45,569,974 15,916,152 1,294,923 60,858,568 Oct.11 36,062,617 10,874,258 2,211,320 44,019,072 15,790,194 1,385,223 60,169,141 Nov.12 35,071,709 10,412,202 1,804,749 41,651,741 14,711,864 1,186,038 61,004,966 Dec.
(単位: kg ) (Unit: kg )
出 荷 Shipments
生産数量 受入数量 消費数量 販 売 Sales その他 在庫数量(末)
年 月ProductionQuantity
ReceiptQuantity
ConsumptionQuantity
数 量Quantity
金額(千円)Value
(thousand yen)
OthersQuantity
InventoryQuantity
平成 26 年 212,156,841 16,605,326 1,241,926 217,432,011 71,692,733 6,577,646 17,525,445 C.Y. 201427 212,309,951 14,884,896 1,165,321 220,182,852 73,032,907 6,320,669 17,040,012 201528 213,440,164 18,906,803 1,353,585 225,772,136 75,091,867 7,181,727 15,030,346 201629 219,351,670 20,657,194 1,245,742 227,315,468 75,473,839 9,812,658 16,608,482 201730 204,709,077 21,233,807 1,012,445 217,879,218 73,455,452 8,914,260 14,685,506 2018
平成 28 年度 213,820,849 18,628,790 1,263,623 226,899,019 75,259,507 7,161,709 16,995,378 F.Y. 201629 218,908,095 21,991,573 1,146,632 225,205,447 74,732,956 10,330,430 21,149,261 2017
30 年 1~ 3月 55,276,407 6,226,031 191,639 54,190,813 17,887,254 2,562,392 21,149,261 Q1 2018 4~ 6 46,089,914 5,082,485 330,667 51,558,052 17,333,200 2,840,199 17,576,834 Q2 7~ 9 49,293,595 4,431,231 319,015 53,008,855 18,004,834 1,788,426 16,173,348 Q310~12 54,049,161 5,494,060 171,124 59,121,498 20,230,164 1,723,243 14,685,506 Q4
30 年 1月 19,062,166 2,099,668 80,260 18,106,731 5,956,084 864,969 18,707,769 Jan. 2018 2 18,131,047 2,178,969 59,492 17,702,823 5,814,015 822,073 20,430,791 Feb. 3 18,083,194 1,947,394 51,887 18,381,259 6,117,155 875,350 21,149,261 Mar. 4 15,365,199 1,264,939 163,167 16,534,610 5,579,161 861,390 20,216,264 Apr. 5 14,562,562 1,812,188 74,015 16,898,440 5,695,507 967,936 18,644,138 May 6 16,162,153 2,005,358 93,485 18,125,002 6,058,532 1,010,873 17,576,834 Jun.
7 17,775,421 1,651,257 59,642 18,110,380 6,171,371 783,720 18,046,068 Jul. 8 14,811,995 1,469,339 75,986 17,108,868 5,824,031 568,374 16,570,160 Aug. 9 16,706,179 1,310,635 183,387 17,789,607 6,009,432 436,332 16,173,348 Sep.10 18,164,513 1,811,288 47,206 19,889,907 6,825,221 558,394 15,648,409 Oct.11 18,181,426 1,820,787 86,012 20,117,312 6,894,430 661,270 14,781,571 Nov.12 17,703,222 1,861,985 37,906 19,114,279 6,510,513 503,579 14,685,506 Dec.
ガラス繊維製品 (6)~(14)Glass fiber products
Year, Quarter and Month
ガラス短繊維製品 (6)~(8)Glass fiber wool products
Year, Quarter and Month
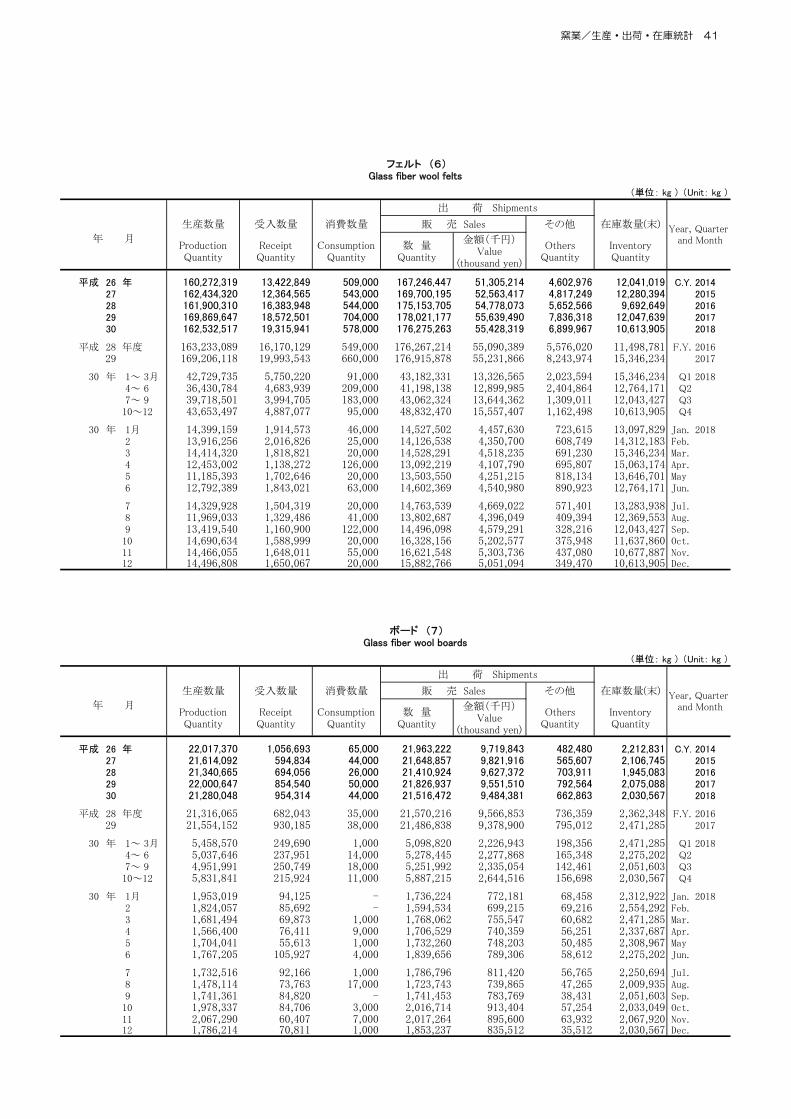
窯業/生産・出荷・在庫統計 41
1.生産・出荷・在庫統計 / Production, Shipment and Inventory
(2) 時系列表 / Historical Data by Commodities 1) ガラス・同製品 / Glass and glass products ① 板ガラス・安全ガラス・複層ガラス及びガラス繊維製品(続き) / Flat glass, safety glass, multiple glass and glass fiber products (continued)
(単位: kg ) (Unit: kg )
出 荷 Shipments
生産数量 受入数量 消費数量 販 売 Sales その他 在庫数量(末)
年 月ProductionQuantity
ReceiptQuantity
ConsumptionQuantity
数 量Quantity
金額(千円)Value
(thousand yen)
OthersQuantity
InventoryQuantity
平成 26 年 160,272,319 13,422,849 509,000 167,246,447 51,305,214 4,602,976 12,041,019 C.Y. 201427 162,434,320 12,364,565 543,000 169,700,195 52,563,417 4,817,249 12,280,394 201528 161,900,310 16,383,948 544,000 175,153,705 54,778,073 5,652,566 9,692,649 201629 169,869,647 18,572,501 704,000 178,021,177 55,639,490 7,836,318 12,047,639 201730 162,532,517 19,315,941 578,000 176,275,263 55,428,319 6,899,967 10,613,905 2018
平成 28 年度 163,233,089 16,170,129 549,000 176,267,214 55,090,389 5,576,020 11,498,781 F.Y. 201629 169,206,118 19,993,543 660,000 176,915,878 55,231,866 8,243,974 15,346,234 2017
30 年 1~ 3月 42,729,735 5,750,220 91,000 43,182,331 13,326,565 2,023,594 15,346,234 Q1 2018 4~ 6 36,430,784 4,683,939 209,000 41,198,138 12,899,985 2,404,864 12,764,171 Q2 7~ 9 39,718,501 3,994,705 183,000 43,062,324 13,644,362 1,309,011 12,043,427 Q310~12 43,653,497 4,887,077 95,000 48,832,470 15,557,407 1,162,498 10,613,905 Q4
30 年 1月 14,399,159 1,914,573 46,000 14,527,502 4,457,630 723,615 13,097,829 Jan. 2018 2 13,916,256 2,016,826 25,000 14,126,538 4,350,700 608,749 14,312,183 Feb. 3 14,414,320 1,818,821 20,000 14,528,291 4,518,235 691,230 15,346,234 Mar. 4 12,453,002 1,138,272 126,000 13,092,219 4,107,790 695,807 15,063,174 Apr. 5 11,185,393 1,702,646 20,000 13,503,550 4,251,215 818,134 13,646,701 May 6 12,792,389 1,843,021 63,000 14,602,369 4,540,980 890,923 12,764,171 Jun.
7 14,329,928 1,504,319 20,000 14,763,539 4,669,022 571,401 13,283,938 Jul. 8 11,969,033 1,329,486 41,000 13,802,687 4,396,049 409,394 12,369,553 Aug. 9 13,419,540 1,160,900 122,000 14,496,098 4,579,291 328,216 12,043,427 Sep.10 14,690,634 1,588,999 20,000 16,328,156 5,202,577 375,948 11,637,860 Oct.11 14,466,055 1,648,011 55,000 16,621,548 5,303,736 437,080 10,677,887 Nov.12 14,496,808 1,650,067 20,000 15,882,766 5,051,094 349,470 10,613,905 Dec.
(単位: kg ) (Unit: kg )
出 荷 Shipments
生産数量 受入数量 消費数量 販 売 Sales その他 在庫数量(末)
年 月ProductionQuantity
ReceiptQuantity
ConsumptionQuantity
数 量Quantity
金額(千円)Value
(thousand yen)
OthersQuantity
InventoryQuantity
平成 26 年 22,017,370 1,056,693 65,000 21,963,222 9,719,843 482,480 2,212,831 C.Y. 201427 21,614,092 594,834 44,000 21,648,857 9,821,916 565,607 2,106,745 201528 21,340,665 694,056 26,000 21,410,924 9,627,372 703,911 1,945,083 201629 22,000,647 854,540 50,000 21,826,937 9,551,510 792,564 2,075,088 201730 21,280,048 954,314 44,000 21,516,472 9,484,381 662,863 2,030,567 2018
平成 28 年度 21,316,065 682,043 35,000 21,570,216 9,566,853 736,359 2,362,348 F.Y. 201629 21,554,152 930,185 38,000 21,486,838 9,378,900 795,012 2,471,285 2017
30 年 1~ 3月 5,458,570 249,690 1,000 5,098,820 2,226,943 198,356 2,471,285 Q1 2018 4~ 6 5,037,646 237,951 14,000 5,278,445 2,277,868 165,348 2,275,202 Q2 7~ 9 4,951,991 250,749 18,000 5,251,992 2,335,054 142,461 2,051,603 Q310~12 5,831,841 215,924 11,000 5,887,215 2,644,516 156,698 2,030,567 Q4
30 年 1月 1,953,019 94,125 - 1,736,224 772,181 68,458 2,312,922 Jan. 2018 2 1,824,057 85,692 - 1,594,534 699,215 69,216 2,554,292 Feb. 3 1,681,494 69,873 1,000 1,768,062 755,547 60,682 2,471,285 Mar. 4 1,566,400 76,411 9,000 1,706,529 740,359 56,251 2,337,687 Apr. 5 1,704,041 55,613 1,000 1,732,260 748,203 50,485 2,308,967 May 6 1,767,205 105,927 4,000 1,839,656 789,306 58,612 2,275,202 Jun.
7 1,732,516 92,166 1,000 1,786,796 811,420 56,765 2,250,694 Jul. 8 1,478,114 73,763 17,000 1,723,743 739,865 47,265 2,009,935 Aug. 9 1,741,361 84,820 - 1,741,453 783,769 38,431 2,051,603 Sep.10 1,978,337 84,706 3,000 2,016,714 913,404 57,254 2,033,049 Oct.11 2,067,290 60,407 7,000 2,017,264 895,600 63,932 2,067,920 Nov.12 1,786,214 70,811 1,000 1,853,237 835,512 35,512 2,030,567 Dec.
フェルト (6)Glass fiber wool felts
Year, Quarter and Month
ボード (7)Glass fiber wool boards
Year, Quarter and Month

42 窯業/生産・出荷・在庫統計
1.生産・出荷・在庫統計 / Production, Shipment and Inventory
(2) 時系列表 / Historical Data by Commodities 1) ガラス・同製品 / Glass and glass products ① 板ガラス・安全ガラス・複層ガラス及びガラス繊維製品(続き) / Flat glass, safety glass, multiple glass and glass fiber products (continued)
(単位: kg ) (Unit: kg )
出 荷 Shipments
生産数量 受入数量 消費数量 販 売 Sales その他 在庫数量(末)
年 月ProductionQuantity
ReceiptQuantity
ConsumptionQuantity
数 量Quantity
金額(千円)Value
(thousand yen)
OthersQuantity
InventoryQuantity
平成 26 年 29,867,152 2,125,784 667,926 28,222,342 10,667,676 1,492,190 3,271,595 C.Y. 201427 28,261,539 1,925,497 578,321 28,833,800 10,647,574 937,813 2,652,873 201528 30,199,189 1,828,799 783,585 29,207,507 10,686,422 825,250 3,392,614 201629 27,481,376 1,230,153 491,742 27,467,354 10,282,839 1,183,776 2,485,755 201730 20,896,512 963,552 390,445 20,087,483 8,542,752 1,351,430 2,041,034 2018
平成 28 年度 29,271,695 1,776,618 679,623 29,061,589 10,602,265 849,330 3,134,249 F.Y. 201629 28,147,825 1,067,845 448,632 26,802,731 10,122,190 1,291,444 3,331,742 2017
30 年 1~ 3月 7,088,102 226,121 99,639 5,909,662 2,333,746 340,442 3,331,742 Q1 2018 4~ 6 4,621,484 160,595 107,667 5,081,469 2,155,347 269,987 2,537,461 Q2 7~ 9 4,623,103 185,777 118,015 4,694,539 2,025,418 336,954 2,078,318 Q310~12 4,563,823 391,059 65,124 4,401,813 2,028,241 404,047 2,041,034 Q4
30 年 1月 2,709,988 90,970 34,260 1,843,005 726,273 72,896 3,297,018 Jan. 2018 2 2,390,734 76,451 34,492 1,981,751 764,100 144,108 3,564,316 Feb. 3 1,987,380 58,700 30,887 2,084,906 843,373 123,438 3,331,742 Mar. 4 1,345,797 50,256 28,167 1,735,862 731,012 109,332 2,815,403 Apr. 5 1,673,128 53,929 53,015 1,662,630 696,089 99,317 2,688,470 May 6 1,602,559 56,410 26,485 1,682,977 728,246 61,338 2,537,461 Jun.
7 1,712,977 54,772 38,642 1,560,045 690,929 155,554 2,511,436 Jul. 8 1,364,848 66,090 17,986 1,582,438 688,117 111,715 2,190,672 Aug. 9 1,545,278 64,915 61,387 1,552,056 646,372 69,685 2,078,318 Sep.10 1,495,542 137,583 24,206 1,545,037 709,240 125,192 1,977,500 Oct.11 1,648,081 112,369 24,012 1,478,500 695,094 160,258 2,035,764 Nov.12 1,420,200 141,107 16,906 1,378,276 623,907 118,597 2,041,034 Dec.
(単位: kg ) (Unit: kg )
出 荷 Shipments
生産数量 受入数量 消費数量 販 売 Sales その他 在庫数量(末)
年 月ProductionQuantity
ReceiptQuantity
ConsumptionQuantity
数 量Quantity
金額(千円)Value
(thousand yen)
OthersQuantity
InventoryQuantity
平成 26 年 255,307,209 92,247,652 33,504,600 304,229,463 101,240,355 15,633,571 36,500,254 C.Y. 201427 226,140,522 102,327,021 26,938,856 295,576,350 100,782,135 9,346,773 31,788,395 201528 206,607,654 115,668,321 26,962,654 286,164,291 98,737,072 9,664,163 31,156,477 201629 221,951,485 120,821,993 24,739,898 299,891,725 104,303,257 10,630,699 38,900,259 201730 212,787,282 113,429,802 25,590,599 284,615,052 101,729,230 8,585,951 46,319,460 2018
平成 28 年度 209,272,073 117,633,868 26,587,837 292,203,364 100,261,361 9,949,435 28,837,325 F.Y. 201629 220,660,486 121,866,790 25,077,272 294,632,642 102,719,318 10,147,442 41,728,318 2017
30 年 1~ 3月 53,335,899 29,621,711 6,730,147 71,292,375 24,945,187 2,107,029 41,728,318 Q1 2018 4~ 6 50,012,615 29,618,147 6,407,981 72,037,297 25,262,585 2,133,254 40,780,544 Q2 7~ 9 55,027,938 27,085,332 6,512,185 69,166,091 25,333,412 2,202,727 45,012,812 Q310~12 54,410,830 27,104,612 5,940,286 72,119,289 26,188,046 2,142,941 46,319,460 Q4
30 年 1月 19,453,443 10,329,451 2,168,596 23,390,607 8,116,024 738,080 42,385,869 Jan. 2018 2 17,034,442 9,246,818 2,124,488 22,747,819 7,972,079 605,263 43,189,561 Feb. 3 16,848,014 10,045,442 2,437,063 25,153,949 8,857,084 763,686 41,728,318 Mar. 4 16,183,088 9,978,816 2,023,961 24,712,675 8,484,313 639,929 40,513,657 Apr. 5 16,844,122 9,889,122 2,155,351 23,238,991 8,219,638 766,068 41,086,491 May 6 16,985,405 9,750,209 2,228,669 24,085,631 8,558,634 727,257 40,780,544 Jun.
7 18,830,959 9,619,737 2,118,905 23,384,259 8,453,781 688,731 43,039,347 Jul. 8 18,159,046 8,786,952 2,330,641 22,452,970 8,318,956 760,428 44,441,307 Aug. 9 18,037,933 8,678,643 2,062,639 23,328,862 8,560,675 753,568 45,012,812 Sep.10 19,161,152 9,500,924 2,048,135 25,680,067 9,090,931 736,529 45,210,159 Oct.11 17,881,191 9,053,471 2,125,308 23,901,760 8,895,764 723,953 45,387,570 Nov.12 17,368,487 8,550,217 1,766,843 22,537,462 8,201,351 682,459 46,319,460 Dec.
その他のガラス短繊維製品 (8)Other glass fiber wool products
Year, Quarter and Month
ガラス長繊維製品 (9)~(14)Glass fiber continuous textiles
Year, Quarter and Month

窯業/生産・出荷・在庫統計 43
1.生産・出荷・在庫統計 / Production, Shipment and Inventory
(2) 時系列表 / Historical Data by Commodities 1) ガラス・同製品 / Glass and glass products ① 板ガラス・安全ガラス・複層ガラス及びガラス繊維製品(続き) / Flat glass, safety glass, multiple glass and glass fiber products (continued)
(単位: kg ) (Unit: kg )
出 荷 Shipments
生産数量 受入数量 消費数量 販 売 Sales その他 在庫数量(末)
年 月ProductionQuantity
ReceiptQuantity
ConsumptionQuantity
数 量Quantity
金額(千円)Value
(thousand yen)
OthersQuantity
InventoryQuantity
平成 26 年 61,427,185 14,717,554 12,067,717 64,581,384 11,111,899 86,229 9,676,625 C.Y. 201427 55,310,260 17,186,170 9,058,440 63,652,724 11,097,786 58,709 9,057,772 201528 55,465,323 16,080,201 7,779,966 65,763,539 11,350,151 60,662 6,884,329 201629 59,296,037 14,636,877 7,076,432 65,797,014 11,367,040 136,242 7,835,223 201730 57,634,988 15,203,461 7,602,007 61,544,916 10,860,833 56,940 11,463,580 2018
平成 28 年度 55,020,733 15,521,194 7,240,919 65,035,610 11,183,027 56,660 6,939,003 F.Y. 201629 59,656,786 14,954,411 7,092,696 65,458,852 11,325,898 138,682 8,887,638 2017
30 年 1~ 3月 14,748,337 3,968,811 1,797,080 15,854,174 2,759,041 13,479 8,887,638 Q1 2018 4~ 6 13,298,888 4,084,000 1,881,907 15,280,118 2,746,429 10,229 9,098,271 Q2 7~ 9 14,961,814 3,397,975 1,946,212 14,585,003 2,564,843 26,359 10,900,487 Q310~12 14,625,949 3,752,675 1,976,808 15,825,621 2,790,520 6,873 11,463,580 Q4
30 年 1月 5,464,830 1,397,263 603,072 5,300,087 917,587 7,701 8,786,456 Jan. 2018 2 4,840,357 1,242,125 582,042 5,110,984 883,568 5,394 9,170,519 Feb. 3 4,443,150 1,329,423 611,966 5,443,103 957,886 384 8,887,638 Mar. 4 4,329,692 1,428,767 568,026 5,412,702 974,354 3,265 8,662,104 Apr. 5 4,432,542 1,384,071 658,325 4,717,650 847,233 1,194 9,101,547 May 6 4,536,654 1,271,162 655,556 5,149,766 924,842 5,770 9,098,271 Jun.
7 5,230,280 1,325,245 654,523 5,209,977 919,308 6,609 9,782,688 Jul. 8 4,853,737 819,656 679,977 4,398,652 777,741 9,881 10,367,571 Aug. 9 4,877,797 1,253,074 611,712 4,976,374 867,794 9,869 10,900,487 Sep.10 5,099,369 1,291,888 737,353 5,555,752 984,877 5,939 10,992,700 Oct.11 4,831,355 1,235,674 604,432 5,382,467 948,407 234 11,066,366 Nov.12 4,695,225 1,225,113 635,023 4,887,402 857,236 700 11,463,580 Dec.
(単位: kg ) (Unit: kg )
出 荷 Shipments
生産数量 受入数量 消費数量 販 売 Sales その他 在庫数量(末)
年 月ProductionQuantity
ReceiptQuantity
ConsumptionQuantity
数 量Quantity
金額(千円)Value
(thousand yen)
OthersQuantity
InventoryQuantity
平成 26 年 134,350,148 35,928,311 2,784,062 171,181,648 32,207,156 4,638 16,184,795 C.Y. 201427 123,645,570 43,954,307 1,470,712 167,482,692 33,897,098 5,898 14,824,912 201528 103,519,131 51,870,741 1,390,433 153,586,672 28,638,435 10,260 15,227,419 201629 115,550,324 65,924,588 2,200,692 172,083,566 32,482,542 4,925 22,413,148 201730 109,669,994 60,256,946 1,587,734 165,511,640 30,812,745 4,990 25,235,723 2018
平成 28 年度 106,537,152 55,396,588 1,682,105 160,805,903 29,836,137 6,500 13,167,263 F.Y. 201629 115,056,204 67,506,584 2,263,161 168,607,913 31,743,434 5,200 24,853,777 2017
30 年 1~ 3月 27,688,709 16,011,640 520,738 40,737,767 7,409,895 1,215 24,853,777 Q1 2018 4~ 6 25,025,693 15,440,491 144,315 42,443,929 7,808,670 1,360 22,730,357 Q2 7~ 9 28,627,976 14,360,363 573,583 40,354,911 7,634,981 1,650 24,788,552 Q310~12 28,327,616 14,444,452 349,098 41,975,033 7,959,199 765 25,235,723 Q4
30 年 1月 10,360,781 5,744,090 213,621 13,310,647 2,401,487 425 24,993,326 Jan. 2018 2 8,843,163 4,996,680 165,551 12,977,576 2,367,846 500 25,689,542 Feb. 3 8,484,765 5,270,870 141,566 14,449,544 2,640,562 290 24,853,777 Mar. 4 8,185,225 5,360,213 41,314 14,691,724 2,717,828 290 23,665,887 Apr. 5 8,386,406 5,013,778 51,845 13,769,258 2,548,452 540 23,244,428 May 6 8,454,062 5,066,500 51,156 13,982,947 2,542,390 530 22,730,357 Jun.
7 9,753,383 5,259,705 181,868 13,341,169 2,506,259 - 24,220,408 Jul. 8 9,509,910 4,869,068 224,890 13,581,938 2,595,975 1,195 24,791,363 Aug. 9 9,364,683 4,231,590 166,825 13,431,804 2,532,747 455 24,788,552 Sep.10 10,058,895 5,265,665 139,168 15,268,023 2,921,933 265 24,705,656 Oct.11 9,181,099 4,712,735 130,399 13,746,734 2,585,389 275 24,722,082 Nov.12 9,087,622 4,466,052 79,531 12,960,276 2,451,877 225 25,235,723 Dec.
ロービング (9)Glass fiber rovings
Year, Quarter and Month
Year, Quarter and Month
チョップドストランド (10)Glass fiber chopped strand

44 窯業/生産・出荷・在庫統計
1.生産・出荷・在庫統計 / Production, Shipment and Inventory
(2) 時系列表 / Historical Data by Commodities 1) ガラス・同製品 / Glass and glass products ① 板ガラス・安全ガラス・複層ガラス及びガラス繊維製品(続き) / Flat glass, safety glass, multiple glass and glass fiber products (continued)
(単位: kg ) (Unit: kg )
出 荷 Shipments
生産数量 受入数量 消費数量 販 売 Sales その他 在庫数量(末)
年 月ProductionQuantity
ReceiptQuantity
ConsumptionQuantity
数 量Quantity
金額(千円)Value
(thousand yen)
OthersQuantity
InventoryQuantity
平成 26 年 13,376,481 7,766,081 152,380 22,102,146 5,305,617 55,721 1,985,347 C.Y. 201427 11,949,913 7,301,676 113,597 19,761,619 4,812,945 294 1,361,429 201528 11,363,769 8,661,535 2,502 19,820,979 4,796,996 2,196 1,561,056 201629 11,179,801 8,589,346 7,687 20,171,211 4,948,471 - 1,151,304 201730 11,974,802 9,225,849 5,391 20,034,449 4,922,150 89 2,312,025 2018
平成 28 年度 10,963,616 8,662,148 7,913 19,817,816 4,797,935 1,851 1,563,870 F.Y. 201629 11,168,456 8,573,138 4,223 20,200,982 4,957,540 - 1,100,257 2017
30 年 1~ 3月 2,904,275 2,243,112 2,222 5,196,212 1,274,872 - 1,100,257 Q1 2018 4~ 6 3,117,085 2,455,371 154 4,835,691 1,190,257 - 1,836,867 Q2 7~ 9 2,940,067 2,238,131 2,668 4,849,823 1,192,711 89 2,162,484 Q310~12 3,013,375 2,289,235 347 5,152,723 1,264,310 - 2,312,025 Q4
30 年 1月 995,838 760,454 - 1,687,822 415,078 - 1,219,774 Jan. 2018 2 862,503 682,971 - 1,593,676 391,201 - 1,171,572 Feb. 3 1,045,934 799,687 2,222 1,914,714 468,593 - 1,100,257 Mar. 4 1,009,098 762,494 94 1,586,668 390,832 - 1,285,087 Apr. 5 1,088,917 850,063 - 1,555,444 390,838 - 1,668,623 May 6 1,019,070 842,814 60 1,693,579 408,587 - 1,836,867 Jun.
7 1,064,376 792,496 385 1,659,490 406,988 29 2,033,835 Jul. 8 888,290 687,592 29 1,536,247 378,346 60 2,073,380 Aug. 9 987,401 758,043 2,254 1,654,086 407,377 - 2,162,484 Sep.10 1,084,486 791,630 137 1,846,973 459,325 - 2,191,490 Oct.11 1,001,936 772,024 - 1,772,071 429,973 - 2,193,379 Nov.12 926,953 725,581 210 1,533,679 375,012 - 2,312,025 Dec.
(単位: kg ) (Unit: kg )
出 荷 Shipments
生産数量 受入数量 消費数量 販 売 Sales その他 在庫数量(末)
年 月ProductionQuantity
ReceiptQuantity
ConsumptionQuantity
数 量Quantity
金額(千円)Value
(thousand yen)
OthersQuantity
InventoryQuantity
平成 26 年 14,907,392 26,856,320 17,904,476 11,788,367 6,814,041 11,896,685 3,053,236 C.Y. 201427 9,228,149 26,439,994 15,451,443 14,878,558 9,399,572 6,189,806 2,241,588 201528 9,350,262 29,765,276 16,417,008 15,845,191 10,654,095 6,214,233 2,880,702 201629 9,098,084 24,229,994 14,207,549 13,203,335 11,782,841 5,684,557 3,157,185 201730 8,885,331 24,478,319 15,697,769 11,992,288 11,234,853 5,652,268 3,178,517 2018
平成 28 年度 9,326,824 28,626,931 16,193,625 15,313,172 10,854,294 6,042,589 2,692,932 F.Y. 201629 8,776,613 24,436,014 14,648,398 12,751,746 11,760,385 5,587,766 2,954,266 2017
30 年 1~ 3月 2,003,861 6,274,460 4,217,821 2,911,041 2,859,681 1,352,378 2,954,266 Q1 2018 4~ 6 2,274,138 6,621,045 4,197,249 3,201,741 2,768,987 1,455,928 2,994,530 Q2 7~ 9 2,345,230 5,986,860 3,872,937 2,974,206 2,755,940 1,461,869 3,017,608 Q310~12 2,262,102 5,595,954 3,409,762 2,905,300 2,850,245 1,382,093 3,178,517 Q4
30 年 1月 699,594 2,042,351 1,295,656 949,751 982,118 482,425 3,171,298 Jan. 2018 2 586,671 2,017,005 1,314,430 928,160 884,960 403,669 3,128,715 Feb. 3 717,596 2,215,104 1,607,735 1,033,130 992,603 466,284 2,954,266 Mar. 4 679,353 2,130,871 1,343,886 1,032,275 943,609 418,762 2,969,568 Apr. 5 828,965 2,272,257 1,378,359 1,149,437 933,412 539,250 3,003,745 May 6 765,820 2,217,917 1,475,004 1,020,029 891,966 497,916 2,994,530 Jun.
7 787,470 1,892,431 1,211,628 993,817 892,103 493,370 2,975,617 Jul. 8 794,749 2,036,633 1,411,979 876,778 886,767 500,560 3,017,683 Aug. 9 763,011 2,057,796 1,249,330 1,103,611 977,070 467,939 3,017,608 Sep.10 808,231 1,852,676 1,102,565 957,903 944,984 480,469 3,137,578 Oct.11 749,241 1,975,884 1,344,761 872,060 976,163 471,703 3,174,178 Nov.12 704,630 1,767,394 962,436 1,075,337 929,098 429,921 3,178,517 Dec.
マット (11)Glass fiber mats
Year, Quarter and Month
Year, Quarter and Month
糸 (12)Glass fiber yarn

窯業/生産・出荷・在庫統計 45
1.生産・出荷・在庫統計 / Production, Shipment and Inventory
(2) 時系列表 / Historical Data by Commodities 1) ガラス・同製品 / Glass and glass products ① 板ガラス・安全ガラス・複層ガラス及びガラス繊維製品(続き) / Flat glass, safety glass, multiple glass and glass fiber products (continued)
(単位: kg ) (Unit: kg )
出 荷 Shipments
生産数量 受入数量 消費数量 販 売 Sales その他 在庫数量(末)
年 月ProductionQuantity
ReceiptQuantity
ConsumptionQuantity
数 量Quantity
金額(千円)Value
(thousand yen)
OthersQuantity
InventoryQuantity
平成 26 年 20,018,400 5,329,167 505,643 22,026,861 34,295,424 3,099,153 3,968,407 C.Y. 201427 15,703,605 5,654,296 534,264 18,490,722 31,242,603 2,730,318 2,560,112 201528 16,507,690 8,287,216 1,340,457 19,954,948 32,481,665 3,160,527 2,899,089 201629 16,516,673 6,241,063 1,227,396 17,551,983 33,808,422 4,357,160 2,681,399 201730 14,380,317 3,239,934 687,992 14,467,266 33,444,854 2,581,953 2,564,383 2018
平成 28 年度 16,843,462 8,300,479 1,428,237 19,857,701 32,693,377 3,628,839 2,763,157 F.Y. 201629 15,815,855 5,265,947 1,053,384 16,594,382 33,312,664 3,917,632 2,436,355 2017
30 年 1~ 3月 3,571,944 883,408 189,968 3,847,966 8,151,143 662,464 2,436,355 Q1 2018 4~ 6 3,637,911 767,400 180,270 3,479,038 8,059,593 598,480 2,583,877 Q2 7~ 9 3,558,977 803,813 115,201 3,571,217 8,458,417 643,670 2,616,580 Q310~12 3,611,485 785,313 202,553 3,569,045 8,775,701 677,339 2,564,383 Q4
30 年 1月 1,146,001 295,316 56,194 1,231,848 2,565,801 211,194 2,623,480 Jan. 2018 2 1,165,593 279,420 62,439 1,271,981 2,650,134 185,523 2,548,551 Feb. 3 1,260,350 308,672 71,335 1,344,137 2,935,208 265,747 2,436,355 Mar. 4 1,188,314 261,534 70,556 1,147,333 2,617,530 208,658 2,459,655 Apr. 5 1,189,156 254,617 66,323 1,143,379 2,622,928 193,660 2,500,066 May 6 1,260,441 251,249 43,391 1,188,326 2,819,135 196,162 2,583,877 Jun.
7 1,188,374 269,714 69,044 1,226,938 2,829,132 168,744 2,577,239 Jul. 8 1,191,144 270,888 13,716 1,160,935 2,728,647 220,630 2,643,991 Aug. 9 1,179,459 263,211 32,441 1,183,344 2,900,638 254,296 2,616,580 Sep.10 1,241,956 268,920 67,295 1,170,759 2,892,852 231,060 2,658,342 Oct.11 1,224,900 254,665 45,640 1,260,342 3,066,233 231,255 2,600,671 Nov.12 1,144,629 261,728 89,618 1,137,944 2,816,616 215,024 2,564,383 Dec.
(単位: kg ) (Unit: kg )
出 荷 Shipments
生産数量 受入数量 消費数量 販 売 Sales その他 在庫数量(末)
年 月ProductionQuantity
ReceiptQuantity
ConsumptionQuantity
数 量Quantity
金額(千円)Value
(thousand yen)
OthersQuantity
InventoryQuantity
平成 26 年 11,227,603 1,650,219 90,322 12,549,057 11,506,218 491,145 1,631,844 C.Y. 201427 10,303,025 1,790,578 310,400 11,310,035 10,332,131 361,748 1,742,582 201528 10,401,479 1,003,352 32,288 11,192,962 10,815,730 216,285 1,703,882 201629 10,310,566 1,200,125 20,142 11,084,616 9,913,941 447,815 1,662,000 201730 10,241,850 1,025,293 9,706 11,064,493 10,453,795 289,711 1,565,232 2018
平成 28 年度 10,580,286 1,126,528 35,038 11,373,162 10,896,591 212,996 1,711,100 F.Y. 201629 10,186,572 1,130,696 15,410 11,018,767 9,619,397 498,162 1,496,025 2017
30 年 1~ 3月 2,418,773 240,280 2,318 2,745,215 2,490,555 77,493 1,496,025 Q1 2018 4~ 6 2,658,900 249,840 4,086 2,796,780 2,688,649 67,257 1,536,642 Q2 7~ 9 2,593,874 298,190 1,584 2,830,931 2,726,520 69,090 1,527,101 Q310~12 2,570,303 236,983 1,718 2,691,567 2,548,071 75,871 1,565,232 Q4
30 年 1月 786,399 89,977 53 910,452 833,953 36,335 1,591,535 Jan. 2018 2 736,155 28,617 26 865,442 794,370 10,177 1,480,662 Feb. 3 896,219 121,686 2,239 969,321 862,232 30,981 1,496,025 Mar. 4 791,406 34,937 85 841,973 840,160 8,954 1,471,356 Apr. 5 918,136 114,336 499 903,823 876,775 31,424 1,568,082 May 6 949,358 100,567 3,502 1,050,984 971,714 26,879 1,536,642 Jun.
7 807,076 80,146 1,457 952,868 899,991 19,979 1,449,560 Jul. 8 921,216 103,115 50 898,420 951,480 28,102 1,547,319 Aug. 9 865,582 114,929 77 979,643 875,049 21,009 1,527,101 Sep.10 868,215 30,145 1,617 880,657 886,960 18,796 1,524,393 Oct.11 892,660 102,489 76 868,086 889,599 20,486 1,630,894 Nov.12 809,428 104,349 25 942,824 771,512 36,589 1,565,232 Dec.
布 (13)Glass fiber cloth
Year, Quarter and Month
Year, Quarter and Month
その他のガラス長繊維製品 (14)Other glass fiber continuous textiles

46 窯業/生産・出荷・在庫統計
1.生産・出荷・在庫統計 / Production, Shipment and Inventory
(2) 時系列表 / Historical Data by Commodities 1) ガラス・同製品 / Glass and glass products ② ガラス製品・ほうろう鉄器製品 / Glass products and enameled iron products
(単位:t) (Unit:t)
出 荷 Shipments
生産数量 受入数量 販 売 Sales その他 在庫数量(末)
年 月ProductionQuantity
ReceiptQuantity
数 量Quantity
金額(千円)Value
(thousand yen)
OthersQuantity
InventoryQuantity
平成 26 年 30,899 9,237 38,912 24,792,067 976 6,211 C.Y. 201427 29,294 9,662 37,888 23,839,518 912 6,226 201528 28,381 7,352 34,036 23,130,155 794 6,949 201629 27,336 9,520 35,030 24,343,927 859 7,721 201730 25,590 12,955 32,987 26,235,723 3,188 10,066 2018
平成 28 年度 29,723 7,347 34,397 23,038,209 752 7,544 F.Y. 201629 22,844 10,114 33,813 24,790,087 1,094 5,415 2017
30 年 1~ 3月 2,708 2,013 6,631 6,014,108 367 5,415 Q1 2018 4~ 6 6,944 2,614 7,944 6,450,271 703 6,380 Q2 7~ 9 7,652 3,594 9,016 6,829,510 799 7,773 Q310~12 8,286 4,734 9,396 6,941,834 1,319 10,066 Q4
30 年 1月 869 697 2,414 1,966,175 121 6,743 Jan. 2018 2 865 622 2,205 1,877,990 134 5,880 Feb. 3 974 694 2,012 2,169,943 112 5,415 Mar. 4 1,902 967 2,511 2,077,515 294 5,463 Apr. 5 2,492 953 2,878 2,285,215 255 5,858 May 6 2,550 694 2,555 2,087,541 154 6,380 Jun.
7 2,743 1,085 2,923 2,219,875 345 6,926 Jul. 8 2,503 1,109 2,820 2,276,605 230 7,475 Aug. 9 2,406 1,400 3,273 2,333,030 224 7,773 Sep.10 3,008 1,394 3,358 2,426,637 266 8,539 Oct.11 2,899 1,961 3,675 2,368,468 433 9,291 Nov.12 2,379 1,379 2,363 2,146,729 620 10,066 Dec.
(単位:t) (Unit:t)
出 荷 Shipments
生産数量 受入数量 販 売 Sales その他 在庫数量(末)
年 月ProductionQuantity
ReceiptQuantity
数 量Quantity
金額(千円)Value
(thousand yen)
OthersQuantity
InventoryQuantity
平成 26 年 25,438 8,235 33,659 8,462,402 133 4,212 C.Y. 201427 24,309 8,646 32,440 7,005,058 131 4,584 201528 23,320 6,449 28,973 6,410,012 78 5,300 201629 22,398 8,572 30,574 7,581,025 127 5,564 201730 21,180 12,201 28,706 6,524,016 2,531 7,798 2018
平成 28 年度 24,613 6,420 29,437 6,674,924 77 5,750 F.Y. 201629 18,088 9,223 29,447 7,314,967 330 3,280 2017
30 年 1~ 3月 1,676 1,840 5,576 1,420,541 225 3,280 Q1 2018 4~ 6 5,553 2,429 6,849 1,602,706 523 3,984 Q2 7~ 9 6,626 3,386 7,898 1,708,378 629 5,456 Q310~12 7,325 4,546 8,383 1,792,391 1,154 7,798 Q4
30 年 1月 531 636 2,061 537,984 96 4,575 Jan. 2018 2 514 574 1,876 487,565 89 3,698 Feb. 3 631 630 1,639 394,992 40 3,280 Mar. 4 1,522 909 2,170 518,351 232 3,304 Apr. 5 1,984 889 2,530 589,061 182 3,563 May 6 2,047 631 2,149 495,294 109 3,984 Jun.
7 2,377 1,013 2,529 570,182 261 4,573 Jul. 8 2,148 1,036 2,453 547,315 206 5,097 Aug. 9 2,101 1,337 2,916 590,881 162 5,456 Sep.10 2,709 1,323 3,038 637,189 231 6,219 Oct.11 2,524 1,879 3,324 676,681 385 6,914 Nov.12 2,092 1,344 2,021 478,521 538 7,798 Dec.
ガラス基礎製品 (1)~(3)Glass foundation products
Year, Quarter and Month
電球類用・電子管用ガラスバルブ (管・棒を含む) (1)Glass bulbs for electrical lamp and tube
Year, Quarter and Month

窯業/生産・出荷・在庫統計 47
1.生産・出荷・在庫統計 / Production, Shipment and Inventory
(2) 時系列表 / Historical Data by Commodities 1) ガラス・同製品 / Glass and glass products ② ガラス製品・ほうろう鉄器製品(続き) / Glass products and enameled iron products (continued)
(単位:t) (Unit:t)
出 荷 Shipments
生産数量 受入数量 販 売 Sales その他 在庫数量(末)
年 月ProductionQuantity
ReceiptQuantity
数 量Quantity
金額(千円)Value
(thousand yen)
OthersQuantity
InventoryQuantity
平成 26 年 3,122 462 2,848 12,289,430 843 585 C.Y. 201427 3,459 644 3,149 13,129,626 781 630 201528 3,551 587 3,221 13,499,451 716 653 201629 3,628 736 3,172 13,766,019 732 924 201730 3,565 552 3,262 17,087,308 657 995 2018
平成 28 年度 3,485 640 3,163 13,119,480 675 719 F.Y. 201629 3,727 691 3,245 14,676,580 764 949 2017
30 年 1~ 3月 875 125 800 3,956,934 142 949 Q1 2018 4~ 6 952 129 833 4,157,533 180 974 Q2 7~ 9 903 160 872 4,498,095 170 967 Q310~12 835 138 757 4,474,746 165 995 Q4
30 年 1月 276 46 273 1,223,606 25 937 Jan. 2018 2 308 31 239 1,168,631 45 980 Feb. 3 291 48 288 1,564,697 72 949 Mar. 4 282 39 251 1,318,827 62 945 Apr. 5 311 46 264 1,475,563 73 949 May 6 359 44 318 1,363,143 45 974 Jun.
7 325 56 309 1,441,840 84 958 Jul. 8 314 58 290 1,531,572 24 1,003 Aug. 9 264 46 273 1,524,683 62 967 Sep.10 257 56 239 1,586,479 35 993 Oct.11 332 63 260 1,457,573 48 1,078 Nov.12 246 19 258 1,430,694 82 995 Dec.
(単位:t) (Unit:t)
出 荷 Shipments
生産数量 受入数量 販 売 Sales その他 在庫数量(末)
年 月ProductionQuantity
ReceiptQuantity
数 量Quantity
金額(千円)Value
(thousand yen)
OthersQuantity
InventoryQuantity
平成 26 年 2,339 540 2,405 4,040,235 - 1,414 C.Y. 201427 1,526 372 2,299 3,704,834 - 1,012 201528 1,510 316 1,842 3,220,692 - 996 201629 1,310 212 1,284 2,996,883 - 1,233 201730 845 202 1,019 2,624,399 - 1,273 2018
平成 28 年度 1,625 287 1,797 3,243,805 - 1,075 F.Y. 201629 1,029 200 1,121 2,798,540 - 1,186 2017
30 年 1~ 3月 157 48 255 636,633 - 1,186 Q1 2018 4~ 6 439 56 262 690,032 - 1,422 Q2 7~ 9 123 48 246 623,037 - 1,350 Q310~12 126 50 256 674,697 - 1,273 Q4
30 年 1月 62 15 80 204,585 - 1,231 Jan. 2018 2 43 17 90 221,794 - 1,202 Feb. 3 52 16 85 210,254 - 1,186 Mar. 4 98 19 90 240,337 - 1,214 Apr. 5 197 18 84 220,591 - 1,346 May 6 144 19 88 229,104 - 1,422 Jun.
7 41 16 85 207,853 - 1,395 Jul. 8 41 15 77 197,718 - 1,375 Aug. 9 41 17 84 217,466 - 1,350 Sep.10 42 15 81 202,969 - 1,327 Oct.11 43 19 91 234,214 - 1,299 Nov.12 41 16 84 237,514 - 1,273 Dec.
光学用ガラス素地 (2)Optical glass blanks
Year, Quarter and Month
照明・信号用ガラスレンズ (3) Glass lenses for lighting or signal
Year, Quarter and Month

48 窯業/生産・出荷・在庫統計
1.生産・出荷・在庫統計 / Production, Shipment and Inventory
(2) 時系列表 / Historical Data by Commodities 1) ガラス・同製品 / Glass and glass products ② ガラス製品・ほうろう鉄器製品(続き) / Glass products and enameled iron products (continued)
(単位:t) (Unit:t)
出 荷 Shipments
生産数量 受入数量 販 売 Sales その他 在庫数量(末)
年 月ProductionQuantity
ReceiptQuantity
数 量Quantity
金額(千円)Value
(thousand yen)
OthersQuantity
InventoryQuantity
平成 26 年 x x x x x x C.Y. 201427 x x x x x x 201528 x x x x x x 201629 x x x x x x 201730 x x x x x x 2018
平成 28 年度 x x x x x x F.Y. 201629 x x x x x x 2017
30 年 1~ 3月 x x x x x x Q1 2018 4~ 6 x x x x x x Q2 7~ 9 x x x x x x Q310~12 x x x x x x Q4
30 年 1月 x x x x x x Jan. 2018 2 x x x x x x Feb. 3 x x x x x x Mar. 4 x x x x x x Apr. 5 x x x x x x May 6 x x x x x x Jun.
7 x x x x x x Jul. 8 x x x x x x Aug. 9 x x x x x x Sep.10 x x x x x x Oct.11 x x x x x x Nov.12 x x x x x x Dec.
(単位:1000m2) (Unit:1000m
2)
出 荷 Shipments
生産数量 受入数量 販 売 Sales その他 在庫数量(末)
年 月ProductionQuantity
ReceiptQuantity
数 量Quantity
金額(千円)Value
(thousand yen)
OthersQuantity
InventoryQuantity
平成 26 年 x x x x x 8,149 C.Y. 201427 x x x x x 9,998 201528 34,951 6,169 39,341 84,290,611 - 11,645 201629 36,136 4,635 40,186 71,838,320 - 12,237 201730 36,313 5,042 44,175 69,924,913 - 9,916 2018
平成 28 年度 35,963 5,793 40,144 81,934,858 - 12,379 F.Y. 201629 36,225 5,192 41,156 71,202,831 - 12,720 2017
30 年 1~ 3月 9,135 1,494 10,230 16,456,850 - 12,720 Q1 2018 4~ 6 8,707 1,183 10,370 17,049,956 - 12,419 Q2 7~ 9 9,017 1,159 11,688 18,409,397 - 11,065 Q310~12 9,454 1,206 11,887 18,008,710 - 9,916 Q4
30 年 1月 3,117 537 3,262 5,336,109 - 12,608 Jan. 2018 2 2,931 435 3,344 5,316,216 - 12,680 Feb. 3 3,087 522 3,624 5,804,525 - 12,720 Mar. 4 2,956 460 3,430 5,548,905 - 12,731 Apr. 5 3,063 444 3,361 5,457,150 - 12,951 May 6 2,688 279 3,579 6,043,901 - 12,419 Jun.
7 2,998 296 3,642 5,956,375 - 12,132 Jul. 8 3,288 377 4,349 6,742,203 - 11,472 Aug. 9 2,731 486 3,697 5,710,819 - 11,065 Sep.10 3,210 432 4,343 6,631,646 - 10,366 Oct.11 3,131 467 4,122 6,195,866 - 9,968 Nov.12 3,113 307 3,422 5,181,198 - 9,916 Dec.
理化学・医学用ガラス (4)Laboratory and medical glass
Year, Quarter and Month
無アルカリガラス基板 (5)Nonalkali glass substrates
Year, Quarter and Month

窯業/生産・出荷・在庫統計 49
1.生産・出荷・在庫統計 / Production, Shipment and Inventory
(2) 時系列表 / Historical Data by Commodities 1) ガラス・同製品 / Glass and glass products ② ガラス製品・ほうろう鉄器製品(続き) / Glass products and enameled iron products (continued)
(単位:1000m2) (Unit:1000m
2)
出 荷 Shipments
生産数量 受入数量 販 売 Sales その他 在庫数量(末)
年 月ProductionQuantity
ReceiptQuantity
数 量Quantity
金額(千円)Value
(thousand yen)
OthersQuantity
InventoryQuantity
平成 26 年 x x x x x x C.Y. 201427 x x x x x x 201528 x x x x x x 201629 x x x x x x 201730 x x x x x x 2018
平成 28 年度 x x x x x x F.Y. 201629 x x x x x x 2017
30 年 1~ 3月 x x x x x x Q1 2018 4~ 6 x x x x x x Q2 7~ 9 x x x x x x Q310~12 x x x x x x Q4
30 年 1月 x x x x x x Jan. 2018 2 x x x x x x Feb. 3 x x x x x x Mar. 4 x x x x x x Apr. 5 x x x x x x May 6 x x x x x x Jun.
7 x x x x x x Jul. 8 x x x x x x Aug. 9 x x x x x x Sep.10 x x x x x x Oct.11 x x x x x x Nov.12 x x x x x x Dec.
(単位:t) (Unit:t)
出 荷 Shipments
生産数量 受入数量 販 売 Sales その他 在庫数量(末)
年 月ProductionQuantity
ReceiptQuantity
数 量Quantity
金額(千円)Value
(thousand yen)
OthersQuantity
InventoryQuantity
平成 26 年 1,257,067 112,132 1,239,804 125,271,342 111,940 254,361 C.Y. 201427 1,246,171 112,009 1,244,780 127,805,126 118,381 245,236 201528 1,236,949 109,253 1,221,691 126,121,673 115,381 252,558 201629 1,194,766 99,797 1,196,932 124,870,180 103,843 240,896 201730 1,155,965 103,988 1,135,573 119,575,691 114,649 248,262 2018
平成 28 年度 1,217,057 104,248 1,222,269 126,424,796 108,226 241,038 F.Y. 201629 1,187,894 97,831 1,183,643 123,694,786 104,771 237,192 2017
30 年 1~ 3月 263,733 21,589 263,614 27,866,679 24,595 237,192 Q1 2018 4~ 6 297,768 26,053 292,508 30,961,649 27,207 240,081 Q2 7~ 9 294,940 26,349 285,275 29,643,124 27,836 247,905 Q310~12 299,524 29,997 294,176 31,104,239 35,011 248,262 Q4
30 年 1月 83,103 6,711 83,315 8,858,612 7,858 239,778 Jan. 2018 2 86,690 6,892 84,393 9,016,192 7,823 240,923 Feb. 3 93,940 7,986 95,906 9,991,875 8,914 237,192 Mar. 4 101,979 9,406 96,251 10,265,466 9,367 242,675 Apr. 5 96,138 8,055 95,775 10,095,788 8,366 242,016 May 6 99,651 8,592 100,482 10,600,395 9,474 240,081 Jun.
7 102,654 9,178 101,706 10,515,154 9,248 240,860 Jul. 8 92,070 7,796 91,147 9,546,389 8,278 241,194 Aug. 9 100,216 9,375 92,422 9,581,581 10,310 247,905 Sep.10 102,484 9,927 95,362 10,159,706 10,615 254,463 Oct.11 102,675 11,074 100,107 10,590,185 14,687 253,343 Nov.12 94,365 8,996 98,707 10,354,348 9,709 248,262 Dec.
化学強化ガラス (6)Chemically strengthened glass
Year, Quarter and Month
容器類 (7)~(12)Glass containers
Year, Quarter and Month

50 窯業/生産・出荷・在庫統計
1.生産・出荷・在庫統計 / Production, Shipment and Inventory
(2) 時系列表 / Historical Data by Commodities 1) ガラス・同製品 / Glass and glass products ② ガラス製品・ほうろう鉄器製品(続き) / Glass products and enameled iron products (continued)
(単位:t) (Unit:t)
出 荷 Shipments
生産数量 受入数量 販 売 Sales その他 在庫数量(末)
年 月ProductionQuantity
ReceiptQuantity
数 量Quantity
金額(千円)Value
(thousand yen)
OthersQuantity
InventoryQuantity
平成 26 年 654,944 79,567 648,969 62,899,194 76,853 146,622 C.Y. 201427 662,019 78,756 655,921 64,302,989 84,112 143,263 201528 652,010 74,975 642,987 62,813,216 80,949 144,607 201629 620,622 67,660 620,179 61,442,252 72,453 139,310 201730 598,581 70,298 586,883 58,744,818 76,929 142,053 2018
平成 28 年度 636,247 71,835 639,952 62,801,423 75,589 138,092 F.Y. 201629 614,856 66,037 612,585 60,682,232 72,904 132,351 2017
30 年 1~ 3月 134,550 14,552 138,715 13,796,924 16,970 132,351 Q1 2018 4~ 6 153,553 18,277 146,087 14,877,177 19,203 137,286 Q2 7~ 9 152,995 17,171 145,737 14,360,795 18,844 142,574 Q310~12 157,483 20,298 156,344 15,709,922 21,912 142,053 Q4
30 年 1月 41,883 4,456 45,305 4,532,178 5,623 134,959 Jan. 2018 2 44,848 4,895 42,993 4,301,186 5,470 136,020 Feb. 3 47,819 5,201 50,417 4,963,560 5,877 132,351 Mar. 4 50,480 6,749 49,144 5,032,101 6,666 133,122 Apr. 5 53,734 5,514 47,303 4,788,001 5,771 138,527 May 6 49,339 6,014 49,640 5,057,075 6,766 137,286 Jun.
7 52,287 6,029 51,382 5,054,653 6,400 137,736 Jul. 8 47,346 4,781 46,319 4,617,185 5,245 138,201 Aug. 9 53,362 6,361 48,036 4,688,957 7,199 142,574 Sep.10 49,614 6,706 47,973 4,803,147 7,314 143,587 Oct.11 53,766 7,288 52,612 5,292,342 7,893 144,095 Nov.12 54,103 6,304 55,759 5,614,433 6,705 142,053 Dec.
(単位:t) (Unit:t)
出 荷 Shipments
生産数量 受入数量 販 売 Sales その他 在庫数量(末)
年 月ProductionQuantity
ReceiptQuantity
数 量Quantity
金額(千円)Value
(thousand yen)
OthersQuantity
InventoryQuantity
平成 26 年 375,001 68,883 372,915 40,646,468 62,622 92,804 C.Y. 201427 374,285 65,466 375,568 41,349,067 68,898 85,278 201528 376,704 57,624 369,367 40,190,858 61,751 87,937 201629 362,048 54,090 366,831 40,023,048 56,281 80,177 201730 354,971 55,687 347,315 37,811,662 59,661 83,303 2018
平成 28 年度 370,324 56,871 370,095 40,357,532 58,690 82,053 F.Y. 201629 365,141 52,339 367,514 39,828,474 56,577 74,661 2017
30 年 1~ 3月 86,328 11,552 90,059 9,643,417 13,190 74,661 Q1 2018 4~ 6 83,750 15,013 80,170 8,991,546 15,409 77,693 Q2 7~ 9 88,304 13,289 77,977 8,570,208 14,436 86,710 Q310~12 96,589 15,833 99,109 10,606,491 16,626 83,303 Q4
30 年 1月 28,742 3,682 31,117 3,255,995 4,590 76,861 Jan. 2018 2 28,241 3,733 27,572 3,014,992 4,256 76,971 Feb. 3 29,345 4,137 31,370 3,372,430 4,344 74,661 Mar. 4 29,274 5,836 28,933 3,224,028 5,654 75,128 Apr. 5 29,952 4,475 26,197 2,912,233 4,460 78,842 May 6 24,524 4,702 25,040 2,855,285 5,295 77,693 Jun.
7 31,011 4,995 26,169 2,883,425 5,361 82,133 Jul. 8 25,611 3,824 24,615 2,738,934 4,143 82,756 Aug. 9 31,682 4,470 27,193 2,947,849 4,932 86,710 Sep.10 28,179 4,751 27,666 3,037,979 5,003 86,959 Oct.11 31,548 5,576 33,888 3,629,013 5,883 84,272 Nov.12 36,862 5,506 37,555 3,939,499 5,740 83,303 Dec.
飲料用 (7)~(9)Beverage bottles
Year, Quarter and Month
酒類用びん (7)Alcoholic beverage bottles
Year, Quarter and Month
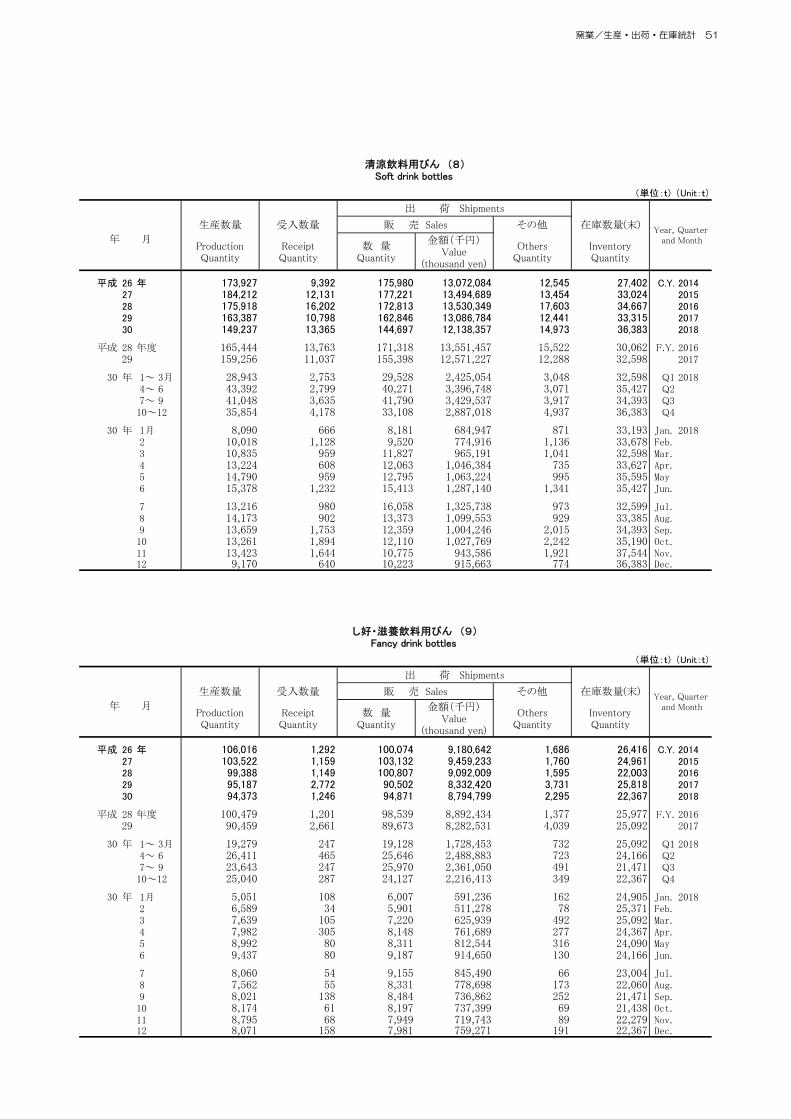
窯業/生産・出荷・在庫統計 51
1.生産・出荷・在庫統計 / Production, Shipment and Inventory
(2) 時系列表 / Historical Data by Commodities 1) ガラス・同製品 / Glass and glass products ② ガラス製品・ほうろう鉄器製品(続き) / Glass products and enameled iron products (continued)
(単位:t) (Unit:t)
出 荷 Shipments
生産数量 受入数量 販 売 Sales その他 在庫数量(末)
年 月ProductionQuantity
ReceiptQuantity
数 量Quantity
金額(千円)Value
(thousand yen)
OthersQuantity
InventoryQuantity
平成 26 年 173,927 9,392 175,980 13,072,084 12,545 27,402 C.Y. 201427 184,212 12,131 177,221 13,494,689 13,454 33,024 201528 175,918 16,202 172,813 13,530,349 17,603 34,667 201629 163,387 10,798 162,846 13,086,784 12,441 33,315 201730 149,237 13,365 144,697 12,138,357 14,973 36,383 2018
平成 28 年度 165,444 13,763 171,318 13,551,457 15,522 30,062 F.Y. 201629 159,256 11,037 155,398 12,571,227 12,288 32,598 2017
30 年 1~ 3月 28,943 2,753 29,528 2,425,054 3,048 32,598 Q1 2018 4~ 6 43,392 2,799 40,271 3,396,748 3,071 35,427 Q2 7~ 9 41,048 3,635 41,790 3,429,537 3,917 34,393 Q310~12 35,854 4,178 33,108 2,887,018 4,937 36,383 Q4
30 年 1月 8,090 666 8,181 684,947 871 33,193 Jan. 2018 2 10,018 1,128 9,520 774,916 1,136 33,678 Feb. 3 10,835 959 11,827 965,191 1,041 32,598 Mar. 4 13,224 608 12,063 1,046,384 735 33,627 Apr. 5 14,790 959 12,795 1,063,224 995 35,595 May 6 15,378 1,232 15,413 1,287,140 1,341 35,427 Jun.
7 13,216 980 16,058 1,325,738 973 32,599 Jul. 8 14,173 902 13,373 1,099,553 929 33,385 Aug. 9 13,659 1,753 12,359 1,004,246 2,015 34,393 Sep.10 13,261 1,894 12,110 1,027,769 2,242 35,190 Oct.11 13,423 1,644 10,775 943,586 1,921 37,544 Nov.12 9,170 640 10,223 915,663 774 36,383 Dec.
(単位:t) (Unit:t)
出 荷 Shipments
生産数量 受入数量 販 売 Sales その他 在庫数量(末)
年 月ProductionQuantity
ReceiptQuantity
数 量Quantity
金額(千円)Value
(thousand yen)
OthersQuantity
InventoryQuantity
平成 26 年 106,016 1,292 100,074 9,180,642 1,686 26,416 C.Y. 201427 103,522 1,159 103,132 9,459,233 1,760 24,961 201528 99,388 1,149 100,807 9,092,009 1,595 22,003 201629 95,187 2,772 90,502 8,332,420 3,731 25,818 201730 94,373 1,246 94,871 8,794,799 2,295 22,367 2018
平成 28 年度 100,479 1,201 98,539 8,892,434 1,377 25,977 F.Y. 201629 90,459 2,661 89,673 8,282,531 4,039 25,092 2017
30 年 1~ 3月 19,279 247 19,128 1,728,453 732 25,092 Q1 2018 4~ 6 26,411 465 25,646 2,488,883 723 24,166 Q2 7~ 9 23,643 247 25,970 2,361,050 491 21,471 Q310~12 25,040 287 24,127 2,216,413 349 22,367 Q4
30 年 1月 5,051 108 6,007 591,236 162 24,905 Jan. 2018 2 6,589 34 5,901 511,278 78 25,371 Feb. 3 7,639 105 7,220 625,939 492 25,092 Mar. 4 7,982 305 8,148 761,689 277 24,367 Apr. 5 8,992 80 8,311 812,544 316 24,090 May 6 9,437 80 9,187 914,650 130 24,166 Jun.
7 8,060 54 9,155 845,490 66 23,004 Jul. 8 7,562 55 8,331 778,698 173 22,060 Aug. 9 8,021 138 8,484 736,862 252 21,471 Sep.10 8,174 61 8,197 737,399 69 21,438 Oct.11 8,795 68 7,949 719,743 89 22,279 Nov.12 8,071 158 7,981 759,271 191 22,367 Dec.
清涼飲料用びん (8)Soft drink bottles
Year, Quarter and Month
し好・滋養飲料用びん (9)Fancy drink bottles
Year, Quarter and Month

52 窯業/生産・出荷・在庫統計
1.生産・出荷・在庫統計 / Production, Shipment and Inventory
(2) 時系列表 / Historical Data by Commodities 1) ガラス・同製品 / Glass and glass products ② ガラス製品・ほうろう鉄器製品(続き) / Glass products and enameled iron products (continued)
(単位:t) (Unit:t)
出 荷 Shipments
生産数量 受入数量 販 売 Sales その他 在庫数量(末)
年 月ProductionQuantity
ReceiptQuantity
数 量Quantity
金額(千円)Value
(thousand yen)
OthersQuantity
InventoryQuantity
平成 26 年 329,157 22,243 322,289 31,016,992 25,698 59,915 C.Y. 201427 325,863 25,203 328,211 32,165,522 27,479 55,146 201528 326,081 24,529 322,027 31,472,561 23,905 59,665 201629 313,300 22,940 313,140 30,581,780 24,123 58,147 201730 286,232 24,468 289,763 28,726,231 25,855 53,211 2018
平成 28 年度 322,052 23,468 321,702 31,425,210 23,041 59,009 F.Y. 201629 309,811 23,754 310,150 30,307,823 25,124 57,185 2017
30 年 1~ 3月 68,475 5,506 68,841 6,718,388 6,065 57,185 Q1 2018 4~ 6 74,939 6,004 75,361 7,543,123 6,295 56,418 Q2 7~ 9 72,454 5,883 69,605 6,959,157 5,980 59,169 Q310~12 70,364 7,075 75,956 7,505,563 7,515 53,211 Q4
30 年 1月 22,707 1,808 21,836 2,140,277 1,782 59,004 Jan. 2018 2 22,961 1,542 22,777 2,206,548 1,873 58,868 Feb. 3 22,807 2,156 24,228 2,371,563 2,410 57,185 Mar. 4 26,530 2,130 24,852 2,517,079 2,138 58,812 Apr. 5 21,217 1,978 24,656 2,448,806 2,040 55,308 May 6 27,192 1,896 25,853 2,577,238 2,117 56,418 Jun.
7 23,724 2,231 24,825 2,464,042 2,317 55,236 Jul. 8 24,049 1,749 22,304 2,234,261 1,749 56,987 Aug. 9 24,681 1,903 22,476 2,260,854 1,914 59,169 Sep.10 26,645 2,124 25,559 2,567,528 2,206 60,266 Oct.11 23,762 2,754 26,306 2,565,089 2,863 57,607 Nov.12 19,957 2,197 24,091 2,372,946 2,446 53,211 Dec.
(単位:t) (Unit:t)
出 荷 Shipments
生産数量 受入数量 販 売 Sales その他 在庫数量(末)
年 月ProductionQuantity
ReceiptQuantity
数 量Quantity
金額(千円)Value
(thousand yen)
OthersQuantity
InventoryQuantity
平成 26 年 18,195 194 18,472 8,004,386 44 6,041 C.Y. 201427 19,559 195 18,612 8,079,774 51 7,114 201528 19,773 263 19,463 8,678,323 79 7,490 201629 20,283 292 19,535 9,273,265 88 3,945 201730 23,673 234 22,049 9,655,423 79 5,682 2018
平成 28 年度 19,826 247 19,193 8,736,275 104 3,371 F.Y. 201629 20,823 275 19,875 9,354,097 58 4,118 2017
30 年 1~ 3月 5,419 59 4,865 2,264,250 13 4,118 Q1 2018 4~ 6 5,950 60 5,650 2,464,101 51 4,835 Q2 7~ 9 6,174 56 5,817 2,433,706 5 5,249 Q310~12 6,130 59 5,717 2,493,366 10 5,682 Q4
30 年 1月 1,438 27 1,441 670,413 5 3,970 Jan. 2018 2 1,863 22 1,781 855,482 5 4,057 Feb. 3 2,118 10 1,643 738,355 3 4,118 Mar. 4 2,052 17 1,772 757,760 46 4,775 Apr. 5 1,833 12 1,829 882,238 - 4,791 May 6 2,065 31 2,049 824,103 5 4,835 Jun.
7 2,006 21 1,921 847,679 3 4,945 Jul. 8 2,050 29 2,006 814,715 1 5,020 Aug. 9 2,118 6 1,890 771,312 1 5,249 Sep.10 2,161 37 1,880 865,412 2 5,594 Oct.11 2,011 9 2,045 865,465 6 5,533 Nov.12 1,958 13 1,792 762,489 2 5,682 Dec.
食料用・調味料用容器 (10)Food or seasoning containers
Year, Quarter and Month
Year, Quarter and Month
化粧品用容器 (11)Cosmetic containers

窯業/生産・出荷・在庫統計 53
1.生産・出荷・在庫統計 / Production, Shipment and Inventory
(2) 時系列表 / Historical Data by Commodities 1) ガラス・同製品 / Glass and glass products ② ガラス製品・ほうろう鉄器製品(続き) / Glass products and enameled iron products (continued)
(単位:t) (Unit:t)
出 荷 Shipments
生産数量 受入数量 販 売 Sales その他 在庫数量(末)
年 月ProductionQuantity
ReceiptQuantity
数 量Quantity
金額(千円)Value
(thousand yen)
OthersQuantity
InventoryQuantity
平成 26 年 254,771 10,128 250,074 23,350,770 9,345 41,783 C.Y. 201427 238,730 7,855 242,036 23,256,841 6,739 39,713 201528 239,085 9,486 237,214 23,157,573 10,448 40,796 201629 240,561 8,905 244,078 23,572,883 7,179 39,494 201730 247,479 8,988 236,878 22,449,219 11,786 47,316 2018
平成 28 年度 238,932 8,698 241,422 23,461,888 9,492 40,566 F.Y. 201629 242,404 7,765 241,033 23,350,634 6,685 43,538 2017
30 年 1~ 3月 55,289 1,472 51,193 5,087,117 1,547 43,538 Q1 2018 4~ 6 63,326 1,712 65,410 6,077,248 1,658 41,542 Q2 7~ 9 63,317 3,239 64,116 5,889,466 3,007 40,913 Q310~12 65,547 2,565 56,159 5,395,388 5,574 47,316 Q4
30 年 1月 17,075 420 14,733 1,515,744 448 41,845 Jan. 2018 2 17,018 433 16,842 1,652,976 475 41,978 Feb. 3 21,196 619 19,618 1,918,397 624 43,538 Mar. 4 22,917 510 20,483 1,958,526 517 45,966 Apr. 5 19,354 551 21,987 1,976,743 555 43,390 May 6 21,055 651 22,940 2,141,979 586 41,542 Jun.
7 24,637 897 23,578 2,148,780 528 42,943 Jul. 8 18,625 1,237 20,518 1,880,228 1,283 40,986 Aug. 9 20,055 1,105 20,020 1,860,458 1,196 40,913 Sep.10 24,064 1,060 19,950 1,923,619 1,093 45,016 Oct.11 23,136 1,023 19,144 1,867,289 3,925 46,108 Nov.12 18,347 482 17,065 1,604,480 556 47,316 Dec.
(単位:t) (Unit:t)
出 荷 Shipments
生産数量 受入数量 販 売 Sales その他 在庫数量(末)
年 月ProductionQuantity
ReceiptQuantity
数 量Quantity
金額(千円)Value
(thousand yen)
OthersQuantity
InventoryQuantity
平成 26 年 35,042 3 35,163 20,699,910 285 18,927 C.Y. 201427 34,937 8 35,573 21,776,021 405 17,559 201528 32,494 1 32,226 20,809,975 298 17,439 201629 33,684 2 33,702 21,558,710 304 17,081 201730 32,906 - 32,591 21,068,440 374 16,699 2018
平成 28 年度 33,530 1 33,048 20,945,601 307 18,303 F.Y. 201629 32,801 2 32,633 21,398,449 308 17,826 2017
30 年 1~ 3月 7,977 - 6,858 4,864,300 69 17,826 Q1 2018 4~ 6 9,018 - 9,120 5,926,628 93 17,626 Q2 7~ 9 8,030 - 8,294 5,150,652 103 17,254 Q310~12 7,881 - 8,319 5,126,860 109 16,699 Q4
30 年 1月 2,096 - 1,829 1,326,971 22 17,024 Jan. 2018 2 2,772 - 2,030 1,494,139 20 17,748 Feb. 3 3,109 - 2,999 2,043,190 27 17,826 Mar. 4 2,753 - 3,039 2,017,171 25 17,515 Apr. 5 2,975 - 2,918 1,974,901 30 17,538 May 6 3,290 - 3,163 1,934,556 38 17,626 Jun.
7 3,020 - 3,293 1,945,735 43 17,311 Jul. 8 2,650 - 2,591 1,561,126 29 17,337 Aug. 9 2,360 - 2,410 1,643,791 31 17,254 Sep.10 2,491 - 2,274 1,499,204 28 17,442 Oct.11 2,753 - 3,058 1,828,591 45 17,088 Nov.12 2,637 - 2,987 1,799,065 36 16,699 Dec.
薬びん (12)Medicine bottles
Year, Quarter and Month
Year, Quarter and Month
台所・食卓用品 (13)~(14)Tablewares and kitchenwares
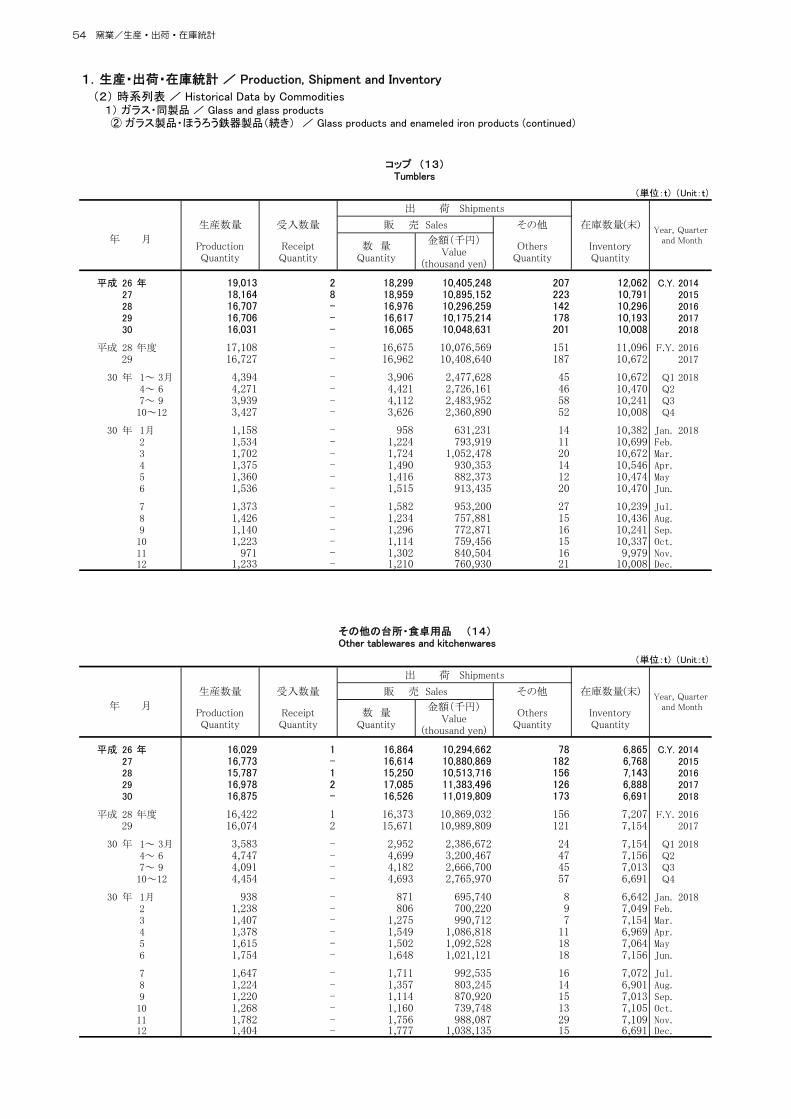
54 窯業/生産・出荷・在庫統計
1.生産・出荷・在庫統計 / Production, Shipment and Inventory
(2) 時系列表 / Historical Data by Commodities 1) ガラス・同製品 / Glass and glass products ② ガラス製品・ほうろう鉄器製品(続き) / Glass products and enameled iron products (continued)
(単位:t) (Unit:t)
出 荷 Shipments
生産数量 受入数量 販 売 Sales その他 在庫数量(末)
年 月ProductionQuantity
ReceiptQuantity
数 量Quantity
金額(千円)Value
(thousand yen)
OthersQuantity
InventoryQuantity
平成 26 年 19,013 2 18,299 10,405,248 207 12,062 C.Y. 201427 18,164 8 18,959 10,895,152 223 10,791 201528 16,707 - 16,976 10,296,259 142 10,296 201629 16,706 - 16,617 10,175,214 178 10,193 201730 16,031 - 16,065 10,048,631 201 10,008 2018
平成 28 年度 17,108 - 16,675 10,076,569 151 11,096 F.Y. 201629 16,727 - 16,962 10,408,640 187 10,672 2017
30 年 1~ 3月 4,394 - 3,906 2,477,628 45 10,672 Q1 2018 4~ 6 4,271 - 4,421 2,726,161 46 10,470 Q2 7~ 9 3,939 - 4,112 2,483,952 58 10,241 Q310~12 3,427 - 3,626 2,360,890 52 10,008 Q4
30 年 1月 1,158 - 958 631,231 14 10,382 Jan. 2018 2 1,534 - 1,224 793,919 11 10,699 Feb. 3 1,702 - 1,724 1,052,478 20 10,672 Mar. 4 1,375 - 1,490 930,353 14 10,546 Apr. 5 1,360 - 1,416 882,373 12 10,474 May 6 1,536 - 1,515 913,435 20 10,470 Jun.
7 1,373 - 1,582 953,200 27 10,239 Jul. 8 1,426 - 1,234 757,881 15 10,436 Aug. 9 1,140 - 1,296 772,871 16 10,241 Sep.10 1,223 - 1,114 759,456 15 10,337 Oct.11 971 - 1,302 840,504 16 9,979 Nov.12 1,233 - 1,210 760,930 21 10,008 Dec.
(単位:t) (Unit:t)
出 荷 Shipments
生産数量 受入数量 販 売 Sales その他 在庫数量(末)
年 月ProductionQuantity
ReceiptQuantity
数 量Quantity
金額(千円)Value
(thousand yen)
OthersQuantity
InventoryQuantity
平成 26 年 16,029 1 16,864 10,294,662 78 6,865 C.Y. 201427 16,773 - 16,614 10,880,869 182 6,768 201528 15,787 1 15,250 10,513,716 156 7,143 201629 16,978 2 17,085 11,383,496 126 6,888 201730 16,875 - 16,526 11,019,809 173 6,691 2018
平成 28 年度 16,422 1 16,373 10,869,032 156 7,207 F.Y. 201629 16,074 2 15,671 10,989,809 121 7,154 2017
30 年 1~ 3月 3,583 - 2,952 2,386,672 24 7,154 Q1 2018 4~ 6 4,747 - 4,699 3,200,467 47 7,156 Q2 7~ 9 4,091 - 4,182 2,666,700 45 7,013 Q310~12 4,454 - 4,693 2,765,970 57 6,691 Q4
30 年 1月 938 - 871 695,740 8 6,642 Jan. 2018 2 1,238 - 806 700,220 9 7,049 Feb. 3 1,407 - 1,275 990,712 7 7,154 Mar. 4 1,378 - 1,549 1,086,818 11 6,969 Apr. 5 1,615 - 1,502 1,092,528 18 7,064 May 6 1,754 - 1,648 1,021,121 18 7,156 Jun.
7 1,647 - 1,711 992,535 16 7,072 Jul. 8 1,224 - 1,357 803,245 14 6,901 Aug. 9 1,220 - 1,114 870,920 15 7,013 Sep.10 1,268 - 1,160 739,748 13 7,105 Oct.11 1,782 - 1,756 988,087 29 7,109 Nov.12 1,404 - 1,777 1,038,135 15 6,691 Dec.
コップ (13)Tumblers
Year, Quarter and Month
Year, Quarter and Month
その他の台所・食卓用品 (14) Other tablewares and kitchenwares

窯業/生産・出荷・在庫統計 55
1.生産・出荷・在庫統計 / Production, Shipment and Inventory
(2) 時系列表 / Historical Data by Commodities 1) ガラス・同製品 / Glass and glass products ② ガラス製品・ほうろう鉄器製品(続き) / Glass products and enameled iron products (continued)
(単位:t) (Unit:t)
出 荷 Shipments
生産数量 受入数量 販 売 Sales その他 在庫数量(末)
年 月ProductionQuantity
ReceiptQuantity
数 量Quantity
金額(千円)Value
(thousand yen)
OthersQuantity
InventoryQuantity
平成 26 年 92,955 20,548 82,130 39,808,539 34,805 18,228 C.Y. 201427 87,161 19,099 74,839 40,343,948 32,164 17,328 201528 87,035 14,533 74,816 40,795,608 23,550 20,577 201629 74,199 18,968 68,794 42,871,308 31,501 13,406 201730 75,848 21,165 61,401 41,342,963 33,446 14,014 2018
平成 28 年度 86,421 15,215 72,882 41,276,975 25,056 18,652 F.Y. 201629 74,191 18,357 67,297 42,315,009 30,573 13,327 2017
30 年 1~ 3月 18,496 3,336 16,043 10,333,598 5,849 13,327 Q1 2018 4~ 6 19,856 6,016 15,915 10,403,748 9,432 12,342 Q2 7~ 9 19,752 5,694 15,825 10,399,346 9,086 12,878 Q310~12 17,744 6,119 13,618 10,206,271 9,079 14,014 Q4
30 年 1月 5,394 970 5,113 3,346,429 1,617 13,040 Jan. 2018 2 5,919 811 5,002 3,292,612 1,542 13,225 Feb. 3 7,183 1,555 5,928 3,694,557 2,690 13,327 Mar. 4 6,538 2,313 4,969 3,483,304 3,638 13,395 Apr. 5 6,325 1,923 5,297 3,411,755 3,100 11,886 May 6 6,993 1,780 5,649 3,508,689 2,694 12,342 Jun.
7 6,889 2,159 5,284 3,507,544 3,305 12,798 Jul. 8 6,333 1,734 5,388 3,476,648 2,861 12,624 Aug. 9 6,530 1,801 5,153 3,415,154 2,920 12,878 Sep.10 7,139 1,766 5,008 3,297,697 2,850 13,920 Oct.11 5,583 2,343 3,831 3,394,324 3,219 14,790 Nov.12 5,022 2,010 4,779 3,514,250 3,010 14,014 Dec.
(単位:t) (Unit:t)
出 荷 Shipments
生産数量 受入数量 販 売 Sales その他 在庫数量(末)
年 月ProductionQuantity
ReceiptQuantity
数 量Quantity
金額(千円)Value
(thousand yen)
OthersQuantity
InventoryQuantity
平成 26 年 41,479 14 17,565 13,309,049 23,548 888 C.Y. 201427 40,473 30 16,908 13,879,904 23,324 911 201528 39,423 128 16,137 13,192,470 23,400 777 201629 38,688 18 15,108 13,307,929 23,461 829 201730 36,276 10 14,418 13,380,049 21,813 791 2018
平成 28 年度 38,675 128 15,712 12,956,485 23,115 834 F.Y. 201629 37,529 4 14,555 12,995,570 22,847 880 2017
30 年 1~ 3月 7,842 - 3,267 3,054,737 4,496 880 Q1 2018 4~ 6 9,315 4 3,408 2,969,187 5,874 908 Q2 7~ 9 9,017 2 3,751 3,579,961 5,328 832 Q310~12 10,102 4 3,992 3,776,164 6,115 791 Q4
30 年 1月 2,427 - 1,002 952,683 1,409 830 Jan. 2018 2 2,570 - 1,031 935,430 1,481 880 Feb. 3 2,845 - 1,234 1,166,624 1,606 880 Mar. 4 3,039 1 1,133 995,486 1,902 881 Apr. 5 3,069 3 1,089 969,610 1,975 887 May 6 3,207 - 1,186 1,004,091 1,997 908 Jun.
7 3,131 1 1,146 1,000,561 1,982 917 Jul. 8 3,036 - 1,356 1,267,397 1,727 859 Aug. 9 2,850 1 1,249 1,312,003 1,619 832 Sep.10 3,620 - 1,333 1,307,763 2,261 850 Oct.11 3,606 4 1,382 1,316,614 2,223 845 Nov.12 2,876 - 1,277 1,151,787 1,631 791 Dec.
Year, Quarter and Month
その他のガラス製品 (15)Other glass products
Year, Quarter and Month
ほうろう鉄器製品 (16)Enameled iron products

56 窯業/生産・出荷・在庫統計
1.生産・出荷・在庫統計 / Production, Shipment and Inventory
(2) 時系列表 / Historical Data by Commodities 2) セメント・セメント製品 / Cement and cement products
(単位(Unit): t )
出 荷 Shipments
生産数量 受入数量 消費数量 販 売 Sales その他 在庫数量(末)
年 月ProductionQuantity
ReceiptQuantity
ConsumptionQuantity
数 量Quantity
金額(千円)Value
(thousand yen)
OthersQuantity
InventoryQuantity
平成 26 年 57,912,568 1,794,231 1,558,868 57,017,925 401,614,520 981,020 1,307,170 C.Y. 201427 54,826,884 1,703,773 1,526,893 53,964,176 383,857,559 1,037,808 1,304,010 201528 53,255,453 1,728,733 1,627,307 52,384,064 368,112,441 1,027,056 1,209,911 201629 55,195,379 1,745,298 1,793,189 54,022,400 375,061,482 1,120,764 1,142,815 201730 55,307,402 1,606,136 1,702,237 54,100,793 377,177,926 966,752 1,217,711 2018
平成 28 年度 53,599,526 1,771,807 1,691,632 52,643,263 368,797,991 1,068,342 1,199,547 F.Y. 201629 54,943,218 1,655,160 1,763,032 53,628,736 371,352,205 1,054,860 1,290,908 2017
30 年 1~ 3月 13,116,434 377,277 414,885 12,687,001 88,288,948 236,264 1,290,908 Q1 2018 4~ 6 13,376,684 433,464 445,391 13,225,849 91,055,027 284,188 1,124,867 Q2 7~ 9 13,901,517 359,342 418,324 13,435,683 94,876,197 223,910 1,293,356 Q310~12 14,912,767 436,053 423,637 14,752,260 102,957,754 222,390 1,217,711 Q4
30 年 1月 4,146,640 120,451 111,504 4,013,996 27,993,634 76,675 1,202,278 Jan. 2018 2 4,108,920 122,120 140,255 4,012,790 28,053,676 72,502 1,202,236 Feb. 3 4,860,874 134,706 163,126 4,660,215 32,241,638 87,087 1,290,908 Mar. 4 4,411,762 143,254 134,469 4,411,905 29,994,626 97,243 1,193,298 Apr. 5 4,387,920 131,192 140,875 4,415,066 30,368,617 99,534 1,050,387 May 6 4,577,002 159,018 170,047 4,398,878 30,691,784 87,411 1,124,867 Jun.
7 4,771,000 122,394 170,113 4,517,944 32,397,913 77,186 1,249,920 Jul. 8 4,449,376 102,736 120,267 4,424,516 31,015,906 67,887 1,185,688 Aug. 9 4,681,141 134,212 127,944 4,493,223 31,462,378 78,837 1,293,356 Sep.10 4,939,330 106,492 145,295 4,978,722 34,685,243 47,968 1,157,779 Oct.11 4,915,106 164,367 155,639 4,900,690 34,399,125 98,376 1,073,306 Nov.12 5,058,331 165,194 122,703 4,872,848 33,873,386 76,046 1,217,711 Dec.
(単位(Unit): t )
出 荷 Shipments
生産数量 受入数量 消費数量 販 売 Sales その他 在庫数量(末)
年 月ProductionQuantity
ReceiptQuantity
ConsumptionQuantity
数 量Quantity
金額(千円)Value
(thousand yen)
OthersQuantity
InventoryQuantity
平成 26 年 44,087,782 1,669,995 788,898 43,893,432 310,479,787 960,125 1,073,695 C.Y. 201427 42,200,124 1,592,360 711,427 42,048,494 300,877,690 1,014,041 1,066,228 201528 40,689,885 1,603,421 755,638 40,567,491 286,688,059 991,112 995,376 201629 42,538,095 1,657,882 868,448 42,264,217 294,807,934 1,063,004 920,218 201730 42,159,508 1,520,676 828,419 41,828,358 294,552,356 877,207 988,093 2018
平成 28 年度 41,014,438 1,649,741 793,874 40,848,177 287,807,814 1,025,756 989,370 F.Y. 201629 42,519,520 1,568,843 859,680 42,104,690 292,871,455 986,258 1,061,419 2017
30 年 1~ 3月 10,175,054 354,262 206,988 9,957,722 70,039,811 213,006 1,061,419 Q1 2018 4~ 6 10,114,051 422,716 215,619 10,174,383 70,916,445 269,029 916,569 Q2 7~ 9 10,583,550 335,972 206,597 10,347,880 73,463,355 194,966 1,069,966 Q310~12 11,286,853 407,726 199,215 11,348,373 80,132,745 200,206 988,093 Q4
30 年 1月 3,248,453 108,805 53,428 3,173,282 22,362,502 68,708 976,345 Jan. 2018 2 3,156,234 113,347 73,037 3,104,613 21,963,095 61,148 1,001,534 Feb. 3 3,770,367 132,110 80,523 3,679,827 25,714,214 83,150 1,061,419 Mar. 4 3,347,038 137,970 69,303 3,395,018 23,441,079 91,695 981,009 Apr. 5 3,330,840 128,812 64,678 3,441,493 23,876,642 93,894 833,689 May 6 3,436,173 155,934 81,638 3,337,872 23,598,724 83,440 916,569 Jun.
7 3,610,065 118,945 81,660 3,449,191 24,931,812 71,725 1,039,098 Jul. 8 3,387,148 89,103 58,214 3,422,605 23,966,078 52,059 977,714 Aug. 9 3,586,337 127,924 66,723 3,476,084 24,565,465 71,182 1,069,966 Sep.10 3,696,445 101,497 78,377 3,786,795 26,558,819 41,416 951,412 Oct.11 3,697,621 153,807 70,000 3,770,224 26,906,877 90,361 862,363 Nov.12 3,892,787 152,422 50,838 3,791,354 26,667,049 68,429 988,093 Dec.
セメント (1)~(4)Cement
ポルトランドセメント (1)~(2)Portland cement
Year, Quarter and Month
Year, Quarter and Month

窯業/生産・出荷・在庫統計 57
Ⅰ.製品・出荷・在庫統計 / Production, Shipment and Inventory
2.時系列表 / Historical Data by Commodities (2) セメント・同製品 / Cement and cement products ① セメント(続き) / Cement (continued)
(単位(Unit): t )
出 荷 Shipments
生産数量 受入数量 消費数量 販 売 Sales その他 在庫数量(末)
年 月ProductionQuantity
ReceiptQuantity
ConsumptionQuantity
数 量Quantity
金額(千円)Value
(thousand yen)
OthersQuantity
InventoryQuantity
平成 26 年 4,066,227 12,061 … 3,888,602 33,186,910 45,592 162,467 C.Y. 201427 3,761,572 14,098 … 3,652,554 31,371,022 26,489 138,865 201528 3,684,915 22,889 … 3,509,048 29,749,348 46,109 147,408 201629 4,060,887 26,124 … 3,828,667 32,667,174 50,186 164,406 201730 4,159,147 12,865 … 3,945,625 34,104,917 45,795 162,141 2018
平成 28 年度 3,710,299 19,358 … 3,517,612 29,694,893 42,872 157,278 F.Y. 201629 4,105,633 26,820 … 3,897,460 33,257,097 52,787 161,565 2017
30 年 1~ 3月 1,234,831 3,066 … 1,183,591 10,206,705 13,051 161,565 Q1 2018 4~ 6 845,090 1,356 … 809,883 6,906,441 10,956 144,947 Q2 7~ 9 914,987 4,361 … 860,778 7,540,765 10,795 158,754 Q310~12 1,164,239 4,082 … 1,091,373 9,451,006 10,993 162,141 Q4
30 年 1月 357,692 1,954 … 374,280 3,156,534 5,062 131,180 Jan. 2018 2 454,842 1,112 … 422,682 3,687,093 4,303 150,364 Feb. 3 422,297 - … 386,629 3,363,078 3,686 161,565 Mar. 4 285,836 - … 281,325 2,303,752 3,175 147,895 Apr. 5 297,316 - … 277,297 2,399,171 5,346 150,443 May 6 261,938 1,356 … 251,261 2,203,518 2,435 144,947 Jun.
7 314,765 1,770 … 293,873 2,589,693 4,628 152,625 Jul. 8 284,250 352 … 269,411 2,392,539 2,929 151,479 Aug. 9 315,972 2,239 … 297,494 2,558,533 3,238 158,754 Sep.10 350,985 1,749 … 341,207 2,904,575 4,063 152,372 Oct.11 386,165 1,510 … 359,873 3,147,694 4,221 146,837 Nov.12 427,089 823 … 390,293 3,398,737 2,709 162,141 Dec.
(単位(Unit): t )
出 荷 Shipments
生産数量 受入数量 消費数量 販 売 Sales その他 在庫数量(末)
年 月ProductionQuantity
ReceiptQuantity
ConsumptionQuantity
数 量Quantity
金額(千円)Value
(thousand yen)
OthersQuantity
InventoryQuantity
平成 26 年 40,021,555 1,657,934 788,898 40,004,830 277,292,877 914,533 911,228 C.Y. 201427 38,438,552 1,578,262 711,427 38,395,940 269,506,668 987,552 927,363 201528 37,004,970 1,580,532 755,638 37,058,443 256,938,711 945,003 847,968 201629 38,477,208 1,631,758 868,448 38,435,550 262,140,760 1,012,818 755,812 201730 38,000,361 1,507,811 828,419 37,882,733 260,447,439 831,412 825,952 2018
平成 28 年度 37,304,139 1,630,383 793,874 37,330,565 258,112,921 982,884 832,092 F.Y. 201629 38,413,887 1,542,023 859,680 38,207,230 259,614,358 933,471 899,854 2017
30 年 1~ 3月 8,940,223 351,196 206,988 8,774,131 59,833,106 199,955 899,854 Q1 2018 4~ 6 9,268,961 421,360 215,619 9,364,500 64,010,004 258,073 771,622 Q2 7~ 9 9,668,563 331,611 206,597 9,487,102 65,922,590 184,171 911,212 Q310~12 10,122,614 403,644 199,215 10,257,000 70,681,739 189,213 825,952 Q4
30 年 1月 2,890,761 106,851 53,428 2,799,002 19,205,968 63,646 845,165 Jan. 2018 2 2,701,392 112,235 73,037 2,681,931 18,276,002 56,845 851,170 Feb. 3 3,348,070 132,110 80,523 3,293,198 22,351,136 79,464 899,854 Mar. 4 3,061,202 137,970 69,303 3,113,693 21,137,327 88,520 833,114 Apr. 5 3,033,524 128,812 64,678 3,164,196 21,477,471 88,548 683,246 May 6 3,174,235 154,578 81,638 3,086,611 21,395,206 81,005 771,622 Jun.
7 3,295,300 117,175 81,660 3,155,318 22,342,119 67,097 886,473 Jul. 8 3,102,898 88,751 58,214 3,153,194 21,573,539 49,130 826,235 Aug. 9 3,270,365 125,685 66,723 3,178,590 22,006,932 67,944 911,212 Sep.10 3,345,460 99,748 78,377 3,445,588 23,654,244 37,353 799,040 Oct.11 3,311,456 152,297 70,000 3,410,351 23,759,183 86,140 715,526 Nov.12 3,465,698 151,599 50,838 3,401,061 23,268,312 65,720 825,952 Dec.
ポルトランドセメント (早強・中庸熱) (1)High early strength and moderate heat portland cement
ポルトランドセメント (普通) (2)Ordinary portland cement
Year, Quarter and Month
Year, Quarter and Month

58 窯業/生産・出荷・在庫統計
1.生産・出荷・在庫統計 / Production, Shipment and Inventory
(2) 時系列表 / Historical Data by Commodities 2) セメント・セメント製品(続き) / Cement and cement products (continued)
(単位(Unit): t )
出 荷 Shipments
生産数量 受入数量 消費数量 販 売 Sales その他 在庫数量(末)
年 月ProductionQuantity
ReceiptQuantity
ConsumptionQuantity
数 量Quantity
金額(千円)Value
(thousand yen)
OthersQuantity
InventoryQuantity
平成 26 年 12,410,243 3,940 769,970 11,587,535 79,488,894 19,742 200,336 C.Y. 201427 11,162,070 61 815,466 10,356,743 71,084,912 19,770 191,572 201528 10,906,777 65 871,669 10,026,185 67,422,280 29,608 182,691 201629 10,875,225 10,498 924,741 9,926,036 66,766,327 44,990 179,235 201730 11,253,323 28,803 873,818 10,348,655 69,883,178 69,059 182,096 2018
平成 28 年度 10,930,036 78 897,758 10,030,962 67,250,806 36,745 169,576 F.Y. 201629 10,611,748 23,178 903,352 9,675,992 65,087,629 54,434 178,660 2017
30 年 1~ 3月 2,515,731 12,758 207,897 2,305,014 15,289,221 20,471 178,660 Q1 2018 4~ 6 2,742,299 2,242 229,772 2,531,753 16,901,398 12,363 151,131 Q2 7~ 9 2,870,588 13,083 211,727 2,633,755 18,327,943 20,662 171,231 Q310~12 3,124,705 720 224,422 2,878,133 19,364,616 15,563 182,096 Q4
30 年 1月 767,688 5,495 58,076 699,980 4,547,702 7,655 187,049 Jan. 2018 2 816,646 7,122 67,218 770,817 5,112,392 9,437 164,497 Feb. 3 931,397 141 82,603 834,217 5,629,127 3,379 178,660 Mar. 4 882,616 1,742 65,166 829,973 5,377,763 3,883 164,389 Apr. 5 895,528 500 76,197 815,786 5,485,267 4,778 164,015 May 6 964,155 - 88,409 885,994 6,038,368 3,702 151,131 Jun.
7 1,003,369 414 88,453 899,617 6,257,452 3,198 164,541 Jul. 8 910,027 10,033 62,053 850,077 6,020,571 12,577 160,957 Aug. 9 957,192 2,636 61,221 884,061 6,049,920 4,887 171,231 Sep.10 1,054,592 390 66,918 997,498 6,814,408 5,342 157,024 Oct.11 1,046,049 272 85,639 950,325 6,315,227 5,678 162,444 Nov.12 1,024,064 58 71,865 930,310 6,234,981 4,543 182,096 Dec.
(単位(Unit): t )
出 荷 Shipments
生産数量 受入数量 消費数量 販 売 Sales その他 在庫数量(末)
年 月ProductionQuantity
ReceiptQuantity
ConsumptionQuantity
数 量Quantity
金額(千円)Value
(thousand yen)
OthersQuantity
InventoryQuantity
平成 26 年 1,414,543 120,296 … 1,536,958 11,645,839 1,153 33,139 C.Y. 201427 1,464,690 111,352 … 1,558,939 11,894,957 3,997 46,210 201528 1,658,791 125,247 … 1,790,388 14,002,102 6,336 31,844 201629 1,782,059 76,918 … 1,832,147 13,487,221 12,770 43,362 201730 1,894,571 56,657 … 1,923,780 12,742,392 20,486 47,522 2018
平成 28 年度 1,655,052 121,988 … 1,764,124 13,739,371 5,841 40,601 F.Y. 201629 1,811,950 63,139 … 1,848,054 13,393,121 14,168 50,829 2017
30 年 1~ 3月 425,649 10,257 … 424,265 2,959,916 2,787 50,829 Q1 2018 4~ 6 520,334 8,506 … 519,713 3,237,184 2,796 57,167 Q2 7~ 9 447,379 10,287 … 454,048 3,084,899 8,282 52,159 Q310~12 501,209 27,607 … 525,754 3,460,393 6,621 47,522 Q4
30 年 1月 130,499 6,151 … 140,734 1,083,430 312 38,884 Jan. 2018 2 136,040 1,651 … 137,360 978,189 1,917 36,205 Feb. 3 159,110 2,455 … 146,171 898,297 558 50,829 Mar. 4 182,108 3,542 … 186,914 1,175,784 1,665 47,900 Apr. 5 161,552 1,880 … 157,787 1,006,708 862 52,683 May 6 176,674 3,084 … 175,012 1,054,692 269 57,167 Jun.
7 157,566 3,035 … 169,136 1,208,649 2,263 46,281 Jul. 8 152,201 3,600 … 151,834 1,029,257 3,251 47,017 Aug. 9 137,612 3,652 … 133,078 846,993 2,768 52,159 Sep.10 188,293 4,605 … 194,429 1,312,016 1,210 49,343 Oct.11 171,436 10,288 … 180,141 1,177,021 2,337 48,499 Nov.12 141,480 12,714 … 151,184 971,356 3,074 47,522 Dec.
高炉セメント (3)Portland blast furnace cement
その他のセメント (4)Other cement
Year, Quarter and Month
Year, Quarter and Month
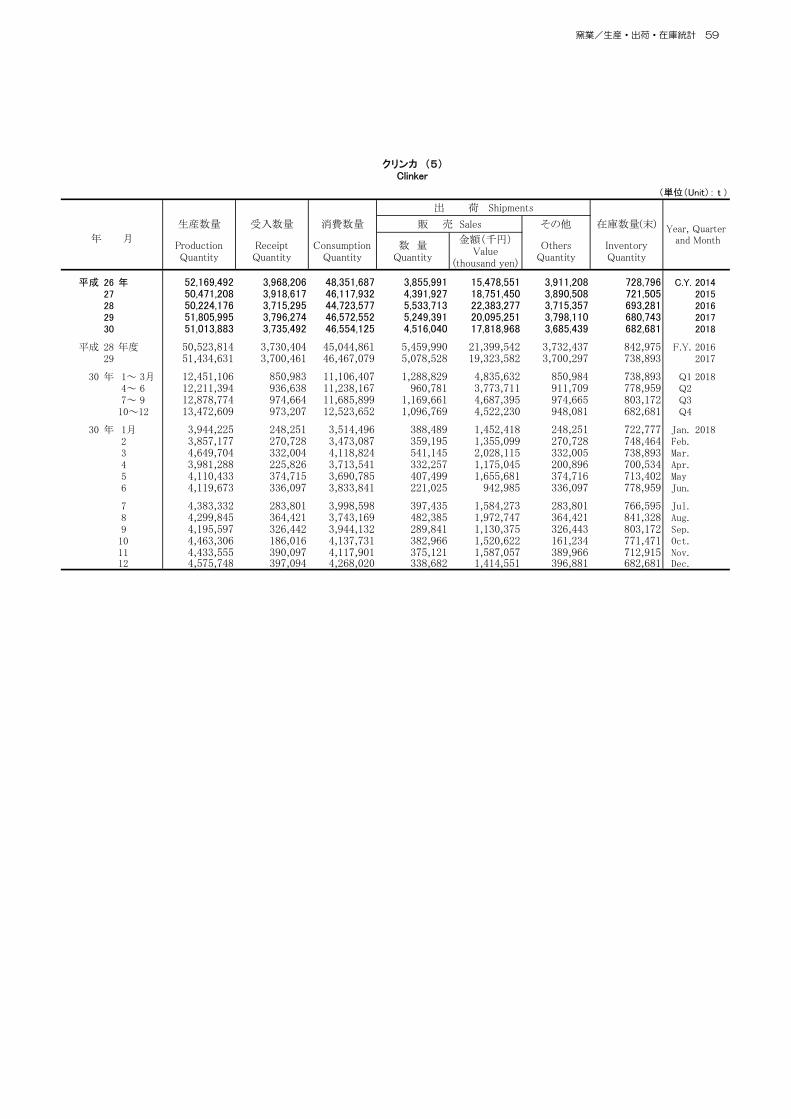
窯業/生産・出荷・在庫統計 59
Ⅰ.製品・出荷・在庫統計 / Production, Shipment and Inventory
2.時系列表 / Historical Data by Commodities (2) セメント・同製品 / Cement and cement products ① セメント(続き) / Cement (continued)
(単位(Unit): t )
出 荷 Shipments
生産数量 受入数量 消費数量 販 売 Sales その他 在庫数量(末)
年 月ProductionQuantity
ReceiptQuantity
ConsumptionQuantity
数 量Quantity
金額(千円)Value
(thousand yen)
OthersQuantity
InventoryQuantity
平成 26 年 52,169,492 3,968,206 48,351,687 3,855,991 15,478,551 3,911,208 728,796 C.Y. 201427 50,471,208 3,918,617 46,117,932 4,391,927 18,751,450 3,890,508 721,505 201528 50,224,176 3,715,295 44,723,577 5,533,713 22,383,277 3,715,357 693,281 201629 51,805,995 3,796,274 46,572,552 5,249,391 20,095,251 3,798,110 680,743 201730 51,013,883 3,735,492 46,554,125 4,516,040 17,818,968 3,685,439 682,681 2018
平成 28 年度 50,523,814 3,730,404 45,044,861 5,459,990 21,399,542 3,732,437 842,975 F.Y. 201629 51,434,631 3,700,461 46,467,079 5,078,528 19,323,582 3,700,297 738,893 2017
30 年 1~ 3月 12,451,106 850,983 11,106,407 1,288,829 4,835,632 850,984 738,893 Q1 2018 4~ 6 12,211,394 936,638 11,238,167 960,781 3,773,711 911,709 778,959 Q2 7~ 9 12,878,774 974,664 11,685,899 1,169,661 4,687,395 974,665 803,172 Q310~12 13,472,609 973,207 12,523,652 1,096,769 4,522,230 948,081 682,681 Q4
30 年 1月 3,944,225 248,251 3,514,496 388,489 1,452,418 248,251 722,777 Jan. 2018 2 3,857,177 270,728 3,473,087 359,195 1,355,099 270,728 748,464 Feb. 3 4,649,704 332,004 4,118,824 541,145 2,028,115 332,005 738,893 Mar. 4 3,981,288 225,826 3,713,541 332,257 1,175,045 200,896 700,534 Apr. 5 4,110,433 374,715 3,690,785 407,499 1,655,681 374,716 713,402 May 6 4,119,673 336,097 3,833,841 221,025 942,985 336,097 778,959 Jun.
7 4,383,332 283,801 3,998,598 397,435 1,584,273 283,801 766,595 Jul. 8 4,299,845 364,421 3,743,169 482,385 1,972,747 364,421 841,328 Aug. 9 4,195,597 326,442 3,944,132 289,841 1,130,375 326,443 803,172 Sep.10 4,463,306 186,016 4,137,731 382,966 1,520,622 161,234 771,471 Oct.11 4,433,555 390,097 4,117,901 375,121 1,587,057 389,966 712,915 Nov.12 4,575,748 397,094 4,268,020 338,682 1,414,551 396,881 682,681 Dec.
クリンカ (5)Clinker
Year, Quarter and Month
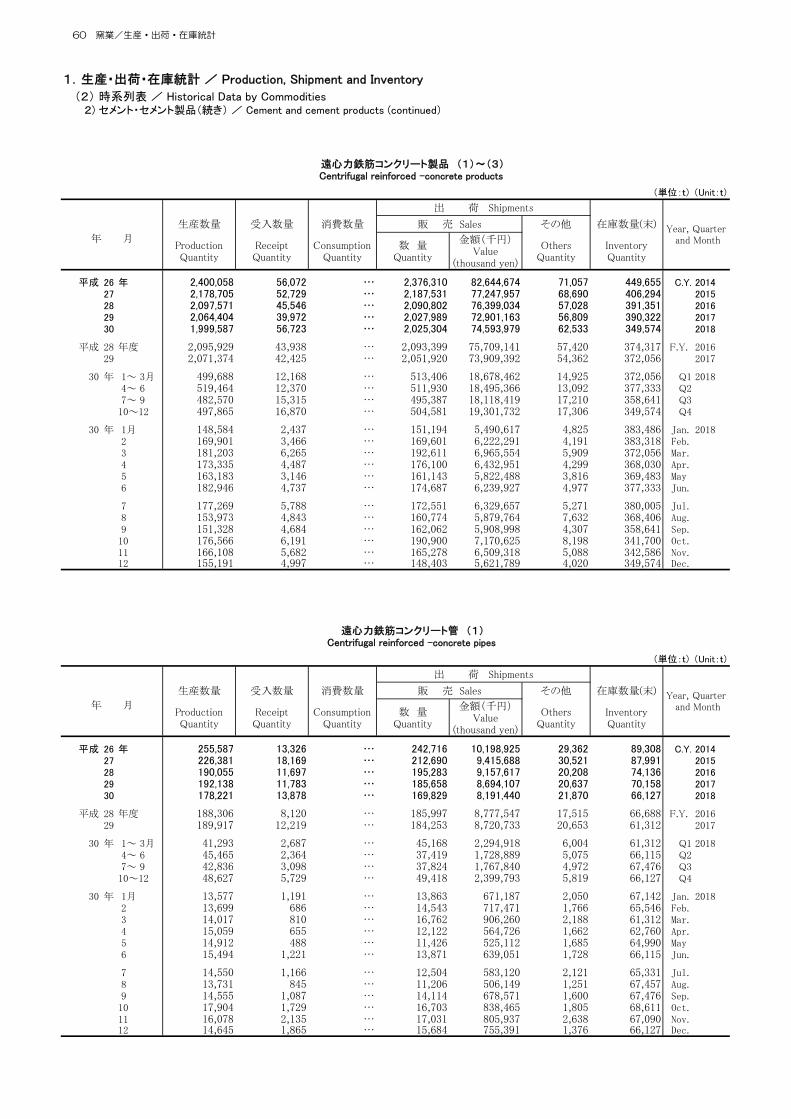
60 窯業/生産・出荷・在庫統計
1.生産・出荷・在庫統計 / Production, Shipment and Inventory
(2) 時系列表 / Historical Data by Commodities 2) セメント・セメント製品(続き) / Cement and cement products (continued)
(単位:t) (Unit:t)
出 荷 Shipments
生産数量 受入数量 消費数量 販 売 Sales その他 在庫数量(末)
年 月ProductionQuantity
ReceiptQuantity
ConsumptionQuantity
数 量Quantity
金額(千円)Value
(thousand yen)
OthersQuantity
InventoryQuantity
平成 26 年 2,400,058 56,072 … 2,376,310 82,644,674 71,057 449,655 C.Y. 201427 2,178,705 52,729 … 2,187,531 77,247,957 68,690 406,294 201528 2,097,571 45,546 … 2,090,802 76,399,034 57,028 391,351 201629 2,064,404 39,972 … 2,027,989 72,901,163 56,809 390,322 201730 1,999,587 56,723 … 2,025,304 74,593,979 62,533 349,574 2018
平成 28 年度 2,095,929 43,938 … 2,093,399 75,709,141 57,420 374,317 F.Y. 201629 2,071,374 42,425 … 2,051,920 73,909,392 54,362 372,056 2017
30 年 1~ 3月 499,688 12,168 … 513,406 18,678,462 14,925 372,056 Q1 2018 4~ 6 519,464 12,370 … 511,930 18,495,366 13,092 377,333 Q2 7~ 9 482,570 15,315 … 495,387 18,118,419 17,210 358,641 Q310~12 497,865 16,870 … 504,581 19,301,732 17,306 349,574 Q4
30 年 1月 148,584 2,437 … 151,194 5,490,617 4,825 383,486 Jan. 2018 2 169,901 3,466 … 169,601 6,222,291 4,191 383,318 Feb. 3 181,203 6,265 … 192,611 6,965,554 5,909 372,056 Mar. 4 173,335 4,487 … 176,100 6,432,951 4,299 368,030 Apr. 5 163,183 3,146 … 161,143 5,822,488 3,816 369,483 May 6 182,946 4,737 … 174,687 6,239,927 4,977 377,333 Jun.
7 177,269 5,788 … 172,551 6,329,657 5,271 380,005 Jul. 8 153,973 4,843 … 160,774 5,879,764 7,632 368,406 Aug. 9 151,328 4,684 … 162,062 5,908,998 4,307 358,641 Sep.10 176,566 6,191 … 190,900 7,170,625 8,198 341,700 Oct.11 166,108 5,682 … 165,278 6,509,318 5,088 342,586 Nov.12 155,191 4,997 … 148,403 5,621,789 4,020 349,574 Dec.
(単位:t) (Unit:t)
出 荷 Shipments
生産数量 受入数量 消費数量 販 売 Sales その他 在庫数量(末)
年 月ProductionQuantity
ReceiptQuantity
ConsumptionQuantity
数 量Quantity
金額(千円)Value
(thousand yen)
OthersQuantity
InventoryQuantity
平成 26 年 255,587 13,326 … 242,716 10,198,925 29,362 89,308 C.Y. 201427 226,381 18,169 … 212,690 9,415,688 30,521 87,991 201528 190,055 11,697 … 195,283 9,157,617 20,208 74,136 201629 192,138 11,783 … 185,658 8,694,107 20,637 70,158 201730 178,221 13,878 … 169,829 8,191,440 21,870 66,127 2018
平成 28 年度 188,306 8,120 … 185,997 8,777,547 17,515 66,688 F.Y. 201629 189,917 12,219 … 184,253 8,720,733 20,653 61,312 2017
30 年 1~ 3月 41,293 2,687 … 45,168 2,294,918 6,004 61,312 Q1 2018 4~ 6 45,465 2,364 … 37,419 1,728,889 5,075 66,115 Q2 7~ 9 42,836 3,098 … 37,824 1,767,840 4,972 67,476 Q310~12 48,627 5,729 … 49,418 2,399,793 5,819 66,127 Q4
30 年 1月 13,577 1,191 … 13,863 671,187 2,050 67,142 Jan. 2018 2 13,699 686 … 14,543 717,471 1,766 65,546 Feb. 3 14,017 810 … 16,762 906,260 2,188 61,312 Mar. 4 15,059 655 … 12,122 564,726 1,662 62,760 Apr. 5 14,912 488 … 11,426 525,112 1,685 64,990 May 6 15,494 1,221 … 13,871 639,051 1,728 66,115 Jun.
7 14,550 1,166 … 12,504 583,120 2,121 65,331 Jul. 8 13,731 845 … 11,206 506,149 1,251 67,457 Aug. 9 14,555 1,087 … 14,114 678,571 1,600 67,476 Sep.10 17,904 1,729 … 16,703 838,465 1,805 68,611 Oct.11 16,078 2,135 … 17,031 805,937 2,638 67,090 Nov.12 14,645 1,865 … 15,684 755,391 1,376 66,127 Dec.
Year, Quarter and Month
遠心力鉄筋コンクリート管 (1)Centrifugal reinforced concrete pipes
Year, Quarter and Month
遠心力鉄筋コンクリート製品 (1)~(3)Centrifugal reinforced concrete products

窯業/生産・出荷・在庫統計 61
1.生産・出荷・在庫統計 / Production, Shipment and Inventory
(2) 時系列表 / Historical Data by Commodities 2) セメント・同製品 / Cement and cement products ② セメント製品(続き) / Cement products (continued)
(単位:t) (Unit:t)
出 荷 Shipments
生産数量 受入数量 消費数量 販 売 Sales その他 在庫数量(末)
年 月ProductionQuantity
ReceiptQuantity
ConsumptionQuantity
数 量Quantity
金額(千円)Value
(thousand yen)
OthersQuantity
InventoryQuantity
平成 26 年 649,648 8,090 … 633,481 33,937,001 7,254 117,157 C.Y. 201427 597,538 4,815 … 600,942 32,353,340 5,599 112,104 201528 577,121 4,548 … 584,964 32,751,887 5,574 102,944 201629 542,868 5,568 … 534,423 31,391,686 6,431 110,282 201730 467,371 7,617 … 477,751 30,004,684 10,298 97,022 2018
平成 28 年度 582,723 5,409 … 575,084 32,580,677 6,326 113,140 F.Y. 201629 511,177 5,182 … 513,484 30,754,702 6,784 108,286 2017
30 年 1~ 3月 112,836 1,312 … 114,009 7,130,588 2,542 108,286 Q1 2018 4~ 6 113,210 1,258 … 115,309 7,103,671 1,692 105,986 Q2 7~ 9 112,912 2,368 … 118,155 7,391,086 2,153 100,646 Q310~12 128,413 2,679 … 130,278 8,379,339 3,911 97,022 Q4
30 年 1月 35,190 391 … 37,275 2,335,049 666 108,164 Jan. 2018 2 38,567 442 … 38,176 2,355,424 616 108,542 Feb. 3 39,079 479 … 38,558 2,440,115 1,260 108,286 Mar. 4 38,030 396 … 37,784 2,354,105 682 108,028 Apr. 5 35,870 246 … 37,776 2,311,754 401 106,621 May 6 39,310 616 … 39,749 2,437,812 609 105,986 Jun.
7 40,184 817 … 40,525 2,516,982 894 105,269 Jul. 8 36,217 796 … 37,855 2,414,151 561 103,316 Aug. 9 36,511 755 … 39,775 2,459,953 698 100,646 Sep.10 44,768 999 … 45,395 2,892,813 2,380 98,781 Oct.11 43,009 944 … 46,608 3,004,400 729 94,957 Nov.12 40,636 736 … 38,275 2,482,126 802 97,022 Dec.
(単位:t) (Unit:t)
出 荷 Shipments
生産数量 受入数量 消費数量 販 売 Sales その他 在庫数量(末)
年 月ProductionQuantity
ReceiptQuantity
ConsumptionQuantity
数 量Quantity
金額(千円)Value
(thousand yen)
OthersQuantity
InventoryQuantity
平成 26 年 1,494,823 34,656 … 1,500,113 38,508,748 34,441 243,190 C.Y. 201427 1,354,786 29,745 … 1,373,899 35,478,929 32,570 206,199 201528 1,330,395 29,301 … 1,310,555 34,489,530 31,246 214,271 201629 1,329,398 22,621 … 1,307,908 32,815,370 29,741 209,882 201730 1,353,995 35,228 … 1,377,724 36,397,855 30,365 186,425 2018
平成 28 年度 1,324,900 30,409 … 1,332,318 34,350,917 33,579 194,489 F.Y. 201629 1,370,280 25,024 … 1,354,183 34,433,957 26,925 202,458 2017
30 年 1~ 3月 345,559 8,169 … 354,229 9,252,956 6,379 202,458 Q1 2018 4~ 6 360,789 8,748 … 359,202 9,662,806 6,325 205,232 Q2 7~ 9 326,822 9,849 … 339,408 8,959,493 10,085 190,519 Q310~12 320,825 8,462 … 324,885 8,522,600 7,576 186,425 Q4
30 年 1月 99,817 855 … 100,056 2,484,381 2,109 208,180 Jan. 2018 2 117,635 2,338 … 116,882 3,149,396 1,809 209,230 Feb. 3 128,107 4,976 … 137,291 3,619,179 2,461 202,458 Mar. 4 120,246 3,436 … 126,194 3,514,120 1,955 197,242 Apr. 5 112,401 2,412 … 111,941 2,985,622 1,730 197,872 May 6 128,142 2,900 … 121,067 3,163,064 2,640 205,232 Jun.
7 122,535 3,805 … 119,522 3,229,555 2,256 209,405 Jul. 8 104,025 3,202 … 111,713 2,959,464 5,820 197,633 Aug. 9 100,262 2,842 … 108,173 2,770,474 2,009 190,519 Sep.10 113,894 3,463 … 128,802 3,439,347 4,013 174,308 Oct.11 107,021 2,603 … 101,639 2,698,981 1,721 180,539 Nov.12 99,910 2,396 … 94,444 2,384,272 1,842 186,425 Dec.
Year, Quarter and Month
遠心力鉄筋コンクリートパイル (3)Centrifugal reinforced concrete piles
Year, Quarter and Month
遠心力鉄筋コンクリートポール (2)Centrifugal reinforced concrete poles

62 窯業/生産・出荷・在庫統計
1.生産・出荷・在庫統計 / Production, Shipment and Inventory
(2) 時系列表 / Historical Data by Commodities 2) セメント・セメント製品(続き) / Cement and cement products (continued)
(単位:1000個) (Unit:1000n)
出 荷 Shipments
生産数量 受入数量 消費数量 販 売 Sales その他 在庫数量(末)
年 月ProductionQuantity
ReceiptQuantity
ConsumptionQuantity
数 量Quantity
金額(千円)Value
(thousand yen)
OthersQuantity
InventoryQuantity
平成 26 年 70,593 1,744 … 69,897 12,464,675 388 6,405 C.Y. 201427 65,279 1,812 … 65,448 12,190,222 223 6,249 201528 63,067 1,965 … 64,197 12,221,596 284 5,804 201629 64,553 1,989 … 63,248 12,271,250 297 6,350 201730 63,207 1,813 … 66,634 12,937,906 308 5,728 2018
平成 28 年度 62,258 2,048 … 63,553 12,190,558 312 4,863 F.Y. 201629 64,407 1,921 … 63,453 12,290,807 299 5,683 2017
30 年 1~ 3月 14,858 447 … 15,348 2,952,065 89 5,683 Q1 2018 4~ 6 16,364 452 … 17,387 3,358,053 66 5,686 Q2 7~ 9 15,380 465 … 16,229 3,194,552 81 5,603 Q310~12 16,605 449 … 17,670 3,433,236 72 5,728 Q4
30 年 1月 4,258 140 … 4,755 868,078 39 5,797 Jan. 2018 2 5,165 152 … 5,075 1,035,689 20 5,522 Feb. 3 5,435 155 … 5,518 1,048,298 30 5,683 Mar. 4 5,668 152 … 6,050 1,183,650 33 5,693 Apr. 5 5,289 145 … 5,746 1,072,429 22 5,565 May 6 5,407 155 … 5,591 1,101,974 11 5,686 Jun.
7 5,259 155 … 5,569 1,073,695 35 5,606 Jul. 8 5,008 150 … 5,307 1,044,082 9 5,596 Aug. 9 5,113 160 … 5,353 1,076,775 37 5,603 Sep.10 5,671 155 … 6,030 1,151,651 38 5,625 Oct.11 5,435 148 … 5,863 1,177,823 31 5,621 Nov.12 5,499 146 … 5,777 1,103,762 3 5,728 Dec.
注: 空洞コンクリートブロックの換算基準は半切ブロックは2個をもって1個とし、異形ブロックは標準形に換算したものである。
Notes:
(単位:t) (Unit:t)
出 荷 Shipments
生産数量 受入数量 消費数量 販 売 Sales その他 在庫数量(末)
年 月ProductionQuantity
ReceiptQuantity
ConsumptionQuantity
数 量Quantity
金額(千円)Value
(thousand yen)
OthersQuantity
InventoryQuantity
平成 26 年 790,584 49,776 … 806,891 12,128,211 13,305 278,625 C.Y. 201427 707,844 18,896 … 732,445 10,804,773 15,200 261,410 201528 652,774 22,991 … 677,346 10,373,954 21,956 266,979 201629 744,092 46,877 … 775,986 12,016,354 37,654 241,225 201730 599,331 23,773 … 635,092 9,742,140 24,456 226,036 2018
平成 28 年度 688,286 32,415 … 684,484 10,712,384 30,553 234,892 F.Y. 201629 702,202 39,146 … 763,353 11,788,588 30,136 200,070 2017
30 年 1~ 3月 156,160 6,397 … 198,968 3,188,197 5,477 200,070 Q1 2018 4~ 6 156,509 6,435 … 137,774 2,030,605 8,096 222,883 Q2 7~ 9 131,729 5,578 … 125,616 1,897,542 6,543 233,781 Q310~12 154,933 5,363 … 172,734 2,625,796 4,340 226,036 Q4
30 年 1月 48,694 1,266 … 62,384 961,670 2,843 222,559 Jan. 2018 2 52,645 2,799 … 77,089 1,285,223 948 202,023 Feb. 3 54,821 2,332 … 59,495 941,304 1,686 200,070 Mar. 4 53,253 3,198 … 47,527 686,332 2,184 208,616 Apr. 5 50,895 1,855 … 42,187 627,825 2,325 218,664 May 6 52,361 1,382 … 48,060 716,448 3,587 222,883 Jun.
7 49,139 2,776 … 44,512 694,339 2,820 229,214 Jul. 8 41,319 1,683 … 37,806 553,331 1,567 234,348 Aug. 9 41,271 1,119 … 43,298 649,872 2,156 233,781 Sep.10 50,501 2,509 … 49,904 751,846 1,174 238,693 Oct.11 53,340 1,792 … 59,192 889,121 1,930 235,708 Nov.12 51,092 1,062 … 63,638 984,829 1,236 226,036 Dec.
Year, Quarter and Month
The conversion standard of hollow concrete blocks: two pieces of half-cut block are counted as one. And special shape blocks are converted to thestandard form.
護岸用コンクリートブロック (5)Concrete blocks for bank protection
Year, Quarter and Month
空洞コンクリートブロック (4)Hollow concrete blocks

窯業/生産・出荷・在庫統計 63
1.生産・出荷・在庫統計 / Production, Shipment and Inventory
(2) 時系列表 / Historical Data by Commodities 2) セメント・同製品 / Cement and cement products ② セメント製品(続き) / Cement products (continued)
(単位:t) (Unit:t)
出 荷 Shipments
生産数量 受入数量 消費数量 販 売 Sales その他 在庫数量(末)
年 月ProductionQuantity
ReceiptQuantity
ConsumptionQuantity
数 量Quantity
金額(千円)Value
(thousand yen)
OthersQuantity
InventoryQuantity
平成 26 年 3,042,076 194,721 … 3,180,450 69,504,797 43,193 984,111 C.Y. 201427 2,719,668 185,712 … 2,876,249 64,927,271 46,318 969,254 201528 2,523,073 108,805 … 2,730,882 60,794,793 36,465 899,316 201629 2,584,078 141,376 … 2,791,106 63,391,585 38,955 875,702 201730 2,352,695 130,712 … 2,543,004 63,075,239 38,881 857,372 2018
平成 28 年度 2,548,466 111,666 … 2,732,940 61,220,449 37,169 831,524 F.Y. 201629 2,526,748 142,696 … 2,724,682 63,114,518 39,039 797,730 2017
30 年 1~ 3月 604,406 35,035 … 707,737 17,567,380 10,150 797,730 Q1 2018 4~ 6 563,714 31,459 … 575,086 14,149,937 10,376 834,316 Q2 7~ 9 530,094 26,740 … 552,652 13,643,512 8,625 856,621 Q310~12 654,481 37,478 … 707,529 17,714,410 9,730 857,372 Q4
30 年 1月 193,465 10,341 … 222,754 5,535,017 3,302 838,623 Jan. 2018 2 202,155 11,351 … 250,574 6,191,563 3,012 804,992 Feb. 3 208,786 13,343 … 234,409 5,840,800 3,836 797,730 Mar. 4 187,135 11,400 … 198,790 4,872,668 3,828 803,872 Apr. 5 183,927 11,145 … 187,624 4,632,655 3,030 816,593 May 6 192,652 8,914 … 188,672 4,644,614 3,518 834,316 Jun.
7 184,373 7,806 … 182,639 4,545,944 2,812 850,098 Jul. 8 164,981 9,952 … 179,411 4,370,438 3,273 850,022 Aug. 9 180,740 8,982 … 190,602 4,727,130 2,540 856,621 Sep.10 221,853 10,655 … 230,019 5,719,997 3,349 863,645 Oct.11 223,044 12,300 … 247,591 6,197,278 3,533 856,605 Nov.12 209,584 14,523 … 229,919 5,797,135 2,848 857,372 Dec.
(単位:t) (Unit:t)
出 荷 Shipments
生産数量 受入数量 消費数量 販 売 Sales その他 在庫数量(末)
年 月ProductionQuantity
ReceiptQuantity
ConsumptionQuantity
数 量Quantity
金額(千円)Value
(thousand yen)
OthersQuantity
InventoryQuantity
平成 26 年 660,057 32,259 … 686,579 21,044,490 860 111,527 C.Y. 201427 611,536 4,327 … 615,851 18,777,570 891 107,029 201528 608,561 2,661 … 594,982 17,804,897 1,629 115,942 201629 676,102 1,431 … 680,206 20,216,168 867 108,291 201730 690,048 1,421 … 667,917 19,541,037 444 133,412 2018
平成 28 年度 632,425 2,521 … 630,100 18,581,459 1,596 101,342 F.Y. 201629 670,786 1,350 … 661,570 19,555,136 741 110,655 2017
30 年 1~ 3月 157,475 293 … 156,838 4,604,910 121 110,655 Q1 2018 4~ 6 169,739 315 … 160,279 4,514,794 62 120,780 Q2 7~ 9 175,459 334 … 178,293 5,264,434 110 117,952 Q310~12 187,375 479 … 172,507 5,156,899 151 133,412 Q4
30 年 1月 52,263 76 … 50,919 1,403,768 42 110,227 Jan. 2018 2 50,867 33 … 49,862 1,453,767 35 111,479 Feb. 3 54,345 184 … 56,057 1,747,375 44 110,655 Mar. 4 53,809 135 … 50,638 1,479,745 32 114,217 Apr. 5 56,376 101 … 49,855 1,344,538 13 120,878 May 6 59,554 79 … 59,786 1,690,511 17 120,780 Jun.
7 61,031 136 … 62,796 1,841,383 50 118,921 Jul. 8 55,164 113 … 53,958 1,565,867 33 120,045 Aug. 9 59,264 85 … 61,539 1,857,184 27 117,952 Sep.10 63,949 238 … 61,843 1,785,242 61 120,259 Oct.11 63,917 143 … 56,310 1,636,729 59 128,047 Nov.12 59,509 98 … 54,354 1,734,928 31 133,412 Dec.
Year, Quarter and Month
プレストレストコンクリート製品 (7)~(8)Prestressed concrete products
Year, Quarter and Month
道路用コンクリート製品 (6)Concrete products for road

64 窯業/生産・出荷・在庫統計
1.生産・出荷・在庫統計 / Production, Shipment and Inventory
(2) 時系列表 / Historical Data by Commodities 2) セメント・セメント製品(続き) / Cement and cement products (continued)
(単位:t) (Unit:t)
出 荷 Shipments
生産数量 受入数量 消費数量 販 売 Sales その他 在庫数量(末)
年 月ProductionQuantity
ReceiptQuantity
ConsumptionQuantity
数 量Quantity
金額(千円)Value
(thousand yen)
OthersQuantity
InventoryQuantity
平成 26 年 123,733 1 … 128,396 5,035,774 1 14,824 C.Y. 201427 106,213 1 … 93,077 3,841,474 2 27,963 201528 113,687 133 … 117,294 4,800,039 15 25,035 201629 120,925 3 … 125,642 5,227,000 49 19,814 201730 125,994 2 … 118,707 4,936,902 8 28,050 2018
平成 28 年度 121,291 4 … 117,691 4,818,780 31 23,898 F.Y. 201629 117,088 1 … 120,986 5,078,480 41 19,806 2017
30 年 1~ 3月 25,988 - … 25,976 1,109,865 8 19,806 Q1 2018 4~ 6 31,625 - … 25,556 1,034,523 - 26,446 Q2 7~ 9 34,904 - … 38,587 1,619,957 - 22,909 Q310~12 33,477 2 … 28,588 1,172,557 - 28,050 Q4
30 年 1月 7,547 - … 6,840 274,928 8 20,504 Jan. 2018 2 8,361 - … 6,772 280,317 - 21,901 Feb. 3 10,080 - … 12,364 554,620 - 19,806 Mar. 4 9,427 - … 8,721 363,223 - 20,702 Apr. 5 10,428 - … 5,397 217,095 - 25,924 May 6 11,770 - … 11,438 454,205 - 26,446 Jun.
7 12,972 - … 12,984 546,819 - 26,625 Jul. 8 11,393 - … 10,519 409,895 - 27,270 Aug. 9 10,539 - … 15,084 663,243 - 22,909 Sep.10 10,703 1 … 12,110 465,853 - 21,695 Oct.11 11,188 1 … 7,682 286,716 - 25,388 Nov.12 11,586 - … 8,796 419,988 - 28,050 Dec.
(単位:t) (Unit:t)
出 荷 Shipments
生産数量 受入数量 消費数量 販 売 Sales その他 在庫数量(末)
年 月ProductionQuantity
ReceiptQuantity
ConsumptionQuantity
数 量Quantity
金額(千円)Value
(thousand yen)
OthersQuantity
InventoryQuantity
平成 26 年 536,324 32,258 … 558,183 16,008,716 859 96,703 C.Y. 201427 505,323 4,326 … 522,774 14,936,096 889 79,066 201528 494,874 2,528 … 477,688 13,004,858 1,614 90,907 201629 555,177 1,428 … 554,564 14,989,168 818 88,477 201730 564,054 1,419 … 549,210 14,604,135 436 105,362 2018
平成 28 年度 511,134 2,517 … 512,409 13,762,679 1,565 77,444 F.Y. 201629 553,698 1,349 … 540,584 14,476,656 700 90,849 2017
30 年 1~ 3月 131,487 293 … 130,862 3,495,045 113 90,849 Q1 2018 4~ 6 138,114 315 … 134,723 3,480,271 62 94,334 Q2 7~ 9 140,555 334 … 139,706 3,644,477 110 95,043 Q310~12 153,898 477 … 143,919 3,984,342 151 105,362 Q4
30 年 1月 44,716 76 … 44,079 1,128,840 34 89,723 Jan. 2018 2 42,506 33 … 43,090 1,173,450 35 89,578 Feb. 3 44,265 184 … 43,693 1,192,755 44 90,849 Mar. 4 44,382 135 … 41,917 1,116,522 32 93,515 Apr. 5 45,948 101 … 44,458 1,127,443 13 94,954 May 6 47,784 79 … 48,348 1,236,306 17 94,334 Jun.
7 48,059 136 … 49,812 1,294,564 50 92,296 Jul. 8 43,771 113 … 43,439 1,155,972 33 92,775 Aug. 9 48,725 85 … 46,455 1,193,941 27 95,043 Sep.10 53,246 237 … 49,733 1,319,389 61 98,564 Oct.11 52,729 142 … 48,628 1,350,013 59 102,659 Nov.12 47,923 98 … 45,558 1,314,940 31 105,362 Dec.
Year, Quarter and Month
その他のプレストレストコンクリート製品 (8)Other prestressed concrete products
Year, Quarter and Month
はり ・ けた (7)Beam and crossbeam

窯業/生産・出荷・在庫統計 65
1.生産・出荷・在庫統計 / Production, Shipment and Inventory
(2) 時系列表 / Historical Data by Commodities 2) セメント・同製品 / Cement and cement products ② セメント製品(続き) / Cement products (continued)
(単位:1000枚) (Unit:1000sheets)
出 荷 Shipments
生産数量 受入数量 消費数量 販 売 Sales その他 在庫数量(末)
年 月ProductionQuantity
ReceiptQuantity
ConsumptionQuantity
数 量Quantity
金額(千円)Value
(thousand yen)
OthersQuantity
InventoryQuantity
平成 26 年 17,817 13,930 … 27,430 46,941,076 4,125 2,177 C.Y. 201427 18,384 14,614 … 28,332 46,900,622 4,532 2,682 201528 20,030 14,673 … 29,910 49,889,365 5,335 2,161 201629 19,893 13,759 … 27,272 46,650,847 6,439 2,231 201730 19,442 12,961 … 25,580 44,536,064 6,890 2,852 2018
平成 28 年度 20,040 14,360 … 29,528 49,561,691 5,546 2,073 F.Y. 201629 19,879 13,235 … 26,421 45,389,756 6,930 2,552 2017
30 年 1~ 3月 4,865 2,953 … 6,154 10,731,220 1,915 2,552 Q1 2018 4~ 6 4,552 3,221 … 5,961 10,549,222 1,757 2,749 Q2 7~ 9 4,934 3,204 … 6,480 11,071,151 1,565 2,826 Q310~12 5,091 3,583 … 6,985 12,184,471 1,653 2,852 Q4
30 年 1月 1,494 759 … 1,932 3,390,710 335 2,223 Jan. 2018 2 1,535 901 … 1,968 3,513,589 535 2,266 Feb. 3 1,836 1,293 … 2,254 3,826,921 1,045 2,552 Mar. 4 1,445 1,188 … 1,949 3,425,070 698 2,701 Apr. 5 1,403 931 … 1,939 3,462,377 529 2,558 May 6 1,704 1,102 … 2,073 3,661,775 530 2,749 Jun.
7 1,694 1,209 … 2,313 3,904,599 487 2,849 Jul. 8 1,502 1,095 … 2,096 3,581,589 595 2,750 Aug. 9 1,738 900 … 2,071 3,584,963 483 2,826 Sep.10 1,778 1,296 … 2,388 4,130,073 528 2,988 Oct.11 1,769 1,202 … 2,390 4,146,784 649 2,906 Nov.12 1,544 1,085 … 2,207 3,907,614 476 2,852 Dec.
(単位:m3) (Unit:m
3)
出 荷 Shipments
生産数量 受入数量 消費数量 販 売 Sales その他 在庫数量(末)
年 月ProductionQuantity
ReceiptQuantity
ConsumptionQuantity
数 量Quantity
金額(千円)Value
(thousand yen)
OthersQuantity
InventoryQuantity
平成 26 年 1,718,032 3,624 … 1,690,240 50,644,002 31,033 61,432 C.Y. 201427 1,670,248 3,402 … 1,651,734 51,418,584 24,877 58,717 201528 1,595,165 4,302 … 1,578,701 49,604,329 21,021 47,199 201629 1,604,062 15,287 … 1,583,400 50,344,872 30,608 51,093 201730 1,568,045 18,085 … 1,546,925 50,858,961 30,652 55,933 2018
平成 28 年度 1,597,178 6,730 … 1,584,151 49,725,456 23,352 47,636 F.Y. 201629 1,575,331 16,042 … 1,554,500 49,948,952 30,448 51,952 2017
30 年 1~ 3月 362,836 3,896 … 358,337 11,802,186 6,415 51,952 Q1 2018 4~ 6 369,471 3,497 … 361,364 11,732,877 7,371 54,983 Q2 7~ 9 392,455 5,525 … 388,726 12,748,789 8,696 54,942 Q310~12 443,283 5,167 … 438,498 14,575,109 8,170 55,933 Q4
30 年 1月 117,873 1,160 … 120,010 3,894,401 2,115 47,602 Jan. 2018 2 120,382 1,438 … 111,725 3,703,708 2,142 55,756 Feb. 3 124,581 1,298 … 126,602 4,204,077 2,158 51,952 Mar. 4 126,385 1,210 … 121,701 3,917,770 2,305 54,867 Apr. 5 112,214 1,132 … 112,844 3,655,782 2,180 52,946 May 6 130,872 1,155 … 126,819 4,159,325 2,886 54,983 Jun.
7 135,466 1,847 … 133,838 4,366,383 2,802 55,616 Jul. 8 121,153 1,608 … 122,290 3,980,095 2,364 53,370 Aug. 9 135,836 2,070 … 132,598 4,402,311 3,530 54,942 Sep.10 149,507 1,803 … 149,177 4,897,529 2,747 54,089 Oct.11 150,708 1,835 … 147,117 4,925,101 2,813 56,390 Nov.12 143,068 1,529 … 142,204 4,752,479 2,610 55,933 Dec.
Year, Quarter and Month
気泡コンクリート製品 (10)Autoclaved light weight concrete products
Year, Quarter and Month
木毛・木片セメント板 (9)Wood wool and wooden chip cement board

66 窯業/生産・出荷・在庫統計
1.生産・出荷・在庫統計 / Production, Shipment and Inventory
(2) 時系列表 / Historical Data by Commodities 3) 陶磁器 / Ceramic wares
(単位:m2) (Unit:m2)
出 荷 Shipments
生産数量 受入数量 販 売 Sales その他 在庫数量(末)
年 月ProductionQuantity
ReceiptQuantity
数 量Quantity
金額(千円)Value in Thousand
of Yen
OthersQuantity
InventoryQuantity
平成 26 年 21,669,357 8,764,627 20,982,718 48,454,311 8,342,926 7,319,620 C.Y. 201427 19,814,494 7,358,352 19,492,687 44,106,143 6,885,956 6,448,650 201528 19,104,348 6,824,139 18,747,256 43,245,636 6,317,810 6,066,801 201629 18,964,647 6,636,812 18,232,301 41,945,698 5,936,074 6,108,632 201730 18,873,162 6,286,179 17,681,688 40,797,975 5,754,198 6,415,904 2018
平成 28 年度 18,969,938 6,951,966 18,653,050 42,845,828 6,169,142 5,959,367 F.Y. 201629 18,916,122 6,487,762 17,917,254 41,329,753 5,847,811 6,201,067 2017
30 年 1~ 3月 4,591,978 1,625,684 4,225,604 10,033,114 1,502,312 6,201,067 Q1 2018 4~ 6 4,698,491 1,487,826 4,309,636 9,800,169 1,380,241 6,335,833 Q2 7~ 9 4,644,383 1,505,947 4,319,646 9,865,491 1,377,994 6,478,637 Q310~12 4,938,310 1,666,722 4,826,802 11,099,201 1,493,651 6,415,904 Q4
30 年 1月 1,299,612 477,716 1,306,059 3,001,814 481,732 5,918,313 Jan. 2018 2 1,597,076 563,309 1,438,357 3,445,076 493,930 6,052,983 Feb. 3 1,695,290 584,659 1,481,188 3,586,224 526,650 6,201,067 Mar. 4 1,661,329 484,736 1,509,243 3,335,010 459,640 6,251,186 Apr. 5 1,403,646 470,944 1,356,186 3,056,675 442,506 6,213,347 May 6 1,633,516 532,146 1,444,207 3,408,484 478,095 6,335,833 Jun.
7 1,703,783 542,357 1,505,999 3,456,827 481,374 6,468,550 Jul. 8 1,334,249 461,753 1,382,562 3,158,196 435,395 6,366,537 Aug. 9 1,606,351 501,837 1,431,085 3,250,468 461,225 6,478,637 Sep.10 1,752,505 558,643 1,657,009 3,778,980 490,231 6,512,286 Oct.11 1,638,830 578,497 1,647,135 3,811,788 505,457 6,456,132 Nov.12 1,546,975 529,582 1,522,658 3,508,433 497,963 6,415,904 Dec.
(単位:m2) (Unit:m2)
出 荷 Shipments
生産数量 受入数量 販 売 Sales その他 在庫数量(末)
年 月ProductionQuantity
ReceiptQuantity
数 量Quantity
金額(千円)Value
(thousand yen)
OthersQuantity
InventoryQuantity
平成 26 年 4,379,875 2,820,953 5,635,090 16,666,382 790,424 2,275,013 C.Y. 201427 4,514,047 2,598,118 5,700,329 16,055,285 701,926 2,243,978 201528 4,365,378 2,551,082 5,506,959 15,878,096 791,496 2,259,023 201629 4,129,957 2,313,550 5,179,273 15,022,072 718,354 2,284,209 201730 4,164,559 2,185,309 5,047,227 14,410,873 697,034 2,470,690 2018
平成 28 年度 4,283,215 2,573,594 5,440,598 15,748,565 768,207 2,263,434 F.Y. 201629 4,061,908 2,234,681 5,057,394 14,713,565 702,270 2,346,743 2017
30 年 1~ 3月 951,457 577,802 1,192,342 3,526,622 166,548 2,346,743 Q1 2018 4~ 6 1,006,553 517,299 1,223,965 3,510,087 171,836 2,368,029 Q2 7~ 9 1,074,095 518,642 1,214,820 3,442,939 163,836 2,493,337 Q310~12 1,132,454 571,566 1,416,100 3,931,225 194,814 2,470,690 Q4
30 年 1月 278,863 173,381 388,643 1,117,598 53,170 2,262,455 Jan. 2018 2 321,078 199,388 387,927 1,177,412 46,799 2,311,224 Feb. 3 351,516 205,033 415,772 1,231,612 66,579 2,346,743 Mar. 4 358,079 169,515 428,309 1,175,331 58,263 2,345,508 Apr. 5 309,643 160,814 380,110 1,094,134 50,993 2,351,727 May 6 338,831 186,970 415,546 1,240,622 62,580 2,368,029 Jun.
7 429,537 179,908 410,424 1,149,335 62,755 2,470,207 Jul. 8 291,156 168,666 410,090 1,163,334 51,605 2,444,241 Aug. 9 353,402 170,068 394,306 1,130,270 49,476 2,493,337 Sep.10 408,152 190,337 463,192 1,288,277 68,425 2,508,683 Oct.11 369,832 197,457 485,041 1,373,372 70,332 2,490,097 Nov.12 354,470 183,772 467,867 1,269,576 56,057 2,470,690 Dec.
タイル (1)~(4) Tiles
Year, Quarter and Month
外装 (50cm2をこえるもの) (1)
Facing tiles (more than 50cm2)
Year, Quarter and Month

窯業/生産・出荷・在庫統計 67
1.生産・出荷・在庫統計 / Production, Shipment and Inventory
(2) 時系列表 / Historical Data by Commodities 3) 陶磁器(続き) / Ceramic wares (continued)
(単位:m2) (Unit:m2)
出 荷 Shipments
生産数量 受入数量 販 売 Sales その他 在庫数量(末)
年 月ProductionQuantity
ReceiptQuantity
数 量Quantity
金額(千円)Value
(thousand yen)
OthersQuantity
InventoryQuantity
平成 26 年 2,368,814 295,125 2,080,385 6,017,435 599,871 825,572 C.Y. 201427 2,285,195 208,776 1,982,607 6,443,621 608,405 728,525 201528 2,328,528 173,987 1,829,174 6,121,017 740,399 595,791 201629 2,282,610 159,888 1,727,537 5,718,769 794,339 529,325 201730 2,443,625 146,610 1,803,703 6,016,913 784,476 531,380 2018
平成 28 年度 2,242,744 168,854 1,788,760 6,006,495 730,311 534,605 F.Y. 201629 2,278,867 157,694 1,712,001 5,670,443 803,889 468,207 2017
30 年 1~ 3月 581,496 42,153 473,232 1,546,933 211,535 468,207 Q1 2018 4~ 6 611,056 33,443 437,464 1,409,619 186,445 488,796 Q2 7~ 9 587,098 33,086 432,864 1,427,699 187,642 488,474 Q310~12 663,975 37,928 460,143 1,632,662 198,854 531,380 Q4
30 年 1月 160,670 11,083 136,960 426,522 57,633 506,485 Jan. 2018 2 205,394 15,535 172,251 568,741 73,467 481,696 Feb. 3 215,432 15,535 164,021 551,670 80,435 468,207 Mar. 4 196,318 11,635 155,649 511,847 61,023 459,488 Apr. 5 187,237 10,335 135,059 437,723 58,377 463,623 May 6 227,501 11,473 146,756 460,049 67,045 488,796 Jun.
7 209,449 12,123 154,973 507,665 63,247 492,148 Jul. 8 171,482 10,823 140,319 450,578 54,981 479,153 Aug. 9 206,167 10,140 137,572 469,456 69,414 488,474 Sep.10 221,649 12,383 153,938 535,590 59,131 509,437 Oct.11 222,465 13,260 155,862 559,359 68,613 520,687 Nov.12 219,861 12,285 150,343 537,713 71,110 531,380 Dec.
(単位:m2) (Unit:m2)
出 荷 Shipments
生産数量 受入数量 販 売 Sales その他 在庫数量(末)
年 月ProductionQuantity
ReceiptQuantity
数 量Quantity
金額(千円)Value
(thousand yen)
OthersQuantity
InventoryQuantity
平成 26 年 4,545,307 2,006,167 3,201,799 8,748,903 3,300,853 1,266,839 C.Y. 201427 3,836,572 1,523,920 2,994,499 8,712,898 2,440,426 1,183,764 201528 3,448,036 1,436,287 2,792,023 8,705,908 2,266,547 1,110,694 201629 3,399,830 1,433,494 2,782,518 8,675,489 2,058,247 1,114,697 201730 3,583,823 1,365,077 2,768,771 8,458,087 2,120,941 1,088,684 2018
平成 28 年度 3,391,022 1,523,341 2,800,659 8,591,349 2,179,392 1,068,642 F.Y. 201629 3,457,932 1,395,009 2,752,686 8,577,249 2,058,079 1,039,820 2017
30 年 1~ 3月 904,876 376,757 720,865 2,249,174 553,350 1,039,820 Q1 2018 4~ 6 844,724 295,203 631,031 1,894,725 510,580 1,035,230 Q2 7~ 9 895,818 323,208 672,657 2,050,657 523,149 1,058,450 Q310~12 938,405 369,909 744,218 2,263,531 533,862 1,088,684 Q4
30 年 1月 256,272 104,169 204,895 628,095 178,880 1,009,068 Jan. 2018 2 312,727 135,997 254,468 794,258 194,142 1,009,182 Feb. 3 335,877 136,591 261,502 826,821 180,328 1,039,820 Mar. 4 295,337 96,641 215,669 633,617 172,456 1,043,673 Apr. 5 255,376 92,964 194,867 593,476 163,373 1,030,867 May 6 294,011 105,598 220,495 667,632 174,751 1,035,230 Jun.
7 320,653 115,873 230,418 738,018 177,700 1,063,638 Jul. 8 247,139 104,127 213,947 639,194 172,901 1,028,056 Aug. 9 328,026 103,208 228,292 673,445 172,548 1,058,450 Sep.10 344,240 120,055 249,701 757,948 179,753 1,093,291 Oct.11 296,661 130,066 259,307 783,682 180,257 1,080,454 Nov.12 297,504 119,788 235,210 721,901 173,852 1,088,684 Dec.
内装 (50cm2をこえるもの) (2)
Interior wall tiles (more than 50cm 2)
Year, Quarter and Month
床 (50cm2をこえるもの) (3)
Floor tiles (more than 50cm2)
Year, Quarter and Month

68 窯業/生産・出荷・在庫統計
1.生産・出荷・在庫統計 / Production, Shipment and Inventory
(2) 時系列表 / Historical Data by Commodities 3) 陶磁器(続き) / Ceramic wares (continued)
(単位:m2) (Unit:m2)
出 荷 Shipments
生産数量 受入数量 販 売 Sales その他 在庫数量(末)
年 月ProductionQuantity
ReceiptQuantity
数 量Quantity
金額(千円)Value
(thousand yen)
OthersQuantity
InventoryQuantity
平成 26 年 10,375,361 3,642,382 10,065,444 17,021,591 3,651,778 2,952,196 C.Y. 201427 9,178,680 3,027,538 8,815,252 12,894,339 3,135,199 2,292,383 201528 8,962,406 2,662,783 8,619,100 12,540,615 2,519,368 2,101,293 201629 9,152,250 2,729,880 8,542,973 12,529,368 2,365,134 2,180,401 201730 8,681,155 2,589,183 8,061,987 11,912,102 2,151,747 2,325,150 2018
平成 28 年度 9,052,957 2,686,177 8,623,033 12,499,419 2,491,232 2,092,686 F.Y. 201629 9,117,415 2,700,378 8,395,173 12,368,496 2,283,573 2,346,297 2017
30 年 1~ 3月 2,154,149 628,972 1,839,165 2,710,385 570,879 2,346,297 Q1 2018 4~ 6 2,236,158 641,881 2,017,176 2,985,738 511,380 2,443,778 Q2 7~ 9 2,087,372 631,011 1,999,305 2,944,196 503,367 2,438,376 Q310~12 2,203,476 687,319 2,206,341 3,271,783 566,121 2,325,150 Q4
30 年 1月 603,807 189,083 575,561 829,599 192,049 2,140,305 Jan. 2018 2 757,877 212,389 623,711 904,665 179,522 2,250,881 Feb. 3 792,465 227,500 639,893 976,121 199,308 2,346,297 Mar. 4 811,595 206,945 709,616 1,014,215 167,898 2,402,517 Apr. 5 651,390 206,831 646,150 931,342 169,763 2,367,130 May 6 773,173 228,105 661,410 1,040,181 173,719 2,443,778 Jun.
7 744,144 234,453 710,184 1,061,809 177,672 2,442,557 Jul. 8 624,472 178,137 618,206 905,090 155,908 2,415,087 Aug. 9 718,756 218,421 670,915 977,297 169,787 2,438,376 Sep.10 778,464 235,868 790,178 1,197,165 182,922 2,400,875 Oct.11 749,872 237,714 746,925 1,095,375 186,255 2,364,894 Nov.12 675,140 213,737 669,238 979,243 196,944 2,325,150 Dec.
(単位:個)(Unit:n)
出 荷 Shipments
生産数量 受入数量 販 売 Sales その他 在庫数量(末)
年 月ProductionQuantity
ReceiptQuantity
数 量Quantity
金額(千円)Value
(thousand yen)
OthersQuantity
InventoryQuantity
平成 26 年 4,841,938 1,445,297 5,622,841 50,038,075 544,978 665,984 C.Y. 201427 4,679,917 1,319,094 5,491,581 49,788,308 514,752 652,404 201528 4,539,567 1,193,786 5,392,824 49,861,518 519,302 470,209 201629 4,576,976 1,349,191 5,424,381 51,121,614 521,613 451,600 201730 4,546,569 1,359,512 5,315,984 52,423,066 498,756 543,315 2018
平成 28 年度 4,528,515 1,256,315 5,354,908 49,808,541 511,844 405,568 F.Y. 201629 4,619,871 1,334,987 5,359,520 51,196,264 514,761 488,881 2017
30 年 1~ 3月 1,157,621 340,261 1,337,610 12,840,938 123,455 488,881 Q1 2018 4~ 6 1,126,268 350,657 1,204,989 12,009,111 131,721 628,873 Q2 7~ 9 1,087,635 329,102 1,346,472 13,284,624 123,008 576,134 Q310~12 1,175,045 339,492 1,426,913 14,288,393 120,572 543,315 Q4
30 年 1月 352,645 99,224 406,885 3,812,326 35,151 461,430 Jan. 2018 2 378,558 121,148 469,744 4,506,766 42,475 448,936 Feb. 3 426,418 119,889 460,981 4,521,846 45,829 488,881 Mar. 4 375,408 114,398 387,230 3,872,172 41,730 549,604 Apr. 5 347,969 119,795 398,808 3,915,751 43,822 574,738 May 6 402,891 116,464 418,951 4,221,188 46,169 628,873 Jun.
7 417,390 113,307 473,383 4,744,613 44,386 641,801 Jul. 8 300,674 115,647 451,384 4,373,393 42,858 563,884 Aug. 9 369,571 100,148 421,705 4,166,618 35,764 576,134 Sep.10 425,338 121,219 486,522 4,877,722 43,644 592,664 Oct.11 409,052 113,276 480,399 4,874,875 40,637 593,949 Nov.12 340,655 104,997 459,992 4,535,796 36,291 543,315 Dec.
モザイク (陶片) (50cm2以下のもの) (4)
Mosaic tiles (less than 50cm2)
Year, Quarter and Month
衛生用品 (5)~(8)Sanitary wares
Year, Quarter and Month

窯業/生産・出荷・在庫統計 69
1.生産・出荷・在庫統計 / Production, Shipment and Inventory
(2) 時系列表 / Historical Data by Commodities 3) 陶磁器(続き) / Ceramic wares (continued)
(単位:個)(Unit:n)
出 荷 Shipments
生産数量 受入数量 販 売 Sales その他 在庫数量(末)
年 月ProductionQuantity
ReceiptQuantity
数 量Quantity
金額(千円)Value
(thousand yen)
OthersQuantity
InventoryQuantity
平成 26 年 2,104,459 975,171 2,715,097 34,479,985 264,292 346,693 C.Y. 201427 2,102,729 922,607 2,766,714 34,830,350 260,421 340,001 201528 2,008,339 910,979 2,763,195 35,366,966 279,632 213,794 201629 2,032,563 1,022,278 2,786,915 36,534,195 255,453 226,052 201730 2,090,183 1,026,818 2,814,973 37,849,593 246,179 281,561 2018
平成 28 年度 2,006,820 966,900 2,736,684 35,405,452 266,757 211,926 F.Y. 201629 2,063,695 1,009,543 2,779,747 36,731,132 252,494 252,973 2017
30 年 1~ 3月 523,246 263,700 698,308 9,169,941 62,012 252,973 Q1 2018 4~ 6 520,232 263,484 624,378 8,652,251 64,353 347,576 Q2 7~ 9 499,624 244,619 728,200 9,661,877 60,357 303,262 Q310~12 547,081 255,015 764,087 10,365,524 59,457 281,561 Q4
30 年 1月 160,157 77,445 206,172 2,703,216 17,176 240,309 Jan. 2018 2 172,720 94,983 248,079 3,213,749 21,472 238,460 Feb. 3 190,369 91,272 244,057 3,252,976 23,364 252,973 Mar. 4 172,164 86,494 197,989 2,780,492 19,795 293,567 Apr. 5 160,972 89,252 206,585 2,813,589 20,020 317,184 May 6 187,096 87,738 219,804 3,058,170 24,538 347,576 Jun.
7 192,015 84,034 254,511 3,461,541 21,381 347,733 Jul. 8 139,890 85,312 244,613 3,165,634 21,179 307,143 Aug. 9 167,719 75,273 229,076 3,034,702 17,797 303,262 Sep.10 198,292 91,521 257,431 3,524,681 22,150 313,242 Oct.11 188,327 84,488 256,535 3,528,080 19,709 309,813 Nov.12 160,462 79,006 250,121 3,312,763 17,598 281,561 Dec.
(単位:個)(Unit:n)
出 荷 Shipments
生産数量 受入数量 販 売 Sales その他 在庫数量(末)
年 月ProductionQuantity
ReceiptQuantity
数 量Quantity
金額(千円)Value
(thousand yen)
OthersQuantity
InventoryQuantity
平成 26 年 1,928,529 974,834 2,543,679 30,539,280 263,031 331,897 C.Y. 201427 1,934,439 922,508 2,599,537 30,976,811 255,841 328,459 201528 1,848,808 910,880 2,601,570 31,169,101 279,170 204,914 201629 1,863,515 1,022,229 2,621,709 32,111,798 255,316 213,418 201730 1,924,881 1,026,810 2,649,528 33,627,434 246,091 269,150 2018
平成 28 年度 1,846,757 966,801 2,576,779 31,083,439 266,395 204,779 F.Y. 201629 1,892,179 1,009,494 2,611,413 32,280,478 252,466 242,623 2017
30 年 1~ 3月 479,689 263,700 652,473 7,983,844 62,006 242,623 Q1 2018 4~ 6 475,999 263,484 583,794 7,593,420 64,318 333,612 Q2 7~ 9 463,491 244,619 690,667 8,744,957 60,339 290,716 Q310~12 505,702 255,007 722,594 9,305,213 59,428 269,150 Q4
30 年 1月 146,633 77,445 191,851 2,337,844 17,174 228,474 Jan. 2018 2 158,581 94,983 232,484 2,813,916 21,469 228,084 Feb. 3 174,475 91,272 228,138 2,832,084 23,363 242,623 Mar. 4 158,337 86,494 184,691 2,435,913 19,782 282,701 Apr. 5 146,431 89,252 193,619 2,473,823 20,014 304,749 May 6 171,231 87,738 205,484 2,683,684 24,522 333,612 Jun.
7 178,198 84,034 240,610 3,123,978 21,368 333,866 Jul. 8 130,491 85,312 234,041 2,900,182 21,176 294,452 Aug. 9 154,802 75,273 216,016 2,720,797 17,795 290,716 Sep.10 183,112 91,521 242,369 3,132,795 22,141 300,587 Oct.11 173,700 84,480 242,562 3,169,887 19,700 296,505 Nov.12 148,890 79,006 237,663 3,002,531 17,587 269,150 Dec.
水洗式便器 (5)~(6)Water closet
Year, Quarter and Month
大便器 (5)Water closet squat type
Year, Quarter and Month

70 窯業/生産・出荷・在庫統計
1.生産・出荷・在庫統計 / Production, Shipment and Inventory
(2) 時系列表 / Historical Data by Commodities 3) 陶磁器(続き) / Ceramic wares (continued)
(単位:個)(Unit:n)
出 荷 Shipments
生産数量 受入数量 販 売 Sales その他 在庫数量(末)
年 月ProductionQuantity
ReceiptQuantity
数 量Quantity
金額(千円)Value
(thousand yen)
OthersQuantity
InventoryQuantity
平成 26 年 175,930 337 171,418 3,940,705 1,261 14,796 C.Y. 201427 168,290 99 167,177 3,853,539 4,580 11,542 201528 159,531 99 161,625 4,197,865 462 8,880 201629 169,048 49 165,206 4,422,397 137 12,634 201730 165,302 8 165,445 4,222,159 88 12,411 2018
平成 28 年度 160,063 99 159,905 4,322,013 362 7,147 F.Y. 201629 171,516 49 168,334 4,450,654 28 10,350 2017
30 年 1~ 3月 43,557 - 45,835 1,186,097 6 10,350 Q1 2018 4~ 6 44,233 - 40,584 1,058,831 35 13,964 Q2 7~ 9 36,133 - 37,533 916,920 18 12,546 Q310~12 41,379 8 41,493 1,060,311 29 12,411 Q4
30 年 1月 13,524 - 14,321 365,372 2 11,835 Jan. 2018 2 14,139 - 15,595 399,833 3 10,376 Feb. 3 15,894 - 15,919 420,892 1 10,350 Mar. 4 13,827 - 13,298 344,579 13 10,866 Apr. 5 14,541 - 12,966 339,766 6 12,435 May 6 15,865 - 14,320 374,486 16 13,964 Jun.
7 13,817 - 13,901 337,563 13 13,867 Jul. 8 9,399 - 10,572 265,452 3 12,691 Aug. 9 12,917 - 13,060 313,905 2 12,546 Sep.10 15,180 - 15,062 391,886 9 12,655 Oct.11 14,627 8 13,973 358,193 9 13,308 Nov.12 11,572 - 12,458 310,232 11 12,411 Dec.
(単位:個)(Unit:n)
出 荷 Shipments
生産数量 受入数量 販 売 Sales その他 在庫数量(末)
年 月ProductionQuantity
ReceiptQuantity
数 量Quantity
金額(千円)Value
(thousand yen)
OthersQuantity
InventoryQuantity
平成 26 年 1,133,803 427,727 1,313,259 6,109,063 247,272 177,432 C.Y. 201427 1,063,762 342,003 1,223,152 5,723,314 210,268 148,931 201528 1,018,731 240,693 1,091,605 5,299,310 209,154 107,923 201629 1,021,697 284,679 1,059,208 5,032,129 238,069 117,753 201730 978,963 292,921 1,041,421 5,524,458 223,477 125,081 2018
平成 28 年度 1,013,163 250,069 1,064,118 5,151,462 217,625 93,566 F.Y. 201629 1,019,887 283,297 1,054,619 5,092,441 234,043 108,779 2017
30 年 1~ 3月 249,330 67,373 270,375 1,349,460 55,259 108,779 Q1 2018 4~ 6 240,550 75,687 244,368 1,313,060 58,665 122,075 Q2 7~ 9 239,522 74,827 250,738 1,356,464 54,992 130,698 Q310~12 249,561 75,034 275,940 1,505,474 54,561 125,081 Q4
30 年 1月 78,250 18,761 86,585 405,369 16,068 112,109 Jan. 2018 2 80,191 23,080 91,901 470,892 19,011 104,488 Feb. 3 90,889 25,532 91,889 473,199 20,180 108,779 Mar. 4 80,953 23,663 81,504 435,546 19,266 112,715 Apr. 5 73,888 26,907 81,445 437,049 20,714 111,353 May 6 85,709 25,117 81,419 440,465 18,685 122,075 Jun.
7 93,776 25,312 88,126 481,612 19,553 133,484 Jul. 8 67,710 26,538 82,546 443,796 18,629 126,561 Aug. 9 78,036 22,977 80,066 431,056 16,810 130,698 Sep.10 88,515 27,009 92,892 510,026 20,017 133,610 Oct.11 87,055 25,913 96,543 536,861 18,861 131,167 Nov.12 73,991 22,112 86,505 458,587 15,683 125,081 Dec.
小便器 (6)Urinal
Year, Quarter and Month
洗面手洗器 (7)Lavatories and wash basins
Year, Quarter and Month

窯業/生産・出荷・在庫統計 71
1.生産・出荷・在庫統計 / Production, Shipment and Inventory
(2) 時系列表 / Historical Data by Commodities 3) 陶磁器(続き) / Ceramic wares (continued)
(単位:個)(Unit:n)
出 荷 Shipments
生産数量 受入数量 販 売 Sales その他 在庫数量(末)
年 月ProductionQuantity
ReceiptQuantity
数 量Quantity
金額(千円)Value
(thousand yen)
OthersQuantity
InventoryQuantity
平成 26 年 1,603,676 42,399 1,594,485 9,449,027 33,414 141,859 C.Y. 201427 1,513,426 54,484 1,501,715 9,234,644 44,063 163,472 201528 1,512,497 42,114 1,538,024 9,195,242 30,516 148,492 201629 1,522,716 42,234 1,578,258 9,555,290 28,091 107,795 201730 1,477,423 39,773 1,459,590 9,049,015 29,100 136,673 2018
平成 28 年度 1,508,532 39,346 1,554,106 9,251,627 27,462 100,076 F.Y. 201629 1,536,289 42,147 1,525,154 9,372,691 28,224 127,129 2017
30 年 1~ 3月 385,045 9,188 368,927 2,321,537 6,184 127,129 Q1 2018 4~ 6 365,486 11,486 336,243 2,043,800 8,703 159,222 Q2 7~ 9 348,489 9,656 367,534 2,266,283 7,659 142,174 Q310~12 378,403 9,443 386,886 2,417,395 6,554 136,673 Q4
30 年 1月 114,238 3,018 114,128 703,741 1,907 109,012 Jan. 2018 2 125,647 3,085 129,764 822,125 1,992 105,988 Feb. 3 145,160 3,085 125,035 795,671 2,285 127,129 Mar. 4 122,291 4,241 107,737 656,134 2,669 143,322 Apr. 5 113,109 3,636 110,778 665,113 3,088 146,201 May 6 130,086 3,609 117,728 722,553 2,946 159,222 Jun.
7 131,599 3,961 130,746 801,460 3,452 160,584 Jul. 8 93,074 3,797 124,225 763,963 3,050 130,180 Aug. 9 123,816 1,898 112,563 700,860 1,157 142,174 Sep.10 138,531 2,689 136,199 843,015 1,477 145,812 Oct.11 133,670 2,875 127,321 809,934 2,067 152,969 Nov.12 106,202 3,879 123,366 764,446 3,010 136,673 Dec.
(単位:kg) (Unit:kg)
出 荷 Shipments
生産数量 受入数量 販 売 Sales その他 在庫数量(末)
年 月ProductionQuantity
ReceiptQuantity
数 量Quantity
金額(千円)Value
(thousand yen)
OthersQuantity
InventoryQuantity
平成 26 年 43,571,384 1,198,832 45,299,101 26,287,768 529,666 9,253,044 C.Y. 201427 46,229,573 946,806 45,607,816 27,298,796 964,132 9,906,929 201528 44,395,780 1,221,922 44,099,500 25,360,194 938,547 9,277,702 201629 41,360,755 1,058,323 42,342,658 24,815,523 659,600 8,735,774 201730 37,437,034 1,005,280 40,488,850 25,034,445 842,041 6,170,671 2018
平成 28 年度 43,197,968 1,252,769 41,320,161 24,188,395 924,047 10,300,875 F.Y. 201629 40,562,220 906,596 42,788,297 24,766,307 576,665 8,469,687 2017
30 年 1~ 3月 9,183,474 197,012 9,495,176 5,761,820 173,510 8,469,687 Q1 2018 4~ 6 9,925,812 275,648 10,555,956 6,253,810 198,467 7,986,867 Q2 7~ 9 8,783,437 269,327 9,872,550 6,475,685 181,242 7,116,225 Q310~12 9,544,311 263,293 10,565,168 6,543,130 288,822 6,170,671 Q4
30 年 1月 2,480,246 66,512 3,138,303 1,793,792 65,950 8,076,774 Jan. 2018 2 3,193,558 60,788 3,153,931 1,956,933 88,255 8,089,644 Feb. 3 3,509,670 69,712 3,202,942 2,011,095 19,305 8,469,687 Mar. 4 3,326,024 88,998 4,639,174 2,803,474 83,820 7,157,217 Apr. 5 3,182,668 96,380 2,900,801 1,763,983 55,689 7,517,679 May 6 3,417,120 90,270 3,015,981 1,686,353 58,958 7,986,867 Jun.
7 3,171,188 84,761 3,413,859 2,385,136 20,529 7,861,120 Jul. 8 2,680,514 101,025 3,350,131 2,035,996 105,362 7,226,676 Aug. 9 2,931,735 83,541 3,108,560 2,054,553 55,351 7,116,225 Sep.10 3,396,046 75,092 3,097,083 2,084,697 127,142 7,391,728 Oct.11 3,233,603 102,438 3,808,492 2,335,680 50,502 6,905,564 Nov.12 2,914,662 85,763 3,659,593 2,122,753 111,178 6,170,671 Dec.
タンク・流し類 (8)Tanks and sinks
Year, Quarter and Month
電気用品 (9)~(11) Electrical porcelain insulators
Year, Quarter and Month

72 窯業/生産・出荷・在庫統計
1.生産・出荷・在庫統計 / Production, Shipment and Inventory
(2) 時系列表 / Historical Data by Commodities 3) 陶磁器(続き) / Ceramic wares (continued)
(単位:kg) (Unit:kg)
出 荷 Shipments
生産数量 受入数量 販 売 Sales その他 在庫数量(末)
年 月ProductionQuantity
ReceiptQuantity
数 量Quantity
金額(千円)Value
(thousand yen)
OthersQuantity
InventoryQuantity
平成 26 年 42,235,948 1,174,832 43,870,885 23,818,344 529,666 9,138,395 C.Y. 201427 44,915,998 922,806 44,188,233 24,317,790 964,132 9,799,412 201528 42,910,935 1,197,922 42,481,614 22,400,128 938,547 9,275,805 201629 39,777,071 1,034,323 40,776,578 21,690,006 659,600 8,616,818 201730 35,807,144 981,280 38,802,799 21,472,703 842,041 6,073,448 2018
平成 28 年度 41,630,672 1,228,769 39,637,116 21,211,627 924,047 10,286,349 F.Y. 201629 39,003,548 882,596 41,235,548 21,667,162 576,665 8,340,539 2017
30 年 1~ 3月 8,777,610 191,012 9,083,100 4,991,429 173,510 8,340,539 Q1 2018 4~ 6 9,502,585 269,648 10,104,097 5,335,348 198,467 7,880,337 Q2 7~ 9 8,374,429 263,327 9,459,128 5,520,768 181,242 7,008,079 Q310~12 9,152,520 257,293 10,156,474 5,625,158 288,822 6,073,448 Q4
30 年 1月 2,364,960 64,512 3,035,511 1,573,118 65,950 7,943,524 Jan. 2018 2 3,055,328 58,788 3,017,414 1,711,098 88,255 7,952,681 Feb. 3 3,357,322 67,712 3,030,175 1,707,213 19,305 8,340,539 Mar. 4 3,195,583 86,998 4,503,796 2,482,435 83,820 7,030,986 Apr. 5 3,046,922 94,380 2,738,017 1,457,404 55,689 7,416,491 May 6 3,260,080 88,270 2,862,284 1,395,509 58,958 7,880,337 Jun.
7 3,019,218 82,761 3,279,680 2,065,146 20,529 7,734,799 Jul. 8 2,553,800 99,025 3,204,895 1,711,333 105,362 7,116,847 Aug. 9 2,801,411 81,541 2,974,553 1,744,289 55,351 7,008,079 Sep.10 3,263,356 73,092 2,968,926 1,788,680 127,142 7,277,049 Oct.11 3,097,690 100,438 3,664,600 2,015,533 50,502 6,796,864 Nov.12 2,791,474 83,763 3,522,948 1,820,945 111,178 6,073,448 Dec.
(単位:kg) (Unit:kg)
出 荷 Shipments
生産数量 受入数量 販 売 Sales その他 在庫数量(末)
年 月ProductionQuantity
ReceiptQuantity
数 量Quantity
金額(千円)Value
(thousand yen)
OthersQuantity
InventoryQuantity
平成 26 年 17,089,479 205,050 17,660,720 10,576,052 380,175 5,242,999 C.Y. 201427 16,979,231 163,036 16,081,353 10,911,080 884,407 5,404,972 201528 15,260,815 257,155 14,548,541 9,205,862 930,030 5,295,624 201629 14,791,539 268,631 15,737,857 9,309,372 653,239 3,947,591 201730 13,854,048 239,527 14,164,508 9,281,259 835,395 3,021,951 2018
平成 28 年度 14,848,123 273,553 12,732,682 8,429,628 915,900 6,100,872 F.Y. 201629 14,968,177 260,867 16,139,231 9,277,787 570,593 4,604,816 2017
30 年 1~ 3月 3,650,265 53,405 2,873,465 1,879,259 171,857 4,604,816 Q1 2018 4~ 6 3,731,955 63,453 4,149,474 2,515,470 196,697 4,048,793 Q2 7~ 9 2,946,341 63,691 3,310,834 2,462,565 180,182 3,565,474 Q310~12 3,525,487 58,978 3,830,735 2,423,965 286,659 3,021,951 Q4
30 年 1月 882,499 15,466 1,091,656 613,711 65,131 3,687,863 Jan. 2018 2 1,341,043 14,290 946,989 681,969 87,824 4,007,736 Feb. 3 1,426,723 23,649 834,820 583,579 18,902 4,604,816 Mar. 4 1,258,631 19,517 2,535,238 1,550,111 83,265 3,260,671 Apr. 5 1,090,598 24,297 691,615 477,716 55,055 3,628,551 May 6 1,382,726 19,639 922,621 487,643 58,377 4,048,793 Jun.
7 1,066,059 16,705 1,048,333 942,751 20,200 4,061,643 Jul. 8 780,625 30,280 1,286,280 782,539 104,788 3,479,430 Aug. 9 1,099,657 16,706 976,221 737,275 55,194 3,565,474 Sep.10 1,363,899 9,153 878,017 706,455 126,765 3,926,244 Oct.11 1,160,577 30,755 1,375,171 852,778 49,511 3,691,487 Nov.12 1,001,011 19,070 1,577,547 864,732 110,383 3,021,951 Dec.
がい子 (がい管を含む) (9)~(10)Insulators (including hollow porcelains)
Year, Quarter and Month
特別高圧用 (9)Extra-high voltage
Year, Quarter and Month

窯業/生産・出荷・在庫統計 73
1.生産・出荷・在庫統計 / Production, Shipment and Inventory
(2) 時系列表 / Historical Data by Commodities 3) 陶磁器(続き) / Ceramic wares (continued)
(単位:kg) (Unit:kg)
出 荷 Shipments
生産数量 受入数量 販 売 Sales その他 在庫数量(末)
年 月ProductionQuantity
ReceiptQuantity
数 量Quantity
金額(千円)Value
(thousand yen)
OthersQuantity
InventoryQuantity
平成 26 年 25,146,469 969,782 26,210,165 13,242,292 149,491 3,895,396 C.Y. 201427 27,936,767 759,770 28,106,880 13,406,710 79,725 4,394,440 201528 27,650,120 940,767 27,933,073 13,194,266 8,517 3,980,181 201629 24,985,532 765,692 25,038,721 12,380,634 6,361 4,669,227 201730 21,953,096 741,753 24,638,291 12,191,444 6,646 3,051,497 2018
平成 28 年度 26,782,549 955,216 26,904,434 12,781,999 8,147 4,185,477 F.Y. 201629 24,035,371 621,729 25,096,317 12,389,375 6,072 3,735,723 2017
30 年 1~ 3月 5,127,345 137,607 6,209,635 3,112,170 1,653 3,735,723 Q1 2018 4~ 6 5,770,630 206,195 5,954,623 2,819,878 1,770 3,831,544 Q2 7~ 9 5,428,088 199,636 6,148,294 3,058,203 1,060 3,442,605 Q310~12 5,627,033 198,315 6,325,739 3,201,193 2,163 3,051,497 Q4
30 年 1月 1,482,461 49,046 1,943,855 959,407 819 4,255,661 Jan. 2018 2 1,714,285 44,498 2,070,425 1,029,129 431 3,944,945 Feb. 3 1,930,599 44,063 2,195,355 1,123,634 403 3,735,723 Mar. 4 1,936,952 67,481 1,968,558 932,324 555 3,770,315 Apr. 5 1,956,324 70,083 2,046,402 979,688 634 3,787,940 May 6 1,877,354 68,631 1,939,663 907,866 581 3,831,544 Jun.
7 1,953,159 66,056 2,231,347 1,122,395 329 3,673,156 Jul. 8 1,773,175 68,745 1,918,615 928,794 574 3,637,417 Aug. 9 1,701,754 64,835 1,998,332 1,007,014 157 3,442,605 Sep.10 1,899,457 63,939 2,090,909 1,082,225 377 3,350,805 Oct.11 1,937,113 69,683 2,289,429 1,162,755 991 3,105,377 Nov.12 1,790,463 64,693 1,945,401 956,213 795 3,051,497 Dec.
(単位:kg) (Unit:kg)
出 荷 Shipments
生産数量 受入数量 販 売 Sales その他 在庫数量(末)
年 月ProductionQuantity
ReceiptQuantity
数 量Quantity
金額(千円)Value
(thousand yen)
OthersQuantity
InventoryQuantity
平成 26 年 1,335,436 24,000 1,428,216 2,469,424 - 114,649 C.Y. 201427 1,313,575 24,000 1,419,583 2,981,006 - 107,517 201528 1,484,845 24,000 1,617,886 2,960,066 - 1,897 201629 1,583,684 24,000 1,566,080 3,125,517 - 118,956 201730 1,629,890 24,000 1,686,051 3,561,742 - 97,223 2018
平成 28 年度 1,567,296 24,000 1,683,045 2,976,768 - 14,526 F.Y. 201629 1,558,672 24,000 1,552,749 3,099,145 - 129,148 2017
30 年 1~ 3月 405,864 6,000 412,076 770,391 - 129,148 Q1 2018 4~ 6 423,227 6,000 451,859 918,462 - 106,530 Q2 7~ 9 409,008 6,000 413,422 954,917 - 108,146 Q310~12 391,791 6,000 408,694 917,972 - 97,223 Q4
30 年 1月 115,286 2,000 102,792 220,674 - 133,250 Jan. 2018 2 138,230 2,000 136,517 245,835 - 136,963 Feb. 3 152,348 2,000 172,767 303,882 - 129,148 Mar. 4 130,441 2,000 135,378 321,039 - 126,231 Apr. 5 135,746 2,000 162,784 306,579 - 101,188 May 6 157,040 2,000 153,697 290,844 - 106,530 Jun.
7 151,970 2,000 134,179 319,990 - 126,321 Jul. 8 126,714 2,000 145,236 324,663 - 109,829 Aug. 9 130,324 2,000 134,007 310,264 - 108,146 Sep.10 132,690 2,000 128,157 296,017 - 114,679 Oct.11 135,913 2,000 143,892 320,147 - 108,700 Nov.12 123,188 2,000 136,645 301,808 - 97,223 Dec.
高・低圧用 (10)High and low voltage
Year, Quarter and Month
その他の電気用品 (11)Other electrical porcelain insulators
Year, Quarter and Month

74 窯業/生産・出荷・在庫統計
1.生産・出荷・在庫統計 / Production, Shipment and Inventory
(2) 時系列表 / Historical Data by Commodities 3) 陶磁器(続き) / Ceramic wares (continued)
(単位:kg) (Unit:kg)
年 月数 量
Quantity
金額(千円)Value
(thousand yen)
数 量Quantity
金額(千円)Value
(thousand yen)
数 量Quantity
金額(千円)Value
(thousand yen)
平成 26 年 56,482,331 26,599,055 54,652,138 24,912,856 40,887,182 18,200,566 C.Y. 201427 49,713,397 26,992,765 47,671,579 25,017,303 34,692,502 18,207,487 201528 50,086,071 27,388,237 47,826,630 25,166,228 34,836,793 18,199,328 201629 48,812,507 26,859,001 46,213,395 25,094,890 34,435,841 18,190,498 201730 44,946,912 25,292,896 42,267,387 23,652,960 31,873,089 17,343,908 2018
平成 28 年度 49,818,972 27,298,644 47,526,338 25,198,179 34,590,116 18,171,380 F.Y. 201629 48,086,644 26,567,697 45,422,456 24,823,804 33,882,837 18,029,727 2017
30 年 1~ 3月 11,282,767 6,265,853 10,644,570 5,888,771 7,897,590 4,282,953 Q1 2018 4~ 6 11,344,993 6,472,338 10,662,733 6,053,933 8,029,906 4,446,255 Q2 7~ 9 10,577,523 5,969,691 9,925,500 5,575,074 7,601,204 4,097,329 Q310~12 11,741,629 6,585,014 11,034,584 6,135,182 8,344,389 4,517,371 Q4
30 年 1月 3,266,057 1,879,079 3,079,394 1,780,442 2,296,880 1,294,501 Jan. 2018 2 3,777,367 2,087,443 3,554,368 1,948,005 2,674,936 1,419,790 Feb. 3 4,239,343 2,299,331 4,010,808 2,160,324 2,925,774 1,568,662 Mar. 4 3,936,273 2,245,616 3,710,861 2,105,058 2,777,600 1,556,007 Apr. 5 3,520,133 2,061,028 3,301,283 1,931,918 2,493,969 1,414,708 May 6 3,888,587 2,165,694 3,650,589 2,016,957 2,758,337 1,475,540 Jun.
7 3,759,065 2,055,769 3,534,599 1,919,010 2,720,879 1,398,219 Jul. 8 3,172,785 1,918,687 2,967,005 1,796,638 2,248,080 1,322,416 Aug. 9 3,645,673 1,995,235 3,423,896 1,859,426 2,632,245 1,376,694 Sep.10 4,058,619 2,213,532 3,813,583 2,055,957 2,880,675 1,500,863 Oct.11 4,036,969 2,244,988 3,803,428 2,097,519 2,896,459 1,536,889 Nov.12 3,646,041 2,126,494 3,417,573 1,981,706 2,567,255 1,479,619 Dec.
(単位:kg) (Unit:kg)
年 月数 量
Quantity
金額(千円)Value
(thousand yen)
数 量Quantity
金額(千円)Value
(thousand yen)
数 量Quantity
金額(千円)Value
(thousand yen)
平成 26 年 13,764,956 6,712,290 1,830,193 1,686,199 1,484,827 2,213,481 C.Y. 201427 12,979,077 6,809,816 2,041,818 1,975,462 1,221,249 1,991,390 201528 12,989,837 6,966,900 2,259,441 2,222,009 1,187,478 1,763,488 201629 11,777,554 6,904,392 2,599,112 1,764,111 1,153,496 1,926,003 201730 10,394,298 6,309,052 2,679,525 1,639,936 908,821 1,907,652 2018
平成 28 年度 12,936,222 7,026,799 2,292,634 2,100,465 1,138,359 1,768,025 F.Y. 201629 11,539,619 6,794,077 2,664,188 1,743,893 1,144,967 1,904,487 2017
30 年 1~ 3月 2,746,980 1,605,818 638,197 377,082 237,889 401,634 Q1 2018 4~ 6 2,632,827 1,607,678 682,260 418,405 224,081 521,100 Q2 7~ 9 2,324,296 1,477,745 652,023 394,617 224,895 507,497 Q310~12 2,690,195 1,617,811 707,045 449,832 221,956 477,421 Q4
30 年 1月 782,514 485,941 186,663 98,637 74,844 125,935 Jan. 2018 2 879,432 528,215 222,999 139,438 75,432 128,719 Feb. 3 1,085,034 591,662 228,535 139,007 87,613 146,980 Mar. 4 933,261 549,051 225,412 140,558 82,492 211,983 Apr. 5 807,314 517,210 218,850 129,110 66,203 185,558 May 6 892,252 541,417 237,998 148,737 75,386 123,559 Jun.
7 813,720 520,791 224,466 136,759 80,910 124,616 Jul. 8 718,925 474,222 205,780 122,049 71,940 190,915 Aug. 9 791,651 482,732 221,777 135,809 72,045 191,966 Sep.10 932,908 555,094 245,036 157,575 73,489 160,963 Oct.11 906,969 560,630 233,541 147,469 76,635 160,126 Nov.12 850,318 502,087 228,468 144,788 71,832 156,332 Dec.
飲食器 (12)~(13)Ceramic tablewares
和飲食器 (12)Japanese style tablewares
生産 Production 生産 Production
Year, Quarter and Month
その他の台所・食卓用品 (14)Other ceramic tablewares and
kitchenwares
玩具・置物 (15)Toys and ornamental wares
台所・食卓用品 (12)~(14)Ceramic wares for tablewares and
kitchenwares
生産 Production
生産 Production 生産 Production 生産 Production
Year, Quarter and Month
洋飲食器 (13)Foreign style tablewares

窯業/生産・出荷・在庫統計 75
1.生産・出荷・在庫統計 / Production, Shipment and Inventory
(2) 時系列表 / Historical Data by Commodities 4) ファインセラミックス / Fine ceramics
(単位:1000個)(Unit:1000n)
出 荷 Shipments
生産数量 販 売 Sales その他 在庫数量(末)
年 月ProductionQuantity
数 量Quantity
金額(百万円)Value
(millions yen)
OthersQuantity
InventoryQuantity
平成 26 年 31,143,302 30,949,054 401,655 9,483 1,277,846 C.Y. 201427 31,721,503 31,868,858 448,903 5,112 1,140,415 201528 32,060,996 32,445,824 475,061 2,475 757,503 201629 32,259,639 32,047,108 487,361 1,355 981,123 201730 34,160,523 33,868,450 497,207 1,463 1,278,353 2018
平成 28 年度 32,399,754 32,925,228 483,181 1,796 626,138 F.Y. 201629 32,663,681 32,231,203 488,326 1,294 1,084,416 2017
30 年 1~ 3月 7,823,290 7,724,976 117,551 275 1,084,416 Q1 2018 4~ 6 8,952,169 8,755,221 126,814 380 1,289,892 Q2 7~ 9 9,134,520 9,191,412 129,147 386 1,236,767 Q310~12 8,250,544 8,196,841 123,695 422 1,278,353 Q4
30 年 1月 2,599,801 2,509,592 36,902 88 1,072,770 Jan. 2018 2 2,318,744 2,409,592 36,138 87 983,778 Feb. 3 2,904,745 2,805,792 44,511 100 1,084,416 Mar. 4 2,974,404 2,964,977 42,645 131 1,095,838 Apr. 5 2,883,744 2,858,574 41,155 121 1,123,841 May 6 3,094,021 2,931,670 43,014 128 1,289,892 Jun.
7 3,146,736 3,139,690 43,629 103 1,299,399 Jul. 8 3,028,667 3,076,946 42,947 100 1,253,406 Aug. 9 2,959,117 2,974,776 42,571 183 1,236,767 Sep.10 2,950,085 3,078,736 45,275 148 1,107,082 Oct.11 2,632,954 2,547,430 39,955 180 1,190,416 Nov.12 2,667,505 2,570,675 38,465 94 1,278,353 Dec.
(単位:1000個)(Unit:1000n)
出 荷 Shipments
生産数量 販 売 Sales その他 在庫数量(末)
年 月ProductionQuantity
数 量Quantity
金額(百万円)Value
(millions yen)
OthersQuantity
InventoryQuantity
平成 26 年 10,879,965 10,864,517 126,156 - 732,872 C.Y. 201427 11,102,873 10,990,871 129,939 - 849,311 201528 11,834,093 12,240,751 129,693 - 439,645 201629 12,174,860 12,020,721 141,268 - 593,503 201730 13,331,132 13,121,415 136,777 - 803,234 2018
平成 28 年度 12,311,146 12,746,917 135,221 - 410,807 F.Y. 201629 11,920,791 11,672,254 137,787 - 659,340 2017
30 年 1~ 3月 2,927,964 2,862,125 30,950 - 659,340 Q1 2018 4~ 6 3,470,087 3,295,668 32,496 - 833,776 Q2 7~ 9 3,560,967 3,548,661 37,460 - 846,082 Q310~12 3,372,114 3,414,961 35,871 - 803,234 Q4
30 年 1月 1,069,657 982,906 10,817 - 680,253 Jan. 2018 2 842,521 916,522 9,542 - 606,251 Feb. 3 1,015,786 962,697 10,591 - 659,340 Mar. 4 1,130,587 1,106,058 10,873 - 683,885 Apr. 5 1,149,487 1,105,058 10,663 - 728,315 May 6 1,190,013 1,084,552 10,960 - 833,776 Jun.
7 1,210,197 1,118,960 12,263 - 925,012 Jul. 8 1,185,165 1,228,847 12,621 - 881,332 Aug. 9 1,165,605 1,200,854 12,576 - 846,082 Sep.10 1,098,399 1,235,734 13,286 - 708,747 Oct.11 1,148,785 1,074,484 11,752 - 783,047 Nov.12 1,124,930 1,104,743 10,833 - 803,234 Dec.
機能材 (1)~(7)For functional use
Year, Quarter and Month
パッケージ (1)~(2)Ceramic packages
Year, Quarter and Month

76 窯業/生産・出荷・在庫統計
1.生産・出荷・在庫統計 / Production, Shipment and Inventory
(2) 時系列表 / Historical Data by Commodities 4) ファインセラミックス(続き) / Fine ceramics (continued)
(単位:1000個)(Unit:1000n)
出 荷 Shipments
生産数量 販 売 Sales その他 在庫数量(末)
年 月ProductionQuantity
数 量Quantity
金額(百万円)Value
(millions yen)
OthersQuantity
InventoryQuantity
平成 26 年 42,626 42,855 12,181 - 1,685 C.Y. 201427 38,458 37,112 11,005 - 3,043 201528 43,745 44,851 10,441 - 1,934 201629 42,683 43,026 10,459 - 1,592 201730 54,131 52,516 13,016 - 3,205 2018
平成 28 年度 41,488 42,596 10,580 - 2,321 F.Y. 201629 42,696 42,928 10,258 - 2,089 2017
30 年 1~ 3月 10,464 9,965 2,438 - 2,089 Q1 2018 4~ 6 14,268 13,694 3,263 - 2,663 Q2 7~ 9 14,614 14,543 3,636 - 2,733 Q310~12 14,785 14,314 3,679 - 3,205 Q4
30 年 1月 3,666 3,325 864 - 1,932 Jan. 2018 2 3,363 3,345 713 - 1,950 Feb. 3 3,435 3,295 861 - 2,089 Mar. 4 4,623 4,114 1,032 - 2,598 Apr. 5 4,431 4,257 1,083 - 2,772 May 6 5,214 5,323 1,148 - 2,663 Jun.
7 4,984 5,063 1,215 - 2,583 Jul. 8 4,883 4,810 1,149 - 2,657 Aug. 9 4,747 4,670 1,272 - 2,733 Sep.10 5,252 5,137 1,394 - 2,848 Oct.11 4,876 4,881 1,245 - 2,843 Nov.12 4,657 4,296 1,040 - 3,205 Dec.
(単位:1000個)(Unit:1000n)
出 荷 Shipments
生産数量 販 売 Sales その他 在庫数量(末)
年 月ProductionQuantity
数 量Quantity
金額(百万円)Value
(millions yen)
OthersQuantity
InventoryQuantity
平成 26 年 10,837,339 10,821,662 113,975 - 731,187 C.Y. 201427 11,064,415 10,953,759 118,934 - 846,268 201528 11,790,348 12,195,900 119,252 - 437,711 201629 12,132,177 11,977,695 130,809 - 591,911 201730 13,277,001 13,068,899 123,761 - 800,029 2018
平成 28 年度 12,269,658 12,704,321 124,641 - 408,486 F.Y. 201629 11,878,095 11,629,326 127,529 - 657,251 2017
30 年 1~ 3月 2,917,500 2,852,160 28,512 - 657,251 Q1 2018 4~ 6 3,455,819 3,281,974 29,233 - 831,113 Q2 7~ 9 3,546,353 3,534,118 33,824 - 843,349 Q310~12 3,357,329 3,400,647 32,192 - 800,029 Q4
30 年 1月 1,065,991 979,581 9,953 - 678,321 Jan. 2018 2 839,158 913,177 8,829 - 604,301 Feb. 3 1,012,351 959,402 9,730 - 657,251 Mar. 4 1,125,964 1,101,944 9,841 - 681,287 Apr. 5 1,145,056 1,100,801 9,580 - 725,543 May 6 1,184,799 1,079,229 9,812 - 831,113 Jun.
7 1,205,213 1,113,897 11,048 - 922,429 Jul. 8 1,180,282 1,224,037 11,472 - 878,675 Aug. 9 1,160,858 1,196,184 11,304 - 843,349 Sep.10 1,093,147 1,230,597 11,892 - 705,899 Oct.11 1,143,909 1,069,603 10,507 - 780,204 Nov.12 1,120,273 1,100,447 9,793 - 800,029 Dec.
集積回路用パッケージ (1)For integrated circuits use
Year, Quarter and Month
機能回路用パッケージ (2)For functional circuits use
Year, Quarter and Month

窯業/生産・出荷・在庫統計 77
1.生産・出荷・在庫統計 / Production, Shipment and Inventory
(2) 時系列表 / Historical Data by Commodities 4) ファインセラミックス(続き) / Fine ceramics (continued)
(単位:1000個)(Unit:1000n)
出 荷 Shipments
生産数量 販 売 Sales その他 在庫数量(末)
年 月ProductionQuantity
数 量Quantity
金額(百万円)Value
(millions yen)
OthersQuantity
InventoryQuantity
平成 26 年 8,562,079 8,369,809 14,519 9,019 414,699 C.Y. 201427 8,160,494 8,443,952 16,212 4,653 149,009 201528 4,935,818 4,913,803 15,517 1,823 196,470 201629 5,096,943 5,035,992 16,099 1,028 284,212 201730 4,762,011 4,766,424 16,586 1,055 303,495 2018
平成 28 年度 4,710,451 4,792,138 15,623 1,176 132,884 F.Y. 201629 5,303,112 5,174,516 16,159 945 288,882 2017
30 年 1~ 3月 1,220,407 1,221,494 3,933 182 288,882 Q1 2018 4~ 6 1,237,554 1,173,335 4,177 271 359,538 Q2 7~ 9 1,139,457 1,233,178 4,227 273 271,328 Q310~12 1,164,593 1,138,417 4,249 329 303,495 Q4
30 年 1月 384,978 399,184 1,300 64 271,481 Jan. 2018 2 413,985 439,578 1,220 51 247,781 Feb. 3 421,444 382,732 1,413 67 288,882 Mar. 4 383,921 392,913 1,398 94 282,022 Apr. 5 409,653 418,446 1,370 76 275,321 May 6 443,980 361,976 1,409 101 359,538 Jun.
7 363,400 443,473 1,440 60 281,481 Jul. 8 376,751 391,417 1,416 68 268,832 Aug. 9 399,306 398,288 1,371 145 271,328 Sep.10 388,441 401,403 1,443 118 260,295 Oct.11 382,641 384,471 1,440 149 260,958 Nov.12 393,511 352,543 1,366 62 303,495 Dec.
(単位:1000個)(Unit:1000n)
出 荷 Shipments
生産数量 販 売 Sales その他 在庫数量(末)
年 月ProductionQuantity
数 量Quantity
金額(百万円)Value
(millions yen)
OthersQuantity
InventoryQuantity
平成 26 年 10,827,004 10,861,021 121,250 270 60,219 C.Y. 201427 11,628,182 11,623,955 154,052 293 60,340 201528 14,422,829 14,405,727 181,234 309 77,120 201629 14,152,685 14,154,213 163,505 327 74,963 201730 15,250,092 15,168,012 153,587 408 133,445 2018
平成 28 年度 14,524,242 14,518,539 179,651 304 56,772 F.Y. 201629 14,593,400 14,538,777 161,884 349 110,756 2017
30 年 1~ 3月 3,465,171 3,429,303 35,778 93 110,756 Q1 2018 4~ 6 4,029,535 4,066,026 40,911 109 74,899 Q2 7~ 9 4,230,290 4,210,455 41,541 113 91,047 Q310~12 3,525,096 3,462,228 35,357 93 133,445 Q4
30 年 1月 1,079,574 1,060,670 11,326 24 93,842 Jan. 2018 2 993,415 983,941 10,541 36 103,280 Feb. 3 1,392,182 1,384,692 13,911 33 110,756 Mar. 4 1,386,356 1,392,358 13,948 37 104,712 Apr. 5 1,255,310 1,261,396 12,832 45 98,582 May 6 1,387,869 1,412,272 14,131 27 74,899 Jun.
7 1,502,318 1,507,035 14,623 43 70,296 Jul. 8 1,398,426 1,389,730 13,855 32 78,410 Aug. 9 1,329,546 1,313,690 13,063 38 91,047 Sep.10 1,393,296 1,380,230 13,646 30 100,253 Oct.11 1,038,684 1,025,602 10,500 31 107,910 Nov.12 1,093,116 1,056,396 11,211 32 133,445 Dec.
基板 (白基板) (3)Ceramic substrates
Year, Quarter and Month
圧電機能素子 (4)Piezoelectric ceramic devices
Year, Quarter and Month

78 窯業/生産・出荷・在庫統計
1.生産・出荷・在庫統計 / Production, Shipment and Inventory
(2) 時系列表 / Historical Data by Commodities 4) ファインセラミックス(続き) / Fine ceramics (continued)
(単位:1000個)(Unit:1000n)
出 荷 Shipments
生産数量 販 売 Sales その他 在庫数量(末)
年 月ProductionQuantity
数 量Quantity
金額(百万円)Value
(millions yen)
OthersQuantity
InventoryQuantity
平成 26 年 451,151 439,094 121,356 194 47,611 C.Y. 201427 474,611 468,958 125,075 166 48,606 201528 492,673 498,067 123,547 343 24,450 201629 365,274 365,910 130,459 - 9,403 201730 355,743 361,733 148,694 - 9,422 2018
平成 28 年度 455,337 466,127 125,588 316 9,766 F.Y. 201629 366,202 366,531 133,957 - 9,309 2017
30 年 1~ 3月 89,481 89,453 36,548 - 9,309 Q1 2018 4~ 6 90,994 93,015 38,091 - 8,838 Q2 7~ 9 87,528 88,697 35,803 - 9,703 Q310~12 87,740 90,568 38,252 - 9,422 Q4
30 年 1月 27,785 27,168 10,288 - 10,020 Jan. 2018 2 29,468 28,607 11,692 - 10,881 Feb. 3 32,228 33,678 14,568 - 9,309 Mar. 4 31,711 31,837 12,675 - 9,177 Apr. 5 29,197 30,391 12,552 - 8,769 May 6 30,086 30,787 12,864 - 8,838 Jun.
7 29,479 28,956 11,502 - 9,699 Jul. 8 28,674 29,397 11,828 - 9,829 Aug. 9 29,375 30,344 12,473 - 9,703 Sep.10 29,865 31,261 13,426 - 9,206 Oct.11 29,979 30,171 12,802 - 9,766 Nov.12 27,896 29,136 12,024 - 9,422 Dec.
(単位:1000個)(Unit:1000n)
出 荷 Shipments
生産数量 販 売 Sales その他 在庫数量(末)
年 月ProductionQuantity
数 量Quantity
金額(百万円)Value
(millions yen)
OthersQuantity
InventoryQuantity
平成 26 年 268 246 6,044 - 140 C.Y. 201427 249 242 6,076 - 141 201528 236 233 6,610 - 147 201629 230 221 6,522 - 142 201730 202 213 6,731 - 131 2018
平成 28 年度 235 232 6,770 - 148 F.Y. 201629 223 216 6,320 - 143 2017
30 年 1~ 3月 55 54 1,531 - 143 Q1 2018 4~ 6 48 53 1,704 - 138 Q2 7~ 9 47 54 1,732 - 132 Q310~12 52 52 1,764 - 131 Q4
30 年 1月 19 16 486 - 144 Jan. 2018 2 15 17 483 - 142 Feb. 3 21 21 562 - 143 Mar. 4 12 16 581 - 140 Apr. 5 20 18 545 - 141 May 6 16 19 578 - 138 Jun.
7 20 20 581 - 138 Jul. 8 11 17 592 - 132 Aug. 9 16 17 559 - 132 Sep.10 17 17 578 - 131 Oct.11 15 17 569 - 129 Nov.12 20 18 617 - 131 Dec.
ガスセンサ素子 (5)Gas sensor devices
Year, Quarter and Month
生体用部材 (6)Bioceramics
Year, Quarter and Month

窯業/生産・出荷・在庫統計 79
1.生産・出荷・在庫統計 / Production, Shipment and Inventory
(2) 時系列表 / Historical Data by Commodities 4) ファインセラミックス(続き) / Fine ceramics (continued)
(単位:1000個)(Unit:1000n)
出 荷 Shipments
生産数量 販 売 Sales その他 在庫数量(末)
年 月ProductionQuantity
数 量Quantity
金額(百万円)Value
(millions yen)
OthersQuantity
InventoryQuantity
平成 26 年 422,835 414,367 12,330 - 22,305 C.Y. 201427 355,094 340,880 17,549 - 33,008 201528 375,347 387,243 18,460 - 19,671 201629 469,647 470,051 29,508 - 18,900 201730 461,343 450,653 34,832 - 28,626 2018
平成 28 年度 398,343 401,275 20,328 - 15,761 F.Y. 201629 479,953 478,909 32,219 - 15,986 2017
30 年 1~ 3月 120,212 122,547 8,811 - 15,986 Q1 2018 4~ 6 123,951 127,124 9,435 - 12,703 Q2 7~ 9 116,231 110,367 8,384 - 18,475 Q310~12 100,949 90,615 8,202 - 28,626 Q4
30 年 1月 37,788 39,648 2,685 - 17,030 Jan. 2018 2 39,340 40,927 2,660 - 15,443 Feb. 3 43,084 41,972 3,466 - 15,986 Mar. 4 41,817 41,795 3,170 - 15,902 Apr. 5 40,077 43,265 3,193 - 12,713 May 6 42,057 42,064 3,072 - 12,703 Jun.
7 41,322 41,246 3,220 - 12,773 Jul. 8 39,640 37,538 2,635 - 14,871 Aug. 9 35,269 31,583 2,529 - 18,475 Sep.10 40,067 30,091 2,896 - 28,450 Oct.11 32,850 32,685 2,892 - 28,606 Nov.12 28,032 27,839 2,414 - 28,626 Dec.
(単位:1000個)(Unit:1000n)
出 荷 Shipments
生産数量 販 売 Sales その他 在庫数量(末)
年 月ProductionQuantity
数 量Quantity
金額(百万円)Value
(millions yen)
OthersQuantity
InventoryQuantity
平成 26 年 1,341,704 1,312,716 128,717 41,606 47,025 C.Y. 201427 1,181,007 1,161,098 136,393 29,196 37,377 201528 1,309,045 1,283,294 142,415 26,982 36,687 201629 1,496,053 1,462,861 173,524 30,279 56,326 201730 1,486,764 1,464,005 199,741 28,992 61,152 2018
平成 28 年度 1,361,581 1,344,795 147,685 27,319 45,142 F.Y. 201629 1,501,555 1,462,616 180,345 30,711 58,846 2017
30 年 1~ 3月 385,835 379,559 48,055 7,651 58,846 Q1 2018 4~ 6 376,085 363,971 48,814 7,770 63,376 Q2 7~ 9 348,154 351,553 49,771 6,994 55,488 Q310~12 376,690 368,922 53,101 6,577 61,152 Q4
30 年 1月 113,266 108,206 15,157 2,838 60,983 Jan. 2018 2 121,828 120,296 15,778 2,435 59,977 Feb. 3 150,741 151,057 17,120 2,378 58,846 Mar. 4 129,663 121,973 16,132 2,099 63,610 Apr. 5 118,945 116,149 15,897 3,167 64,324 May 6 127,477 125,849 16,785 2,504 63,376 Jun.
7 119,488 118,415 17,600 2,351 61,974 Jul. 8 111,009 114,166 16,461 1,792 58,530 Aug. 9 117,657 118,972 15,710 2,851 55,488 Sep.10 125,332 123,038 18,211 1,922 57,699 Oct.11 125,448 120,803 17,944 2,682 60,814 Nov.12 125,910 125,081 16,946 1,973 61,152 Dec.
その他の機能材 (7)Other ceramic products for functional use
Year, Quarter and Month
構造材 (除く触媒担体・セラミックフィルタ) (9)~(12)For structural use (except ceramic catalyst supports and ceramic filter)
Year, Quarter and Month

80 窯業/生産・出荷・在庫統計
1.生産・出荷・在庫統計 / Production, Shipment and Inventory
(2) 時系列表 / Historical Data by Commodities 4) ファインセラミックス(続き) / Fine ceramics (continued)
(単位: kg)(Unit: kg)
出 荷 Shipments
生産数量 販 売 Sales その他 在庫数量(末)
年 月ProductionQuantity
数 量Quantity
金額(百万円)Value
(millions yen)
OthersQuantity
InventoryQuantity
平成 26 年 15,310,380 15,287,162 54,989 104,605 1,218,473 C.Y. 201427 15,470,799 15,362,062 53,742 61,807 1,272,606 201528 16,435,324 15,932,298 57,221 71,466 1,711,370 201629 16,627,600 16,799,510 55,191 111,112 1,435,547 201730 16,449,127 16,083,173 55,358 85,886 1,710,658 2018
平成 28 年度 16,682,635 16,453,094 57,665 83,106 1,394,457 F.Y. 201629 16,292,394 16,187,521 54,886 103,183 1,392,862 2017
30 年 1~ 3月 3,930,365 3,935,113 14,260 29,253 1,392,862 Q1 2018 4~ 6 3,926,347 3,701,722 12,908 4,533 1,609,989 Q2 7~ 9 4,190,827 4,071,883 14,041 12,002 1,748,693 Q310~12 4,401,588 4,374,455 14,149 40,098 1,710,658 Q4
30 年 1月 1,250,487 1,271,324 4,726 9,604 1,405,705 Jan. 2018 2 1,175,482 1,278,668 4,675 13,389 1,289,704 Feb. 3 1,504,396 1,385,121 4,859 6,260 1,392,862 Mar. 4 1,281,243 1,235,011 4,242 4,063 1,422,688 Apr. 5 1,214,708 1,182,057 4,245 470 1,463,676 May 6 1,430,396 1,284,654 4,421 - 1,609,989 Jun.
7 1,513,365 1,381,167 4,764 - 1,724,393 Jul. 8 1,375,526 1,335,044 4,658 4,056 1,796,499 Aug. 9 1,301,936 1,355,672 4,619 7,946 1,748,693 Sep.10 1,395,867 1,440,806 4,793 8,900 1,685,819 Oct.11 1,405,712 1,412,202 4,566 10,462 1,659,989 Nov.12 1,600,009 1,521,447 4,790 20,736 1,710,658 Dec.
(単位:1000個)(Unit:1000n)
出 荷 Shipments
生産数量 販 売 Sales その他 在庫数量(末)
年 月ProductionQuantity
数 量Quantity
金額(百万円)Value
(millions yen)
OthersQuantity
InventoryQuantity
平成 26 年 320,963 331,441 25,961 - 9,032 C.Y. 201427 286,107 289,102 26,877 - 5,718 201528 267,860 267,339 28,307 1 6,234 201629 267,013 266,198 31,111 - 7,359 201730 262,063 261,366 33,239 - 8,413 2018
平成 28 年度 267,742 267,307 28,717 1 4,978 F.Y. 201629 263,864 263,984 31,674 - 6,663 2017
30 年 1~ 3月 62,934 65,125 8,144 - 6,663 Q1 2018 4~ 6 64,379 63,468 8,136 - 7,687 Q2 7~ 9 65,752 65,159 8,209 - 7,363 Q310~12 68,998 67,614 8,750 - 8,413 Q4
30 年 1月 19,050 19,101 2,421 - 7,758 Jan. 2018 2 21,556 22,051 2,882 - 6,980 Feb. 3 22,328 23,973 2,841 - 6,663 Mar. 4 21,215 20,618 2,705 - 6,397 Apr. 5 20,954 21,538 2,701 - 6,890 May 6 22,210 21,312 2,730 - 7,687 Jun.
7 23,770 22,844 3,014 - 7,190 Jul. 8 20,585 21,666 2,778 - 6,703 Aug. 9 21,397 20,649 2,417 - 7,363 Sep.10 23,654 23,039 2,697 - 7,776 Oct.11 23,310 22,571 2,908 - 8,251 Nov.12 22,034 22,004 3,145 - 8,413 Dec.
触媒担体・セラミックフィルタ (8)Ceramic catalyst supports and ceramic filter
Year, Quarter and Month
耐熱材 (9)Heat‐resisting materials
Year, Quarter and Month
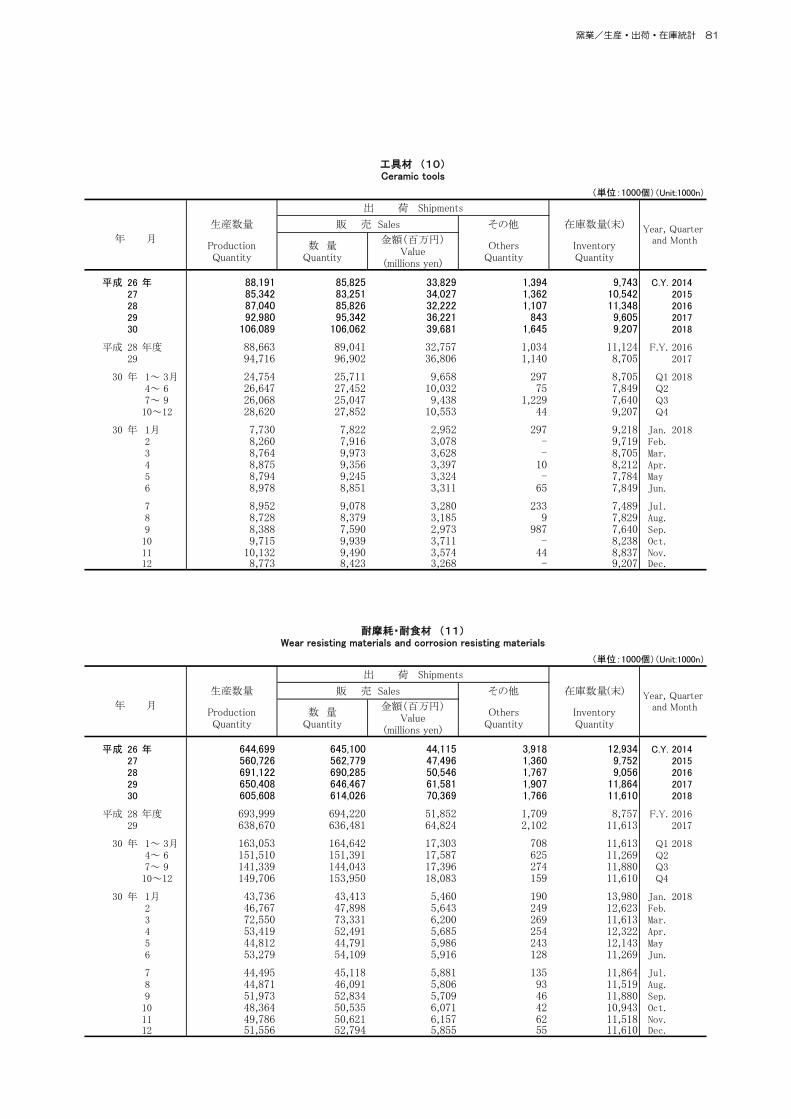
窯業/生産・出荷・在庫統計 81
1.生産・出荷・在庫統計 / Production, Shipment and Inventory
(2) 時系列表 / Historical Data by Commodities 4) ファインセラミックス(続き) / Fine ceramics (continued)
(単位:1000個)(Unit:1000n)
出 荷 Shipments
生産数量 販 売 Sales その他 在庫数量(末)
年 月ProductionQuantity
数 量Quantity
金額(百万円)Value
(millions yen)
OthersQuantity
InventoryQuantity
平成 26 年 88,191 85,825 33,829 1,394 9,743 C.Y. 201427 85,342 83,251 34,027 1,362 10,542 201528 87,040 85,826 32,222 1,107 11,348 201629 92,980 95,342 36,221 843 9,605 201730 106,089 106,062 39,681 1,645 9,207 2018
平成 28 年度 88,663 89,041 32,757 1,034 11,124 F.Y. 201629 94,716 96,902 36,806 1,140 8,705 2017
30 年 1~ 3月 24,754 25,711 9,658 297 8,705 Q1 2018 4~ 6 26,647 27,452 10,032 75 7,849 Q2 7~ 9 26,068 25,047 9,438 1,229 7,640 Q310~12 28,620 27,852 10,553 44 9,207 Q4
30 年 1月 7,730 7,822 2,952 297 9,218 Jan. 2018 2 8,260 7,916 3,078 - 9,719 Feb. 3 8,764 9,973 3,628 - 8,705 Mar. 4 8,875 9,356 3,397 10 8,212 Apr. 5 8,794 9,245 3,324 - 7,784 May 6 8,978 8,851 3,311 65 7,849 Jun.
7 8,952 9,078 3,280 233 7,489 Jul. 8 8,728 8,379 3,185 9 7,829 Aug. 9 8,388 7,590 2,973 987 7,640 Sep.10 9,715 9,939 3,711 - 8,238 Oct.11 10,132 9,490 3,574 44 8,837 Nov.12 8,773 8,423 3,268 - 9,207 Dec.
(単位:1000個)(Unit:1000n)
出 荷 Shipments
生産数量 販 売 Sales その他 在庫数量(末)
年 月ProductionQuantity
数 量Quantity
金額(百万円)Value
(millions yen)
OthersQuantity
InventoryQuantity
平成 26 年 644,699 645,100 44,115 3,918 12,934 C.Y. 201427 560,726 562,779 47,496 1,360 9,752 201528 691,122 690,285 50,546 1,767 9,056 201629 650,408 646,467 61,581 1,907 11,864 201730 605,608 614,026 70,369 1,766 11,610 2018
平成 28 年度 693,999 694,220 51,852 1,709 8,757 F.Y. 201629 638,670 636,481 64,824 2,102 11,613 2017
30 年 1~ 3月 163,053 164,642 17,303 708 11,613 Q1 2018 4~ 6 151,510 151,391 17,587 625 11,269 Q2 7~ 9 141,339 144,043 17,396 274 11,880 Q310~12 149,706 153,950 18,083 159 11,610 Q4
30 年 1月 43,736 43,413 5,460 190 13,980 Jan. 2018 2 46,767 47,898 5,643 249 12,623 Feb. 3 72,550 73,331 6,200 269 11,613 Mar. 4 53,419 52,491 5,685 254 12,322 Apr. 5 44,812 44,791 5,986 243 12,143 May 6 53,279 54,109 5,916 128 11,269 Jun.
7 44,495 45,118 5,881 135 11,864 Jul. 8 44,871 46,091 5,806 93 11,519 Aug. 9 51,973 52,834 5,709 46 11,880 Sep.10 48,364 50,535 6,071 42 10,943 Oct.11 49,786 50,621 6,157 62 11,518 Nov.12 51,556 52,794 5,855 55 11,610 Dec.
工具材 (10)Ceramic tools
Year, Quarter and Month
Year, Quarter and Month
耐摩耗・耐食材 (11)Wear resisting materials and corrosion resisting materials

82 窯業/生産・出荷・在庫統計
1.生産・出荷・在庫統計 / Production, Shipment and Inventory
(2) 時系列表 / Historical Data by Commodities 4) ファインセラミックス(続き) / Fine ceramics (continued)
(単位:1000個)(Unit:1000n)
出 荷 Shipments
生産数量 販 売 Sales その他 在庫数量(末)
年 月ProductionQuantity
数 量Quantity
金額(百万円)Value
(millions yen)
OthersQuantity
InventoryQuantity
平成 26 年 287,851 250,350 24,812 36,294 15,316 C.Y. 201427 248,832 225,966 27,993 26,474 11,365 201528 263,023 239,844 31,340 24,107 10,049 201629 485,652 454,854 44,611 27,529 27,498 201730 513,004 482,551 56,452 25,581 31,922 2018
平成 28 年度 311,177 294,227 34,359 24,575 20,283 F.Y. 201629 504,305 465,249 47,041 27,469 31,865 2017
30 年 1~ 3月 135,094 124,081 12,950 6,646 31,865 Q1 2018 4~ 6 133,549 121,660 13,059 7,070 36,571 Q2 7~ 9 114,995 117,304 14,728 5,491 28,605 Q310~12 129,366 119,506 15,715 6,374 31,922 Q4
30 年 1月 42,750 37,870 4,324 2,351 30,027 Jan. 2018 2 45,245 42,431 4,175 2,186 30,655 Feb. 3 47,099 43,780 4,451 2,109 31,865 Mar. 4 46,154 39,508 4,345 1,835 36,679 Apr. 5 44,385 40,575 3,886 2,924 37,507 May 6 43,010 41,577 4,828 2,311 36,571 Jun.
7 42,271 41,375 5,425 1,983 35,431 Jul. 8 36,825 38,030 4,692 1,690 32,479 Aug. 9 35,899 37,899 4,611 1,818 28,605 Sep.10 43,599 39,525 5,732 1,880 30,742 Oct.11 42,220 38,121 5,305 2,576 32,208 Nov.12 43,547 41,860 4,678 1,918 31,922 Dec.
その他の構造材 (12)Other materials for structural use
Year, Quarter and Month

窯業/生産・出荷・在庫統計 83
1.生産・出荷・在庫統計 / Production, Shipment and Inventory
(2) 時系列表 / Historical Data by Commodities 5) その他の窯業・土石製品 / Other ceramics, stone and clay products ① 耐火れんが・不定形耐火物 / Refractory bricks and monolithic refractories
(単位:t) (Unit:t)
出 荷 Shipments
生産数量 受入数量 販 売 Sales その他 在庫数量(末)
年 月ProductionQuantity
ReceiptQuantity
数 量Quantity
金額(千円)Value
(thousand yen)
OthersQuantity
InventoryQuantity
平成 26 年 350,988 49,277 393,853 94,935,768 4,024 65,012 C.Y. 201427 344,869 52,867 393,611 94,109,649 3,829 65,454 201528 326,724 161,900 491,844 108,583,231 4,268 71,931 201629 340,838 193,702 520,039 112,666,010 5,393 80,889 201730 358,672 214,891 560,627 140,842,335 5,384 86,893 2018
平成 28 年度 327,858 167,608 489,748 106,215,860 4,294 73,330 F.Y. 201629 346,067 207,493 542,171 119,553,499 5,657 78,901 2017
30 年 1~ 3月 86,540 55,381 142,464 32,591,247 1,484 78,901 Q1 2018 4~ 6 92,763 52,604 140,632 34,607,916 1,399 80,575 Q2 7~ 9 87,189 50,407 133,631 35,307,404 1,328 83,187 Q310~12 92,180 56,499 143,900 38,335,768 1,173 86,893 Q4
30 年 1月 27,049 18,361 46,366 10,385,967 387 79,560 Jan. 2018 2 28,152 19,753 46,011 10,358,282 424 81,045 Feb. 3 31,339 17,267 50,087 11,846,998 673 78,901 Mar. 4 31,145 17,397 51,121 12,336,541 484 74,107 Apr. 5 30,103 18,884 44,637 11,258,458 412 78,065 May 6 31,515 16,323 44,874 11,012,917 503 80,575 Jun.
7 29,113 16,821 44,428 11,970,335 449 81,645 Jul. 8 28,611 19,204 45,698 11,986,527 450 83,351 Aug. 9 29,465 14,382 43,505 11,350,542 429 83,187 Sep.10 31,610 18,315 49,097 13,373,405 360 83,754 Oct.11 30,393 18,892 47,585 12,594,294 445 85,034 Nov.12 30,177 19,292 47,218 12,368,069 368 86,893 Dec.
(単位:t) (Unit:t)
出 荷 Shipments
生産数量 受入数量 販 売 Sales その他 在庫数量(末)
年 月ProductionQuantity
ReceiptQuantity
数 量Quantity
金額(千円)Value
(thousand yen)
OthersQuantity
InventoryQuantity
平成 26 年 67,325 24,239 92,182 7,628,480 124 13,802 C.Y. 201427 69,311 27,492 91,505 7,625,084 334 18,782 201528 64,498 41,182 110,849 9,780,045 211 17,390 201629 65,400 47,497 112,232 9,881,874 151 17,745 201730 69,564 41,880 108,078 11,220,664 247 14,955 2018
平成 28 年度 63,758 43,040 106,996 9,043,927 146 18,758 F.Y. 201629 66,008 49,123 115,288 10,566,944 141 18,305 2017
30 年 1~ 3月 16,229 13,065 28,705 2,888,359 30 18,305 Q1 2018 4~ 6 17,774 9,078 25,733 2,716,276 33 13,380 Q2 7~ 9 17,160 8,850 25,215 2,652,972 52 14,153 Q310~12 18,401 10,887 28,425 2,963,057 132 14,955 Q4
30 年 1月 5,025 3,413 8,658 763,685 10 17,516 Jan. 2018 2 5,361 5,315 9,967 934,898 7 18,217 Feb. 3 5,843 4,337 10,080 1,189,776 13 18,305 Mar. 4 5,914 2,580 8,613 921,761 6 12,167 Apr. 5 5,629 3,950 8,958 939,967 17 12,772 May 6 6,231 2,548 8,162 854,548 10 13,380 Jun.
7 5,563 2,485 7,909 810,430 3 13,517 Jul. 8 5,759 3,056 8,315 904,956 4 14,042 Aug. 9 5,838 3,309 8,991 937,586 45 14,153 Sep.10 6,204 4,108 9,818 1,042,938 11 14,703 Oct.11 6,251 4,055 10,049 1,049,445 36 14,926 Nov.12 5,946 2,724 8,558 870,674 85 14,955 Dec.
耐火れんが (1)~(5)Refractory bricks
Year, Quarter and Month
粘土質 (1)Fireclay refractory bricks
Year, Quarter and Month

84 窯業/生産・出荷・在庫統計
1.生産・出荷・在庫統計 / Production, Shipment and Inventory
(2) 時系列表 / Historical Data by Commodities 5) その他の窯業・土石製品 / Other ceramics, stone and clay products ① 耐火れんが・不定形耐火物(続き) / Refractory bricks and monolithic refractories (continued)
(単位:t) (Unit:t)
出 荷 Shipments
生産数量 受入数量 販 売 Sales その他 在庫数量(末)
年 月ProductionQuantity
ReceiptQuantity
数 量Quantity
金額(千円)Value
(thousand yen)
OthersQuantity
InventoryQuantity
平成 26 年 92,580 3,222 94,794 34,651,964 1,099 14,450 C.Y. 201427 90,166 3,595 93,555 33,683,592 696 14,039 201528 91,959 19,643 111,006 38,933,951 996 16,532 201629 95,365 20,341 112,167 39,593,419 2,119 17,982 201730 98,912 26,545 122,581 44,675,665 2,060 19,540 2018
平成 28 年度 93,778 19,391 111,473 39,132,480 1,150 17,678 F.Y. 201629 96,009 21,207 114,544 40,597,717 2,090 18,288 2017
30 年 1~ 3月 25,016 5,576 29,810 10,538,211 483 18,288 Q1 2018 4~ 6 24,900 7,524 32,442 11,188,884 410 18,653 Q2 7~ 9 24,514 6,369 29,901 11,253,496 643 18,895 Q310~12 24,482 7,076 30,428 11,695,074 524 19,540 Q4
30 年 1月 7,536 1,839 9,227 3,308,531 96 18,043 Jan. 2018 2 8,391 1,663 9,665 3,391,472 191 18,248 Feb. 3 9,089 2,074 10,918 3,838,208 196 18,288 Mar. 4 8,429 3,173 11,840 3,955,778 105 18,724 Apr. 5 7,949 2,059 10,330 3,704,762 64 18,345 May 6 8,522 2,292 10,272 3,528,344 241 18,653 Jun.
7 8,566 1,827 9,438 3,839,968 182 19,436 Jul. 8 7,759 2,289 9,935 3,735,866 301 19,254 Aug. 9 8,189 2,253 10,528 3,677,662 160 18,895 Sep.10 8,373 2,253 9,829 3,846,157 158 19,560 Oct.11 8,422 2,315 10,409 3,905,340 260 19,633 Nov.12 7,687 2,508 10,190 3,943,577 106 19,540 Dec.
(単位:t) (Unit:t)
出 荷 Shipments
生産数量 受入数量 販 売 Sales その他 在庫数量(末)
年 月ProductionQuantity
ReceiptQuantity
数 量Quantity
金額(千円)Value
(thousand yen)
OthersQuantity
InventoryQuantity
平成 26 年 136,151 13,709 146,291 26,646,289 2,227 21,632 C.Y. 201427 134,116 12,373 144,816 26,948,014 1,414 21,820 201528 130,638 88,512 218,379 36,128,681 1,826 28,182 201629 140,136 93,974 227,969 37,780,909 2,155 32,117 201730 147,594 119,487 258,488 56,566,724 2,560 41,774 2018
平成 28 年度 131,644 90,785 220,146 35,924,410 2,040 26,804 F.Y. 201629 143,383 99,630 234,765 40,754,254 2,448 32,556 2017
30 年 1~ 3月 34,910 27,430 61,140 11,797,816 791 32,556 Q1 2018 4~ 6 39,831 30,277 66,627 14,419,036 884 38,721 Q2 7~ 9 35,231 29,611 62,005 14,178,749 472 41,124 Q310~12 37,622 32,169 68,716 16,171,123 413 41,774 Q4
30 年 1月 11,091 9,768 21,958 4,141,583 172 30,850 Jan. 2018 2 11,218 9,495 18,030 3,546,598 168 33,373 Feb. 3 12,601 8,167 21,152 4,109,635 451 32,556 Mar. 4 13,433 9,670 23,673 5,085,019 353 35,150 Apr. 5 13,167 10,924 21,309 4,620,115 322 37,620 May 6 13,231 9,683 21,645 4,713,902 209 38,721 Jun.
7 11,563 11,018 21,974 5,037,462 141 39,190 Jul. 8 11,726 11,500 21,981 5,120,155 132 40,305 Aug. 9 11,942 7,093 18,050 4,021,132 199 41,124 Sep.10 12,827 10,189 23,294 5,414,224 114 40,736 Oct.11 12,481 10,704 22,401 5,278,781 128 41,411 Nov.12 12,314 11,276 23,021 5,478,118 171 41,774 Dec.
高アルミナ質 (電鋳品を含む) (2)Highalumina refractory bricks (including electrically casted highalumina refractory bricks)
Year, Quarter and Month
塩基性れんが (ドロマイト質を含む) (3)Basic refractory bricks (including dolomitic refractory bricks)
Year, Quarter and Month
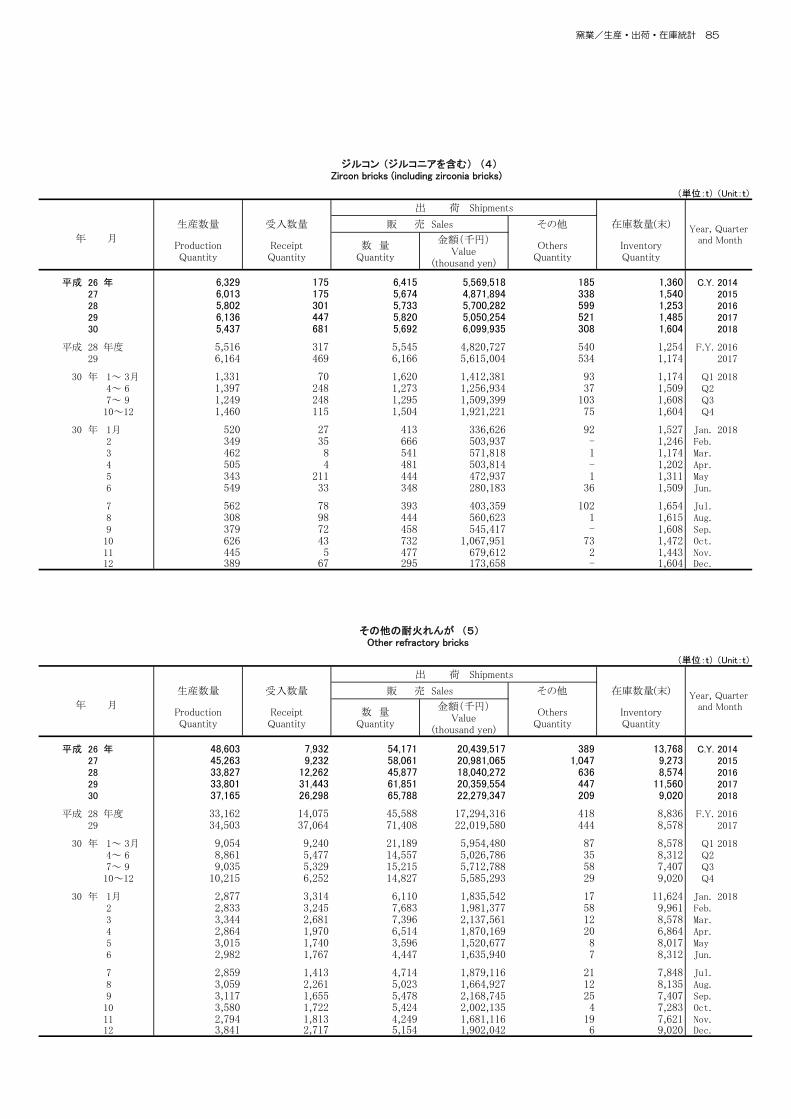
窯業/生産・出荷・在庫統計 85
1.生産・出荷・在庫統計 / Production, Shipment and Inventory
(2) 時系列表 / Historical Data by Commodities 5) その他の窯業・土石製品 / Other ceramics, stone and clay products ① 耐火れんが・不定形耐火物(続き) / Refractory bricks and monolithic refractories (continued)
(単位:t) (Unit:t)
出 荷 Shipments
生産数量 受入数量 販 売 Sales その他 在庫数量(末)
年 月ProductionQuantity
ReceiptQuantity
数 量Quantity
金額(千円)Value
(thousand yen)
OthersQuantity
InventoryQuantity
平成 26 年 6,329 175 6,415 5,569,518 185 1,360 C.Y. 201427 6,013 175 5,674 4,871,894 338 1,540 201528 5,802 301 5,733 5,700,282 599 1,253 201629 6,136 447 5,820 5,050,254 521 1,485 201730 5,437 681 5,692 6,099,935 308 1,604 2018
平成 28 年度 5,516 317 5,545 4,820,727 540 1,254 F.Y. 201629 6,164 469 6,166 5,615,004 534 1,174 2017
30 年 1~ 3月 1,331 70 1,620 1,412,381 93 1,174 Q1 2018 4~ 6 1,397 248 1,273 1,256,934 37 1,509 Q2 7~ 9 1,249 248 1,295 1,509,399 103 1,608 Q310~12 1,460 115 1,504 1,921,221 75 1,604 Q4
30 年 1月 520 27 413 336,626 92 1,527 Jan. 2018 2 349 35 666 503,937 - 1,246 Feb. 3 462 8 541 571,818 1 1,174 Mar. 4 505 4 481 503,814 - 1,202 Apr. 5 343 211 444 472,937 1 1,311 May 6 549 33 348 280,183 36 1,509 Jun.
7 562 78 393 403,359 102 1,654 Jul. 8 308 98 444 560,623 1 1,615 Aug. 9 379 72 458 545,417 - 1,608 Sep.10 626 43 732 1,067,951 73 1,472 Oct.11 445 5 477 679,612 2 1,443 Nov.12 389 67 295 173,658 - 1,604 Dec.
(単位:t) (Unit:t)
出 荷 Shipments
生産数量 受入数量 販 売 Sales その他 在庫数量(末)
年 月ProductionQuantity
ReceiptQuantity
数 量Quantity
金額(千円)Value
(thousand yen)
OthersQuantity
InventoryQuantity
平成 26 年 48,603 7,932 54,171 20,439,517 389 13,768 C.Y. 201427 45,263 9,232 58,061 20,981,065 1,047 9,273 201528 33,827 12,262 45,877 18,040,272 636 8,574 201629 33,801 31,443 61,851 20,359,554 447 11,560 201730 37,165 26,298 65,788 22,279,347 209 9,020 2018
平成 28 年度 33,162 14,075 45,588 17,294,316 418 8,836 F.Y. 201629 34,503 37,064 71,408 22,019,580 444 8,578 2017
30 年 1~ 3月 9,054 9,240 21,189 5,954,480 87 8,578 Q1 2018 4~ 6 8,861 5,477 14,557 5,026,786 35 8,312 Q2 7~ 9 9,035 5,329 15,215 5,712,788 58 7,407 Q310~12 10,215 6,252 14,827 5,585,293 29 9,020 Q4
30 年 1月 2,877 3,314 6,110 1,835,542 17 11,624 Jan. 2018 2 2,833 3,245 7,683 1,981,377 58 9,961 Feb. 3 3,344 2,681 7,396 2,137,561 12 8,578 Mar. 4 2,864 1,970 6,514 1,870,169 20 6,864 Apr. 5 3,015 1,740 3,596 1,520,677 8 8,017 May 6 2,982 1,767 4,447 1,635,940 7 8,312 Jun.
7 2,859 1,413 4,714 1,879,116 21 7,848 Jul. 8 3,059 2,261 5,023 1,664,927 12 8,135 Aug. 9 3,117 1,655 5,478 2,168,745 25 7,407 Sep.10 3,580 1,722 5,424 2,002,135 4 7,283 Oct.11 2,794 1,813 4,249 1,681,116 19 7,621 Nov.12 3,841 2,717 5,154 1,902,042 6 9,020 Dec.
ジルコン (ジルコニアを含む) (4)Zircon bricks (including zirconia bricks)
Year, Quarter and Month
その他の耐火れんが (5)Other refractory bricks
Year, Quarter and Month

86 窯業/生産・出荷・在庫統計
1.生産・出荷・在庫統計 / Production, Shipment and Inventory
(2) 時系列表 / Historical Data by Commodities 5) その他の窯業・土石製品 / Other ceramics, stone and clay products ① 耐火れんが・不定形耐火物(続き) / Refractory bricks and monolithic refractories (continued)
(単位:t) (Unit:t)
出 荷 Shipments
生産数量 受入数量 販 売 Sales その他 在庫数量(末)
年 月ProductionQuantity
ReceiptQuantity
数 量Quantity
金額(千円)Value
(thousand yen)
OthersQuantity
InventoryQuantity
平成 26 年 734,595 35,244 746,423 73,482,563 21,212 28,628 C.Y. 201427 713,696 29,561 720,962 73,871,803 22,237 28,992 201528 680,723 87,303 751,629 76,405,204 16,823 31,274 201629 691,599 95,225 767,150 75,980,503 17,502 33,353 201730 718,617 84,797 782,317 86,396,290 18,251 36,037 2018
平成 28 年度 681,074 89,309 755,292 76,105,641 16,723 30,947 F.Y. 201629 699,214 95,400 772,227 77,097,578 17,695 35,338 2017
30 年 1~ 3月 172,077 23,224 188,796 19,350,523 4,318 35,338 Q1 2018 4~ 6 180,963 20,641 196,644 21,717,369 4,396 36,183 Q2 7~ 9 176,952 19,158 190,435 21,660,926 4,754 36,989 Q310~12 188,625 21,774 206,442 23,667,472 4,783 36,037 Q4
30 年 1月 55,247 8,096 61,023 6,265,907 1,426 34,194 Jan. 2018 2 56,166 7,086 61,756 6,334,733 1,378 34,265 Feb. 3 60,664 8,042 66,017 6,749,883 1,514 35,338 Mar. 4 63,078 7,729 68,886 7,558,901 1,568 37,425 Apr. 5 58,388 6,736 63,348 7,094,987 1,444 36,333 May 6 59,497 6,176 64,410 7,063,481 1,384 36,183 Jun.
7 59,537 6,021 62,767 7,053,176 1,358 37,601 Jul. 8 59,151 6,668 66,129 7,529,211 1,687 35,557 Aug. 9 58,264 6,469 61,539 7,078,539 1,709 36,989 Sep.10 61,745 6,703 66,258 7,658,621 1,868 37,279 Oct.11 63,293 7,351 69,246 8,095,742 1,538 37,125 Nov.12 63,587 7,720 70,938 7,913,109 1,377 36,037 Dec.
(単位:t) (Unit:t)
出 荷 Shipments
生産数量 受入数量 販 売 Sales その他 在庫数量(末)
年 月ProductionQuantity
ReceiptQuantity
数 量Quantity
金額(千円)Value
(thousand yen)
OthersQuantity
InventoryQuantity
平成 26 年 338,942 644 322,340 37,384,913 15,509 15,791 C.Y. 201427 331,205 717 316,185 37,047,897 16,068 15,489 201528 314,394 15,739 316,702 36,668,849 13,210 16,544 201629 316,717 12,694 313,369 35,890,557 14,300 18,145 201730 327,478 12,672 323,313 39,897,915 15,581 19,068 2018
平成 28 年度 312,960 13,802 313,964 36,225,149 13,310 16,215 F.Y. 201629 321,012 12,247 315,503 36,228,492 14,588 19,158 2017
30 年 1~ 3月 78,603 2,839 76,712 8,911,904 3,599 19,158 Q1 2018 4~ 6 80,848 2,956 79,720 9,977,761 3,693 19,510 Q2 7~ 9 81,458 3,041 80,217 9,970,999 4,140 19,570 Q310~12 86,569 3,836 86,664 11,037,251 4,149 19,068 Q4
30 年 1月 25,622 960 25,149 2,935,493 1,195 18,332 Jan. 2018 2 25,638 981 25,431 2,930,041 1,129 18,340 Feb. 3 27,343 898 26,132 3,046,370 1,275 19,158 Mar. 4 27,427 1,066 27,526 3,462,460 1,267 18,853 Apr. 5 26,764 906 25,554 3,210,603 1,228 19,738 May 6 26,657 984 26,640 3,304,698 1,198 19,510 Jun.
7 27,230 999 26,403 3,256,976 1,144 20,190 Jul. 8 28,009 1,132 28,604 3,542,513 1,501 19,178 Aug. 9 26,219 910 25,210 3,171,510 1,495 19,570 Sep.10 29,143 1,058 28,228 3,620,657 1,678 19,837 Oct.11 29,425 1,253 29,281 3,816,776 1,326 19,901 Nov.12 28,001 1,525 29,155 3,599,818 1,145 19,068 Dec.
不定形耐火物 (6)~(8)Monolithic refractories total
Year, Quarter and Month
キャスタブル耐火物 (6)Castable refractories
Year, Quarter and Month

窯業/生産・出荷・在庫統計 87
1.生産・出荷・在庫統計 / Production, Shipment and Inventory
(2) 時系列表 / Historical Data by Commodities 5) その他の窯業・土石製品 / Other ceramics, stone and clay products ① 耐火れんが・不定形耐火物(続き) / Refractory bricks and monolithic refractories (continued)
(単位:t) (Unit:t)
出 荷 Shipments
生産数量 受入数量 販 売 Sales その他 在庫数量(末)
年 月ProductionQuantity
ReceiptQuantity
数 量Quantity
金額(千円)Value
(thousand yen)
OthersQuantity
InventoryQuantity
平成 26 年 184,612 28,865 212,810 12,187,844 911 5,215 C.Y. 201427 181,211 26,000 206,449 12,855,052 528 5,626 201528 178,855 49,156 227,027 14,326,606 1,592 6,327 201629 188,026 51,268 238,489 13,893,328 1,256 5,876 201730 195,108 38,584 231,858 15,932,612 867 7,067 2018
平成 28 年度 180,975 50,151 230,335 14,279,479 1,434 6,090 F.Y. 201629 189,845 51,277 239,651 14,265,702 1,213 6,290 2017
30 年 1~ 3月 46,484 12,632 58,365 3,687,484 277 6,290 Q1 2018 4~ 6 51,743 9,385 60,755 4,208,475 276 6,706 Q2 7~ 9 47,417 8,017 54,605 3,921,331 129 7,387 Q310~12 49,464 8,550 58,133 4,115,322 185 7,067 Q4
30 年 1月 14,616 4,742 18,818 1,194,849 94 6,321 Jan. 2018 2 14,837 3,631 18,333 1,142,237 113 6,346 Feb. 3 17,031 4,259 21,214 1,350,398 70 6,290 Mar. 4 18,908 3,998 21,687 1,460,472 143 9,103 Apr. 5 16,092 2,782 19,173 1,355,706 105 7,279 May 6 16,743 2,605 19,895 1,392,297 28 6,706 Jun.
7 15,850 2,594 17,904 1,268,202 51 7,193 Jul. 8 15,371 2,542 18,222 1,331,141 13 6,876 Aug. 9 16,196 2,881 18,479 1,321,988 65 7,387 Sep.10 15,966 2,530 18,569 1,311,888 55 7,261 Oct.11 16,338 2,934 19,392 1,367,282 69 7,070 Nov.12 17,160 3,086 20,172 1,436,152 61 7,067 Dec.
(単位:t) (Unit:t)
出 荷 Shipments
生産数量 受入数量 販 売 Sales その他 在庫数量(末)
年 月ProductionQuantity
ReceiptQuantity
数 量Quantity
金額(千円)Value
(thousand yen)
OthersQuantity
InventoryQuantity
平成 26 年 211,041 5,735 211,273 23,909,806 4,792 7,622 C.Y. 201427 201,280 2,844 198,328 23,968,854 5,641 7,877 201528 187,474 22,408 207,900 25,409,749 2,021 8,403 201629 186,856 31,263 215,292 26,196,618 1,946 9,332 201730 196,031 33,541 227,146 30,565,763 1,803 9,902 2018
平成 28 年度 187,139 25,356 210,993 25,601,013 1,979 8,642 F.Y. 201629 188,357 31,876 217,073 26,603,384 1,894 9,890 2017
30 年 1~ 3月 46,990 7,753 53,719 6,751,135 442 9,890 Q1 2018 4~ 6 48,372 8,300 56,169 7,531,133 427 9,967 Q2 7~ 9 48,077 8,100 55,613 7,768,596 485 10,032 Q310~12 52,592 9,388 61,645 8,514,899 449 9,902 Q4
30 年 1月 15,009 2,394 17,056 2,135,565 137 9,541 Jan. 2018 2 15,691 2,474 17,992 2,262,455 136 9,579 Feb. 3 16,290 2,885 18,671 2,353,115 169 9,890 Mar. 4 16,743 2,665 19,673 2,635,969 158 9,469 Apr. 5 15,532 3,048 18,621 2,528,678 111 9,316 May 6 16,097 2,587 17,875 2,366,486 158 9,967 Jun.
7 16,457 2,428 18,460 2,527,998 163 10,218 Jul. 8 15,771 2,994 19,303 2,655,557 173 9,503 Aug. 9 15,849 2,678 17,850 2,585,041 149 10,032 Sep.10 16,636 3,115 19,461 2,726,076 135 10,181 Oct.11 17,530 3,164 20,573 2,911,684 143 10,154 Nov.12 18,426 3,109 21,611 2,877,139 171 9,902 Dec.
吹付材耐火物 (7)Gunning refractories
Year, Quarter and Month
その他の不定形耐火物 (8)Other monolithic refractories
Year, Quarter and Month
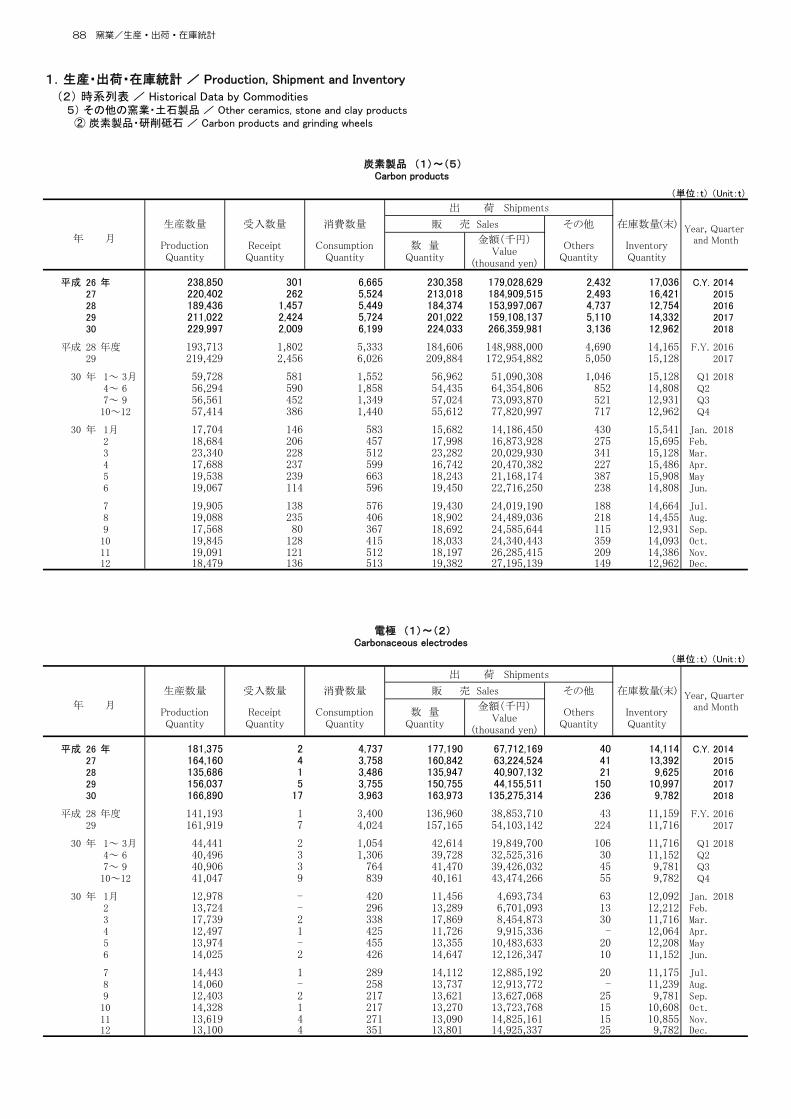
88 窯業/生産・出荷・在庫統計
1.生産・出荷・在庫統計 / Production, Shipment and Inventory
(2) 時系列表 / Historical Data by Commodities 5) その他の窯業・土石製品 / Other ceramics, stone and clay products ② 炭素製品・研削砥石 / Carbon products and grinding wheels
(単位:t) (Unit:t)
出 荷 Shipments
生産数量 受入数量 消費数量 販 売 Sales その他 在庫数量(末)
年 月ProductionQuantity
ReceiptQuantity
ConsumptionQuantity
数 量Quantity
金額(千円)Value
(thousand yen)
OthersQuantity
InventoryQuantity
平成 26 年 238,850 301 6,665 230,358 179,028,629 2,432 17,036 C.Y. 201427 220,402 262 5,524 213,018 184,909,515 2,493 16,421 201528 189,436 1,457 5,449 184,374 153,997,067 4,737 12,754 201629 211,022 2,424 5,724 201,022 159,108,137 5,110 14,332 201730 229,997 2,009 6,199 224,033 266,359,981 3,136 12,962 2018
平成 28 年度 193,713 1,802 5,333 184,606 148,988,000 4,690 14,165 F.Y. 201629 219,429 2,456 6,026 209,884 172,954,882 5,050 15,128 2017
30 年 1~ 3月 59,728 581 1,552 56,962 51,090,308 1,046 15,128 Q1 2018 4~ 6 56,294 590 1,858 54,435 64,354,806 852 14,808 Q2 7~ 9 56,561 452 1,349 57,024 73,093,870 521 12,931 Q310~12 57,414 386 1,440 55,612 77,820,997 717 12,962 Q4
30 年 1月 17,704 146 583 15,682 14,186,450 430 15,541 Jan. 2018 2 18,684 206 457 17,998 16,873,928 275 15,695 Feb. 3 23,340 228 512 23,282 20,029,930 341 15,128 Mar. 4 17,688 237 599 16,742 20,470,382 227 15,486 Apr. 5 19,538 239 663 18,243 21,168,174 387 15,908 May 6 19,067 114 596 19,450 22,716,250 238 14,808 Jun.
7 19,905 138 576 19,430 24,019,190 188 14,664 Jul. 8 19,088 235 406 18,902 24,489,036 218 14,455 Aug. 9 17,568 80 367 18,692 24,585,644 115 12,931 Sep.10 19,845 128 415 18,033 24,340,443 359 14,093 Oct.11 19,091 121 512 18,197 26,285,415 209 14,386 Nov.12 18,479 136 513 19,382 27,195,139 149 12,962 Dec.
(単位:t) (Unit:t)
出 荷 Shipments
生産数量 受入数量 消費数量 販 売 Sales その他 在庫数量(末)
年 月ProductionQuantity
ReceiptQuantity
ConsumptionQuantity
数 量Quantity
金額(千円)Value
(thousand yen)
OthersQuantity
InventoryQuantity
平成 26 年 181,375 2 4,737 177,190 67,712,169 40 14,114 C.Y. 201427 164,160 4 3,758 160,842 63,224,524 41 13,392 201528 135,686 1 3,486 135,947 40,907,132 21 9,625 201629 156,037 5 3,755 150,755 44,155,511 150 10,997 201730 166,890 17 3,963 163,973 135,275,314 236 9,782 2018
平成 28 年度 141,193 1 3,400 136,960 38,853,710 43 11,159 F.Y. 201629 161,919 7 4,024 157,165 54,103,142 224 11,716 2017
30 年 1~ 3月 44,441 2 1,054 42,614 19,849,700 106 11,716 Q1 2018 4~ 6 40,496 3 1,306 39,728 32,525,316 30 11,152 Q2 7~ 9 40,906 3 764 41,470 39,426,032 45 9,781 Q310~12 41,047 9 839 40,161 43,474,266 55 9,782 Q4
30 年 1月 12,978 - 420 11,456 4,693,734 63 12,092 Jan. 2018 2 13,724 - 296 13,289 6,701,093 13 12,212 Feb. 3 17,739 2 338 17,869 8,454,873 30 11,716 Mar. 4 12,497 1 425 11,726 9,915,336 - 12,064 Apr. 5 13,974 - 455 13,355 10,483,633 20 12,208 May 6 14,025 2 426 14,647 12,126,347 10 11,152 Jun.
7 14,443 1 289 14,112 12,885,192 20 11,175 Jul. 8 14,060 - 258 13,737 12,913,772 - 11,239 Aug. 9 12,403 2 217 13,621 13,627,068 25 9,781 Sep.10 14,328 1 217 13,270 13,723,768 15 10,608 Oct.11 13,619 4 271 13,090 14,825,161 15 10,855 Nov.12 13,100 4 351 13,801 14,925,337 25 9,782 Dec.
Year, Quarter and Month
電極 (1)~(2)Carbonaceous electrodes
炭素製品 (1)~(5)Carbon products
Year, Quarter and Month

窯業/生産・出荷・在庫統計 89
1.生産・出荷・在庫統計 / Production, Shipment and Inventory
(2) 時系列表 / Historical Data by Commodities 5) その他の窯業・土石製品 / Other ceramics, stone and clay products ② 炭素製品・研削砥石 / Carbon products and grinding wheels
(単位:t) (Unit:t)
出 荷 Shipments
生産数量 受入数量 消費数量 販 売 Sales その他 在庫数量(末)
年 月ProductionQuantity
ReceiptQuantity
ConsumptionQuantity
数 量Quantity
金額(千円)Value
(thousand yen)
OthersQuantity
InventoryQuantity
平成 26 年 135,035 2 93 136,078 55,687,488 40 11,238 C.Y. 201427 125,660 4 53 124,723 52,266,522 41 12,085 201528 105,811 1 177 108,837 34,329,346 21 8,862 201629 117,345 5 - 116,357 35,706,118 150 9,705 201730 123,155 17 - 123,787 123,455,360 236 8,852 2018
平成 28 年度 110,601 1 143 109,334 32,289,860 43 10,457 F.Y. 201629 121,550 7 - 120,612 45,017,070 224 11,177 2017
30 年 1~ 3月 32,057 2 - 30,480 16,774,896 106 11,177 Q1 2018 4~ 6 30,376 3 - 31,626 30,198,152 30 9,900 Q2 7~ 9 30,377 3 - 31,380 36,287,006 45 8,854 Q310~12 30,345 9 - 30,301 40,195,306 55 8,852 Q4
30 年 1月 9,676 - - 8,743 4,008,300 63 10,575 Jan. 2018 2 10,175 - - 9,527 5,746,183 13 11,209 Feb. 3 12,206 2 - 12,210 7,020,413 30 11,177 Mar. 4 10,293 1 - 10,333 9,495,776 - 11,138 Apr. 5 10,105 - - 9,928 9,523,752 20 11,295 May 6 9,978 2 - 11,365 11,178,624 10 9,900 Jun.
7 10,614 1 - 10,409 11,740,434 20 10,086 Jul. 8 9,949 - - 10,077 11,825,943 - 9,957 Aug. 9 9,814 2 - 10,894 12,720,629 25 8,854 Sep.10 10,547 1 - 9,837 12,620,953 15 9,550 Oct.11 10,650 4 - 10,465 13,939,864 15 9,724 Nov.12 9,148 4 - 9,999 13,634,489 25 8,852 Dec.
(単位:t) (Unit:t)
出 荷 Shipments
生産数量 受入数量 消費数量 販 売 Sales その他 在庫数量(末)
年 月ProductionQuantity
ReceiptQuantity
ConsumptionQuantity
数 量Quantity
金額(千円)Value
(thousand yen)
OthersQuantity
InventoryQuantity
平成 26 年 46,340 - 4,644 41,112 12,024,681 - 2,876 C.Y. 201427 38,500 - 3,705 36,119 10,958,002 - 1,307 201528 29,875 - 3,309 27,110 6,577,786 - 763 201629 38,692 - 3,755 34,398 8,449,393 - 1,292 201730 43,735 - 3,963 40,186 11,819,954 - 930 2018
平成 28 年度 30,592 - 3,257 27,626 6,563,850 - 702 F.Y. 201629 40,369 - 4,024 36,553 9,086,072 - 539 2017
30 年 1~ 3月 12,384 - 1,054 12,134 3,074,804 - 539 Q1 2018 4~ 6 10,120 - 1,306 8,102 2,327,164 - 1,252 Q2 7~ 9 10,529 - 764 10,090 3,139,026 - 927 Q310~12 10,702 - 839 9,860 3,278,960 - 930 Q4
30 年 1月 3,302 - 420 2,713 685,434 - 1,517 Jan. 2018 2 3,549 - 296 3,762 954,910 - 1,003 Feb. 3 5,533 - 338 5,659 1,434,460 - 539 Mar. 4 2,204 - 425 1,393 419,560 - 926 Apr. 5 3,869 - 455 3,427 959,881 - 913 May 6 4,047 - 426 3,282 947,723 - 1,252 Jun.
7 3,829 - 289 3,703 1,144,758 - 1,089 Jul. 8 4,111 - 258 3,660 1,087,829 - 1,282 Aug. 9 2,589 - 217 2,727 906,439 - 927 Sep.10 3,781 - 217 3,433 1,102,815 - 1,058 Oct.11 2,969 - 271 2,625 885,297 - 1,131 Nov.12 3,952 - 351 3,802 1,290,848 - 930 Dec.
Year, Quarter and Month
その他の電極 (連続自焼式電極ペーストを含む) (2)Other solidity carbonaceous (including soderberg paste)
人造黒鉛電極 (丸形) (1)Artificial graphite electrodes (circle)
Year, Quarter and Month
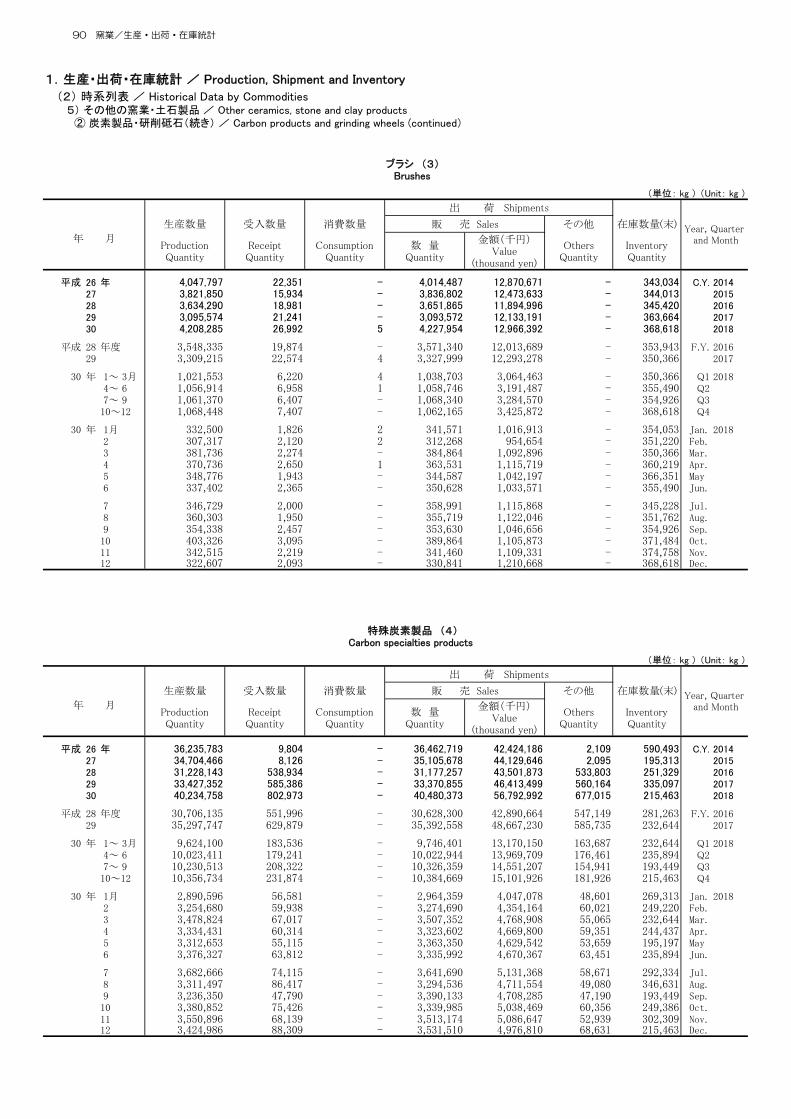
90 窯業/生産・出荷・在庫統計
1.生産・出荷・在庫統計 / Production, Shipment and Inventory
(2) 時系列表 / Historical Data by Commodities 5) その他の窯業・土石製品 / Other ceramics, stone and clay products ② 炭素製品・研削砥石(続き) / Carbon products and grinding wheels (continued)
(単位: kg ) (Unit: kg )
出 荷 Shipments
生産数量 受入数量 消費数量 販 売 Sales その他 在庫数量(末)
年 月ProductionQuantity
ReceiptQuantity
ConsumptionQuantity
数 量Quantity
金額(千円)Value
(thousand yen)
OthersQuantity
InventoryQuantity
平成 26 年 4,047,797 22,351 - 4,014,487 12,870,671 - 343,034 C.Y. 201427 3,821,850 15,934 - 3,836,802 12,473,633 - 344,013 201528 3,634,290 18,981 - 3,651,865 11,894,996 - 345,420 201629 3,095,574 21,241 - 3,093,572 12,133,191 - 363,664 201730 4,208,285 26,992 5 4,227,954 12,966,392 - 368,618 2018
平成 28 年度 3,548,335 19,874 - 3,571,340 12,013,689 - 353,943 F.Y. 201629 3,309,215 22,574 4 3,327,999 12,293,278 - 350,366 2017
30 年 1~ 3月 1,021,553 6,220 4 1,038,703 3,064,463 - 350,366 Q1 2018 4~ 6 1,056,914 6,958 1 1,058,746 3,191,487 - 355,490 Q2 7~ 9 1,061,370 6,407 - 1,068,340 3,284,570 - 354,926 Q310~12 1,068,448 7,407 - 1,062,165 3,425,872 - 368,618 Q4
30 年 1月 332,500 1,826 2 341,571 1,016,913 - 354,053 Jan. 2018 2 307,317 2,120 2 312,268 954,654 - 351,220 Feb. 3 381,736 2,274 - 384,864 1,092,896 - 350,366 Mar. 4 370,736 2,650 1 363,531 1,115,719 - 360,219 Apr. 5 348,776 1,943 - 344,587 1,042,197 - 366,351 May 6 337,402 2,365 - 350,628 1,033,571 - 355,490 Jun.
7 346,729 2,000 - 358,991 1,115,868 - 345,228 Jul. 8 360,303 1,950 - 355,719 1,122,046 - 351,762 Aug. 9 354,338 2,457 - 353,630 1,046,656 - 354,926 Sep.10 403,326 3,095 - 389,864 1,105,873 - 371,484 Oct.11 342,515 2,219 - 341,460 1,109,331 - 374,758 Nov.12 322,607 2,093 - 330,841 1,210,668 - 368,618 Dec.
(単位: kg ) (Unit: kg )
出 荷 Shipments
生産数量 受入数量 消費数量 販 売 Sales その他 在庫数量(末)
年 月ProductionQuantity
ReceiptQuantity
ConsumptionQuantity
数 量Quantity
金額(千円)Value
(thousand yen)
OthersQuantity
InventoryQuantity
平成 26 年 36,235,783 9,804 - 36,462,719 42,424,186 2,109 590,493 C.Y. 201427 34,704,466 8,126 - 35,105,678 44,129,646 2,095 195,313 201528 31,228,143 538,934 - 31,177,257 43,501,873 533,803 251,329 201629 33,427,352 585,386 - 33,370,855 46,413,499 560,164 335,097 201730 40,234,758 802,973 - 40,480,373 56,792,992 677,015 215,463 2018
平成 28 年度 30,706,135 551,996 - 30,628,300 42,890,664 547,149 281,263 F.Y. 201629 35,297,747 629,879 - 35,392,558 48,667,230 585,735 232,644 2017
30 年 1~ 3月 9,624,100 183,536 - 9,746,401 13,170,150 163,687 232,644 Q1 2018 4~ 6 10,023,411 179,241 - 10,022,944 13,969,709 176,461 235,894 Q2 7~ 9 10,230,513 208,322 - 10,326,359 14,551,207 154,941 193,449 Q310~12 10,356,734 231,874 - 10,384,669 15,101,926 181,926 215,463 Q4
30 年 1月 2,890,596 56,581 - 2,964,359 4,047,078 48,601 269,313 Jan. 2018 2 3,254,680 59,938 - 3,274,690 4,354,164 60,021 249,220 Feb. 3 3,478,824 67,017 - 3,507,352 4,768,908 55,065 232,644 Mar. 4 3,334,431 60,314 - 3,323,602 4,669,800 59,351 244,437 Apr. 5 3,312,653 55,115 - 3,363,350 4,629,542 53,659 195,197 May 6 3,376,327 63,812 - 3,335,992 4,670,367 63,451 235,894 Jun.
7 3,682,666 74,115 - 3,641,690 5,131,368 58,671 292,334 Jul. 8 3,311,497 86,417 - 3,294,536 4,711,554 49,080 346,631 Aug. 9 3,236,350 47,790 - 3,390,133 4,708,285 47,190 193,449 Sep.10 3,380,852 75,426 - 3,339,985 5,038,469 60,356 249,386 Oct.11 3,550,896 68,139 - 3,513,174 5,086,647 52,939 302,309 Nov.12 3,424,986 88,309 - 3,531,510 4,976,810 68,631 215,463 Dec.
Year, Quarter and Month
特殊炭素製品 (4)Carbon specialties products
ブラシ (3)Brushes
Year, Quarter and Month

窯業/生産・出荷・在庫統計 91
1.生産・出荷・在庫統計 / Production, Shipment and Inventory
(2) 時系列表 / Historical Data by Commodities 5) その他の窯業・土石製品 / Other ceramics, stone and clay products ② 炭素製品・研削砥石 / Carbon products and grinding wheels
(単位: kg ) (Unit: kg )
出 荷 Shipments
生産数量 受入数量 消費数量 販 売 Sales その他 在庫数量(末)
年 月ProductionQuantity
ReceiptQuantity
ConsumptionQuantity
数 量Quantity
金額(千円)Value
(thousand yen)
OthersQuantity
InventoryQuantity
平成 26 年 17,191,783 267,206 1,928,394 12,690,937 56,021,603 2,389,869 1,988,242 C.Y. 201427 17,716,028 233,827 1,765,613 13,233,409 65,081,712 2,449,627 2,489,448 201528 18,887,756 898,238 1,963,495 13,597,701 57,693,066 4,181,799 2,532,336 201629 18,462,344 1,812,488 1,968,560 13,802,488 56,405,936 4,399,672 2,636,449 201730 18,663,935 1,161,965 2,236,323 15,351,347 61,325,283 2,223,229 2,595,900 2018
平成 28 年度 18,265,836 1,229,537 1,932,694 13,445,960 55,229,937 4,100,314 2,371,050 F.Y. 201629 18,903,055 1,796,097 2,002,467 13,998,481 57,891,232 4,240,676 2,828,580 2017
30 年 1~ 3月 4,641,196 388,787 497,745 3,563,335 15,005,995 776,773 2,828,580 Q1 2018 4~ 6 4,717,398 401,181 552,042 3,625,117 14,668,294 645,378 3,064,722 Q2 7~ 9 4,363,034 234,716 585,122 4,159,194 15,832,061 320,889 2,601,523 Q310~12 4,942,307 137,281 601,414 4,003,701 15,818,933 480,189 2,595,900 Q4
30 年 1月 1,503,400 87,920 163,436 920,507 4,428,725 318,221 2,825,605 Jan. 2018 2 1,397,694 144,411 160,604 1,121,687 4,864,017 202,413 2,883,006 Feb. 3 1,740,102 156,456 173,705 1,521,141 5,713,253 256,139 2,828,580 Mar. 4 1,485,851 173,002 174,220 1,328,414 4,769,527 167,577 2,817,221 Apr. 5 1,902,955 182,346 208,202 1,180,452 5,012,802 313,610 3,138,718 May 6 1,328,592 45,833 169,620 1,116,251 4,885,965 164,191 3,064,722 Jun.
7 1,432,216 60,642 286,921 1,317,054 4,886,762 109,316 2,851,018 Jul. 8 1,356,182 146,700 147,998 1,514,545 5,741,664 168,494 2,517,420 Aug. 9 1,574,636 27,374 150,203 1,327,595 5,203,635 43,079 2,601,523 Sep.10 1,733,001 48,403 198,380 1,033,244 4,472,333 283,814 2,863,739 Oct.11 1,578,315 46,866 241,211 1,252,244 5,264,276 141,263 2,853,689 Nov.12 1,630,991 42,012 161,823 1,718,213 6,082,324 55,112 2,595,900 Dec.
(単位:t) (Unit:t)
出 荷 Shipments
生産数量 受入数量 消費数量 販 売 Sales その他 在庫数量(末)
年 月ProductionQuantity
ReceiptQuantity
ConsumptionQuantity
数 量Quantity
金額(千円)Value
(thousand yen)
OthersQuantity
InventoryQuantity
平成 26 年 39,066 5,498 … 41,888 48,855,077 2,048 3,726 C.Y. 201427 38,247 5,247 … 41,086 49,123,020 2,322 3,733 201528 36,817 5,046 … 39,194 47,118,120 2,737 3,611 201629 37,997 5,252 … 39,923 49,040,085 3,110 3,733 201730 38,197 5,739 … 40,612 50,300,792 3,447 3,544 2018
平成 28 年度 37,138 5,084 … 39,312 47,263,812 2,945 3,638 F.Y. 201629 37,776 5,347 … 39,796 49,142,802 3,129 3,767 2017
30 年 1~ 3月 9,367 1,391 … 9,824 12,212,447 885 3,767 Q1 2018 4~ 6 9,609 1,424 … 10,095 12,471,418 841 3,843 Q2 7~ 9 9,156 1,421 … 10,157 12,566,359 839 3,412 Q310~12 10,065 1,503 … 10,536 13,050,568 882 3,544 Q4
30 年 1月 2,923 450 … 2,999 3,699,341 293 3,811 Jan. 2018 2 3,088 449 … 3,254 4,030,743 308 3,781 Feb. 3 3,356 492 … 3,571 4,482,363 284 3,767 Mar. 4 3,149 452 … 3,353 4,099,173 290 3,718 Apr. 5 3,119 495 … 3,175 3,961,294 256 3,893 May 6 3,341 477 … 3,567 4,410,951 295 3,843 Jun.
7 3,135 497 … 3,412 4,208,339 277 3,783 Jul. 8 3,003 456 … 3,310 4,057,744 290 3,638 Aug. 9 3,018 468 … 3,435 4,300,276 272 3,412 Sep.10 3,553 515 … 3,588 4,492,835 308 3,571 Oct.11 3,419 519 … 3,499 4,380,373 290 3,719 Nov.12 3,093 469 … 3,449 4,177,360 284 3,544 Dec.
Year, Quarter and Month
研削砥石 (6)~(7)Grinding wheels
炭素繊維 (5)Carbon fiber
Year, Quarter and Month

92 窯業/生産・出荷・在庫統計
1.生産・出荷・在庫統計 / Production, Shipment and Inventory
(2) 時系列表 / Historical Data by Commodities 5) その他の窯業・土石製品 / Other ceramics, stone and clay products ② 炭素製品・研削砥石(続き) / Carbon products and grinding wheels (continued)
(単位:t) (Unit:t)
出 荷 Shipments
生産数量 受入数量 消費数量 販 売 Sales その他 在庫数量(末)
年 月ProductionQuantity
ReceiptQuantity
ConsumptionQuantity
数 量Quantity
金額(千円)Value
(thousand yen)
OthersQuantity
InventoryQuantity
平成 26 年 11,633 2,264 … 13,299 19,141,737 448 1,167 C.Y. 201427 12,009 2,207 … 13,072 19,560,185 880 1,362 201528 11,029 2,031 … 12,314 18,649,859 838 1,223 201629 12,125 2,242 … 13,307 20,117,996 914 1,288 201730 12,297 2,410 … 13,562 20,544,103 955 1,416 2018
平成 28 年度 11,146 2,068 … 12,376 18,730,796 876 1,241 F.Y. 201629 12,120 2,278 … 13,344 20,217,141 897 1,342 2017
30 年 1~ 3月 2,960 559 … 3,226 4,945,115 224 1,342 Q1 2018 4~ 6 3,146 612 … 3,460 5,221,638 246 1,376 Q2 7~ 9 3,007 626 … 3,357 5,033,511 239 1,399 Q310~12 3,184 613 … 3,519 5,343,839 246 1,416 Q4
30 年 1月 899 175 … 999 1,548,191 73 1,288 Jan. 2018 2 1,002 182 … 1,088 1,635,233 78 1,301 Feb. 3 1,059 202 … 1,139 1,761,691 73 1,342 Mar. 4 1,034 198 … 1,154 1,732,625 79 1,336 Apr. 5 1,014 197 … 1,096 1,669,240 82 1,363 May 6 1,098 217 … 1,210 1,819,773 85 1,376 Jun.
7 1,046 224 … 1,172 1,745,208 86 1,383 Jul. 8 973 199 … 1,097 1,649,730 75 1,380 Aug. 9 988 203 … 1,088 1,638,573 78 1,399 Sep.10 1,102 210 … 1,207 1,846,952 83 1,413 Oct.11 1,085 217 … 1,177 1,798,567 82 1,454 Nov.12 997 186 … 1,135 1,698,320 81 1,416 Dec.
(単位:t) (Unit:t)
出 荷 Shipments
生産数量 受入数量 消費数量 販 売 Sales その他 在庫数量(末)
年 月ProductionQuantity
ReceiptQuantity
ConsumptionQuantity
数 量Quantity
金額(千円)Value
(thousand yen)
OthersQuantity
InventoryQuantity
平成 26 年 27,433 3,234 … 28,589 29,713,340 1,600 2,559 C.Y. 201427 26,238 3,040 … 28,014 29,562,835 1,442 2,371 201528 25,788 3,015 … 26,880 28,468,261 1,899 2,388 201629 25,872 3,010 … 26,616 28,922,089 2,196 2,445 201730 25,900 3,329 … 27,050 29,756,689 2,492 2,128 2018
平成 28 年度 25,992 3,016 … 26,936 28,533,016 2,069 2,397 F.Y. 201629 25,656 3,069 … 26,452 28,925,661 2,232 2,425 2017
30 年 1~ 3月 6,407 832 … 6,598 7,267,332 661 2,425 Q1 2018 4~ 6 6,463 812 … 6,635 7,249,780 595 2,467 Q2 7~ 9 6,149 795 … 6,800 7,532,848 600 2,013 Q310~12 6,881 890 … 7,017 7,706,729 636 2,128 Q4
30 年 1月 2,024 275 … 2,000 2,151,150 220 2,523 Jan. 2018 2 2,086 267 … 2,166 2,395,510 230 2,480 Feb. 3 2,297 290 … 2,432 2,720,672 211 2,425 Mar. 4 2,115 254 … 2,199 2,366,548 211 2,382 Apr. 5 2,105 298 … 2,079 2,292,054 174 2,530 May 6 2,243 260 … 2,357 2,591,178 210 2,467 Jun.
7 2,089 273 … 2,240 2,463,131 191 2,400 Jul. 8 2,030 257 … 2,213 2,408,014 215 2,258 Aug. 9 2,030 265 … 2,347 2,661,703 194 2,013 Sep.10 2,451 305 … 2,381 2,645,883 225 2,158 Oct.11 2,334 302 … 2,322 2,581,806 208 2,265 Nov.12 2,096 283 … 2,314 2,479,040 203 2,128 Dec.
Year, Quarter and Month
Year, Quarter and Month
レジノイド法砥石 (7)Resinoid grinding wheels
ビトリファイド法砥石 (6)Vitrified grinding wheels

窯業/生産・出荷・在庫統計 93
1.生産・出荷・在庫統計 / Production, Shipment and Inventory
(2) 時系列表 / Historical Data by Commodities 5) その他の窯業・土石製品 / Other ceramics, stone and clay products ③ ボード・パネル / Board and panels
(単位:m2) (Unit:m
2)
出 荷 Shipments
消費数量 販 売 Sales その他 在庫数量(末)
年 月Consumption
Quantity数 量
Quantity
金額(千円)Value
(thousand yen)
OthersQuantity
InventoryQuantity
平成 26 年 … 526,962,737 84,802,137 601,249 25,837,692 C.Y. 201427 … 501,493,724 80,685,364 584,202 27,042,249 201528 … 501,468,449 79,780,772 802,721 23,944,471 201629 … 511,242,592 81,203,971 446,508 24,629,498 201730 … 500,326,956 80,468,635 398,177 23,490,493 2018
平成 28 年度 … 504,376,361 79,910,595 822,817 23,282,028 F.Y. 201629 … 506,022,910 80,367,613 344,535 25,335,970 2017
30 年 1~ 3月 … 124,190,111 19,752,016 99,022 25,335,970 Q1 2018 4~ 6 … 118,398,110 19,256,354 71,469 25,702,096 Q2 7~ 9 … 121,404,869 19,504,596 117,227 27,164,398 Q310~12 … 136,333,866 21,955,669 110,459 23,490,493 Q4
30 年 1月 … 41,499,678 6,634,957 26,126 24,289,688 Jan. 2018 2 … 41,263,926 6,536,486 20,856 24,979,484 Feb. 3 … 41,426,507 6,580,573 52,040 25,335,970 Mar. 4 … 37,986,423 6,283,983 4,755 25,994,091 Apr. 5 … 38,453,057 6,248,658 42,455 25,085,776 May 6 … 41,958,630 6,723,713 24,259 25,702,096 Jun.
7 … 41,258,881 6,577,652 36,429 26,572,555 Jul. 8 … 40,667,904 6,576,212 31,748 23,137,601 Aug. 9 … 39,478,084 6,350,732 49,050 27,164,398 Sep.10 … 46,975,910 7,602,596 33,578 24,601,622 Oct.11 … 47,195,979 7,567,376 43,281 22,783,901 Nov.12 … 42,161,977 6,785,697 33,600 23,490,493 Dec.
(単位:m2) (Unit:m
2)
出 荷 Shipments
消費数量 販 売 Sales その他 在庫数量(末)
年 月Consumption
Quantity数 量
Quantity
金額(千円)Value
(thousand yen)
OthersQuantity
InventoryQuantity
平成 26 年 7,213,163 100,810,989 28,348,458 17,173,209 9,690,891 C.Y. 201427 8,412,064 97,373,351 27,695,452 15,320,221 8,411,301 201528 8,936,727 97,194,125 28,454,376 15,583,519 8,588,716 201629 8,665,702 100,154,752 28,823,101 17,147,176 8,120,528 201730 10,090,091 92,755,843 26,606,404 17,635,667 9,669,636 2018
平成 28 年度 8,659,377 98,390,677 28,802,373 15,832,370 8,715,819 F.Y. 201629 9,162,520 98,847,160 28,083,402 17,047,965 8,428,935 2017
30 年 1~ 3月 2,540,295 23,668,155 6,536,758 4,142,842 8,428,935 Q1 2018 4~ 6 2,500,528 22,904,119 6,484,212 4,367,985 10,004,337 Q2 7~ 9 2,436,627 23,658,427 6,713,376 4,379,857 8,766,503 Q310~12 2,612,641 22,525,142 6,872,058 4,744,983 9,669,636 Q4
30 年 1月 705,144 7,339,972 2,087,465 1,264,061 8,114,162 Jan. 2018 2 908,715 7,408,275 2,029,401 1,369,932 8,711,068 Feb. 3 926,436 8,919,908 2,419,892 1,508,849 8,428,935 Mar. 4 801,061 7,058,975 2,006,158 1,459,788 9,658,089 Apr. 5 876,248 7,263,457 2,090,811 1,227,559 10,281,066 May 6 823,219 8,581,687 2,387,243 1,680,638 10,004,337 Jun.
7 833,949 7,919,940 2,314,788 1,450,323 10,401,739 Jul. 8 752,861 7,526,177 2,157,576 1,605,969 10,157,120 Aug. 9 849,817 8,212,310 2,241,012 1,323,565 8,766,503 Sep.10 928,118 8,098,085 2,491,894 1,872,644 8,774,517 Oct.11 894,137 6,939,656 2,176,811 1,504,499 8,642,913 Nov.12 790,386 7,487,401 2,203,353 1,367,840 9,669,636 Dec.
せっこうボード (1)Gypsum board
Year, Quarter and Month
生産数量 受入数量
ProductionQuantity
ReceiptQuantity
528,842,407 -503,282,485 -499,173,392 -512,374,127 -499,586,129 -
501,990,972 -508,421,387 -
124,995,605 -118,835,705 -122,984,398 -132,770,421 -
41,185,994 -41,974,578 -41,835,033 -38,649,299 -37,587,197 -42,599,209 -
42,165,769 -37,264,698 -43,553,931 -44,446,712 -45,421,539 -42,902,170 -
繊維板 (2)~(4)Fiberboard
生 産 数 量
Year, Quarter and Month
m3換算値 受入数量
ProductionQuantity
(m3)
Reductionquantity
ReceiptQuantity
114,127,808 849,659 12,328,323108,261,615 786,449 11,564,425109,769,304 804,409 12,098,085112,384,375 792,241 12,913,282107,562,468 773,015 13,088,471
110,631,249 800,943 12,192,099111,301,460 784,808 13,051,956
27,116,577 191,631 3,327,56227,940,213 197,553 3,185,77626,069,665 184,985 3,069,89326,436,013 198,846 3,505,240
8,288,181 58,278 1,014,6319,001,951 62,277 1,109,6999,826,445 71,076 1,203,2329,446,958 64,339 1,102,0198,827,945 62,845 940,2539,665,310 70,369 1,143,504
9,443,443 66,855 1,113,8418,676,640 59,260 963,7477,949,582 58,870 992,305
9,075,495 65,750 1,116,694
9,723,191 71,477 1,183,6717,637,327 61,619 1,204,875

94 窯業/生産・出荷・在庫統計
1.生産・出荷・在庫統計 / Production, Shipment and Inventory
(2) 時系列表 / Historical Data by Commodities 5) その他の窯業・土石製品 / Other ceramics, stone and clay products ③ ボード・パネル(続き) / Board and panels (continued)
(単位:m2) (Unit:m
2)
出 荷 Shipments
m3換算値 受入数量 消費数量 販 売 Sales その他 在庫数量(末)
年 月ProductionQuantity
(m3)
Reductionquantity
ReceiptQuantity
ConsumptionQuantity
数 量Quantity
金額(千円)Value
(thousand yen)
OthersQuantity
InventoryQuantity
平成 26 年 x x x x x x x x C.Y. 201427 x x x x x x x x 201528 x x x x x x x x 201629 x x x x x x x x 201730 x x x x x x x x 2018
平成 28 年度 x x x x x x x x F.Y. 201629 x x x x x x x x 2017
30 年 1~ 3月 x x x x x x x x Q1 2018 4~ 6 x x x x x x x x Q2 7~ 9 x x x x x x x x Q310~12 x x x x x x x x Q4
30 年 1月 x x x x x x x x Jan. 2018 2 x x x x x x x x Feb. 3 x x x x x x x x Mar. 4 x x x x x x x x Apr. 5 x x x x x x x x May 6 x x x x x x x x Jun.
7 x x x x x x x x Jul. 8 x x x x x x x x Aug. 9 x x x x x x x x Sep.10 x x x x x x x x Oct.11 x x x x x x x x Nov.12 x x x x x x x x Dec.
(単位:m2) (Unit:m
2)
出 荷 Shipments
m3換算値 受入数量 消費数量 販 売 Sales その他 在庫数量(末)
年 月ProductionQuantity
(m3)
Reductionquantity
ReceiptQuantity
ConsumptionQuantity
数 量Quantity
金額(千円)Value
(thousand yen)
OthersQuantity
InventoryQuantity
平成 26 年 x x x x x x x x C.Y. 201427 57,422,996 396,874 962,111 8,412,064 49,943,651 16,395,505 1,146,215 3,911,137 201528 58,650,748 418,934 1,022,770 8,936,727 48,702,217 17,046,973 1,259,279 4,711,281 201629 60,290,869 414,585 1,079,869 8,665,702 51,528,868 17,507,190 2,063,301 4,025,932 201730 56,141,738 395,727 1,002,389 10,090,091 45,984,269 15,574,797 2,224,727 4,250,741 2018
平成 28 年度 59,866,507 422,906 1,041,428 8,659,377 49,827,656 17,421,694 1,510,420 4,602,736 F.Y. 201629 59,744,663 411,607 1,078,004 9,162,520 50,716,872 16,933,368 1,824,151 4,139,204 2017
30 年 1~ 3月 14,354,749 101,584 258,151 2,540,295 11,864,717 3,851,635 310,177 4,139,204 Q1 2018 4~ 6 15,072,413 104,277 234,791 2,500,528 11,693,545 3,873,013 565,285 4,909,092 Q2 7~ 9 13,619,258 93,272 237,345 2,436,627 12,006,888 4,013,717 650,442 3,769,256 Q310~12 13,095,318 96,594 272,102 2,612,641 10,419,119 3,836,432 698,823 4,250,741 Q4
30 年 1月 4,491,412 31,021 82,974 705,144 3,998,075 1,306,217 97,694 3,799,405 Jan. 2018 2 4,821,179 33,945 86,004 908,715 3,984,795 1,234,926 101,248 3,884,008 Feb. 3 5,042,158 36,618 89,173 926,436 3,881,847 1,310,492 111,235 4,139,204 Mar. 4 5,303,312 35,639 81,364 801,061 3,888,293 1,252,197 175,757 4,658,769 Apr. 5 4,841,093 34,270 72,408 876,248 3,863,788 1,287,052 83,382 4,970,894 May 6 4,928,008 34,368 81,019 823,219 3,941,464 1,333,764 306,146 4,909,092 Jun.
7 5,227,797 35,327 84,081 833,949 4,047,118 1,374,516 102,228 5,282,006 Jul. 8 4,717,118 30,195 82,147 752,861 4,019,846 1,341,046 455,608 4,852,956 Aug. 9 3,674,343 27,750 71,117 849,817 3,939,924 1,298,155 92,606 3,769,256 Sep.10 5,100,708 36,383 93,247 928,118 4,241,970 1,476,306 500,261 3,292,862 Oct.11 3,251,453 28,645 91,284 894,137 2,988,962 1,201,225 106,682 3,010,304 Nov.12 4,743,157 31,566 87,571 790,386 3,188,187 1,158,901 91,880 4,250,741 Dec.
硬質 (2)Hard fiberboard
Year, Quarter and Month
生 産 数 量
中質 (3)Medium density fiberboard
Year, Quarter and Month
生 産 数 量

窯業/生産・出荷・在庫統計 95
1.生産・出荷・在庫統計 / Production, Shipment and Inventory
(2) 時系列表 / Historical Data by Commodities 5) その他の窯業・土石製品 / Other ceramics, stone and clay products ③ ボード・パネル(続き) / Board and panels (continued)
(単位:m2) (Unit:m
2)
出 荷 Shipments
m3換算値 受入数量 消費数量 販 売 Sales その他 在庫数量(末)
年 月ProductionQuantity
(m3)
Reductionquantity
ReceiptQuantity
ConsumptionQuantity
数 量Quantity
金額(千円)Value
(thousand yen)
OthersQuantity
InventoryQuantity
平成 26 年 42,660,168 414,158 - - 39,087,987 10,034,219 2,620,550 1,983,874 C.Y. 201427 x x x x x x x x 201528 x x x x x x x x 201629 x x x x x x x x 201730 x x x x x x x x 2018
平成 28 年度 x x x x x x x x F.Y. 201629 x x x x x x x x 2017
30 年 1~ 3月 x x x x x x x x Q1 2018 4~ 6 x x x x x x x x Q2 7~ 9 x x x x x x x x Q310~12 x x x x x x x x Q4
30 年 1月 x x x x x x x x Jan. 2018 2 x x x x x x x x Feb. 3 x x x x x x x x Mar. 4 x x x x x x x x Apr. 5 x x x x x x x x May 6 x x x x x x x x Jun.
7 x x x x x x x x Jul. 8 x x x x x x x x Aug. 9 x x x x x x x x Sep.10 x x x x x x x x Oct.11 x x x x x x x x Nov.12 x x x x x x x x Dec.
(単位:m2) (Unit:m
2)
出 荷 Shipments
m3換算値 受入数量 消費数量 販 売 Sales その他 在庫数量(末)
年 月ProductionQuantity
(m3)
Reductionquantity
ReceiptQuantity
ConsumptionQuantity
数 量Quantity
金額(千円)Value
(thousand yen)
OthersQuantity
InventoryQuantity
平成 26 年 70,433,191 1,073,288 28,542 2,546,366 66,794,107 38,448,002 471,290 5,290,483 C.Y. 201427 70,564,552 1,069,528 233,148 3,147,345 66,912,422 38,043,025 459,724 5,401,051 201528 72,664,756 1,087,859 666,046 4,010,425 68,524,321 38,430,915 498,678 5,698,424 201629 73,330,513 1,093,068 696,240 4,160,319 70,637,018 39,504,775 463,698 4,414,938 201730 72,457,361 1,069,369 169,076 4,191,487 67,871,935 38,751,402 430,991 4,607,887 2018
平成 28 年度 72,504,407 1,084,763 763,465 4,048,642 69,191,861 38,690,422 510,254 4,913,212 F.Y. 201629 73,118,806 1,090,515 632,780 4,200,086 69,945,067 39,165,934 453,608 4,016,836 2017
30 年 1~ 3月 17,562,224 262,932 133,801 1,065,611 16,920,594 9,509,819 107,924 4,016,836 Q1 2018 4~ 6 17,539,653 256,434 34,112 1,016,725 16,267,451 9,170,647 107,777 4,079,312 Q2 7~ 9 17,602,757 259,678 1,163 1,022,621 16,621,954 9,569,836 95,363 4,123,551 Q310~12 19,752,727 290,325 - 1,086,530 18,061,936 10,501,100 119,927 4,607,887 Q4
30 年 1月 5,481,025 81,876 55,945 330,696 5,615,970 3,165,110 39,937 3,965,305 Jan. 2018 2 5,744,428 85,683 48,863 379,062 5,536,988 3,100,729 34,536 3,808,011 Feb. 3 6,336,771 95,373 28,993 355,853 5,767,636 3,243,980 33,451 4,016,836 Mar. 4 5,916,806 86,878 16,082 346,904 5,510,321 3,097,687 33,787 3,940,958 Apr. 5 5,412,984 79,466 13,748 311,941 5,190,556 2,919,096 37,207 4,100,396 May 6 6,209,863 90,090 4,282 357,880 5,566,574 3,153,864 36,783 4,079,312 Jun.
7 6,197,559 89,147 715 384,275 5,726,181 3,240,619 36,995 4,130,135 Jul. 8 5,529,599 82,517 - 278,045 5,352,981 3,067,925 24,605 4,276,530 Aug. 9 5,875,599 88,014 448 360,301 5,542,792 3,261,292 33,763 4,123,551 Sep.10 6,918,979 102,011 - 375,494 6,254,502 3,637,276 42,479 4,370,056 Oct.11 6,611,166 97,927 - 342,641 6,119,331 3,577,350 36,618 4,482,632 Nov.12 6,222,582 90,387 - 368,395 5,688,103 3,286,474 40,830 4,607,887 Dec.
軟質 (4)Insulation fiberboard
Year, Quarter and Month
生 産 数 量
パーティクルボード (5)Particle board
Year, Quarter and Month
生 産 数 量

96 窯業/生産・出荷・在庫統計
1.生産・出荷・在庫統計 / Production, Shipment and Inventory
(2) 時系列表 / Historical Data by Commodities 5) その他の窯業・土石製品 / Other ceramics, stone and clay products ③ ボード・パネル(続き) / Board and panels (continued)
(単位:m2) (Unit:m
2)
出 荷 Shipments
生産数量 受入数量 消費数量 販 売 Sales その他 在庫数量(末)
年 月ProductionQuantity
ReceiptQuantity
ConsumptionQuantity
数 量Quantity
金額(千円)Value
(thousand yen)
OthersQuantity
InventoryQuantity
平成 26 年 17,766,322 … … 17,847,836 73,162,180 - 612,789 C.Y. 201427 17,956,154 … … 17,827,074 72,031,272 - 741,893 201528 17,422,790 … … 17,366,793 72,503,798 - 798,044 201629 17,235,551 … … 17,256,531 69,295,581 - 778,196 201730 15,181,118 … … 15,182,481 62,934,711 - 703,964 2018
平成 28 年度 17,506,964 … … 17,568,053 72,922,878 - 630,886 F.Y. 201629 16,826,558 … … 16,727,472 67,507,967 - 657,637 2017
30 年 1~ 3月 3,914,517 … … 3,961,738 15,621,599 - 657,637 Q1 2018 4~ 6 3,460,237 … … 3,376,816 14,044,112 - 741,497 Q2 7~ 9 3,991,870 … … 3,986,668 16,318,635 - 746,883 Q310~12 3,814,494 … … 3,857,259 16,950,365 - 703,964 Q4
30 年 1月 1,343,565 … … 1,362,646 5,489,206 - 685,414 Jan. 2018 2 1,272,756 … … 1,277,521 5,073,813 - 680,843 Feb. 3 1,298,196 … … 1,321,571 5,058,580 - 657,637 Mar. 4 1,024,269 … … 1,017,666 4,215,168 - 664,363 Apr. 5 1,129,870 … … 1,117,068 4,735,825 - 677,404 May 6 1,306,098 … … 1,242,082 5,093,119 - 741,497 Jun.
7 1,449,807 … … 1,430,258 6,016,015 - 761,076 Jul. 8 1,229,306 … … 1,251,564 5,019,986 - 738,932 Aug. 9 1,312,757 … … 1,304,846 5,282,634 - 746,883 Sep.10 1,257,413 … … 1,311,787 5,840,386 - 692,538 Oct.11 1,307,105 … … 1,323,535 5,812,776 - 675,818 Nov.12 1,249,976 … … 1,221,937 5,297,203 - 703,964 Dec.
(単位:m2) (Unit:m
2)
出 荷 Shipments
生産数量 受入数量 消費数量 販 売 Sales その他 在庫数量(末)
年 月ProductionQuantity
ReceiptQuantity
ConsumptionQuantity
数 量Quantity
金額(千円)Value
(thousand yen)
OthersQuantity
InventoryQuantity
平成 26 年 872,747 … … 842,157 6,553,307 - 223,530 C.Y. 201427 815,315 … … 726,024 6,192,680 - 312,358 201528 842,141 … … 794,233 8,552,690 - 360,048 201629 752,942 … … 692,488 6,305,908 - 420,227 201730 616,342 … … 632,928 6,419,224 - 329,399 2018
平成 28 年度 797,522 … … 782,438 8,208,863 - 366,781 F.Y. 201629 717,645 … … 641,150 6,212,592 - 369,204 2017
30 年 1~ 3月 135,464 … … 112,682 1,186,528 - 369,204 Q1 2018 4~ 6 156,005 … … 137,262 1,292,695 - 387,924 Q2 7~ 9 155,850 … … 173,609 1,684,768 - 370,118 Q310~12 169,023 … … 209,375 2,255,233 - 329,399 Q4
30 年 1月 42,660 … … 38,099 438,765 - 350,968 Jan. 2018 2 42,684 … … 37,990 392,041 - 355,674 Feb. 3 50,120 … … 36,593 355,722 - 369,204 Mar. 4 49,414 … … 46,812 392,283 - 371,803 Apr. 5 49,223 … … 39,639 384,229 - 381,378 May 6 57,368 … … 50,811 516,183 - 387,924 Jun.
7 58,988 … … 56,896 524,184 - 390,001 Jul. 8 45,153 … … 49,605 489,703 - 385,529 Aug. 9 51,709 … … 67,108 670,881 - 370,118 Sep.10 68,313 … … 71,212 808,792 - 367,192 Oct.11 57,137 … … 70,714 766,295 - 353,281 Nov.12 43,573 … … 67,449 680,146 - 329,399 Dec.
注: コンクリート系パネルには、気泡コンクリート製品(ALC製品)は含まない。
Notes: Concrete base panels do not include "autoclaved lightweight concrete products (ALC products)".
プレハブ建築用パネル (6)~(8)Panels for prefabricated construction
Year, Quarter and Month
コンクリート系パネル (6)Concrete panels
Year, Quarter and Month

窯業/生産・出荷・在庫統計 97
1.生産・出荷・在庫統計 / Production, Shipment and Inventory
(2) 時系列表 / Historical Data by Commodities 5) その他の窯業・土石製品 / Other ceramics, stone and clay products ③ ボード・パネル(続き) / Board and panels (continued)
(単位:m2) (Unit:m
2)
出 荷 Shipments
生産数量 受入数量 消費数量 販 売 Sales その他 在庫数量(末)
年 月ProductionQuantity
ReceiptQuantity
ConsumptionQuantity
数 量Quantity
金額(千円)Value
(thousand yen)
OthersQuantity
InventoryQuantity
平成 26 年 6,980,094 … … 7,055,230 43,914,370 - 181,748 C.Y. 201427 7,048,601 … … 7,021,132 42,900,186 - 209,216 201528 6,882,053 … … 6,867,864 42,279,018 - 223,408 201629 6,858,061 … … 6,894,105 42,007,484 - 187,363 201730 6,179,466 … … 6,162,929 38,119,215 - 203,902 2018
平成 28 年度 6,941,735 … … 6,971,460 42,866,234 - 171,719 F.Y. 201629 6,731,057 … … 6,731,617 41,055,080 - 171,161 2017
30 年 1~ 3月 1,516,669 … … 1,532,873 9,400,231 - 171,161 Q1 2018 4~ 6 1,446,406 … … 1,402,829 8,732,533 - 214,738 Q2 7~ 9 1,578,826 … … 1,580,359 9,732,209 - 213,206 Q310~12 1,637,565 … … 1,646,868 10,254,242 - 203,902 Q4
30 年 1月 519,215 … … 537,607 3,333,229 - 168,972 Jan. 2018 2 500,106 … … 501,924 3,109,225 - 167,154 Feb. 3 497,348 … … 493,342 2,957,777 - 171,161 Mar. 4 449,915 … … 435,026 2,687,770 - 186,050 Apr. 5 475,902 … … 489,329 3,074,246 - 172,623 May 6 520,589 … … 478,474 2,970,517 - 214,738 Jun.
7 590,944 … … 600,814 3,796,093 - 204,868 Jul. 8 467,759 … … 485,426 2,976,848 - 187,201 Aug. 9 520,123 … … 494,119 2,959,268 - 213,206 Sep.10 567,211 … … 564,642 3,554,525 - 215,775 Oct.11 559,710 … … 572,725 3,532,685 - 202,759 Nov.12 510,644 … … 509,501 3,167,032 - 203,902 Dec.
(単位:m2) (Unit:m
2)
出 荷 Shipments
生産数量 受入数量 消費数量 販 売 Sales その他 在庫数量(末)
年 月ProductionQuantity
ReceiptQuantity
ConsumptionQuantity
数 量Quantity
金額(千円)Value
(thousand yen)
OthersQuantity
InventoryQuantity
平成 26 年 9,913,481 … … 9,950,449 22,694,503 - 207,511 C.Y. 201427 10,092,238 … … 10,079,918 22,938,406 - 220,319 201528 9,698,596 … … 9,704,696 21,672,090 - 214,588 201629 9,624,548 … … 9,669,938 20,982,189 - 170,606 201730 8,385,310 … … 8,386,624 18,396,272 - 170,663 2018
平成 28 年度 9,767,707 … … 9,814,155 21,847,781 - 92,386 F.Y. 201629 9,377,856 … … 9,354,705 20,240,295 - 117,272 2017
30 年 1~ 3月 2,262,384 … … 2,316,183 5,034,840 - 117,272 Q1 2018 4~ 6 1,857,826 … … 1,836,725 4,018,884 - 138,835 Q2 7~ 9 2,257,194 … … 2,232,700 4,901,658 - 163,559 Q310~12 2,007,906 … … 2,001,016 4,440,890 - 170,663 Q4
30 年 1月 781,690 … … 786,940 1,717,212 - 165,474 Jan. 2018 2 729,966 … … 737,607 1,572,547 - 158,015 Feb. 3 750,728 … … 791,636 1,745,081 - 117,272 Mar. 4 524,940 … … 535,828 1,135,115 - 106,510 Apr. 5 604,745 … … 588,100 1,277,350 - 123,403 May 6 728,141 … … 712,797 1,606,419 - 138,835 Jun.
7 799,875 … … 772,548 1,695,738 - 166,207 Jul. 8 716,394 … … 716,533 1,553,435 - 166,202 Aug. 9 740,925 … … 743,619 1,652,485 - 163,559 Sep.10 621,889 … … 675,933 1,477,069 - 109,571 Oct.11 690,258 … … 680,096 1,513,796 - 119,778 Nov.12 695,759 … … 644,987 1,450,025 - 170,663 Dec.
軽量鉄骨系パネル (7)Light weight reinforced steel panels
Year, Quarter and Month
木質系パネル (8)Wooden panels
Year, Quarter and Month

98 窯業/生産・出荷・在庫統計
1.生産・出荷・在庫統計 / Production, Shipment and Inventory
(2) 時系列表 / Historical Data by Commodities 6) 建築用金属製品 / Metal products of building ① 金属製建具 / Metal building materials
(単位:t) (Unit:t)
出 荷 Shipments
生産数量 受入数量 販 売 Sales その他 在庫数量(末)
年 月ProductionQuantity
ReceiptQuantity
数 量Quantity
金額(千円)Value
(thousand yen)
OthersQuantity
InventoryQuantity
平成 26 年 541,032 118,256 614,850 696,734,214 41,791 25,221 C.Y. 201427 509,415 113,145 586,163 676,592,371 38,866 22,671 201528 494,983 104,663 562,281 660,915,615 38,511 21,577 201629 497,582 103,436 564,307 664,166,012 37,367 20,740 201730 499,541 109,870 572,755 666,586,326 34,688 22,696 2018
平成 28 年度 495,249 105,414 562,649 660,315,856 38,572 20,259 F.Y. 201629 493,508 103,447 558,959 658,228,883 36,355 21,853 2017
30 年 1~ 3月 115,802 24,787 131,516 153,257,102 7,955 21,853 Q1 2018 4~ 6 119,470 27,337 135,455 158,599,360 8,582 24,620 Q2 7~ 9 121,794 27,378 141,061 165,509,554 8,621 24,112 Q310~12 142,475 30,368 164,723 189,220,310 9,530 22,696 Q4
30 年 1月 37,385 8,111 41,715 48,679,761 2,516 22,003 Jan. 2018 2 37,323 7,789 42,238 49,202,236 2,554 22,323 Feb. 3 41,094 8,887 47,563 55,375,105 2,885 21,853 Mar. 4 38,837 9,287 44,127 50,706,524 2,745 23,104 Apr. 5 39,973 9,164 44,989 53,090,681 2,944 24,307 May 6 40,660 8,886 46,339 54,802,155 2,893 24,620 Jun.
7 42,087 9,354 49,019 57,799,647 3,040 24,001 Jul. 8 38,955 8,900 45,015 52,987,022 2,881 23,959 Aug. 9 40,752 9,124 47,027 54,722,885 2,700 24,112 Sep.10 49,243 9,836 56,209 64,831,001 3,376 23,604 Oct.11 49,115 10,278 57,048 64,998,068 3,276 22,670 Nov.12 44,117 10,254 51,466 59,391,241 2,878 22,696 Dec.
(単位:t) (Unit:t)
出 荷 Shipments
生産数量 受入数量 販 売 Sales その他 在庫数量(末)
年 月ProductionQuantity
ReceiptQuantity
数 量Quantity
金額(千円)Value
(thousand yen)
OthersQuantity
InventoryQuantity
平成 26 年 367,257 95,285 419,063 581,632,539 41,297 21,429 C.Y. 201427 337,913 90,635 392,009 561,629,221 38,344 19,477 201528 329,883 84,212 377,705 550,654,856 37,860 18,008 201629 327,863 82,805 374,342 546,245,717 36,938 17,371 201730 324,101 88,100 376,527 544,906,519 34,281 18,755 2018
平成 28 年度 329,796 84,330 376,881 548,679,511 37,978 17,199 F.Y. 201629 325,040 83,297 370,843 540,388,448 35,925 18,745 2017
30 年 1~ 3月 75,578 19,496 85,847 123,974,285 7,851 18,745 Q1 2018 4~ 6 79,747 22,706 92,168 131,668,035 8,469 20,557 Q2 7~ 9 79,370 21,860 93,329 135,829,425 8,527 19,934 Q310~12 89,406 24,038 105,183 153,434,774 9,434 18,755 Q4
30 年 1月 24,412 6,405 27,262 39,316,644 2,485 18,441 Jan. 2018 2 23,977 5,914 27,235 39,436,256 2,517 18,581 Feb. 3 27,189 7,177 31,350 45,221,385 2,849 18,745 Mar. 4 25,807 7,856 30,095 42,098,068 2,707 19,606 Apr. 5 27,066 7,607 31,055 44,396,168 2,913 20,309 May 6 26,874 7,243 31,018 45,173,799 2,849 20,557 Jun.
7 27,928 7,414 32,891 47,603,799 3,006 20,002 Jul. 8 25,567 7,097 29,824 43,395,580 2,850 19,992 Aug. 9 25,875 7,349 30,614 44,830,046 2,671 19,934 Sep.10 31,057 7,884 36,360 53,197,698 3,347 19,167 Oct.11 30,693 8,125 36,510 52,643,919 3,248 18,224 Nov.12 27,656 8,029 32,313 47,593,157 2,839 18,755 Dec.
金属製建具 (1)~(9)Metal building materials
Year, Quarter and Month
アルミニウム製 (1)~(6)Aluminum products
Year, Quarter and Month

窯業/生産・出荷・在庫統計 99
1.生産・出荷・在庫統計 / Production, Shipment and Inventory
(2) 時系列表 / Historical Data by Commodities 6) 建築用金属製品 / Metal products of building ① 金属製建具(続き) / Metal building materials (continued)
(単位:t) (Unit:t)
出 荷 Shipments
生産数量 受入数量 販 売 Sales その他 在庫数量(末)
年 月ProductionQuantity
ReceiptQuantity
数 量Quantity
金額(千円)Value
(thousand yen)
OthersQuantity
InventoryQuantity
平成 26 年 188,097 70,280 227,260 363,782,041 31,909 10,635 C.Y. 201427 175,265 71,189 217,589 354,536,357 29,428 10,076 201528 171,848 65,365 208,489 345,438,252 28,741 10,054 201629 167,577 62,634 203,024 338,201,440 27,457 9,770 201730 162,230 64,896 201,814 331,751,238 25,145 9,929 2018
平成 28 年度 171,541 64,605 207,583 343,469,665 28,571 9,357 F.Y. 201629 165,215 63,056 200,858 333,791,044 26,814 9,941 2017
30 年 1~ 3月 37,678 14,783 46,398 76,336,012 5,891 9,941 Q1 2018 4~ 6 39,466 17,030 49,060 78,855,159 6,229 11,140 Q2 7~ 9 40,765 15,910 51,330 83,845,098 6,229 10,259 Q310~12 44,321 17,173 55,026 92,714,969 6,796 9,929 Q4
30 年 1月 12,247 4,846 15,004 24,614,346 1,905 9,953 Jan. 2018 2 11,890 4,432 14,576 24,180,014 1,885 9,815 Feb. 3 13,541 5,505 16,818 27,541,652 2,101 9,941 Mar. 4 12,754 6,064 16,143 25,198,977 2,001 10,613 Apr. 5 13,294 5,644 16,434 26,528,414 2,132 10,982 May 6 13,418 5,322 16,483 27,127,768 2,096 11,140 Jun.
7 14,340 5,441 17,998 29,191,365 2,188 10,736 Jul. 8 13,069 5,148 16,325 26,698,556 2,109 10,519 Aug. 9 13,356 5,321 17,007 27,955,177 1,932 10,259 Sep.10 15,944 5,450 19,301 32,793,417 2,448 9,904 Oct.11 15,169 5,846 18,779 31,406,355 2,325 9,813 Nov.12 13,208 5,877 16,946 28,515,197 2,023 9,929 Dec.
(単位:t) (Unit:t)
出 荷 Shipments
生産数量 受入数量 販 売 Sales その他 在庫数量(末)
年 月ProductionQuantity
ReceiptQuantity
数 量Quantity
金額(千円)Value
(thousand yen)
OthersQuantity
InventoryQuantity
平成 26 年 89,999 53,559 123,586 191,960,074 20,599 8,607 C.Y. 201427 84,479 49,206 115,190 185,680,108 18,819 8,295 201528 85,336 46,182 113,254 185,104,312 18,873 7,685 201629 83,130 43,832 109,744 179,164,859 17,396 7,463 201730 79,142 41,775 106,049 172,699,514 15,391 6,938 2018
平成 28 年度 85,071 45,500 112,189 182,924,969 18,695 7,285 F.Y. 201629 81,616 43,672 108,349 177,006,925 16,662 7,519 2017
30 年 1~ 3月 18,534 9,723 24,714 40,533,947 3,488 7,519 Q1 2018 4~ 6 20,184 10,955 26,690 43,202,466 3,858 8,108 Q2 7~ 9 19,322 9,817 26,089 42,389,306 3,815 7,344 Q310~12 21,102 11,280 28,556 46,573,795 4,230 6,938 Q4
30 年 1月 6,064 3,185 8,014 13,160,509 1,110 7,588 Jan. 2018 2 5,890 2,820 7,859 12,917,632 1,103 7,338 Feb. 3 6,580 3,718 8,841 14,455,806 1,275 7,519 Mar. 4 6,546 3,731 8,628 13,874,626 1,226 7,942 Apr. 5 6,845 3,635 9,018 14,692,051 1,327 8,077 May 6 6,793 3,589 9,044 14,635,789 1,305 8,108 Jun.
7 7,020 3,444 9,508 15,386,320 1,390 7,674 Jul. 8 6,171 3,121 8,236 13,373,895 1,240 7,490 Aug. 9 6,131 3,252 8,345 13,629,091 1,185 7,344 Sep.10 7,478 3,671 10,027 16,286,601 1,518 6,948 Oct.11 7,216 3,823 9,804 15,954,260 1,453 6,728 Nov.12 6,408 3,786 8,725 14,332,934 1,259 6,938 Dec.
アルミニウムサッシ (1)~(3)Aluminum sashes
Year, Quarter and Month
木造住宅用アルミニウムサッシ (1)~(2)Aluminum sashes for wooden house
Year, Quarter and Month

100 窯業/生産・出荷・在庫統計
1.生産・出荷・在庫統計 / Production, Shipment and Inventory
(2) 時系列表 / Historical Data by Commodities 6) 建築用金属製品 / Metal products of building ① 金属製建具(続き) / Metal building materials (continued)
(単位:t) (Unit:t)
出 荷 Shipments
生産数量 受入数量 販 売 Sales その他 在庫数量(末)
年 月ProductionQuantity
ReceiptQuantity
数 量Quantity
金額(千円)Value
(thousand yen)
OthersQuantity
InventoryQuantity
平成 26 年 63,341 43,495 90,761 127,881,674 16,996 6,563 C.Y. 201427 57,238 39,214 82,230 121,385,727 14,761 6,030 201528 55,719 35,041 77,623 116,313,558 13,911 5,252 201629 52,143 31,765 71,657 108,575,875 12,514 4,948 201730 49,024 30,242 68,451 104,225,737 11,037 4,725 2018
平成 28 年度 54,934 34,018 75,812 113,472,794 13,586 4,915 F.Y. 201629 50,944 31,752 70,450 107,220,157 12,097 5,022 2017
30 年 1~ 3月 11,625 7,145 16,102 24,699,560 2,594 5,022 Q1 2018 4~ 6 12,642 8,023 17,434 26,409,607 2,825 5,426 Q2 7~ 9 11,885 7,035 16,721 25,389,444 2,690 4,936 Q310~12 12,872 8,039 18,194 27,727,126 2,928 4,725 Q4
30 年 1月 3,769 2,333 5,131 7,871,502 807 5,111 Jan. 2018 2 3,705 2,097 5,153 7,906,611 831 4,931 Feb. 3 4,151 2,715 5,818 8,921,447 956 5,022 Mar. 4 4,137 2,736 5,686 8,531,689 910 5,298 Apr. 5 4,257 2,654 5,872 8,990,275 970 5,367 May 6 4,248 2,633 5,876 8,887,643 945 5,426 Jun.
7 4,328 2,475 6,082 9,258,037 976 5,171 Jul. 8 3,813 2,248 5,309 8,015,808 884 5,039 Aug. 9 3,744 2,312 5,330 8,115,599 830 4,936 Sep.10 4,589 2,644 6,418 9,749,311 1,069 4,682 Oct.11 4,397 2,713 6,253 9,517,242 1,014 4,525 Nov.12 3,886 2,682 5,523 8,460,573 845 4,725 Dec.
(単位:t) (Unit:t)
出 荷 Shipments
生産数量 受入数量 販 売 Sales その他 在庫数量(末)
年 月ProductionQuantity
ReceiptQuantity
数 量Quantity
金額(千円)Value
(thousand yen)
OthersQuantity
InventoryQuantity
平成 26 年 26,658 10,064 32,825 64,078,400 3,603 2,044 C.Y. 201427 27,241 9,992 32,960 64,294,381 4,058 2,265 201528 29,617 11,141 35,631 68,790,754 4,962 2,433 201629 30,987 12,067 38,087 70,588,984 4,882 2,515 201730 30,118 11,533 37,598 68,473,777 4,354 2,213 2018
平成 28 年度 30,137 11,482 36,377 69,452,175 5,109 2,370 F.Y. 201629 30,672 11,920 37,899 69,786,768 4,565 2,497 2017
30 年 1~ 3月 6,909 2,578 8,612 15,834,387 894 2,497 Q1 2018 4~ 6 7,542 2,932 9,256 16,792,859 1,033 2,682 Q2 7~ 9 7,437 2,782 9,368 16,999,862 1,125 2,408 Q310~12 8,230 3,241 10,362 18,846,669 1,302 2,213 Q4
30 年 1月 2,295 852 2,883 5,289,007 303 2,477 Jan. 2018 2 2,185 723 2,706 5,011,021 272 2,407 Feb. 3 2,429 1,003 3,023 5,534,359 319 2,497 Mar. 4 2,409 995 2,942 5,342,937 316 2,644 Apr. 5 2,588 981 3,146 5,701,776 357 2,710 May 6 2,545 956 3,168 5,748,146 360 2,682 Jun.
7 2,692 969 3,426 6,128,283 414 2,503 Jul. 8 2,358 873 2,927 5,358,087 356 2,451 Aug. 9 2,387 940 3,015 5,513,492 355 2,408 Sep.10 2,889 1,027 3,609 6,537,290 449 2,266 Oct.11 2,819 1,110 3,551 6,437,018 439 2,203 Nov.12 2,522 1,104 3,202 5,872,361 414 2,213 Dec.
木造住宅用アルミニウムサッシ (アルミ) (1)Aluminum sashes for wooden house (Aluminum)
Year, Quarter and Month
木造住宅用アルミニウムサッシ (アルミ樹脂複合) (2)Aluminum sashes for wooden house (Aluminum plastic combined)
Year, Quarter and Month

窯業/生産・出荷・在庫統計 101
1.生産・出荷・在庫統計 / Production, Shipment and Inventory
(2) 時系列表 / Historical Data by Commodities 6) 建築用金属製品 / Metal products of building ① 金属製建具(続き) / Metal building materials (continued)
(単位:t) (Unit:t)
出 荷 Shipments
生産数量 受入数量 販 売 Sales その他 在庫数量(末)
年 月ProductionQuantity
ReceiptQuantity
数 量Quantity
金額(千円)Value
(thousand yen)
OthersQuantity
InventoryQuantity
平成 26 年 98,098 16,721 103,674 171,821,967 11,310 2,028 C.Y. 201427 90,786 21,983 102,399 168,856,249 10,609 1,781 201528 86,512 19,183 95,235 160,333,940 9,868 2,369 201629 84,447 18,802 93,280 159,036,581 10,061 2,307 201730 83,088 23,121 95,765 159,051,724 9,754 2,991 2018
平成 28 年度 86,470 19,105 95,394 160,544,696 9,876 2,072 F.Y. 201629 83,599 19,384 92,509 156,784,119 10,152 2,422 2017
30 年 1~ 3月 19,144 5,060 21,684 35,802,065 2,403 2,422 Q1 2018 4~ 6 19,282 6,075 22,370 35,652,693 2,371 3,032 Q2 7~ 9 21,443 6,093 25,241 41,455,792 2,414 2,915 Q310~12 23,219 5,893 26,470 46,141,174 2,566 2,991 Q4
30 年 1月 6,183 1,661 6,990 11,453,837 795 2,365 Jan. 2018 2 6,000 1,612 6,717 11,262,382 782 2,477 Feb. 3 6,961 1,787 7,977 13,085,846 826 2,422 Mar. 4 6,208 2,333 7,515 11,324,351 775 2,671 Apr. 5 6,449 2,009 7,416 11,836,363 805 2,905 May 6 6,625 1,733 7,439 12,491,979 791 3,032 Jun.
7 7,320 1,997 8,490 13,805,045 798 3,062 Jul. 8 6,898 2,027 8,089 13,324,661 869 3,029 Aug. 9 7,225 2,069 8,662 14,326,086 747 2,915 Sep.10 8,466 1,779 9,274 16,506,816 930 2,956 Oct.11 7,953 2,023 8,975 15,452,095 872 3,085 Nov.12 6,800 2,091 8,221 14,182,263 764 2,991 Dec.
(単位:t) (Unit:t)
出 荷 Shipments
生産数量 受入数量 販 売 Sales その他 在庫数量(末)
年 月ProductionQuantity
ReceiptQuantity
数 量Quantity
金額(千円)Value
(thousand yen)
OthersQuantity
InventoryQuantity
平成 26 年 22,338 10,710 25,658 55,657,794 7,465 938 C.Y. 201427 21,151 10,121 24,217 53,863,230 7,103 882 201528 20,883 10,383 23,959 55,334,777 7,261 933 201629 21,403 10,397 24,217 56,819,486 7,587 923 201730 20,374 9,641 23,443 55,882,848 6,660 835 2018
平成 28 年度 20,815 10,476 23,880 55,619,305 7,377 859 F.Y. 201629 21,010 10,216 23,871 56,152,478 7,290 918 2017
30 年 1~ 3月 4,513 2,124 5,176 12,346,826 1,464 918 Q1 2018 4~ 6 5,129 2,510 5,883 14,125,634 1,702 975 Q2 7~ 9 5,096 2,301 5,855 14,026,537 1,637 880 Q310~12 5,636 2,706 6,529 15,383,851 1,857 835 Q4
30 年 1月 1,455 665 1,650 3,880,328 456 937 Jan. 2018 2 1,428 648 1,625 3,901,153 472 916 Feb. 3 1,630 811 1,901 4,565,345 536 918 Mar. 4 1,605 823 1,849 4,464,079 549 950 Apr. 5 1,732 852 1,980 4,777,843 580 974 May 6 1,792 835 2,054 4,883,712 573 975 Jun.
7 1,847 818 2,120 5,065,395 591 928 Jul. 8 1,621 729 1,852 4,471,013 531 896 Aug. 9 1,628 754 1,883 4,490,129 515 880 Sep.10 1,974 917 2,269 5,303,005 647 855 Oct.11 1,915 934 2,225 5,277,804 650 829 Nov.12 1,747 855 2,035 4,803,042 560 835 Dec.
ビル用アルミニウムサッシ (3)Aluminum sashes for building
Year, Quarter and Month
アルミニウムドア (4)Aluminum doors
Year, Quarter and Month

102 窯業/生産・出荷・在庫統計
1.生産・出荷・在庫統計 / Production, Shipment and Inventory
(2) 時系列表 / Historical Data by Commodities 6) 建築用金属製品 / Metal products of building ① 金属製建具(続き) / Metal building materials (continued)
(単位:t) (Unit:t)
出 荷 Shipments
生産数量 受入数量 販 売 Sales その他 在庫数量(末)
年 月ProductionQuantity
ReceiptQuantity
数 量Quantity
金額(千円)Value
(thousand yen)
OthersQuantity
InventoryQuantity
平成 26 年 119,785 12,945 128,100 125,656,357 1,579 9,181 C.Y. 201427 106,216 8,370 114,262 117,452,528 1,483 7,878 201528 101,706 7,660 109,373 114,156,405 1,541 6,332 201629 103,248 8,885 110,894 115,661,067 1,559 6,008 201730 106,548 12,685 115,745 122,469,165 2,145 7,350 2018
平成 28 年度 102,096 8,398 109,565 113,927,682 1,719 6,304 F.Y. 201629 103,531 9,158 110,298 115,411,448 1,481 7,212 2017
30 年 1~ 3月 24,732 2,378 25,495 26,850,843 412 7,212 Q1 2018 4~ 6 26,573 2,966 28,545 30,190,624 455 7,751 Q2 7~ 9 25,073 3,454 27,634 29,527,793 583 8,061 Q310~12 30,170 3,887 34,071 35,899,905 695 7,350 Q4
30 年 1月 7,799 824 7,616 8,026,154 98 6,918 Jan. 2018 2 7,868 769 8,101 8,541,600 131 7,323 Feb. 3 9,065 785 9,778 10,283,089 183 7,212 Mar. 4 8,634 903 9,245 9,683,071 132 7,372 Apr. 5 9,137 1,047 9,716 10,224,224 172 7,668 May 6 8,802 1,016 9,584 10,283,329 151 7,751 Jun.
7 8,803 1,092 9,834 10,370,496 200 7,612 Jul. 8 8,107 1,155 8,783 9,456,396 183 7,907 Aug. 9 8,163 1,207 9,017 9,700,901 200 8,061 Sep.10 9,971 1,425 11,482 11,820,097 219 7,755 Oct.11 10,450 1,252 12,198 12,691,339 244 7,015 Nov.12 9,749 1,210 10,391 11,388,469 232 7,350 Dec.
(単位:t) (Unit:t)
出 荷 Shipments
生産数量 受入数量 販 売 Sales その他 在庫数量(末)
年 月ProductionQuantity
ReceiptQuantity
数 量Quantity
金額(千円)Value
(thousand yen)
OthersQuantity
InventoryQuantity
平成 26 年 37,037 1,350 38,045 36,536,347 344 675 C.Y. 201427 35,281 955 35,941 35,777,106 330 641 201528 35,446 804 35,884 35,725,422 317 689 201629 35,635 889 36,207 35,563,724 335 670 201730 34,949 878 35,525 34,803,268 331 641 2018
平成 28 年度 35,344 851 35,853 35,662,859 311 679 F.Y. 201629 35,284 867 35,816 35,033,478 340 674 2017
30 年 1~ 3月 8,655 211 8,778 8,440,604 84 674 Q1 2018 4~ 6 8,579 200 8,680 8,496,618 83 691 Q2 7~ 9 8,436 195 8,510 8,429,997 78 734 Q310~12 9,279 272 9,557 9,436,049 86 641 Q4
30 年 1月 2,911 70 2,992 2,795,816 26 633 Jan. 2018 2 2,791 65 2,933 2,813,489 29 527 Feb. 3 2,953 76 2,853 2,831,299 29 674 Mar. 4 2,814 66 2,858 2,751,941 25 671 Apr. 5 2,903 64 2,925 2,865,687 29 685 May 6 2,862 70 2,897 2,878,990 29 691 Jun.
7 2,938 63 2,939 2,976,543 27 726 Jul. 8 2,770 65 2,864 2,769,615 27 670 Aug. 9 2,728 67 2,707 2,683,839 24 734 Sep.10 3,168 92 3,308 3,281,179 33 653 Oct.11 3,159 93 3,308 3,268,421 29 567 Nov.12 2,952 87 2,941 2,886,449 24 641 Dec.
アルミニウムエクステリア (5)Aluminum exterior
Year, Quarter and Month
アルミニウム製室内建具 (6)Aluminum interior products
Year, Quarter and Month
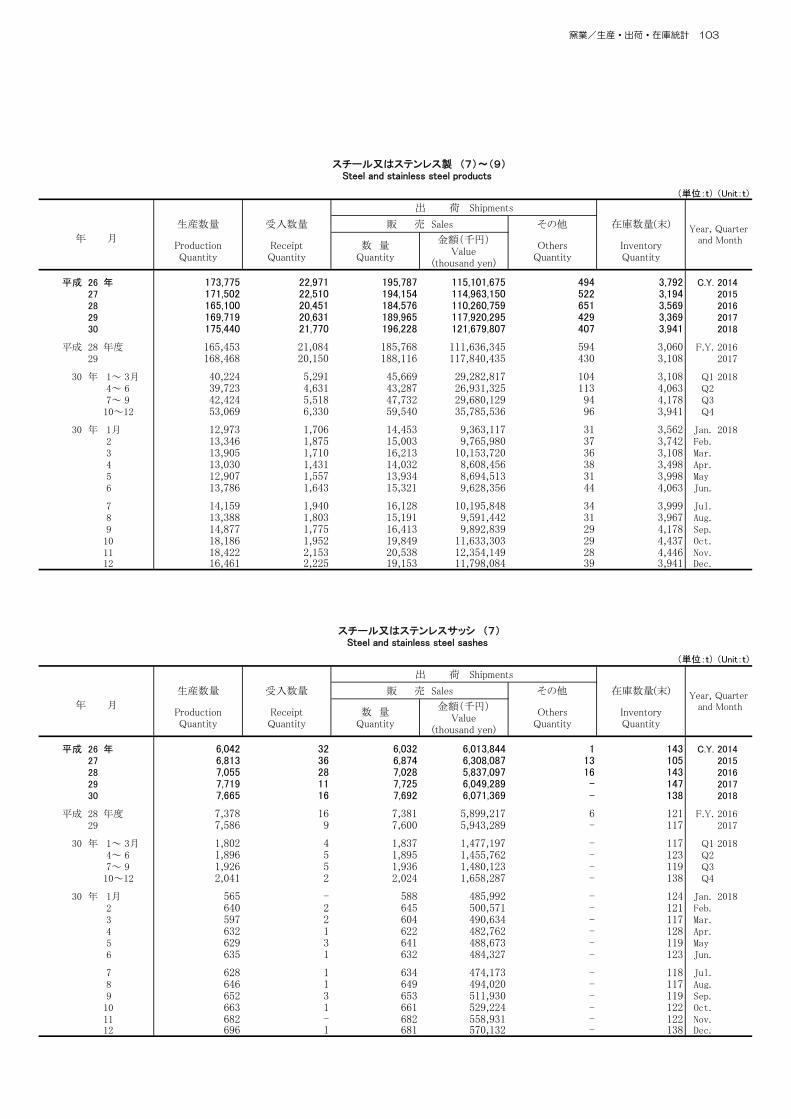
窯業/生産・出荷・在庫統計 103
1.生産・出荷・在庫統計 / Production, Shipment and Inventory
(2) 時系列表 / Historical Data by Commodities 6) 建築用金属製品 / Metal products of building ① 金属製建具(続き) / Metal building materials (continued)
(単位:t) (Unit:t)
出 荷 Shipments
生産数量 受入数量 販 売 Sales その他 在庫数量(末)
年 月ProductionQuantity
ReceiptQuantity
数 量Quantity
金額(千円)Value
(thousand yen)
OthersQuantity
InventoryQuantity
平成 26 年 173,775 22,971 195,787 115,101,675 494 3,792 C.Y. 201427 171,502 22,510 194,154 114,963,150 522 3,194 201528 165,100 20,451 184,576 110,260,759 651 3,569 201629 169,719 20,631 189,965 117,920,295 429 3,369 201730 175,440 21,770 196,228 121,679,807 407 3,941 2018
平成 28 年度 165,453 21,084 185,768 111,636,345 594 3,060 F.Y. 201629 168,468 20,150 188,116 117,840,435 430 3,108 2017
30 年 1~ 3月 40,224 5,291 45,669 29,282,817 104 3,108 Q1 2018 4~ 6 39,723 4,631 43,287 26,931,325 113 4,063 Q2 7~ 9 42,424 5,518 47,732 29,680,129 94 4,178 Q310~12 53,069 6,330 59,540 35,785,536 96 3,941 Q4
30 年 1月 12,973 1,706 14,453 9,363,117 31 3,562 Jan. 2018 2 13,346 1,875 15,003 9,765,980 37 3,742 Feb. 3 13,905 1,710 16,213 10,153,720 36 3,108 Mar. 4 13,030 1,431 14,032 8,608,456 38 3,498 Apr. 5 12,907 1,557 13,934 8,694,513 31 3,998 May 6 13,786 1,643 15,321 9,628,356 44 4,063 Jun.
7 14,159 1,940 16,128 10,195,848 34 3,999 Jul. 8 13,388 1,803 15,191 9,591,442 31 3,967 Aug. 9 14,877 1,775 16,413 9,892,839 29 4,178 Sep.10 18,186 1,952 19,849 11,633,303 29 4,437 Oct.11 18,422 2,153 20,538 12,354,149 28 4,446 Nov.12 16,461 2,225 19,153 11,798,084 39 3,941 Dec.
(単位:t) (Unit:t)
出 荷 Shipments
生産数量 受入数量 販 売 Sales その他 在庫数量(末)
年 月ProductionQuantity
ReceiptQuantity
数 量Quantity
金額(千円)Value
(thousand yen)
OthersQuantity
InventoryQuantity
平成 26 年 6,042 32 6,032 6,013,844 1 143 C.Y. 201427 6,813 36 6,874 6,308,087 13 105 201528 7,055 28 7,028 5,837,097 16 143 201629 7,719 11 7,725 6,049,289 - 147 201730 7,665 16 7,692 6,071,369 - 138 2018
平成 28 年度 7,378 16 7,381 5,899,217 6 121 F.Y. 201629 7,586 9 7,600 5,943,289 - 117 2017
30 年 1~ 3月 1,802 4 1,837 1,477,197 - 117 Q1 2018 4~ 6 1,896 5 1,895 1,455,762 - 123 Q2 7~ 9 1,926 5 1,936 1,480,123 - 119 Q310~12 2,041 2 2,024 1,658,287 - 138 Q4
30 年 1月 565 - 588 485,992 - 124 Jan. 2018 2 640 2 645 500,571 - 121 Feb. 3 597 2 604 490,634 - 117 Mar. 4 632 1 622 482,762 - 128 Apr. 5 629 3 641 488,673 - 119 May 6 635 1 632 484,327 - 123 Jun.
7 628 1 634 474,173 - 118 Jul. 8 646 1 649 494,020 - 117 Aug. 9 652 3 653 511,930 - 119 Sep.10 663 1 661 529,224 - 122 Oct.11 682 - 682 558,931 - 122 Nov.12 696 1 681 570,132 - 138 Dec.
スチール又はステンレス製 (7)~(9)Steel and stainless steel products
Year, Quarter and Month
スチール又はステンレスサッシ (7)Steel and stainless steel sashes
Year, Quarter and Month
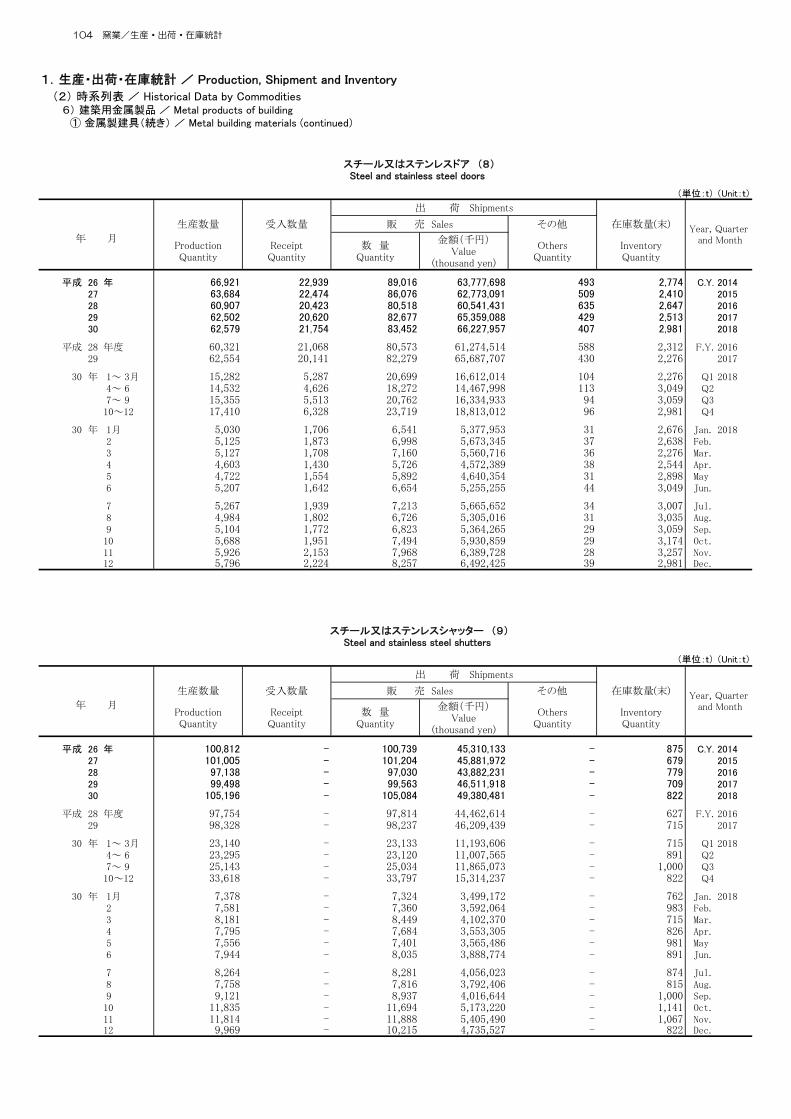
104 窯業/生産・出荷・在庫統計
1.生産・出荷・在庫統計 / Production, Shipment and Inventory
(2) 時系列表 / Historical Data by Commodities 6) 建築用金属製品 / Metal products of building ① 金属製建具(続き) / Metal building materials (continued)
(単位:t) (Unit:t)
出 荷 Shipments
生産数量 受入数量 販 売 Sales その他 在庫数量(末)
年 月ProductionQuantity
ReceiptQuantity
数 量Quantity
金額(千円)Value
(thousand yen)
OthersQuantity
InventoryQuantity
平成 26 年 66,921 22,939 89,016 63,777,698 493 2,774 C.Y. 201427 63,684 22,474 86,076 62,773,091 509 2,410 201528 60,907 20,423 80,518 60,541,431 635 2,647 201629 62,502 20,620 82,677 65,359,088 429 2,513 201730 62,579 21,754 83,452 66,227,957 407 2,981 2018
平成 28 年度 60,321 21,068 80,573 61,274,514 588 2,312 F.Y. 201629 62,554 20,141 82,279 65,687,707 430 2,276 2017
30 年 1~ 3月 15,282 5,287 20,699 16,612,014 104 2,276 Q1 2018 4~ 6 14,532 4,626 18,272 14,467,998 113 3,049 Q2 7~ 9 15,355 5,513 20,762 16,334,933 94 3,059 Q310~12 17,410 6,328 23,719 18,813,012 96 2,981 Q4
30 年 1月 5,030 1,706 6,541 5,377,953 31 2,676 Jan. 2018 2 5,125 1,873 6,998 5,673,345 37 2,638 Feb. 3 5,127 1,708 7,160 5,560,716 36 2,276 Mar. 4 4,603 1,430 5,726 4,572,389 38 2,544 Apr. 5 4,722 1,554 5,892 4,640,354 31 2,898 May 6 5,207 1,642 6,654 5,255,255 44 3,049 Jun.
7 5,267 1,939 7,213 5,665,652 34 3,007 Jul. 8 4,984 1,802 6,726 5,305,016 31 3,035 Aug. 9 5,104 1,772 6,823 5,364,265 29 3,059 Sep.10 5,688 1,951 7,494 5,930,859 29 3,174 Oct.11 5,926 2,153 7,968 6,389,728 28 3,257 Nov.12 5,796 2,224 8,257 6,492,425 39 2,981 Dec.
(単位:t) (Unit:t)
出 荷 Shipments
生産数量 受入数量 販 売 Sales その他 在庫数量(末)
年 月ProductionQuantity
ReceiptQuantity
数 量Quantity
金額(千円)Value
(thousand yen)
OthersQuantity
InventoryQuantity
平成 26 年 100,812 - 100,739 45,310,133 - 875 C.Y. 201427 101,005 - 101,204 45,881,972 - 679 201528 97,138 - 97,030 43,882,231 - 779 201629 99,498 - 99,563 46,511,918 - 709 201730 105,196 - 105,084 49,380,481 - 822 2018
平成 28 年度 97,754 - 97,814 44,462,614 - 627 F.Y. 201629 98,328 - 98,237 46,209,439 - 715 2017
30 年 1~ 3月 23,140 - 23,133 11,193,606 - 715 Q1 2018 4~ 6 23,295 - 23,120 11,007,565 - 891 Q2 7~ 9 25,143 - 25,034 11,865,073 - 1,000 Q310~12 33,618 - 33,797 15,314,237 - 822 Q4
30 年 1月 7,378 - 7,324 3,499,172 - 762 Jan. 2018 2 7,581 - 7,360 3,592,064 - 983 Feb. 3 8,181 - 8,449 4,102,370 - 715 Mar. 4 7,795 - 7,684 3,553,305 - 826 Apr. 5 7,556 - 7,401 3,565,486 - 981 May 6 7,944 - 8,035 3,888,774 - 891 Jun.
7 8,264 - 8,281 4,056,023 - 874 Jul. 8 7,758 - 7,816 3,792,406 - 815 Aug. 9 9,121 - 8,937 4,016,644 - 1,000 Sep.10 11,835 - 11,694 5,173,220 - 1,141 Oct.11 11,814 - 11,888 5,405,490 - 1,067 Nov.12 9,969 - 10,215 4,735,527 - 822 Dec.
スチール又はステンレスドア (8)Steel and stainless steel doors
Year, Quarter and Month
スチール又はステンレスシャッター (9)Steel and stainless steel shutters
Year, Quarter and Month
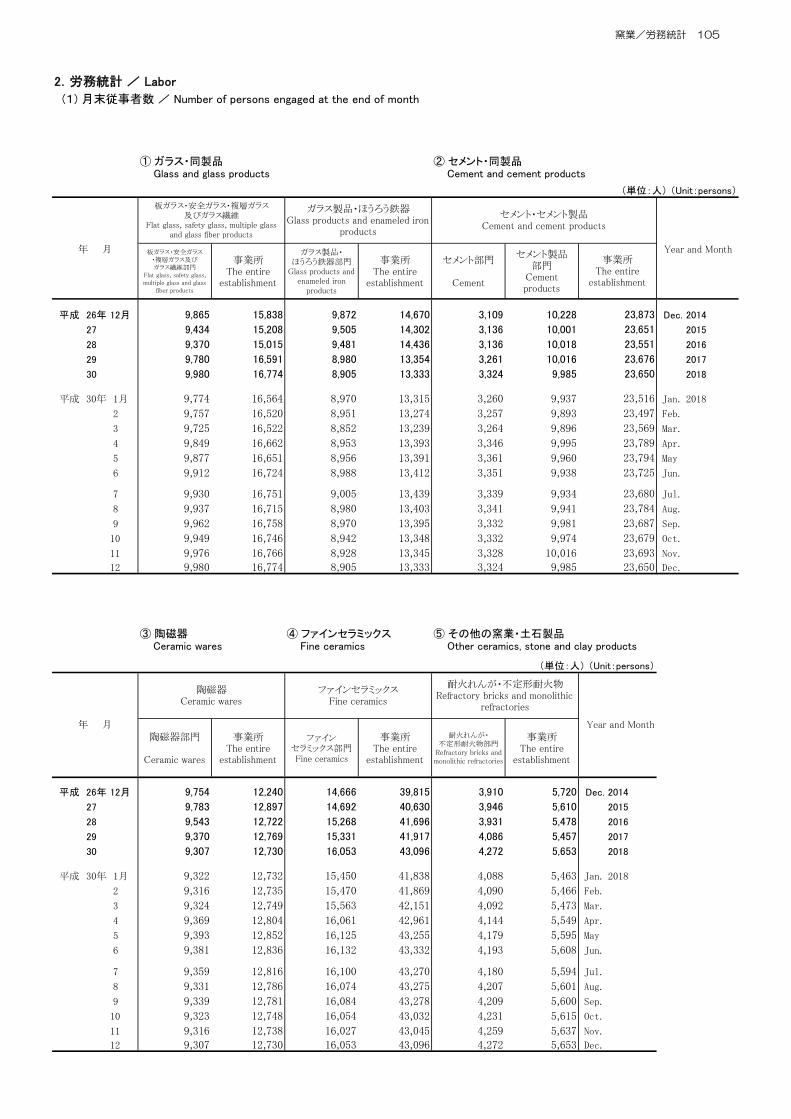
窯業/労務統計 105
2.労務統計 / Labor
(1) 月末従事者数 / Number of persons engaged at the end of month
(単位:人) (Unit:persons)
年 月 板ガラス・安全ガラス・複層ガラス及びガラス繊維部門
Flat glass, safety glass,multiple glass and glass
fiber products
事業所The entire
establishment
ガラス製品・ほうろう鉄器部門
Glass products andenameled iron
products
事業所The entire
establishment
セメント部門
Cement
セメント製品部門
Cementproducts
Year and Month
平成 26年 12月 9,865 15,838 9,872 14,670 3,109 10,228 Dec. 2014
27 9,434 15,208 9,505 14,302 3,136 10,001 2015
28 9,370 15,015 9,481 14,436 3,136 10,018 2016
29 9,780 16,591 8,980 13,354 3,261 10,016 2017
30 9,980 16,774 8,905 13,333 3,324 9,985 2018
平成 30年 1月 9,774 16,564 8,970 13,315 3,260 9,937 Jan. 2018
2 9,757 16,520 8,951 13,274 3,257 9,893 Feb.
3 9,725 16,522 8,852 13,239 3,264 9,896 Mar.
4 9,849 16,662 8,953 13,393 3,346 9,995 Apr.
5 9,877 16,651 8,956 13,391 3,361 9,960 May
6 9,912 16,724 8,988 13,412 3,351 9,938 Jun.
7 9,930 16,751 9,005 13,439 3,339 9,934 Jul.
8 9,937 16,715 8,980 13,403 3,341 9,941 Aug.
9 9,962 16,758 8,970 13,395 3,332 9,981 Sep.
10 9,949 16,746 8,942 13,348 3,332 9,974 Oct.
11 9,976 16,766 8,928 13,345 3,328 10,016 Nov.
12 9,980 16,774 8,905 13,333 3,324 9,985 Dec.
(単位:人) (Unit:persons)
年 月陶磁器部門
Ceramic wares
事業所The entire
establishment
ファインセラミックス部門Fine ceramics
事業所The entire
establishment
耐火れんが・不定形耐火物部門
Refractory bricks andmonolithic refractories
事業所The entire
establishment
Year and Month
平成 26年 12月 9,754 12,240 14,666 39,815 3,910 5,720 Dec. 2014
27 9,783 12,897 14,692 40,630 3,946 5,610 2015
28 9,543 12,722 15,268 41,696 3,931 5,478 2016
29 9,370 12,769 15,331 41,917 4,086 5,457 2017
30 9,307 12,730 16,053 43,096 4,272 5,653 2018
平成 30年 1月 9,322 12,732 15,450 41,838 4,088 5,463 Jan. 2018
2 9,316 12,735 15,470 41,869 4,090 5,466 Feb.
3 9,324 12,749 15,563 42,151 4,092 5,473 Mar.
4 9,369 12,804 16,061 42,961 4,144 5,549 Apr.
5 9,393 12,852 16,125 43,255 4,179 5,595 May
6 9,381 12,836 16,132 43,332 4,193 5,608 Jun.
7 9,359 12,816 16,100 43,270 4,180 5,594 Jul.
8 9,331 12,786 16,074 43,275 4,207 5,601 Aug.
9 9,339 12,781 16,084 43,278 4,209 5,600 Sep.
10 9,323 12,748 16,054 43,032 4,231 5,615 Oct.
11 9,316 12,738 16,027 43,045 4,259 5,637 Nov.
12 9,307 12,730 16,053 43,096 4,272 5,653 Dec.
23,687
耐火れんが・不定形耐火物Refractory bricks and monolithic
refractories
23,679
23,693
23,650
23,725
23,680
23,784
23,569
23,789
23,794
23,650
23,516
23,497
23,873
23,651
23,551
ガラス製品・ほうろう鉄器Glass products and enameled iron
products
セメント・セメント製品Cement and cement products
① ガラス・同製品 Glass and glass products
② セメント・同製品 Cement and cement products
陶磁器Ceramic wares
③ 陶磁器 Ceramic wares
④ ファインセラミックス Fine ceramics
⑤ その他の窯業・土石製品 Other ceramics, stone and clay products
ファインセラミックスFine ceramics
板ガラス・安全ガラス・複層ガラス及びガラス繊維
Flat glass, safety glass, multiple glassand glass fiber products
事業所The entire
establishment
23,676

106 窯業/労務統計
2.労務統計 / Labor
(1) 月末従事者数(続き) / Number of persons engaged at the end of month (continued)
(単位:人) (Unit:persons)
年 月炭素製品・研削砥石
Carbon products andgrinding wheels
事業所The entire
establishment
事業所The entire
establishment
金属製建具部門Metal building
materials
事業所The entire
establishment
Year and Month
平成 26年 12月 6,223 14,770 10,167 15,997 23,408 Dec. 2014
27 6,244 14,958 10,325 15,750 23,339 2015
28 6,099 14,763 10,259 15,667 23,635 2016
29 6,026 15,484 10,366 15,821 23,736 2017
30 6,036 15,441 10,369 15,838 23,454 2018
平成 30年 1月 6,023 15,452 10,334 15,806 23,676 Jan. 2018
2 6,020 15,440 10,285 15,836 23,684 Feb.
3 5,969 15,390 10,230 15,785 23,651 Mar.
4 6,015 15,501 10,405 15,935 23,522 Apr.
5 6,068 15,509 10,430 15,870 23,474 May
6 6,056 15,485 10,461 15,802 23,437 Jun.
7 6,046 15,478 10,448 15,776 23,370 Jul.
8 6,018 15,456 10,459 15,820 23,409 Aug.
9 6,023 15,468 10,404 15,845 23,382 Sep.
10 6,034 15,445 10,367 15,831 23,435 Oct.
11 6,039 15,454 10,394 15,888 23,470 Nov.
12 6,036 15,441 10,369 15,838 23,454 Dec.
4,844
4,850
4,848
4,848
4,881
4,885
4,883
4,831
4,898
4,881
4,884
4,848
4,873
4,848
ボード・パネル部門
Board and panels
4,691
4,794
4,795
⑥ 建築用金属製品 Metal products of building
ボード・パネルBoard and panels
金属製建具Metal building materials
炭素製品・研削砥石Carbon products and grinding wheels
⑤ その他の窯業・土石製品(続き) Other ceramics, stone and clay products (continued)

窯業/生産能力統計 107
3.生産能力統計 / Productive capacity statistics
年 月 能 力(換算箱)Capacity(blocks)
生 産(換算箱)
Production(blocks)
稼 働 率Operating
ratio(%)
能 力Capacity
(m2)
生 産Production
(m2)
稼 働 率Operating
ratio(%)
平成 26 年 3,545,000 2,148,352 60.6 5,358,992 3,617,207 67.5 C.Y. 2014
27 3,545,000 2,250,031 63.5 5,358,992 3,777,596 70.5 2015
28 3,545,000 2,132,004 58.2 5,358,992 3,839,699 67.4 2016
29 3,545,000 2,249,576 60.6 5,358,722 3,954,897 70.2 2017
30 3,545,000 2,151,401 63.0 5,361,722 4,029,990 72.1 2018
平成 28 年度 3,545,000 2,176,727 58.4 5,358,722 3,964,199 68.0 F.Y. 2016
29 3,545,000 2,155,648 61.2 5,358,722 4,169,394 70.9 2017
30 年 1 ~ 3月 3,545,000 2,155,648 60.1 5,358,722 4,169,394 72.6 Q1 2018
4 ~ 6 3,545,000 2,334,374 64.8 5,361,722 3,929,231 69.6 Q2
7 ~ 9 3,545,000 2,270,292 63.5 5,361,722 3,841,658 69.1 Q3
10~12 3,545,000 2,151,401 63.4 5,361,722 4,029,990 77.0 Q4
平成 30年 1月 3,545,000 2,232,650 63.0 5,358,722 3,703,349 69.1 Jan. 2018
2 3,545,000 2,005,177 56.6 5,358,722 3,792,179 70.8 Feb.
3 3,545,000 2,155,648 60.8 5,358,722 4,169,394 77.8 Mar.
4 3,545,000 2,183,558 61.6 5,361,722 3,832,320 71.5 Apr.
5 3,545,000 2,380,337 67.1 5,361,722 3,431,100 64.0 May
6 3,545,000 2,334,374 65.8 5,361,722 3,929,231 73.3 Jun.
7 3,545,000 2,403,328 67.8 5,361,722 3,949,518 73.7 Jul.
8 3,545,000 2,081,389 58.7 5,361,722 3,318,508 61.9 Aug.
9 3,545,000 2,270,292 64.0 5,361,722 3,841,658 71.6 Sep.
10 3,545,000 2,401,485 67.7 5,361,722 4,133,630 77.1 Oct.
11 3,545,000 2,188,122 61.7 5,361,722 4,214,046 78.6 Nov.
12 3,545,000 2,151,401 60.7 5,361,722 4,029,990 75.2 Dec.
注: 稼働率の算定方法は、111ページを参照(以下同じ。)。Notes: Please refer to page 111 for the calculation method of the operating ratio"as well as following".
年 月 能 力Capacity
(t)
生 産Production
(t)
稼 働 率Operating
ratio(%)
能 力Capacity
(t)
生 産Production
(t)
稼 働 率Operating
ratio(%)
平成 26 年 21,072 17,321 82.2 23,810 18,932 79.5 C.Y. 2014
27 21,072 17,383 82.5 19,320 15,395 79.7 2015
28 21,187 18,415 81.9 18,820 15,644 77.5 2016
29 21,487 17,834 82.7 18,820 16,451 86.3 2017
30 20,222 17,293 80.9 18,820 15,282 82.9 2018
平成 28 年度 21,487 19,232 81.8 18,820 16,195 79.6 F.Y. 2016
29 21,487 18,488 82.8 18,820 14,348 86.1 2017
30 年 1 ~ 3月 21,487 18,488 85.3 18,820 14,348 83.4 Q1 2018
4 ~ 6 21,487 16,515 73.2 18,820 14,855 77.2 Q2
7 ~ 9 21,487 17,136 78.4 18,820 15,970 86.5 Q3
10~12 20,222 17,293 86.6 18,820 15,282 84.6 Q4
平成 30年 1月 21,487 18,618 86.6 18,820 17,515 93.1 Jan. 2018
2 21,487 17,872 83.2 18,820 15,251 81.0 Feb.
3 21,487 18,488 86.0 18,820 14,348 76.2 Mar.
4 21,487 15,778 73.4 18,820 14,216 75.5 Apr.
5 21,487 14,917 69.4 18,820 14,519 77.1 May
6 21,487 16,515 76.9 18,820 14,855 78.9 Jun.
7 21,487 18,141 84.4 18,820 16,820 89.4 Jul.
8 21,487 15,271 71.1 18,820 16,033 85.2 Aug.
9 21,487 17,136 79.8 18,820 15,970 84.9 Sep.
10 21,487 18,588 86.5 18,820 16,850 89.5 Oct.
11 20,222 17,729 87.7 18,820 15,644 83.1 Nov.
12 20,222 17,293 85.5 18,820 15,282 81.2 Dec.
Year and Month
Year and Month
ガラス短繊維Glass fiber wool products
ガラス長繊維Glass fiber continuous textiles
① ガラス・同製品 Glass and glass products
素板ガラスMaterial flat glass
安全ガラスSafety glass

108 窯業/生産能力統計
3.生産能力統計(続き) / Productive capacity statistics (continued)
年 月 能 力Capacity
(t)
引き出し量Draw
(t)
稼 働 率Operating
ratio(%)
生 産Production
(t)
能 力Capacity
(t)
平成 26 年 1,093 541 49.5 266 198,386 C.Y. 2014
27 1,086 703 64.7 290 198,398 2015
28 1,106 637 60.0 280 195,978 2016
29 1,169 677 60.9 331 195,877 2017
30 1,166 480 50.5 246 195,907 2018
平成 28 年度 1,106 612 58.3 278 195,977 F.Y. 2016
29 1,166 604 60.1 291 195,807 2017
30 年 1 ~ 3月 1,166 604 54.8 291 195,807 Q1 2018
4 ~ 6 1,166 626 50.1 359 195,807 Q2
7 ~ 9 1,166 529 49.5 264 195,807 Q3
10~12 1,166 480 47.6 246 195,907 Q4
平成 30年 1月 1,166 646 55.4 276 195,877 Jan. 2018
2 1,166 667 57.2 308 195,877 Feb.
3 1,166 604 51.8 291 195,807 Mar.
4 1,166 545 46.7 282 195,807 Apr.
5 1,166 581 49.8 311 195,907 May
6 1,166 626 53.7 359 195,807 Jun.
7 1,166 607 52.1 325 195,807 Jul.
8 1,166 594 50.9 314 195,807 Aug.
9 1,166 529 45.4 264 195,807 Sep.
10 1,166 565 48.5 257 195,907 Oct.
11 1,166 619 53.1 332 195,907 Nov.
12 1,166 480 41.2 246 195,907 Dec.
年 月 稼 働 率Operating
ratio(%)
生 産Production
(t)
能 力Capacity
(1000m2)
生 産Production
(1000m2)
稼 働 率Operating
ratio(%)
平成 26 年 66.2 100,328 x x x C.Y. 2014
27 65.7 100,436 x x x 2015
28 68.4 102,218 4,799 2,833 60.7 2016
29 65.6 94,977 4,868 2,227 63.6 2017
30 63.9 94,365 4,868 3,113 62.1 2018
平成 28 年度 67.4 95,237 4,379 3,143 64.0 F.Y. 2016
29 65.1 93,940 4,868 3,087 62.0 2017
30 年 1 ~ 3月 58.8 93,940 4,868 3,087 62.5 Q1 2018
4 ~ 6 65.4 99,651 4,868 2,688 59.6 Q2
7 ~ 9 65.3 100,216 4,868 2,731 61.7 Q3
10~12 66.0 94,365 4,868 3,113 64.7 Q4
平成 30年 1月 56.8 83,103 4,868 3,117 64.0 Jan. 2018
2 56.6 86,690 4,868 2,931 60.2 Feb.
3 62.9 93,940 4,868 3,087 63.4 Mar.
4 66.5 101,979 4,868 2,956 60.7 Apr.
5 63.8 96,138 4,868 3,063 62.9 May
6 65.9 99,651 4,868 2,688 55.2 Jun.
7 67.6 102,654 4,868 2,998 61.6 Jul.
8 62.6 92,070 4,868 3,288 67.5 Aug.
9 65.6 100,216 4,868 2,731 56.1 Sep.
10 66.8 102,484 4,868 3,210 65.9 Oct.
11 67.4 102,675 4,868 3,131 64.3 Nov.
12 63.9 94,365 4,868 3,113 63.9 Dec.
Year and Month
Year andMonth
容器類(続き)Glass containers (continued)
無アルカリガラス基板Nonalkali glass substrates
132,309
122,555
128,486
130,784
132,060
125,160
① ガラス・同製品(続き) Glass and glass products (continued)
光学用ガラス素地Optical glass blanks
容器類Glass containers
引き出し量Draw
(t)
131,342
130,328
132,611
123,902
125,160
122,997
123,243
123,243
130,237
124,909
128,962
128,962
128,486
125,160
111,201
110,873
123,243

窯業/生産能力統計 109
3.生産能力統計(続き) / Production Capacity (continued)
年 月 能 力Capacity
(t)
生 産Production
(t)
稼 働 率Operating
ratio(%)
能 力Capacity
(t)
生 産Production
(t)
稼 働 率Operating
ratio(%)
平成 26 年 5,033,658 4,644,547 92.3 354,761 161,812 45.6 C.Y. 2014
27 5,055,517 4,474,204 88.5 339,261 143,531 42.3 2015
28 5,029,253 4,747,766 83.1 335,445 153,234 47.1 2016
29 4,894,827 4,572,854 87.6 322,445 152,911 48.4 2017
30 4,898,205 4,575,748 86.8 321,345 140,546 47.2 2018
平成 28 年度 4,997,525 4,685,719 83.8 322,445 164,190 47.7 F.Y. 2016
29 4,904,853 4,649,704 87.4 321,345 167,186 48.7 2017
30 年 1 ~ 3月 4,904,853 4,649,704 84.6 321,345 167,186 47.5 Q1 2018
4 ~ 6 4,898,205 4,119,673 83.1 321,345 167,452 49.2 Q2
7 ~ 9 4,898,205 4,195,597 87.7 321,345 136,773 45.6 Q3
10~12 4,898,205 4,575,748 91.7 321,345 140,546 46.6 Q4
平成 30年 1月 4,908,622 3,944,225 80.4 321,445 135,007 42.0 Jan. 2018
2 4,908,622 3,857,177 78.6 321,445 156,202 48.6 Feb.
3 4,904,853 4,649,704 94.8 321,345 167,186 52.0 Mar.
4 4,898,753 3,981,288 81.3 321,345 158,276 49.3 Apr.
5 4,898,205 4,110,433 83.9 321,345 148,271 46.1 May
6 4,898,205 4,119,673 84.1 321,345 167,452 52.1 Jun.
7 4,898,205 4,383,332 89.5 321,345 162,719 50.6 Jul.
8 4,898,205 4,299,845 87.8 321,345 140,242 43.6 Aug.
9 4,898,205 4,195,597 85.7 321,345 136,773 42.6 Sep.
10 4,898,205 4,463,306 91.1 321,345 158,662 49.4 Oct.
11 4,898,205 4,433,555 90.5 321,345 150,030 46.7 Nov.
12 4,898,205 4,575,748 93.4 321,345 140,546 43.7 Dec.
年 月 能 力Capacity
(m3)
生 産Production
(m3)
稼 働 率Operating
ratio(%)
能 力Capacity
(m2)
生 産Production
(m2)
稼 働 率Operating
ratio(%)
平成 26 年 258,966 149,389 57.7 3,621,731 1,780,644 49.2 C.Y. 2014
27 258,966 144,100 55.6 3,579,731 1,596,420 44.6 2015
28 247,500 149,907 52.6 3,434,731 1,609,537 46.4 2016
29 247,500 140,690 54.0 3,243,731 1,645,203 48.7 2017
30 247,500 143,068 52.8 3,093,731 1,546,975 49.6 2018
平成 28 年度 247,500 132,056 53.2 3,243,731 1,672,610 46.7 F.Y. 2016
29 247,500 124,581 53.0 3,173,731 1,695,290 48.8 2017
30 年 1 ~ 3月 247,500 124,581 48.8 3,173,731 1,695,290 48.2 Q1 2018
4 ~ 6 247,500 130,872 49.8 3,173,731 1,633,516 49.3 Q2
7 ~ 9 247,500 135,836 52.9 3,173,731 1,606,351 48.8 Q3
10~12 247,500 143,068 59.7 3,093,731 1,546,975 52.3 Q4
平成 30年 1月 247,500 117,873 47.6 3,173,731 1,299,612 40.9 Jan. 2018
2 247,500 120,382 48.6 3,173,731 1,597,076 50.3 Feb.
3 247,500 124,581 50.3 3,173,731 1,695,290 53.4 Mar.
4 247,500 126,385 51.1 3,173,731 1,661,329 52.3 Apr.
5 247,500 112,214 45.3 3,173,731 1,403,646 44.2 May
6 247,500 130,872 52.9 3,173,731 1,633,516 51.5 Jun.
7 247,500 135,466 54.7 3,173,731 1,703,783 53.7 Jul.
8 247,500 121,153 49.0 3,173,731 1,334,249 42.0 Aug.
9 247,500 135,836 54.9 3,173,731 1,606,351 50.6 Sep.
10 247,500 149,507 60.4 3,173,731 1,752,505 55.2 Oct.
11 247,500 150,708 60.9 3,173,731 1,638,830 51.6 Nov.
12 247,500 143,068 57.8 3,093,731 1,546,975 50.0 Dec.
Year and Month
Year and Month
③ 陶磁器 Ceramic wares
気泡コンクリート製品 (ALC製品)Autoclaved light weight concrete products
タイル計Tiles total
② セメント・同製品 Cement and cement products
セメント (クリンカ)Cement (clinker)
遠心力鉄筋コンクリート製品 (ポール・パイル)Centrifugal ferroconcrete products
(poles and piles)
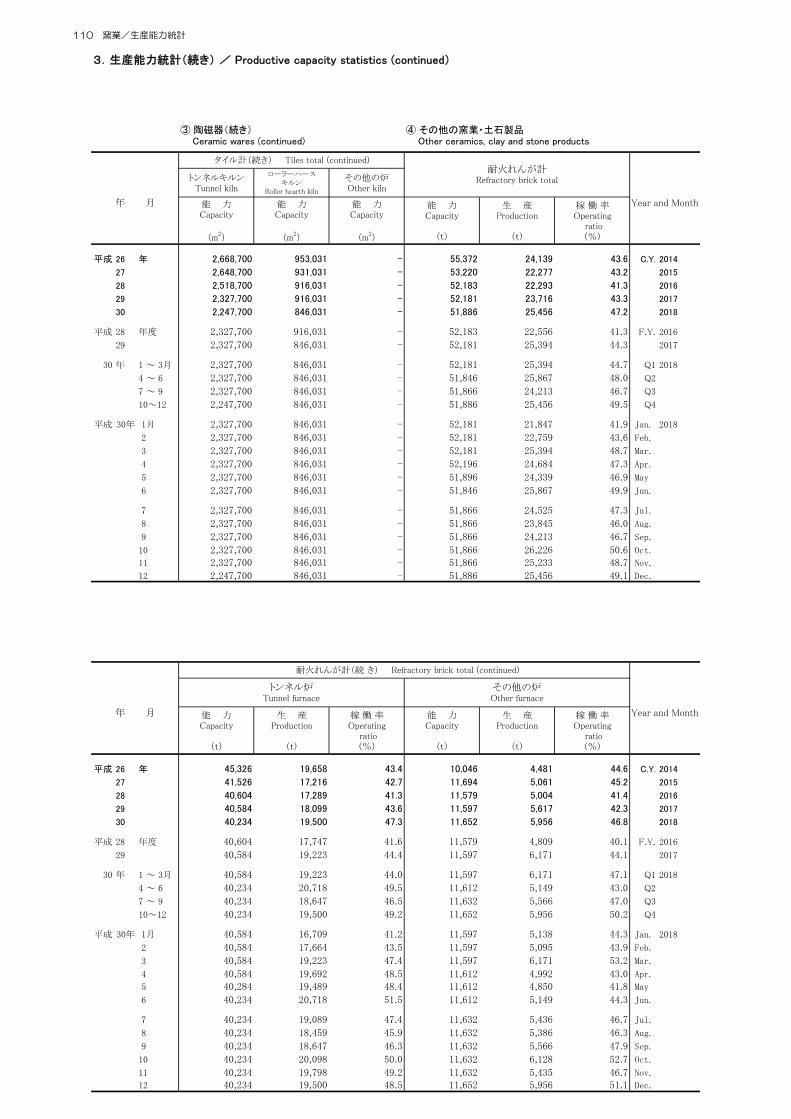
110 窯業/生産能力統計
3.生産能力統計(続き) / Productive capacity statistics (continued)
トンネルキルンTunnel kiln
ローラーハースキルン
Roller hearth kiln
その他の炉Other kiln
年 月 能 力Capacity
(m2)
能 力Capacity
(m2)
能 力Capacity
(m2)
能 力Capacity
(t)
生 産Production
(t)
稼 働 率Operating
ratio(%)
平成 26 年 2,668,700 953,031 - 55,372 24,139 43.6 C.Y. 2014
27 2,648,700 931,031 - 53,220 22,277 43.2 2015
28 2,518,700 916,031 - 52,183 22,293 41.3 2016
29 2,327,700 916,031 - 52,181 23,716 43.3 2017
30 2,247,700 846,031 - 51,886 25,456 47.2 2018
平成 28 年度 2,327,700 916,031 - 52,183 22,556 41.3 F.Y. 2016
29 2,327,700 846,031 - 52,181 25,394 44.3 2017
30 年 1 ~ 3月 2,327,700 846,031 - 52,181 25,394 44.7 Q1 2018
4 ~ 6 2,327,700 846,031 - 51,846 25,867 48.0 Q2
7 ~ 9 2,327,700 846,031 - 51,866 24,213 46.7 Q3
10~12 2,247,700 846,031 - 51,886 25,456 49.5 Q4
平成 30年 1月 2,327,700 846,031 - 52,181 21,847 41.9 Jan. 2018
2 2,327,700 846,031 - 52,181 22,759 43.6 Feb.
3 2,327,700 846,031 - 52,181 25,394 48.7 Mar.
4 2,327,700 846,031 - 52,196 24,684 47.3 Apr.
5 2,327,700 846,031 - 51,896 24,339 46.9 May
6 2,327,700 846,031 - 51,846 25,867 49.9 Jun.
7 2,327,700 846,031 - 51,866 24,525 47.3 Jul.
8 2,327,700 846,031 - 51,866 23,845 46.0 Aug.
9 2,327,700 846,031 - 51,866 24,213 46.7 Sep.
10 2,327,700 846,031 - 51,866 26,226 50.6 Oct.
11 2,327,700 846,031 - 51,866 25,233 48.7 Nov.
12 2,247,700 846,031 - 51,886 25,456 49.1 Dec.
年 月 能 力Capacity
(t)
生 産Production
(t)
稼 働 率Operating
ratio(%)
能 力Capacity
(t)
生 産Production
(t)
稼 働 率Operating
ratio(%)
平成 26 年 45,326 19,658 43.4 10,046 4,481 44.6 C.Y. 2014
27 41,526 17,216 42.7 11,694 5,061 45.2 2015
28 40,604 17,289 41.3 11,579 5,004 41.4 2016
29 40,584 18,099 43.6 11,597 5,617 42.3 2017
30 40,234 19,500 47.3 11,652 5,956 46.8 2018
平成 28 年度 40,604 17,747 41.6 11,579 4,809 40.1 F.Y. 2016
29 40,584 19,223 44.4 11,597 6,171 44.1 2017
30 年 1 ~ 3月 40,584 19,223 44.0 11,597 6,171 47.1 Q1 2018
4 ~ 6 40,234 20,718 49.5 11,612 5,149 43.0 Q2
7 ~ 9 40,234 18,647 46.5 11,632 5,566 47.0 Q3
10~12 40,234 19,500 49.2 11,652 5,956 50.2 Q4
平成 30年 1月 40,584 16,709 41.2 11,597 5,138 44.3 Jan. 2018
2 40,584 17,664 43.5 11,597 5,095 43.9 Feb.
3 40,584 19,223 47.4 11,597 6,171 53.2 Mar.
4 40,584 19,692 48.5 11,612 4,992 43.0 Apr.
5 40,284 19,489 48.4 11,612 4,850 41.8 May
6 40,234 20,718 51.5 11,612 5,149 44.3 Jun.
7 40,234 19,089 47.4 11,632 5,436 46.7 Jul.
8 40,234 18,459 45.9 11,632 5,386 46.3 Aug.
9 40,234 18,647 46.3 11,632 5,566 47.9 Sep.
10 40,234 20,098 50.0 11,632 6,128 52.7 Oct.
11 40,234 19,798 49.2 11,632 5,435 46.7 Nov.
12 40,234 19,500 48.5 11,652 5,956 51.1 Dec.
Year and Month
トンネル炉Tunnel furnace
その他の炉Other furnace
Year and Month
耐火れんが計(続 き) Refractory brick total (continued)
③ 陶磁器(続き) Ceramic wares (continued)
④ その他の窯業・土石製品 Other ceramics, clay and stone products
タイル計(続き) Tiles total (continued)耐火れんが計
Refractory brick total

窯業/生産能力統計 111
3.生産能力統計(続き) / Production Capacity (continued)
年 月 能 力Capacity
(kg)
生 産Production
(kg)
平成 26 年 2,151,700 1,448,949 C.Y. 2014
27 2,243,000 1,433,308 2015
28 2,192,600 1,630,579 2016
29 2,192,600 1,664,497 2017
30 2,192,600 1,630,991 2018
平成 28 年度 2,192,600 1,397,978 F.Y. 2016
29 2,192,600 1,740,102 2017
30 年 1 ~ 3月 2,192,600 1,740,102 Q1 2018
4 ~ 6 2,192,600 1,328,592 Q2
7 ~ 9 2,192,600 1,574,636 Q3
10~12 2,192,600 1,630,991 Q4
平成 30年 1月 2,192,600 1,503,400 Jan. 2018
2 2,192,600 1,397,694 Feb.
3 2,192,600 1,740,102 Mar.
4 2,192,600 1,485,851 Apr.
5 2,192,600 1,902,955 May
6 2,192,600 1,328,592 Jun.
7 2,192,600 1,432,216 Jul.
8 2,192,600 1,356,182 Aug.
9 2,192,600 1,574,636 Sep.
10 2,192,600 1,733,001 Oct.
11 2,192,600 1,578,315 Nov.
12 2,192,600 1,630,991 Dec.
Year andMonth
④ その他の窯業・土石製品(続き) Other ceramics, clay and stone products (continued)
炭素繊維Carbon fiber
[稼働率の算定方法]1.素板ガラスは (素板ガラスの生産/溶解炉の生産能力)×100 で表示した。2.安全ガラスは (合わせガラス及び強化ガラスの合計生産量/成形炉の生産能力)×100 で表示した。3.ガラス繊維製品は (原繊維の生産/原繊維の生産能力)×100 で表示した。
4.光学用ガラス素地は (光学用ガラス素地の引き出し量/光学用ガラス素地用溶解炉の生産能力)×100 で表示し
た。
5.容器類は (容器類の引き出し量/容器類用溶解炉の生産能力)×100 で表示した。
6.無アルカリガラス基板は (無アルカリガラス基板の生産/無アルカリガラス基板の生産能力)×100 で表示した。
7.セメントは (クリンカの生産/クリンカの生産能力)×100 で表示した。8.遠心力鉄筋コンクリート製品(ポール・パイル)は (遠心力鉄筋コンクリート製品の生産/遠心力鉄筋コンクリート製産能力)×100 で表示した。
9.気泡コンクリート製品は (気泡コンクリート製品の生産/気泡コンクリート製品の生産能力)×100 で表示した。
10.タイルは (外装、内装、床及びモザイクタイルの生産/タイル用焼成炉の生産能力)×100 で表示した。
11.耐火れんがは (焼成れんがの生産/焼成炉の生産能力)×100 で表示した。
[Formulas] Notes: Operating ratio have been expressed, as handled in this statistics, as follows:1. Regarding material flat glass--production of material flat glass / capacity of melting furnace×1002. Regarding safety glass --total production of laminated glass and tempered glass / capacity of forming furnace×1003. Regarding glass fiber products--production of basic fiber / production capacity of basic fiber×1004. Regarding optical glass blanks--draw of optical glass blanks / capacity of melting furnace for optical glass blanks×1005. Regarding glass containers--draw of glass containers / capacity of melting furnace for glass containers×1006. Regarding nonalkali glass substrates--(production of nonalkali glass substrates/monthly production capacity )×100 7. Regarding cement--production of clinker / production capacity of clinker×1008. Regarding centrifugal reinforced-concrete products(poles and piles)
--production of centrifugal reinforcedconcrete products / production capacity of centrifugal reinforcedconcrete products(polesand piles)×1009. Regarding autoclaved lightweight concrete products
--Production of autoclaved lightweight concrete products / production capacity of autoclaved lightweight concrete product10. Regarding tiles--production of facing, interior wall, floor and mosaic tiles / capacity of baking furnace for tiles×100
[稼働率の算定方法]1.素板ガラスは (素板ガラスの生産/溶解炉の生産能力)×100 で表示した。2.安全ガラスは (合わせガラス及び強化ガラスの合計生産量/成形炉の生産能力)×100 で表示した。3.ガラス繊維製品は (原繊維の生産/原繊維の生産能力)×100 で表示した。4.光学用ガラス素地は (光学用ガラス素地の引き出し量/光学用ガラス素地用溶解炉の生産能力)×100 で表示した。5.容器類は (容器類の引き出し量/容器類用溶解炉の生産能力)×100 で表示した。6.無アルカリガラス基板は (無アルカリガラス基板の生産/無アルカリガラス基板の生産能力)×100 で表示した。
7.セメントは (クリンカの生産/クリンカの生産能力)×100 で表示した。8.遠心力鉄筋コンクリート製品(ポール・パイル)は (遠心力鉄筋コンクリート製品の生産/遠心力鉄筋コンクリート製品の生産能力)×100 で表示した。
9.気泡コンクリート製品は (気泡コンクリート製品の生産/気泡コンクリート製品の生産能力)×100 で表示した。10.タイルは (外装、内装、床及びモザイクタイルの生産/タイル用焼成炉の生産能力)×100 で表示した。
11.耐火れんがは (焼成れんがの生産/焼成炉の生産能力)×100 で表示した。
12.年、年度及び四半期の稼働率については、期間ごとの平均値としている。
[Formulas] Notes: Operating ratio have been expressed, as handled in this statistics, as follows:1. Regarding material flat glass--production of material flat glass / capacity of melting furnace×1002. Regarding safety glass --total production of laminated glass and tempered glass / capacity of forming furnace×1003. Regarding glass fiber products--production of basic fiber / production capacity of basic fiber×1004. Regarding optical glass blanks--draw of optical glass blanks / capacity of melting furnace for optical glass blanks×1005. Regarding glass containers--draw of glass containers / capacity of melting furnace for glass containers×1006. Regarding nonalkali glass substrates--(production of nonalkali glass substrates/monthly production capacity )×100 7. Regarding cement--production of clinker / production capacity of clinker×1008. Regarding centrifugal reinforced-concrete products(poles and piles)
--production of centrifugal reinforcedconcrete products / production capacity of centrifugal reinforcedconcrete products(poles and piles)×1009. Regarding autoclaved lightweight concrete products
--Production of autoclaved lightweight concrete products / production capacity of autoclaved lightweight concrete products×10010. Regarding tiles--production of facing, interior wall, floor and mosaic tiles / capacity of baking furnace for tiles×10011. Regarding refractory bricks--production of burnt clay bricks / burning capacity of furnace×10012.“Operating ratios” for calendar years, fiscal years, and quarters are the period average values.

3 0
ガラス製品・ほうろう鉄器月報注:1.販売金額とは、販売数量を契約価格又は生産者販売価格(消費税を含む)で評価した金額をいい、契約価格又は
生産者販売価格とは、企業の販売価格から積込料、運賃、保険料、その他の販売諸掛を除いたものです。
翌月10日
基 幹 統 計経 済 産 業 省 生 産 動 態 統 計
提 出 先 提出期日 提出部数
都道府県知事 2部
化 学 強 化 ガ ラ ス
2 6
8
経済産業省生産動態統計調査
経 済 産 業 省(鉱工業動態統計室)
112 調査票様式

1-2.製 品
1-1.製 品
4. 生 産 設 備 能 力
生 産
和 飲 食 器 陶 磁 器 部 門
事 業 所洋 飲 食 器
そ の 他 の 台 所・食 卓 用 品
玩 具 ・ 置 物
食卓用品
台
所
・
kg 0112
kg 0113
kg 0114
kg 0115
3 0
24
A B
ト ン ネ ル キ ル ン
ロ ー ラ ー ハ ー ス キ ル ン
そ の 他 の 炉
月 間 生 産 能 力
基 幹 統 計経 済 産 業 省 生 産 動 態 統 計
提 出 先 提出期日 提出部数
都道府県知事 2部翌月 10日
8
重 量 金 額(千円)
単位:人
単位:m2
経済産業省生産動態統計調査
経 済 産 業 省(鉱工業動態統計室)
調査票様式 113

2 3
3 0
フ ァ イ ン セ ラ ミ ッ ク ス 部 門
事 業 所
基 幹 統 計経 済 産 業 省 生 産 動 態 統 計
提 出 先 提出期日 提出部数
都道府県知事 2部翌月 10日
8
経済産業省生産動態統計調査
経 済 産 業 省(鉱工業動態統計室)
114 調査票様式

統計調査番号 調 査 票 番 号 年 月分 事 業 所 番 号
都道府県 整 理 番 号
A 0 7 7 2 3 0 2 0 1 8
1.製 品
項 目
品 目
単
位
番
号
生 産 受 入 消 費出 荷
月末在庫販 売そ の 他
数 量 金 額(千円)
A B C D E F G
板 ガ ラ ス 換算箱 0101
自動車用及び鉄道車両用 m2 0102
その他の合わせガラス m2 0103
強 化 ガ ラ ス m2 0104
複 層 ガ ラ ス m2 0105
フ ェ ル ト kg 0106
ボ ー ド kg 0107
そ の 他 のガラス短繊維 kg 0108
ロ ー ビ ン グ kg 0109
チ ョ ッ プドストランド kg 0110
マ ッ ト kg 0111
糸 kg 0112
布 kg 0113
そ の 他 のガラス長繊維 kg 0114
備 考
3.労 務 単位:人
区 分番
号
月 末 従 事 者 数
A
板ガラス・安全ガラス・複層ガラス及 び ガ ラ ス 繊 維 部 門 0301
事 業 所 0302
4.生 産 能 力
区 分単
位
番
号
月間生産能力 月 間 生 産 量
A B
素 板 ガ ラ ス 合 計 換算箱 0401
安 全 ガ ラ ス m2 0402
原繊維
ガ ラ ス 短 繊 維 t 0403
ガ ラ ス 長 繊 維 t 0404
企 業 名本 社 又 は 本 店 所 在 地
(〒 - ) (電話 - - )
事 業 所 名 事業所所在地(〒 - )
報 告 者の 氏 名
作 成 者 の 所 属 部 署 名 及 び 氏 名
(電話 - - )
(平成 年 月 日作成)
経済産業省生産動態統計調査
板ガラス・安全ガラス・複層ガラス及 び ガ ラ ス 繊 維 月 報
(平成 3 0 年 月分)
平成 2 5 . 1 改正
安全ガラス
ガラス短繊維
ガ
ラ
ス
長
繊
維
合ガわラせス
経 済 産 業 省(鉱工業動態統計室)
基 幹 統 計経 済 産 業 省 生 産 動 態 統 計
提 出 先 提出期日 提出部数
経 済 産 業 大 臣 翌月15日 1 部
調査票様式 115

2 9 9
3 0
単位: t
8
経済産業省生産動態統計調査
経 済 産 業 省(鉱工業動態統計室)
経 済 産 業 省 生 産 動 態 統 計 基 幹 統 計
提 出 先 経 済 産 業 大 臣
提 出 期 日 翌 月 15 日
提 出 部 数 1 部
116 調査票様式

3 0
2 9 9
炭素製品・研削砥石月報
8
1.製 品
項 目
品 目
単
位
番
号
生 産 受 入 消 費
出 荷
月 末 在 庫販 売そ の 他
数 量 金 額(千円)
A B C D E F G
電
極
人 造 黒 鉛 電 極( 丸 形 ) t 0101
そ の 他 の 電 極(連続自焼式電極ペーストを含む) t 0102
ブ ラ シ kg 0103
特 殊 炭 素 製 品 kg 0104
炭 素 繊 維 kg 0105
石砥削研 ビトリファイド法砥石 t 0106
レ ジ ノ イ ド 法 砥 石 t 0107
3.労 務 単位:人
区 分番
号
月 末 従 事 者 数
A
炭 素 製 品 ・ 研 削 砥 石 部 門 0301
事 業 所 0302
4.生 産 能 力 単位:kg
区 分番
号
月 間 生 産 能 力
A
炭 素 繊 維 0401
備 考
経済産業省生産動態統計調査
経 済 産 業 省(鉱工業動態統計室)
経 済 産 業 省 生 産 動 態 統 計 基 幹 統 計
提 出 先 経 済 産 業 大 臣
提 出 期 日 翌 月 15 日
提 出 部 数 1 部
調査票様式 117

3 0
2 9 9
8
1-1.製 品項 目
品 目
単
位
番
号
生 産 受 入 消 費出 荷
月 末 在 庫販 売そ の 他
数 量 金額(千円)
A B C D E F G
せ っ こ う ボ ー ド m2 0101
板
維
繊 硬 質 m2 0102
中 質 m2 0103
軟 質 m2 0104
パ ー テ ィ ク ル ボ ー ド m2 0105
ル
ネ
パ
用築建ブハレプ
コンクリート系パネル m2 0106
軽 量 鉄 骨 系 パ ネ ル m2 0107
木 質 系 パ ネ ル m2 0108
1-2. 繊維板・パーティクルボード生産量の換算値項 目
品 目
単
位
番
号
生 産 量
A
繊
維
板
硬 質 m3 0121
中 質 m3 0122
軟 質 m3 0123
パ ー テ ィ ク ル ボ ー ド m3 0124
3 .労 務 単位:人
区 分番
号
月 末 従 事 者 数
A
ボード・パネル部門 0301
事 業 所 0302
備 考
経済産業省生産動態統計調査
経 済 産 業 省(鉱工業動態統計室)
経 済 産 業 省 生 産 動 態 統 計 基 幹 統 計
提 出 先 経 済 産 業 大 臣
提 出 期 日 翌 月 15 日
提 出 部 数 1 部
118 調査票様式

3 0
8
単位: t
単位:人
2 9 9
アルミ樹脂複合
ア ル ミ
ビ ル 用
木造住宅用
経済産業省生産動態統計調査
経 済 産 業 省(鉱工業動態統計室)
経 済 産 業 省 生 産 動 態 統 計 基 幹 統 計
提 出 先 経 済 産 業 大 臣
提 出 期 日 翌 月 15 日
提 出 部 数 1 部
調査票様式 119

基 幹 統 計経 済 産 業 省 生 産 動 態 統 計
提 出 先 提出期日 提出部数
経済産業大臣 1部翌月 15日
都道府県知事 2部翌月 10日3 0
セメント・セメント製品月報
2 6
0 7 7 3 4 0 2 0 1 8
3.労 務
1.製 品
単位:人
区 分番 号
月 末 従 事 者 数
A
セ メ ン ト 製 品 部 門 0302
セ メ ン ト 部 門 0301
事 業 所 0303
4.生 産 能 力
区 分単位
月 間 生 産 能 力
A
遠心力鉄筋コンクリート製品( ポ ー ル ・ パ イ ル ) t
ク リ ン カ t
気 泡 コ ン ク リ ー ト 製 品
番号
0402
0401
0403
セ
メ
ン
ト
セ
メ
ン
ト
製
品
ン
ト
ンドセメ
ポルトラ
リート製品
ストコンク
プレストレ
製
品
コンクリート
遠
心
力
鉄
筋
品 目
項 目単 生 産
出 荷受 入
数 量 金額(千円)消 費 販 売
そ の 他月 末 在 庫
A B C D E F G位
t
番
号
0101
t 0102
t 0103
t 0104
t 0105
t 0106
t 0107
t 0108
1000個 0109
t 0110
t 0111
t 0112
t 0113
1000枚 0114
m3
m3
0115
早 強 ・ 中 庸 熱
普 通
高 炉 セ メ ン ト
そ の 他 の セ メ ン ト
ク リ ン カ
管
ポ ー ル
パ イ ル
空洞コンクリートブロック
護岸用コンクリートブロック
道路用コンクリート製品
は り ・ け た
その他のプレストレストコンクリート 製 品
木 毛 ・ 木 片 セ メ ン ト 板
気 泡 コ ン ク リ ー ト 製 品
経済産業省生産動態統計調査
経 済 産 業 省(鉱工業動態統計室)
120 調査票様式

鉱物及びコークス月報
経済産業省生産動態統計調査
(平成30年 月分)
(平成
年月
日作成)
統計調査番号 調査票番号
年月分
A
26. 1改正
平成
0780202018
事業
所番
号整
理番
号
都道府県
1-1. 製
品
単位:t
項 目
品 目
品目
番号
生産
受入
消費
(処 理)
出荷
月末
在庫
販売
販売金額(千円)
その
他A
BC
DE
FG
物鉱属金非け
い石
0101
石灰
石0102
ドロマイト
0103
けい
砂0104
コー
クス
0105
1-2.非金属鉱物販売・消費内訳
単位:t
項 目
品 目
品目
番号
合
計鉄鋼・製錬用
(含フェロアロイ用)
鋳物
砂・
耐火
物用
セメント用
ソー
ダ・
ガラ
ス用
道 路 用
コンクリート
骨材
用そ
の他
用
AB
CD
EF
GH
けい
石0121
石灰
石0122
ドロ
マイ
ト0123
けい
砂0124
1-3.精
鉱
鉱 種項
目番 号
含有
量金(g)
銀(kg)
鉛(t)
亜鉛(t)
AB
CD
金 鉱
生産
0131
出荷
0132
在庫
0133
3.労
務
単位:人
区分
号番月末従事者数
A当
該部
門0301
事業所全体
0302
4.生産能力(基準・乾量)
単位:t
区
分番 号
能力
室炉
その他の炉
AB
コー
クス
0401
備 考
企
業
名本
社又
は本店所在地(〒
-
)(電話
--
)
事 業 所 名
事業
所所
在地(〒
-
)
報告者の氏名
作成
者の
所属
部署
名及
び氏
名(電話
--
)
経済産業省生産動態統計
基幹
統計
提出期日
提出部数
提 出 先
都道府県知事
翌月
日
部
210
経 済 産 業 省(鉱工業動態統計室)
調査票様式 121
30
経 済 産 業 省 生 産 動 態 統 計基 幹 統 計
提 出 期 日
提 出 部 数
提 出 先 経 済 産業 大 臣
翌 月 日
部 1
1 5
1-1.製 品
項 目
品 目単 位 番 号
生 産 消 費出 荷
月 末 在 庫販 売そ の 他数 量 金額(千円)
A B C D E F
原 油 kl 0101
天 然 ガ ス 103m3(基準状態) 0102
1-2.原 油 生 産 内 訳 単位:kl
項 目品 目
番 号軽 質
コンデンセートA B
原 油 0121
3.労 務 単位:人
区 分 番 号月末従事者数
A
原油及び天然ガス部門 0301
事 業 所 0302
1-4.天 然 ガ ス 出 荷 、消 費 内 訳 単位:103m3(基準状態)
項 目
品 目
番 号原油・天然ガ ス 鉱 業 化学工業 その他の製造業 電 気 業 ガ ス 業 その他産業
A B C D E F
天 然 ガ ス 0141
1-3.天 然 ガ ス 生 産 内 訳 単位:103m3(基準状態)
項 目
品 目
番 号油田ガス
ガス田ガス ・炭田ガス
構 造 性 水 溶 性
A B C
天 然 ガ ス 0131
備考
0 7 8 0 4 0 2 0 1 8
2 3
経済産業省生産動態統計調査
経 済 産 業 省(鉱工業動態統計室)
122 調査票様式

23
経済産業省生産動態統計
基幹
統計
提出期日
提出部数
提 出 先
経済産業大臣
翌月
日
部
115
1-1.製
品
項 目
品 目
単 位
番 号生 産
受 入
消 費
出荷
品種振替
月末在庫
販売部門
そ の 他
転 送
そ の 他
AB
CD
EF
GH
ンリソガ自動車用高級ガソリンkl0101
自動車用並級ガソリンkl0102
その他用ガソリンkl0103
サフナ石油化学用ナフサkl0104
その他用ナフサkl0105
ジェット燃料油kl0106
灯油kl0107
軽油kl0108
油重A
重油kl0109
B ・C
重油kl0110
潤滑
油kl0111
パラ
フィ
ンt0112
アス
ファ
ルトt0113
液化
石油ガス
P.P、P.B
t0114
B.B
t0115
オイルコークスt0116
回収
いお
うt0117
その他の石油製品kl0118
精製及び混合原料油kl0119
石油
ガスkl0120
1-2.半 製 品
単位:kl
項目
品目
号番受 入
投 入
出 荷
月末在庫
AB
CD
粗ガソリン
0121
粗灯
油0122
粗軽
油0123
粗重
油0124
粗潤滑油
0125
粗蝋
0126
粗コークス
0127
3.労
務単位:人
区 分
号番月末従事者数
A石油製品部門0301
事業
所0302
備考
8
30
経済産業省生産動態統計調査
経 済 産 業 省(鉱工業動態統計室)
調査票様式 123
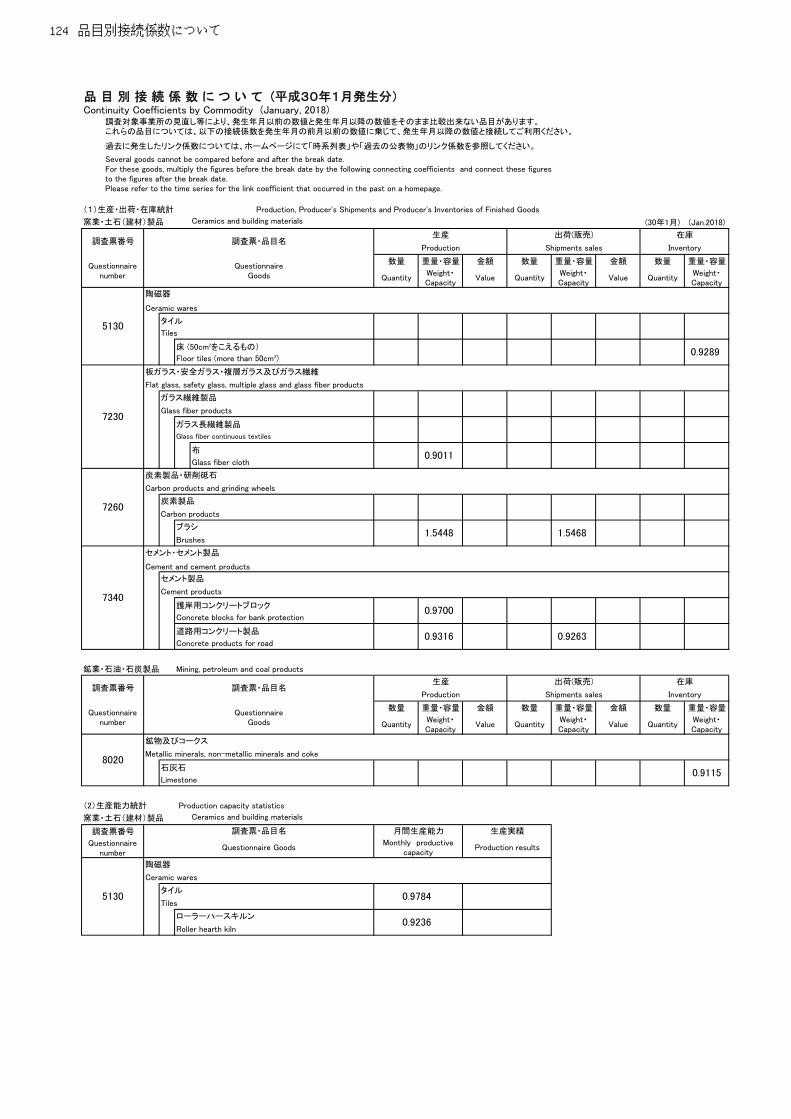
過去に発生したリンク係数については、ホームページにて「時系列表」や「過去の公表物」のリンク係数を参照してください。
(1)生産・出荷・在庫統計 Production, Producer's Shipments and Producer's Inventories of Finished Goods
Ceramics and building materials (30年1月) (Jan.2018)
数量 重量・容量 金額 数量 重量・容量 金額 数量 重量・容量
QuantityWeight・Capacity
Value QuantityWeight・Capacity
Value QuantityWeight・Capacity
タイル
Tiles
床 (50cm2をこえるもの)
板ガラス・安全ガラス・複層ガラス及びガラス繊維
Flat glass, safety glass, multiple glass and glass fiber products
ガラス繊維製品
Glass fiber products
ガラス長繊維製品
Glass fiber continuous textiles
布
Glass fiber cloth
炭素製品・研削砥石
Carbon products and grinding wheels
炭素製品
Carbon products
ブラシ
Brushes
セメント・セメント製品
Cement and cement products
セメント製品
Cement products
護岸用コンクリートブロック
Concrete blocks for bank protection
道路用コンクリート製品
Concrete products for road
鉱業・石油・石炭製品 Mining, petroleum and coal products
数量 重量・容量 金額 数量 重量・容量 金額 数量 重量・容量
QuantityWeight・Capacity
Value QuantityWeight・Capacity
Value QuantityWeight・Capacity
鉱物及びコークス
Metallic minerals, non-metallic minerals and coke
石灰石
Limestone
(2)生産能力統計 Production capacity statistics
Ceramics and building materials
調査票番号
Questionnairenumber
陶磁器
Ceramic wares
タイル
Tiles
ローラーハースキルン
Roller hearth kiln
0.9115
Inventory
Questionnairenumber
QuestionnaireGoods
8020
5130 0.9784
0.9236
調査票番号 調査票・品目名生産 出荷(販売)
Production
窯業・土石(建材)製品
調査票・品目名 月間生産能力 生産実績
Questionnaire GoodsMonthly productive
capacityProduction results
在庫
Shipments sales
0.9316 0.9263
73400.9700
1.5448 1.5468
7260
0.9011
0.9289Floor tiles (more than 50cm2)
7230
Production Shipments sales Inventory
Questionnairenumber
QuestionnaireGoods
5130
陶磁器
Ceramic wares
品 目 別 接 続 係 数 に つ い て (平成30年1月発生分)Continuity Coefficients by Commodity (January, 2018)
調査対象事業所の見直し等により、発生年月以前の数値と発生年月以降の数値をそのまま比較出来ない品目があります。これらの品目については、以下の接続係数を発生年月の前月以前の数値に乗じて、発生年月以降の数値と接続してご利用ください。
Several goods cannot be compared before and after the break date.For these goods, multiply the figures before the break date by the following connecting coefficients and connect these figuresto the figures after the break date.Please refer to the time series for the link coefficient that occurred in the past on a homepage.
窯業・土石(建材)製品
調査票番号 調査票・品目名生産 出荷(販売) 在庫
124 品目別接続係数について
付. 公表値の修正についてCorrection of a past statistical table
(経済産業省生産動態統計月報平成30年8月分に掲載したものを再掲載)
一部事業所で誤報告があったため、過去に遡及し修正値を取りまとめましたので公表いたします。The numerical value published in the past is corrected because of a mis-report occurred in a
certain business establishment.
く 過去に遡り修正した品目 ><The commodity item that was revised retroactively to the past>
品 目 名 等 修 正 期 間 ページ
Commodities period page
石油製品 平成27年1月~平成29年12月126
Petroleum products January, 2015 ~ December, 2017
品目別接続係数(修正後)
Continuity Coefficients by Commodity (After the 127
correction)
公表値の修正について 125

石油製品月報 実数修正表Petroleum products
修正前Before
correction
修正後After
correction
修正前Before
correction
修正後After
correction
平成27年 1月 (Jan.) 6,422,945 6,371,645 681,346 630,046
(2015) 2 (Feb.) 5,666,891 5,612,891 614,538 560,538
3 (Mar.) 5,457,165 5,400,465 646,302 589,602
4 (Apr.) 5,710,690 5,651,290 696,553 637,153
5 (May ) 6,296,644 6,234,544 765,717 703,617
6 (Jun.) 5,652,469 5,587,669 609,867 545,067
7 (Jul.) 6,015,300 5,947,800 786,820 719,320
8 (Aug.) 6,713,790 6,643,590 923,616 853,416
9 (Sep.) 6,609,167 6,536,267 802,441 729,541
10 (Oct.) 6,451,592 6,375,992 706,621 631,021
11 (Nov.) 6,336,010 6,257,710 721,947 643,647
12 (Dec.) 6,211,015 6,130,015 728,151 647,151
平成28年 1月 (Jan.) 6,274,947 6,191,247 732,268 648,568
(2016) 2 (Feb.) 5,787,569 5,701,169 676,469 590,069
3 (Mar.) 5,269,945 5,180,845 621,358 532,258
4 (Apr.) 5,535,326 5,443,526 739,133 647,333
5 (May ) 5,769,686 5,675,186 711,795 617,295
6 (Jun.) 5,272,204 5,175,004 612,658 515,458
7 (Jul.) 5,560,375 5,460,475 760,565 660,665
8 (Aug.) 6,379,578 6,276,978 792,360 689,760
9 (Sep.) 6,323,156 6,217,856 831,078 725,778
10 (Oct.) 5,614,217 5,506,217 753,046 645,046
11 (Nov.) 5,352,752 5,242,052 617,239 506,539
12 (Dec.) 5,330,258 5,216,858 639,418 526,018
平成29年 1月 (Jan.) 5,714,103 5,598,003 685,306 569,206
(2017) 2 (Feb.) 5,553,544 5,434,744 629,682 510,882
3 (Mar.) 5,111,714 4,990,214 631,690 510,190
4 (Apr.) 5,634,645 5,510,445 714,619 590,419
5 (May ) 5,755,016 5,628,116 798,917 672,017
6 (Jun.) 5,620,373 5,490,773 800,373 670,773
7 (Jul.) 5,631,643 5,499,343 821,779 689,479
8 (Aug.) 5,980,719 5,845,719 699,717 564,717
9 (Sep.) 5,711,639 5,573,939 750,421 612,721
10 (Oct.) 6,025,581 5,885,181 809,945 669,545
11 (Nov.) 5,806,239 5,663,139 746,895 603,795
12 (Dec.) 5,283,918 5,138,118 721,166 575,366
年月
Year and Month
燃料油Main petroleum products total
ジェット燃料油Jet fuel
月末在庫 月末在庫
Inventory Inventory
数量(kl)Quantity(kl)
数量(kl)Quantity(kl)
126 公表値の修正について

With having revised numerical value retroactively to the past, we changed a coefficient applied conventionally as follows.
We are connected to the numerical value after outbreak time, and, about these items, please use the following connection coefficients taking advantage
of the numerical value before the last month of outbreak time.
(1)生産・出荷・在庫統計 Production, Producer's Shipments and Producer's Inventories of Finished Goods
平成27年1月発生分(January, 2015)鉱業・石油・石炭製品 Mining, petroleum and coal products
数量 重量・容量 金額 数量 重量・容量 金額 数量 重量・容量
QuantityWeight・Capacity
Value QuantityWeight・Capacity
Value QuantityWeight・Capacity
石油製品
Petroleum products
燃料油
Main petroleum products total
ジェット燃料油 修正前
Jet fuel Before correction
修正後
After correction0.916
8061
在庫
Production Shipments sales Inventory
Questionnairenumber
QuestionnaireGoods
Correction
品 目 別 接 続 係 数 に つ い て (修正後) Continuity Coefficients by Commodity (After the correction)
過去に遡って数値を修正したことに伴い、従来適用されていた係数を下記の通り変更しました。これらの品目については、以下の接続係数を発生年月の前月以前の数値に乗じて、発生年月以降の数値と接続してご利用ください。
調査票番号 調査票・品目名 修正区分生産 出荷(販売)
公表値の修正について 127