米国土木学会によるインフラ通信簿 asce report...
TRANSCRIPT

米国土木学会によるインフラ通信簿(ASCE Report Card)
-参考3-
2013/10/9 第8回社会資本メンテナンス戦略小委員会
米国土木学会によるインフラ通信簿(ASCE Report Card)
米国土木学会では、インフラの老朽化及び維持管理に対する意識の高まりから、4年に1度インフラの状況を評価・ランク付し、公表。
政策決定者や議会への情報提供による社会資本の充実を主目的としている。
(例:「今後5年間で1.6兆ドルが必要」など)
評価基準は以下の8項目:容量、状態、資金、
将来需要、運営・維持管理、安全性、強靱性、革新性
概要
2007年ミネソタ州ミネアポリスで落橋事故が発生したが、2003年版ミネソタ州Report Cardで州内橋梁16%に欠陥・陳腐化と指摘。警鐘を鳴らしていたとの評価も。
英国・豪州・南アフリカの各土木学会においても実施。
米国土木学会のレポートは、政界に対しての資金の必要性を訴える側面が強い一方、他国の学会はインフラ現状に対する議論喚起や意識向上を主たる目的としている。
同様の取り組み
但し、詳細な評価手法の内容はどの国でも公表されていない。 〔参考資料〕ASCE Report Card 2013、2007年度土木学会会長提言特別委員会報告書「わが国におけるインフラの現状と評価 インフラ国勢調査2007-体力測定と健康診断-」
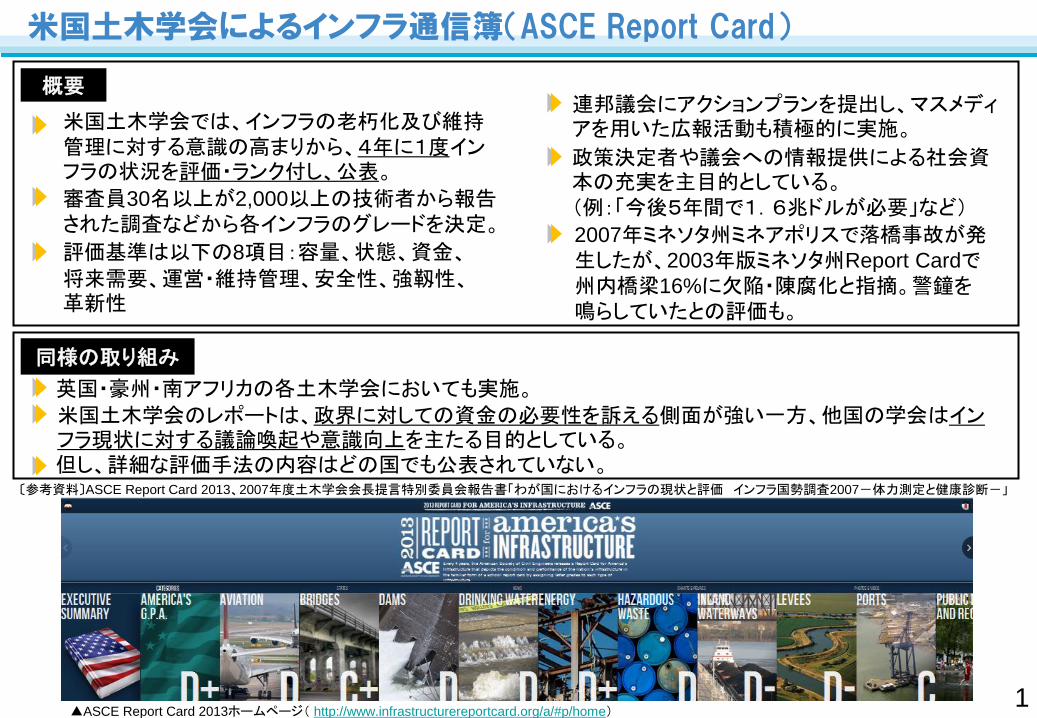
▲ASCE Report Card 2013ホームページ( http://www.infrastructurereportcard.org/a/#p/home)
審査員30名以上が2,000以上の技術者から報告された調査などから各インフラのグレードを決定。
連邦議会にアクションプランを提出し、マスメディアを用いた広報活動も積極的に実施。
1
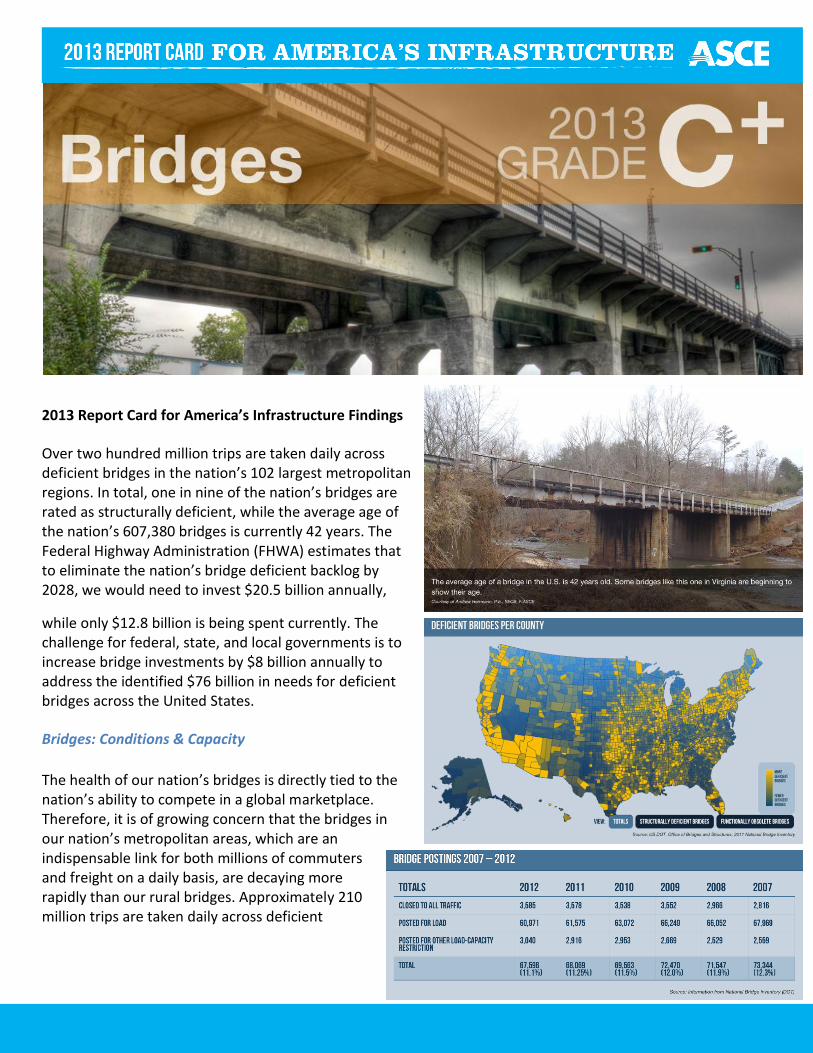
2013 Report Card for America’s Infrastructure Findings
Over two hundred million trips are taken daily across deficient bridges in the nation’s 102 largest metropolitan regions. In total, one in nine of the nation’s bridges are rated as structurally deficient, while the average age of the nation’s 607,380 bridges is currently 42 years. The Federal Highway Administration (FHWA) estimates that to eliminate the nation’s bridge deficient backlog by 2028, we would need to invest $20.5 billion annually,
while only $12.8 billion is being spent currently. The challenge for federal, state, and local governments is to increase bridge investments by $8 billion annually to address the identified $76 billion in needs for deficient bridges across the United States.
Bridges: Conditions & Capacity
The health of our nation’s bridges is directly tied to the nation’s ability to compete in a global marketplace. Therefore, it is of growing concern that the bridges in our nation’s metropolitan areas, which are an indispensable link for both millions of commuters and freight on a daily basis, are decaying more rapidly than our rural bridges. Approximately 210 million trips are taken daily across deficient
bridges in the nation’s 102 largest metropolitan regions.
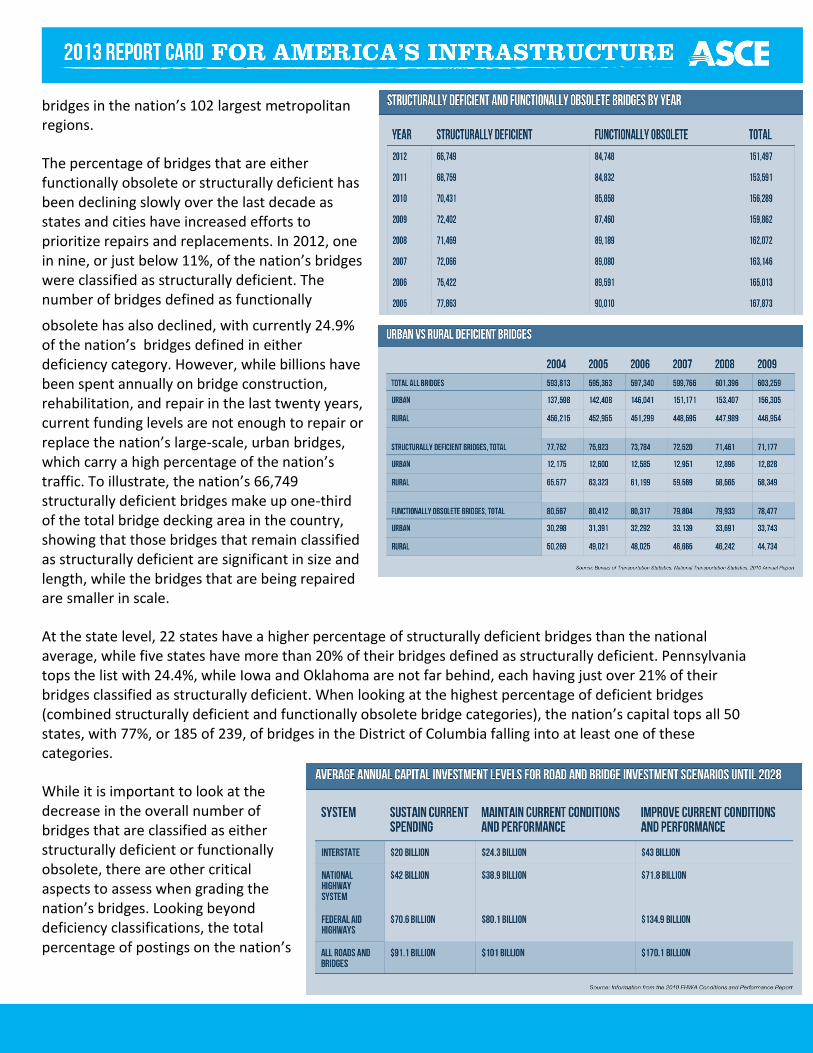
The percentage of bridges that are either functionally obsolete or structurally deficient has been declining slowly over the last decade as states and cities have increased efforts to prioritize repairs and replacements. In 2012, one in nine, or just below 11%, of the nation’s bridges were classified as structurally deficient. The number of bridges defined as functionally
obsolete has also declined, with currently 24.9% of the nation’s bridges defined in either deficiency category. However, while billions have been spent annually on bridge construction, rehabilitation, and repair in the last twenty years, current funding levels are not enough to repair or replace the nation’s large-scale, urban bridges, which carry a high percentage of the nation’s traffic. To illustrate, the nation’s 66,749 structurally deficient bridges make up one-third of the total bridge decking area in the country, showing that those bridges that remain classified as structurally deficient are significant in size and length, while the bridges that are being repaired are smaller in scale.
At the state level, 22 states have a higher percentage of structurally deficient bridges than the national average, while five states have more than 20% of their bridges defined as structurally deficient. Pennsylvania tops the list with 24.4%, while Iowa and Oklahoma are not far behind, each having just over 21% of their bridges classified as structurally deficient. When looking at the highest percentage of deficient bridges (combined structurally deficient and functionally obsolete bridge categories), the nation’s capital tops all 50 states, with 77%, or 185 of 239, of bridges in the District of Columbia falling into at least one of these categories.
While it is important to look at the decrease in the overall number of bridges that are classified as either structurally deficient or functionally obsolete, there are other critical aspects to assess when grading the nation’s bridges. Looking beyond deficiency classifications, the total percentage of postings on the nation’s

bridges has declined gradually over the past five years. While the number of bridges closed to traffic has climbed from 2,816 in 2007 to 3,585 in 2012, the number of bridges posted for load restrictions has decreased from 67,969 to 60,971 in that same period. Posted bridges are not necessarily a public safety risk, but they can create congestion and force emergency vehicles and trucks to take lengthy detours when the bridge is closed, making it harder, and more costly, for goods to get to market.
Finally, the average age of the nation’s bridges has also slightly declined, as bridges have been constructed or replaced, from 43 years in 2009 to 42 years currently. Regardless, the FHWA calculates that more than 30% of existing bridges have exceeded their 50-year design life, meaning that maintenance, repair, and rehabilitation programs will still require significant investment in the upcoming years. Unfortunately, preserving aging bridges while replacing deficient bridges is a significant challenge for cash-strapped state and local governments to manage.
Bridges: Investment & Funding
Federal, state, and local bridge investments are not keeping pace with the growing costs of aging bridges. The FHWA estimates that the current cost to repair or replace only the deficient bridges eligible under the Federal Highway Bridge Program is almost $76 billion. This total is up from 2009, when FHWA estimated that the total cost was $71 billion. If bridge maintenance continues to be deferred over the next 25 years, these backlog costs will rise. To put these numbers in perspective, over the last 30 years Congress has provided approximately $77 billion to the states through the federal-aid bridge program.8 New York, with more than $9 billion in needs, followed by Pennsylvania with $7 billion in needs, and then California with $6 billion in needs, are currently the states facing the largest cost to repair and replace their aging bridge infrastructure. Nevada has the lowest price tag to repair or replace its deficient bridges at $69 million.
The investment backlog for the nation’s bridges is estimated to be $121 billion, according to FHWA. This figure represents all cost-beneficial bridge needs, not just the replacement or rehabilitation of eligible deficient bridges. The $121 billion estimate includes $102 billion in investment needs for federal-aid highway bridges. Of that $102 billion in federal highway needs, $60 billion is for the National Highway System bridges, which in turn includes $38 billion for Interstate System bridges. The Federal Highway Administration estimates that to eliminate the bridge backlog by 2028, the nation would need to invest $20.5 billion annually; however, at this time only $12.8 billion is being spent annually on the nation’s bridges.
Finally, recently passed surface transportation legislation from Congress, Moving Ahead for Progress in the 21st Century (MAP-21), eliminated the Highway Bridge Program, instead rolling it into the National Highway Performance Program (NHPP). However, the off-system bridges are not included in the NHPP, but have been placed in the Surface Transportation Program. With the nation’s bridges divided between two programs
without guaranteed set-asides for repair, bridges may need to compete with other transportation programs for funding, which could have a negative impact on conditions.
Bridges: Success Stories
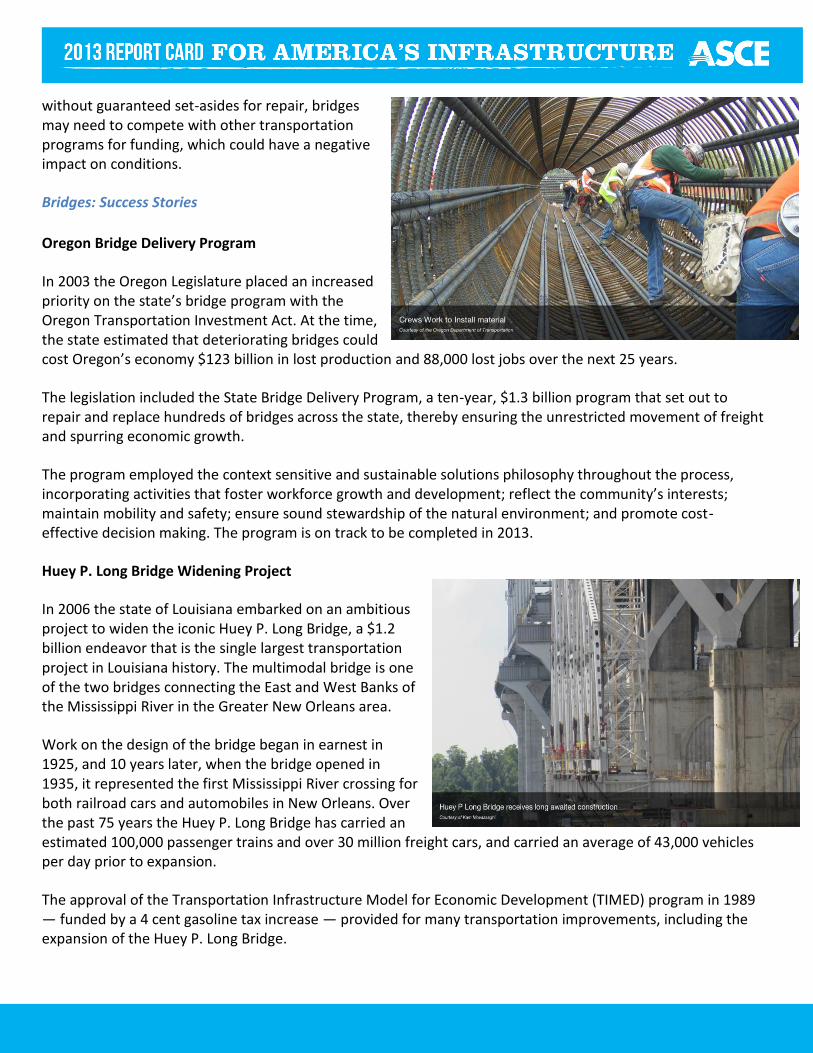
Oregon Bridge Delivery Program
In 2003 the Oregon Legislature placed an increased priority on the state’s bridge program with the Oregon Transportation Investment Act. At the time, the state estimated that deteriorating bridges could cost Oregon’s economy $123 billion in lost production and 88,000 lost jobs over the next 25 years.
The legislation included the State Bridge Delivery Program, a ten-year, $1.3 billion program that set out to repair and replace hundreds of bridges across the state, thereby ensuring the unrestricted movement of freight and spurring economic growth.
The program employed the context sensitive and sustainable solutions philosophy throughout the process, incorporating activities that foster workforce growth and development; reflect the community’s interests; maintain mobility and safety; ensure sound stewardship of the natural environment; and promote cost-effective decision making. The program is on track to be completed in 2013.
Huey P. Long Bridge Widening Project
In 2006 the state of Louisiana embarked on an ambitious project to widen the iconic Huey P. Long Bridge, a $1.2 billion endeavor that is the single largest transportation project in Louisiana history. The multimodal bridge is one of the two bridges connecting the East and West Banks of the Mississippi River in the Greater New Orleans area.
Work on the design of the bridge began in earnest in 1925, and 10 years later, when the bridge opened in 1935, it represented the first Mississippi River crossing for both railroad cars and automobiles in New Orleans. Over the past 75 years the Huey P. Long Bridge has carried an estimated 100,000 passenger trains and over 30 million freight cars, and carried an average of 43,000 vehicles per day prior to expansion.
The approval of the Transportation Infrastructure Model for Economic Development (TIMED) program in 1989 — funded by a 4 cent gasoline tax increase — provided for many transportation improvements, including the expansion of the Huey P. Long Bridge.
Engineering and construction of the new bridge have indeed been an exceedingly challenging endeavor. A major requirement for the construction was that the bridge had to remain fully operational for both rail and auto traffic during the entire construction period. River traffic disruption was to be at a minimum. When the expansion is complete, the bridge will have three 11-foot lanes in each direction plus shoulders — double the previous driving surface width — and will be able to accommodate double the volume of vehicular traffic.
Lake Champlain Bridge Project
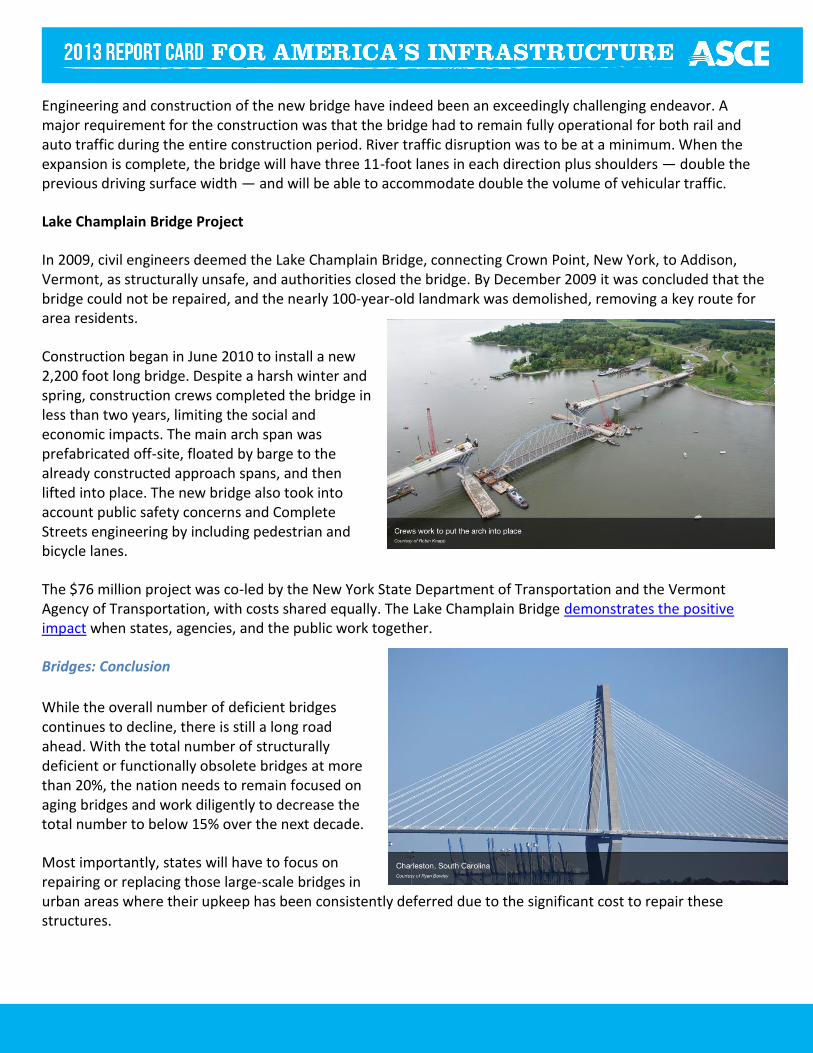
In 2009, civil engineers deemed the Lake Champlain Bridge, connecting Crown Point, New York, to Addison, Vermont, as structurally unsafe, and authorities closed the bridge. By December 2009 it was concluded that the bridge could not be repaired, and the nearly 100-year-old landmark was demolished, removing a key route for area residents.
Construction began in June 2010 to install a new 2,200 foot long bridge. Despite a harsh winter and spring, construction crews completed the bridge in less than two years, limiting the social and economic impacts. The main arch span was prefabricated off-site, floated by barge to the already constructed approach spans, and then lifted into place. The new bridge also took into account public safety concerns and Complete Streets engineering by including pedestrian and bicycle lanes.
The $76 million project was co-led by the New York State Department of Transportation and the Vermont Agency of Transportation, with costs shared equally. The Lake Champlain Bridge demonstrates the positive impact when states, agencies, and the public work together.
Bridges: Conclusion
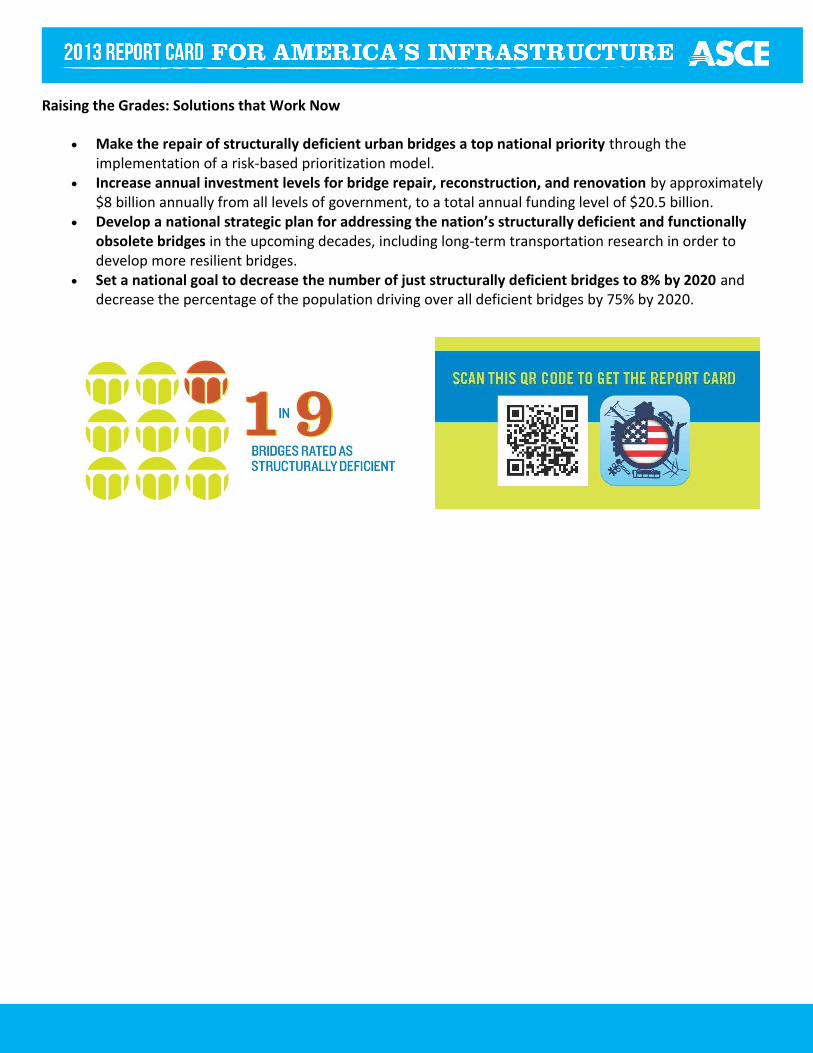
While the overall number of deficient bridges continues to decline, there is still a long road ahead. With the total number of structurally deficient or functionally obsolete bridges at more than 20%, the nation needs to remain focused on aging bridges and work diligently to decrease the total number to below 15% over the next decade.
Most importantly, states will have to focus on repairing or replacing those large-scale bridges in urban areas where their upkeep has been consistently deferred due to the significant cost to repair these structures.
Raising the Grades: Solutions that Work Now
Make the repair of structurally deficient urban bridges a top national priority through the implementation of a risk-based prioritization model.
Increase annual investment levels for bridge repair, reconstruction, and renovation by approximately $8 billion annually from all levels of government, to a total annual funding level of $20.5 billion.
Develop a national strategic plan for addressing the nation’s structurally deficient and functionally obsolete bridges in the upcoming decades, including long-term transportation research in order to develop more resilient bridges.
Set a national goal to decrease the number of just structurally deficient bridges to 8% by 2020 and decrease the percentage of the population driving over all deficient bridges by 75% by 2020.

WWW.INFRASTRUCTUREREPORTCARD.ORG
GET YOUR STATE’S FULL REPORT CARD AT WWW.INFRASTRUCTUREREPORTCARD.ORG/STATES
Water and Environment DAMS • California’s dam safety program has 60 Full-Time Employees that each oversee an average of 20.9 state regulated dams. • 45% of the state regulated dams in California have an Emergency Action Plan. • California’s state dam safety program has an annual budget of $11,142,000.
HAZARDOUS WASTE • California has 98 sites on the National Priorities List.
LEVEES • California has approximately 13,571 miles of levees according to the current FEMA Midterm Levee Inventory.
Transportation AVIATION • There are 191 National Plan of Integrated Airport Systems (NPIAS) Airports in California.
BRIDGES • 2,978 of the 24,812 bridges in California (12.0%) are considered structurally deficient. • 4,178 of the 24,812 bridges in California (16.8%) are considered functionally obsolete. • California received $429.3 million from the Federal Highway Bridge Fund in FY2011.
INLAND WATERWAYS • California has 290 miles of inland waterways, ranking it 26th in the nation.
PORTS • California’s ports handled 224.1 million short tons of cargo in 2011, ranking it 3rd in the nation.
RAIL • California has 25 freight railroads covering 5,307 miles across the state, ranking it 3rd by mileage.
ROADS • California has 171,874 public road miles. • California’s highway vehicle-miles traveled in 2009 was approximately 8,647 per capita, ranking it 40th in the nation.
TRANSIT • California has 1.4 billion annual unlinked passenger trips via transit systems – motor bus, heavy rail, light rail, and commuter
rail.
Public Facilities PARKS AND RECREATION • California has reported an unmet need of $3.6 billion for its parks system.
SCHOOLS • Public school districts in California spent a total of $38.8 billion on capital outlays for school construction and acquisition of land
and existing structures in fiscal years 2005–2008. • It is estimated that California schools have $25.4 billion in infrastructure funding needs.
ENERGY • California produces 58.881 gigawatt-hours of renewable energy every year, ranking it 2nd.