company petroleo brasileiro...
TRANSCRIPT

Deutsche Bank Markets Research
Emerging Markets Brazil
HY Corporate Credit Energy Commodities Energy
Company
Petroleo Brasileiro S.A.
Date 20 May 2016
Reiterating Buy (on select bonds) on positive Brazil/oil momentum
________________________________________________________________________________________________________________
Deutsche Bank Securities Inc.
DISCLOSURES AND ANALYST CERTIFICATIONS ARE LOCATED IN APPENDIX 1. MCI (P) 057/04/2016.
Eduardo Vieira
Research Associate
(+1) 212 250-7568
We reiterate our Buy recommendation on PETBRA 7.875 ‘19s, 4.875 and 5.75 ‘20s, 5.375 ‘21s, ‘24s, ‘40s and 2115s, assign a Buy recommendation to the newly-issued 8.375 ‘21s and a Hold recommendation to the 8.75 ‘26s, and downgrade the 3.0 ‘19s, ‘23s, ‘41s and ‘44s to Hold from Buy and the 3.25 and 3.5 ‘17s to Sell from Hold. Our rationale for the Buy recommendations include: (1) encouraging 1Q16 results (4.2x DB-adjusted run-rate net leverage despite weak production, BRL and oil prices); (2) positive momentum on Brazil’s macro/governance front and on oil prices (likely to remain above USD40/bbl); and (3) still-wide risk-adjusted spreads relative to Brazil and EM peers. We have revised our base-case forecasts (with a 2016 Brent price of USD43/bbl vs. USD40/bbl previously, 2016 USDBRL of 3.7 vs. 3.8 previously and USD14bn of asset sales through 2018 vs. 2019 previously) and now estimate net leverage (excluding non-cash EBITDA items) of 4.0x in 2016 (vs. 4.2x previously) and 3.5x in 2020 (vs. 3.7x previously). We also forecast a cumulative funding gap (post this week’s issuance and excluding further asset sales) through March 2020 of USD39bn (USD45bn previously) and USD2.5bn assuming USD13bn in additional asset sales, 30% rollover of loan maturities and USD10bn of new loans from state-owned banks. Our favorite bonds in the PETBRA curve are the 4.875 ‘20s due to their superior risk-adjusted value to Brazil and EM peers.
Solid 1Q16 results encourage us to expect better results ahead on higher oil prices, normalized production and well-anchored BRL. In our view, Petrobras’ 1Q16 results were quite encouraging, as the company managed to grow EBITDA (adjusted to exclude non-cash items) sequentially by 8% (in USD terms) in a quarter that was impacted by production stoppages, weak domestic demand, low oil prices (USD34/bbl Brent) and weak average USDBRL (3.9). The combination of a stronger BRL (3.56 spot and DB’s 3.7 YE forecast), higher oil prices (USD48.8/bbl Brent spot and USD48/bbl DB’s 2H16 forecast) and domestic oil and gas production normalization (to 2.5-2.6 Mboepd) bodes well for future earnings and for our 4.0x 2016 net leverage forecast.
Stronger BRL/oil and a more market-friendly cabinet in Brazil point to faster deleveraging prospects for Petrobras, in our view. A string of dovish global policy developments and Chinese stimuli earlier this year sparked a strong rally in EM assets and commodities, including the BRL (Petrobras has negative USD exposure) and oil prices. Moreover, unplanned recent oil supply disruptions in Nigeria, Canada and Libya have so far negated the impact of incremental oil production, thus supporting prices. These developments coincided with increased prospects of a favorable government change in Brazil, further enhancing the valuation of Brazilian financial assets. The cabinet change currently taking place in Brazil following VP Michel Temer’s nomination by the congress as Interim President (potentially becoming the official president if President Dilma Rousseff’s impeachment is approved by the senate within 180 days) has brought in some names well regarded by the market (including Henrique Meirelles as finance minister and Ilan Goldfajn as central bank head), and we believe they have a good shot at reviving confidence in the economy and improving governance at state-owned companies, including Petrobras. In our view, this could spark faster cost and capex cuts, faster asset sales and, along with a well-anchored BRL, faster deleveraging.
Key risks: In our view, the negative risks to Petrobras include negative exposure to the USD (84% of the debt, ~50% of costs and capex, 35% of revenue), lower oil prices, political/macro challenges in Brazil, cash burn due to heavy capex, and a large debt maturity wall (USD73bn through 2020 and USD101bn through 2024). Positive risks: higher oil prices, and stronger BRL.
20 May 2016
HY Corporate Credit,Energy,Commodities,Energy
Petroleo Brasileiro S.A.
Page 2 Deutsche Bank Securities Inc.
Bond recommendation table
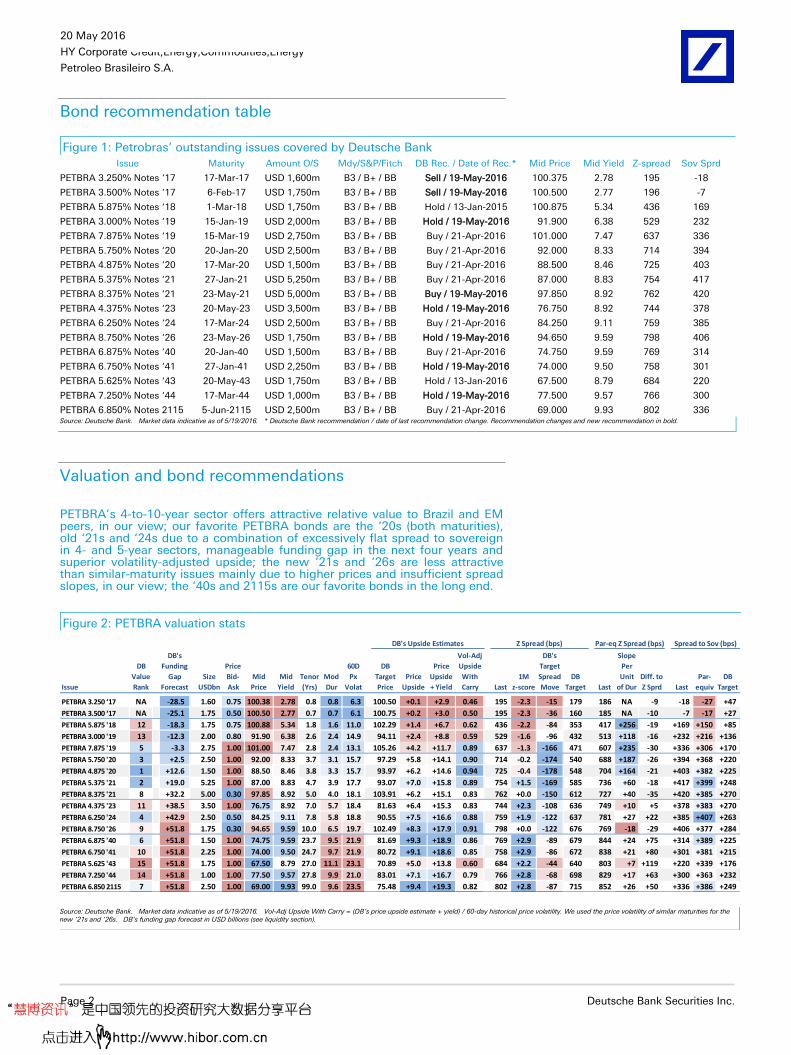
Figure 1: Petrobras’ outstanding issues covered by Deutsche Bank
Issue Maturity Amount O/S Mdy/S&P/Fitch DB Rec. / Date of Rec.* Mid Price Mid Yield Z-spread Sov Sprd
PETBRA 3.250% Notes ‘17 17-Mar-17 USD 1,600m B3 / B+ / BB Sell / 19-May-2016 100.375 2.78 195 -18
PETBRA 3.500% Notes ‘17 6-Feb-17 USD 1,750m B3 / B+ / BB Sell / 19-May-2016 100.500 2.77 196 -7
PETBRA 5.875% Notes ‘18 1-Mar-18 USD 1,750m B3 / B+ / BB Hold / 13-Jan-2015 100.875 5.34 436 169
PETBRA 3.000% Notes ‘19 15-Jan-19 USD 2,000m B3 / B+ / BB Hold / 19-May-2016 91.900 6.38 529 232
PETBRA 7.875% Notes ‘19 15-Mar-19 USD 2,750m B3 / B+ / BB Buy / 21-Apr-2016 101.000 7.47 637 336
PETBRA 5.750% Notes ‘20 20-Jan-20 USD 2,500m B3 / B+ / BB Buy / 21-Apr-2016 92.000 8.33 714 394
PETBRA 4.875% Notes ‘20 17-Mar-20 USD 1,500m B3 / B+ / BB Buy / 21-Apr-2016 88.500 8.46 725 403
PETBRA 5.375% Notes ‘21 27-Jan-21 USD 5,250m B3 / B+ / BB Buy / 21-Apr-2016 87.000 8.83 754 417
PETBRA 8.375% Notes ‘21 23-May-21 USD 5,000m B3 / B+ / BB Buy / 19-May-2016 97.850 8.92 762 420
PETBRA 4.375% Notes ‘23 20-May-23 USD 3,500m B3 / B+ / BB Hold / 19-May-2016 76.750 8.92 744 378
PETBRA 6.250% Notes ‘24 17-Mar-24 USD 2,500m B3 / B+ / BB Buy / 21-Apr-2016 84.250 9.11 759 385
PETBRA 8.750% Notes ‘26 23-May-26 USD 1,750m B3 / B+ / BB Hold / 19-May-2016 94.650 9.59 798 406
PETBRA 6.875% Notes ‘40 20-Jan-40 USD 1,500m B3 / B+ / BB Buy / 21-Apr-2016 74.750 9.59 769 314
PETBRA 6.750% Notes ‘41 27-Jan-41 USD 2,250m B3 / B+ / BB Hold / 19-May-2016 74.000 9.50 758 301
PETBRA 5.625% Notes ‘43 20-May-43 USD 1,750m B3 / B+ / BB Hold / 13-Jan-2016 67.500 8.79 684 220
PETBRA 7.250% Notes ‘44 17-Mar-44 USD 1,000m B3 / B+ / BB Hold / 19-May-2016 77.500 9.57 766 300
PETBRA 6.850% Notes 2115 5-Jun-2115 USD 2,500m B3 / B+ / BB Buy / 21-Apr-2016 69.000 9.93 802 336 Source: Deutsche Bank. Market data indicative as of 5/19/2016. * Deutsche Bank recommendation / date of last recommendation change. Recommendation changes and new recommendation in bold.
Valuation and bond recommendations
PETBRA’s 4-to-10-year sector offers attractive relative value to Brazil and EM peers, in our view; our favorite PETBRA bonds are the ‘20s (both maturities), old ‘21s and ‘24s due to a combination of excessively flat spread to sovereign in 4- and 5-year sectors, manageable funding gap in the next four years and superior volatility-adjusted upside; the new ‘21s and ‘26s are less attractive than similar-maturity issues mainly due to higher prices and insufficient spread slopes, in our view; the ‘40s and 2115s are our favorite bonds in the long end.
Figure 2: PETBRA valuation stats
Issue
DB
Value
Rank
DB's
Funding
Gap
Forecast
Size
USDbn
Price
Bid-
Ask
Mid
Price
Mid
Yield
Tenor
(Yrs)
Mod
Dur
60D
Px
Volat
DB
Target
Price
Price
Upside
Price
Upside
+ Yield
Vol-Adj
Upside
With
Carry Last
1M
z-score
DB's
Target
Spread
Move
DB
Target Last
Slope
Per
Unit
of Dur
Diff. to
Z Sprd Last
Par-
equiv
DB
Target
PETBRA 3.250 ‘17 NA -28.5 1.60 0.75 100.38 2.78 0.8 0.8 6.3 100.50 +0.1 +2.9 0.46 195 -2.3 -15 179 186 NA -9 -18 -27 +47
PETBRA 3.500 ‘17 NA -25.1 1.75 0.50 100.50 2.77 0.7 0.7 6.1 100.75 +0.2 +3.0 0.50 195 -2.3 -36 160 185 NA -10 -7 -17 +27
PETBRA 5.875 '18 12 -18.3 1.75 0.75 100.88 5.34 1.8 1.6 11.0 102.29 +1.4 +6.7 0.62 436 -2.2 -84 353 417 +256 -19 +169 +150 +85
PETBRA 3.000 '19 13 -12.3 2.00 0.80 91.90 6.38 2.6 2.4 14.9 94.11 +2.4 +8.8 0.59 529 -1.6 -96 432 513 +118 -16 +232 +216 +136
PETBRA 7.875 '19 5 -3.3 2.75 1.00 101.00 7.47 2.8 2.4 13.1 105.26 +4.2 +11.7 0.89 637 -1.3 -166 471 607 +235 -30 +336 +306 +170
PETBRA 5.750 '20 3 +2.5 2.50 1.00 92.00 8.33 3.7 3.1 15.7 97.29 +5.8 +14.1 0.90 714 -0.2 -174 540 688 +187 -26 +394 +368 +220
PETBRA 4.875 '20 1 +12.6 1.50 1.00 88.50 8.46 3.8 3.3 15.7 93.97 +6.2 +14.6 0.94 725 -0.4 -178 548 704 +164 -21 +403 +382 +225
PETBRA 5.375 '21 2 +19.0 5.25 1.00 87.00 8.83 4.7 3.9 17.7 93.07 +7.0 +15.8 0.89 754 +1.5 -169 585 736 +60 -18 +417 +399 +248
PETBRA 8.375 '21 8 +32.2 5.00 0.30 97.85 8.92 5.0 4.0 18.1 103.91 +6.2 +15.1 0.83 762 +0.0 -150 612 727 +40 -35 +420 +385 +270
PETBRA 4.375 '23 11 +38.5 3.50 1.00 76.75 8.92 7.0 5.7 18.4 81.63 +6.4 +15.3 0.83 744 +2.3 -108 636 749 +10 +5 +378 +383 +270
PETBRA 6.250 '24 4 +42.9 2.50 0.50 84.25 9.11 7.8 5.8 18.8 90.55 +7.5 +16.6 0.88 759 +1.9 -122 637 781 +27 +22 +385 +407 +263
PETBRA 8.750 '26 9 +51.8 1.75 0.30 94.65 9.59 10.0 6.5 19.7 102.49 +8.3 +17.9 0.91 798 +0.0 -122 676 769 -18 -29 +406 +377 +284
PETBRA 6.875 '40 6 +51.8 1.50 1.00 74.75 9.59 23.7 9.5 21.9 81.69 +9.3 +18.9 0.86 769 +2.9 -89 679 844 +24 +75 +314 +389 +225
PETBRA 6.750 '41 10 +51.8 2.25 1.00 74.00 9.50 24.7 9.7 21.9 80.72 +9.1 +18.6 0.85 758 +2.9 -86 672 838 +21 +80 +301 +381 +215
PETBRA 5.625 '43 15 +51.8 1.75 1.00 67.50 8.79 27.0 11.1 23.1 70.89 +5.0 +13.8 0.60 684 +2.2 -44 640 803 +7 +119 +220 +339 +176
PETBRA 7.250 '44 14 +51.8 1.00 1.00 77.50 9.57 27.8 9.9 21.0 83.01 +7.1 +16.7 0.79 766 +2.8 -68 698 829 +17 +63 +300 +363 +232
PETBRA 6.850 2115 7 +51.8 2.50 1.00 69.00 9.93 99.0 9.6 23.5 75.48 +9.4 +19.3 0.82 802 +2.8 -87 715 852 +26 +50 +336 +386 +249
Z Spread (bps) Par-eq Z Spread (bps)DB's Upside Estimates Spread to Sov (bps)
Source: Deutsche Bank. Market data indicative as of 5/19/2016. Vol-Adj Upside With Carry = (DB’s price upside estimate + yield) / 60-day historical price volatility. We used the price volatility of similar maturities for the new ‘21s and ‘26s. DB’s funding gap forecast in USD billions (see liquidity section).

20 May 2016
HY Corporate Credit,Energy,Commodities,Energy
Petroleo Brasileiro S.A.
Deutsche Bank Securities Inc. Page 3
Nine-factor risk-adjusted valuation rank (DB value rank) puts the ‘20s, old ‘21s and ‘24s on top and the ‘43s and ‘44s at the bottom; the new ‘21s and ‘26s rank lower than similar-maturity issues We have created a risk-adjusted valuation rank (DB value rank) for the PETBRA bonds that we cover (including the newly-issued 8.375 ‘21s and 8.75 ‘26s and excluding the 3.25 and 3.5 ‘17s) using nine factors, listed below (including weights) and in figure 2. The results are shown in figure 3.
DB’s volatility-adjusted target upside with carry (17.5% weight): DB’s price upside forecast (assuming target spreads for each bond, as seen in figures 4 and 5) plus carry (yield to maturity) in the numerator, 60-day historical price volatility in the denominator (as shown in figure 2).
DB’s forecast of Petrobras’ cumulative funding gap through the issue’s maturity date (17.5% weight): assumes USD14bn of asset sales through 2018, 30% rollover of loan maturities; USD10bn of new loans from state-owned banks and USD3bn minimum cash position (see liquidity section);
Modified duration (12.5% weight);
Price (10.0% weight): DB’s indicative mid market;
Yield to maturity (10.0% weight): DB’s indicative mid market;
Par-equivalent-adjusted Z spread slope per incremental unitary modified duration (10.0% weight): ‘18s vs. ‘17s (average); ‘19s vs. ‘18s; ‘20s vs. ‘19s (average); ‘21s vs. ‘20s (average); ‘23s vs. ‘21s (average); ‘24s vs. ‘21s (average); ‘26s vs. ‘24s; long end vs. ‘26s;
Par-equivalent-adjusted spread to sovereign curve (7.5% weight): par-equivalent (30% recovery) Z spread differential to fitted sovereign curve;
Bid-ask price spread (7.5% weight);
One-month Z Spread z-score (7.5% weight).
Figure 4: DB’s target Z spreads for PETBRA Figure 5: DB’s target sovereign spreads for PETBRA
100
200
300
400
500
600
700
800
900
Latest DB Target
Par-equiv Adjustment 1M Avg
12-month Low
-100
+0
+100
+200
+300
+400
+500
Latest DB Target
Par-equiv Adjustment 1M Avg
12-month Low Source: Deutsche Bank. Market data indicative as of 5/19/2016. Source: Deutsche Bank. Market data indicative as of 5/19/2016.
Figure 3: PETBRA valuation rank
as of May 19, 2016
4.875 ‘20 (Buy) 1
5.375 '21 (Buy) 2
5.750 '20 (Buy) 3
6.250 '24 (Buy) 4
7.875 ’19 (Buy) 5
6.875 '40 (Buy) 6
6.850 2115 (Buy) 7
8.375 ‘21 (new, Buy) 8
8.750 '26 (new, Hold) 9
6.750 '41 (Hold) 10
4.375 ’23 (Hold) 11
5.875 '18 (Hold) 12
3.000 ‘19 (Hold) 13
7.250 '44 (Hold) 14
5.625 '43 (Hold) 15
Source: Deutsche Bank

20 May 2016
HY Corporate Credit,Energy,Commodities,Energy
Petroleo Brasileiro S.A.
Page 4 Deutsche Bank Securities Inc.
PETBRA offers attractive ratings-adjusted relative value to EM peers in the 5-year and 10-year sectors
Figure 6: Z spread vs average rating – 5YR Figure 7: Sov sprd vs Moody’s standalone rating – 5YR
Source: Deutsche Bank, Moody’s, S&P, Fitch. Pricing is indicative (mid side), as of May 18, 2016.
Source: Deutsche Bank, Moody’s. Pricing is indicative (mid side), as of May 18, 2016.
Figure 8: Z spread vs average rating – 10YR Figure 9: Sov sprd vs Moody’s standalone rating – 10YR
Source: Deutsche Bank, Moody’s, S&P, Fitch. Pricing is indicative (mid side), as of May 18, 2016.
Source: Deutsche Bank, Moody’s. Pricing is indicative (mid side), as of May 18, 2016.
Figure 10: Z spread vs average rating – 30YR Figure 11: Sov sprd vs Moody’s standalone rating – 30YR
Source: Deutsche Bank, Moody’s, S&P, Fitch. Pricing is indicative (mid side), as of May 18, 2016.
Source: Deutsche Bank, Moody’s. Pricing is indicative (mid side), as of May 18, 2016.
20 May 2016
HY Corporate Credit,Energy,Commodities,Energy
Petroleo Brasileiro S.A.
Deutsche Bank Securities Inc. Page 5
Buy the 7.875 ‘19s, 5.75 and 4.875 ‘20s, 5.375 and 8.375 ‘21s, ‘24s, ‘40s and 2115s; Hold the 5.875 ‘18s, 3.0 ‘19s, ‘23s, ‘26s, ‘41s, ‘43s and ‘44s; Sell the 3.25 and 3.5 ‘17s; accept the tender offer on the 3.25 and 3.5 ‘17s, 5.875 ‘18s and 3.0 ‘19s (and not on the 7.875 ‘19s). PETBRA 3.25 and 3.5 ‘17s are fully valued, in our view, with less than 200
bps of Z spread and trading inside Brazil. Moreover, they are likely to be mostly taken out by the company’s ongoing tender offer (see liquidity section). We change our recommendation on the 3.25 and 3.5 ‘17s to Sell from Hold, and advise investors to accept the tender offer on the early tender date (May 31) at the tender prices of 100.5 and 100.75, respectively.
PETBRA 5.875 ‘18s still offer an outsized 256-bp par-equivalent Z spread slope per incremental unitary duration to the ‘17s, but at 100.88 mid price we see only 1.4% of price upside to them (assuming a target spread to sovereign of 85 bps). Due to limited upside and lower carry (yield of 5.3%), we reiterate our Hold recommendation on the 5.875 ‘18s. We advise investors to accept the tender offer on the early tender date (May 31) at the tender price of 102.25, implying a price upside of 1.4%.
PETBRA 3.0 ‘19s offer little price upside in our view (2.4% at 91.9 mid price and assuming a target spread to sovereign of 136 bps), despite relatively-low dollar price. We then change our recommendation on the 3.0 ‘19s to Hold from Buy. We advise investors to accept the tender offer on the early tender date (May 31) at the tender price of 94.125, implying a price upside of 2.4%.
PETBRA 7.875 ‘19s offer a favorable combination of price upside (4.2% at 101.0 mid price and assuming a target spread to sovereign of 170 bps), relatively-low duration (2.4), outsized par-equivalent Z spread slope per incremental unitary duration to the ‘18s (+235 bps), and Petrobras’ USD3.3bn financial liquidity surplus (as per our forecasts), despite a high dollar price. We reiterate our Buy recommendation on the 7.875 ‘19s. We advise investors do not tender those bonds, as the tender price of 103.875 offers only 2.8% of price upside.
PETBRA 5.75 and 4.875 ‘20s rank third and first, respectively out of 15 PETBRA bonds screened through the DB value rank methodology due to their superior combination of outsized volatility-adjusted target upside with carry (0.90 and 0.94, respectively, vs. 0.77 average for the curve), outsized par-equivalent Z spread slope per incremental unitary duration to the ‘19s (+187 bps and +164 bps), moderate duration (3.1 and 3.3), and Petrobras’ manageable funding gap as per our forecasts (USD2.5bn and USD12.6bn). In other words, we believe the 5.75 and 4.875 ‘20s offer the most convexity to the marginal refinancing and/or asset sale deal. PETBRA 5.75 and 4.875 ‘20s also offer excessive spreads relative to EM peers, in our view (as shown in figures 6 and 7). We reiterate our Buy recommendation on the 5.75 and 4.875 ‘20s, with estimated price upside of 5.8% and 6.2%, respectively.
PETBRA 5.375 ‘21s rank second out of 15 PETBRA bonds screened through the DB value rank methodology due to due to outsized volatility-adjusted target upside with carry (0.89), the second highest par-equivalent-adjusted spread to sovereign (399 bps), moderation duration (3.9) and Petrobras’ moderate funding gap (USD19bn). PETBRA 5.375 ‘21s also offer excessive spreads relative to EM peers, in our view (see figures 6 and 7). We reiterate our Buy recommendation on the 5.375 ‘21s, with estimated price upside of 7.0%.
PETBRA 8.375 ‘21s (new) rank eight out of 15 PETBRA bonds screened through the DB value rank methodology, with key value strengths including superior spread to sovereign (385 bps vs. 350 bps average for the curve) and an excessively flat 5-to-10-year spread curve (particularly on a spread to sovereign basis), partially offset by higher price, duration and

20 May 2016
HY Corporate Credit,Energy,Commodities,Energy
Petroleo Brasileiro S.A.
Page 6 Deutsche Bank Securities Inc.
Petrobras’ funding gap than similar-maturity issues. PETBRA 5.375 ‘21s also offer excessive spreads relative to EM peers, in our view (see figures 6 and 7). We assign a Buy recommendation to the 8.375 ‘21s, with estimated price upside of 6.2%.
PETBRA ‘23s rank eleventh out of 15 PETBRA bonds screened through the DB value rank methodology, with key value strengths including relatively-low price (76.75), above-average par-equivalent-adjusted spread to sovereign (383 bps) and lower volatility than similar-maturity issues. However, the ‘23s offer quite little duration-adjusted upside relative to the ‘20s and ‘21s. We then change our recommendation on the ‘23s to Hold from Buy.
PETBRA ‘24s rank fourth out of 15 PETBRA bonds screened through the DB value rank methodology, with key value strengths including the highest par-equivalent-adjusted spread to sovereign within the curve (407 bps), superior volatility-adjusted target upside with carry (0.88) and lower price compared to the ‘26s, partially offset by higher duration, volatility and funding gap relative to the 5-year sector. We reiterate our Buy recommendation on the ‘24s, with estimated price upside of 7.5%.
PETBRA 8.75 ‘26s (new) rank ninth out of 15 PETBRA bonds screened through the DB value rank methodology, with key value strengths being superior volatility adjusted target upside with carry (0.91) offset by much higher prices and higher funding gap than the ‘24s (94.65 vs. 84.25 and USD52bn vs. USD43bn, respectively). We assign a Hold recommendation to the 8.75 ‘26s.
PETBRA ‘40s and century bonds (2115s) are our favorite bonds in the long end of the PETBRA curve, due to superior risk-adjusted upside (see figure 2). We reiterate our Buy recommendation on the ‘40s and 2115s, with estimated price upside of 9.3% and 9.4%, respectively.
PETBRA ‘40s, ‘41s, ‘43s and ‘44s offer much less risk-adjusted upside than the 4- to 10-year sector, in our view, due to their high duration and historical price volatility, as well as below-average spread to sovereign. Our favorite bonds within the 30-year sector are the ‘40s. We change our recommendation on the ‘40s, ‘41s and ‘44s to Hold from Buy and reiterate our Hold recommendation on the ‘43s.
Curve trades and performance monitor
We initiate a 5y7y steepener switch out of PETBRA 4.375 ‘23s and into PETBRA 5.375 ‘21s. Rationale: 10 bps of negative Z spread slope (13-bp positive slope on par-equivalent basis) between the 5.375 ‘21s and the ‘23s. Our target slope is +51 bps and target three-month performance is +1.2%. The trade has a price concession of 10.3 points and a positive coupon carry of 100 bps (9-bp negative yield carry).
We initiate a 30y100y flattener switch out of PETBRA 5.625 ‘43s and into PETBRA 6.85 2115s. Rationale: excessive 118-bp Z spread slope (49-bp par-equivalent-adjusted) between the ‘43s and 2115s and lower duration of 2115s (9.6 vs. 11.1 for the ‘43s). Our target slope is +49 bps and target three-month performance is +4.4%. The trade has a price concession of 1.5 points and a positive coupon carry of 123 bps (113-bp positive yield carry).
We close our 2y4y flattener switch out of PEBRA 4.875 ‘20s and into PETBRA 5.878 ‘18s, as the ‘18s are better supported following the announced tender offer, for a total return of -0.7%.

20 May 2016
HY Corporate Credit,Energy,Commodities,Energy
Petroleo Brasileiro S.A.
Deutsche Bank Securities Inc. Page 7
Figure 12: Deutsche Bank’s curve trade ideas and Buy/Sell recommendation on Petrobras bonds
Date
Price
Diff. *
Coupon
Diff. *
Yield
Diff. ** Date
Price
Diff. *
Yield
Diff. **
Price
Chg *
Tot Ret
Chg *
Yield
Chg **
New trades
PETBRA 5y7y Steepener (5.375 '21s vs. 4.375 '23s) 19-May-16 +10.3 +1.0 -9 19-Aug-16 +11.4 +1.2 +1.4
PETBRA 30y100y Flattener ('43s vs. 2115s) 19-May-16 +1.5 +1.2 +113 19-Aug-16 +4.6 +3.1 +3.4
Reiterated trades
PETBRA 7.875 '19s (Long) 21-Apr-16 +98.8 +7.9 +817 19-May-16 +101.0 +747 +2.3 +2.9 -70
PETBRA 5.75 '20s (Long) 21-Apr-16 +89.8 +5.8 +887 19-May-16 +92.0 +833 +2.3 +2.7 -54
PETBRA 4.875 '20s (Long) 21-Apr-16 +86.0 +4.9 +907 19-May-16 +88.5 +846 +2.5 +2.9 -61
PETBRA 5.375 '21s (Long) 21-Apr-16 +86.5 +5.4 +878 19-May-16 +87.0 +883 +0.5 +0.9 +5
PETBRA 6.250 '24s (Long) 21-Apr-16 +84.8 +6.3 +894 19-May-16 +84.3 +911 -0.5 -0.0 +17
PETBRA 6.875 '40s (Long) 21-Apr-16 +76.5 +6.9 +929 19-May-16 +74.8 +959 -1.8 -1.2 +30
PETBRA 6.850 2115 (Long) 21-Apr-16 +72.5 +6.9 +938 19-May-16 +69.0 +993 -3.5 -3.0 +55
Closed trades
PETBRA 2y4y Flattener (4.875 '20s vs. 5.875 '18s) 21-Apr-16 -11.8 -1.0 +218 19-May-16 -12.4 +312 -0.6 -0.7 +94
PETBRA 3.000 '19s (Long) 21-Apr-16 +88.5 +3.0 +755 19-May-16 +91.9 +638 +3.4 +3.6 -117
PETBRA 4.375 '23s (Long) 21-Apr-16 +77.3 +4.4 +868 19-May-16 +76.8 +892 -0.5 -0.2 +24
PETBRA 6.750 '41s (Long) 21-Apr-16 +76.5 +6.8 +910 19-May-16 +74.0 +950 -2.5 -2.0 +40
PETBRA 7.250 '44s (Long) 21-Apr-16 +79.3 +7.3 +929 19-May-16 +77.5 +957 -1.8 -1.2 +28
PETBRA 3y8y Steepener (3.000 '19s vs. 6.250 '24s) 7-Oct-15 +0.1 -3.3 +56 21-Apr-16 +3.8 -139 +3.7 +1.9 -195
PETBRA 3.250 '17s (Long) 7-Oct-15 +93.4 +3.3 +826 29-Feb-16 +96.5 +628 +3.1 +4.4 -198
PETBRA 3.500 '17s (Long) 7-Oct-15 +94.2 +3.5 +822 29-Feb-16 +97.5 +575 +3.3 +4.7 -247
PETBRA 10y30y Steepener (4.375 '23s vs. 7.250 '44s) 17-Dec-15 -2.5 -2.9 +35 29-Feb-16 -3.0 -55 -0.5 -1.1 -90
PETBRA 5.750 '20s vs. 7.875 '19s 7-Oct-15 -9.8 -2.1 +37 17-Dec-15 -10.4 +52 -0.6 -1.0 +15
PETBRA 10y30y Flattener (7.250 '44s vs. 6.250 '24s) 7-Oct-15 -5.1 +1.0 +13 17-Dec-15 -4.0 -61 +1.1 +1.3 -74
Average Realized Performance +0.5 +0.8 -44
ClosingInception
Inception Reiteration Performance
Performance
Inception Target Target Performance
Source: Deutsche Bank. * In percentage points of face value. ** In base points.
Improved near-term liquidity after USD6.75bn issuance
USD6.75bn bond issuance further enhances Petrobras’ near-term liquidity On May 17, Petrobras announced and priced USD5.0bn of new 8.375% five-year USD notes (‘21Ns) and USD1.75bn of new 8.75% ten-year USD notes (‘26s) to fund a tender of 2017-2019 bond maturities and for general corporate purposes. The tenders are an “Any and All” offer for the 8.375% ‘18s and a “Waterfall” offer for various USD and EUR notes due from 2017 to 2019 for up to USD6.0bn. The early tender date is May 31, 2016, with the offers to purchase and consent solicitation set to expire on June 14, 2016. The “Any and All” offer is conditioned upon the receipt of at least a majority of the outstanding principal amount of the 2018 notes (principal of USD576.8mn). If Petrobras does not receive the majority consents, it will not purchase any of the 8.375% 2018 notes, and their indenture and notes guaranty will not be amended (Petrobras is seeking to eliminate certain covenants and other provisions of the 8.375% 2018 notes). The “Waterfall” tender offers are for ten international notes (seven USD bonds and three EUR bonds) amounting to USD17.3bn in principal and ranking in different acceptance priority levels based on their maturities (i.e., 2017 notes rank highest in priority and 2019 the lowest). Our revised forecasts (see revised forecasts section) indicate a

20 May 2016
HY Corporate Credit,Energy,Commodities,Energy
Petroleo Brasileiro S.A.
Page 8 Deutsche Bank Securities Inc.
cumulative gross funding gap of USD39bn, USD58bn and 89bn through March 2020, May 2021 and May 2026, respectively, including USD1.9bn of loans issued in 1Q16, USD1.4bn of asset sales in 2016 to date and a USD10bn committed credit line from China. If we assume USD12.6bn of additional asset sales, 30% rollover of loan maturities and USD10bn of new loans from Brazilian state-owned banks, the cumulative funding gap would drop to USD2.5bn, USD19bn and USD43bn through March 2020, May 2021 and May 2026, respectively.
Figure 13: Petrobras: liquidity forecasts by DB Credit Research
In USD billions Mar '17 Mar '18 Jan '19 Apr '19 Jan '20 Mar '20 Jan '21 May '21 May '23 Mar '24 May '26
Sources of Cash * 65.2 81.9 96.5 101.1 114.8 117.9 133.3 139.3 174.5 188.8 224.4
Cash & Equiv. (2015E) 25.4 25.4 25.4 25.4 25.4 25.4 25.4 25.4 25.4 25.4 25.4
New Loans Approved 11.9 11.9 11.9 11.9 11.9 11.9 11.9 11.9 11.9 11.9 11.9
New Bonds 6.8 6.8 6.8 6.8 6.8 6.8 6.8 6.8 6.8 6.8 6.8
Asset Sales Completed 1.4 1.4 1.4 1.4 1.4 1.4 1.4 1.4 1.4 1.4 1.4
Operating Cash Flow 19.8 36.5 51.1 55.7 69.4 72.5 87.9 93.9 129.1 143.4 179.0
Uses of Cash * 54.5 81.5 109.8 121.5 147.2 157.2 184.4 197.6 250.4 272.3 313.3
Bond Maturities 10.7 15.5 19.6 23.8 26.3 29.6 35.7 40.7 44.8 48.1 50.8
Bond Tenders 3.4 1.0 0.7 - - - - - - - -
Loan Maturities 13.9 20.4 30.0 33.6 43.3 47.1 53.3 55.6 69.9 74.7 78.3
Capex 23.5 41.5 56.5 61.0 74.5 77.5 92.5 98.3 132.7 146.5 181.3
Minimum Cash Position 3.0 3.0 3.0 3.0 3.0 3.0 3.0 3.0 3.0 3.0 3.0
Sources Less Uses I * 10.7 0.4 (13.3) (20.4) (32.3) (39.3) (51.2) (58.3) (75.8) (83.5) (89.0)
Additional Asset Sales 3.6 8.6 12.6 12.6 12.6 12.6 12.6 12.6 12.6 12.6 12.6
Backstop from SOE Banks 10.0 10.0 10.0 10.0 10.0 10.0 10.0 10.0 10.0 10.0 10.0
Rollover of 30% of Loans 4.2 6.1 9.0 10.1 13.0 14.1 16.0 16.7 21.0 22.4 23.5
Source Less Uses II * 28.5 25.1 18.3 12.3 3.3 (2.5) (12.6) (19.0) (32.2) (38.5) (42.9)
Incremental OCF ** 19.8 16.6 14.7 4.6 13.7 3.1 15.4 6.0 35.2 14.2 35.6
Incremental Capex ** 23.5 18.0 15.0 4.5 13.5 3.0 15.0 5.9 34.3 13.8 34.8
Incremental FCF ** (3.7) (1.4) (0.3) 0.1 0.2 0.1 0.4 0.2 0.9 0.4 0.8
Net Debt to EBITDA *** 4.0 3.7 3.5 3.5 3.5 3.5 3.5 3.5 3.4 3.4 3.4
Through
* Cumulative. ** Non-cumulative. *** EBITDA excludes non-cash items. OCF = Operating Cash Flow (After Interest). FCF = Free Cash Flow (Before Asset Sales).
Source: Deutsche Bank
Encouraging 1Q16 results
Solid 1Q16 results encourage us to expect better results ahead on higher oil prices, normalized production and well-anchored BRL In our view, Petrobras’ 1Q16 results were quite encouraging, as the company managed to grow EBITDA (adjusted to exclude non-cash items) sequentially by 8% (in USD terms) in a quarter that was impacted by production stoppages, weak domestic demand, low oil prices (USD34/bbl Brent) and weak average USDBRL (3.9). The combination of a stronger BRL (3.5 spot and DB’s 3.7 YE forecast), higher oil prices (USD49/bbl Brent spot and USD48/bbl DB’s 2H16 forecast) and domestic production normalization (to 2.5-2.6 Mboepd) bodes well for future earnings and for our 4.0x 2016 net leverage forecast.
1Q16 EBITDA (DB-adjusted) increased by 8% qoq, to USD6.1bn, despite lower E&P production and lower oil prices Petrobras’ 1Q16 earnings were better than we expected, primarily due to the following factors: (i) lower-than-expected (lte) E&P realization price discount to

20 May 2016
HY Corporate Credit,Energy,Commodities,Energy
Petroleo Brasileiro S.A.
Deutsche Bank Securities Inc. Page 9
Brent (USD8.3/boe vs. USD16.8/boe average of previous four quarters); (ii) lte royalties and special participation (USD2.9/boe vs. USD4.7/boe in 4Q15); (iii) lte import costs; (iv) lte operational expenses ex- dry-well write-offs (-45% qoq to USD2.2bn); and (v) higher-than-expected (hte) EBITDA from domestic power and international business (USD0.52bn vs. USD0.47bn average of previous four quarters). As a result, EBITDA adjusted to exclude non-cash items (DB-adjusted EBITDA) increased by 7.9% qoq to USD6.1bn, despite lower oil prices (Brent -22% qoq, to USD33.9/bbl), lower domestic oil and gas production due to maintenance stoppages (-5.8% qoq, to 2.44 Mboepd), and lower domestic sales volume (-5.3% qoq, to 2.06 Mboepd). The combination of flat domestic fuel prices (in BRL terms), flat average FX rate and lower refining input prices led to a 25% qoq increase in the domestic downstream EBITDA (USD4.2bn), which was a key factor to the company’s solid results.
Figure 14: Petrobras: key financial and operational stats
1Q15 4Q15 1Q16 qoq yoy
Brent Oil Price USD/bbl 53.9 43.7 33.9 -22% -37%
USDBRL, avg 2.9 3.9 3.9 +1% +36%
USDBRL, eop 3.2 4.0 3.6 -10% +12%
Domestic Crude Oil Production Mboepd 2.15 2.12 1.98 -6% -8%
Domestic Oil & Gas Production Mboepd 2.62 2.59 2.44 -6% -7%
Net Exports (Imports) of Crude Oil kboepd 4 172 108 -37% NMF
Net Exports (Imports) of Oil Products kboepd (229) (3) (139) NMF -39%
Domestic Oil & Gas Price Difference to Brent USD/boe (16.4) (14.8) (8.3) -44% -50%
Domestic E&P Realization Price USD/boe 37.5 28.9 25.6 -11% -32%
Domestic Royalties USD/boe 6.8 4.7 2.9 -37% -57%
Domestic Lifting Cost USD/boe 13.3 10.6 10.5 -1% -21%
Domestic E&P Unitary EBITDA USD/boe 14.8 13.3 10.2 -23% -31%
Domestic Oil Products Sales Volume Mboepd 2.23 2.17 2.06 -5% -8%
Domestic Diesel and Gasoline Volume Mboepd 1.48 1.47 1.36 -7% -8%
Domestic Oil Products Real. Price USD/boe 77.1 62.2 59.4 -4% -23%
Other Downstream Costs USD bn 5.2 3.8 2.0 -47% -61%
Domestic Refining & Marketing EBITDA USD/boe 25.0 16.1 21.1 +31% -16%
Domestic E&P, Refining & Marketing EBITDA USD bn 9.18 6.58 6.55 -0% -29%
Domestic E&P, Refining & Marketing Unitary EBITDA USD/boe 38.3 26.7 28.6 +7% -25%
Operational Expenses USD bn (2.02) (4.00) (2.18) -45% +8%
Reported Adjusted EBITDA USD bn 7.50 4.43 5.41 +22% -28%
Non-cash EBITDA Items (DB adjustment) USD bn 0.94 1.22 0.69
DB-adjusted EBITDA USD bn 8.43 5.65 6.10 +8% -28%
E&P USD bn 3.82 3.18 2.31 -27% -40%
Refining & Marketing USD bn 5.36 3.40 4.24 +25% -21%
Other Domestic Businesses USD bn 0.36 0.06 0.31 +433% -13%
International USD bn 0.29 (0.08) 0.21 -349% -27%
Overhead USD bn (1.40) (0.90) (0.97) +8% -30%
Cash Flow From Operations Before WC Changes USD bn 5.89 5.96 4.17 -30% -29%
Working Capital Variation USD bn (2.11) (0.80) (1.68)
Capex USD bn (6.16) (4.67) (3.83) -18% -38%
Asset Sales USD bn 0.18 0.51 0.00
Free Cash Flow (FCF) USD bn (2.21) 0.99 (1.34)
Recurring FCF @ USD19bn Annual Capex USD bn 1.14 1.21 (0.58)
Cash & Equivalent USD bn 21.3 25.4 22.4 -12% +5%
Short-term Debt USD bn 12.4 14.5 17.3
Total Debt USD bn 125.2 124.1 125.4 +1% +0%
Net Debt USD bn 103.9 98.7 102.9 +4% -1%
EBITDA Margin 32.6% 25.6% 33.8% +824 bps +125 bps
Total Debt / DB-Adjusted LQA EBITDA 3.71 5.49 5.14 -0.35 +1.43
Net Debt / DB-Adjusted LQA EBITDA 3.08 4.37 4.22 -0.15 +1.14
Cash & Equivalent / Short-term Debt 1.72 1.76 1.30 -0.46 -0.42
Recurring FCF @ USD18bn Capex / Total Debt +3.6% +3.9% -1.9% Source: Deutsche Bank, Company Reports.

20 May 2016
HY Corporate Credit,Energy,Commodities,Energy
Petroleo Brasileiro S.A.
Page 10 Deutsche Bank Securities Inc.
Run-rate net leverage of 4.2x (vs. 4.4x LQ) due to higher EBITDA, stronger BRL and limited cash burn Petrobras’ run-rate (LQA) debt-to-EBITDA (DB-adjusted) metrics improved in the quarter to 5.1x using gross debt and 4.2x using net debt (vs. 5.5x and 4.4x, respectively, in 4Q15). While EBITDA increased by 8% qoq, net debt increased by 4% qoq, to USD103bn, as a stronger BRL (USDBRL -10% qoq, to 3.59, and 16% of Petrobras’ debt in BRL) partially offset the company’s USD1.3bn cash burn (free cash flow) in the quarter. The cash burn included USD1.7bn of negative working capital variation and USD3.8bn of capex. If we were to exclude the change in working capital and use an annualized capex of USD19bn (guidance for 2016), the company would have burned USD0.6bn (USD2.3bn annualized, 1.9% of total debt).
Positive macro/governance momentum in Brazil
New interim government’s economic team could revive confidence and improve governance at state-owned companies, a boon to asset sales and refinancing prospects The cabinet change currently taking place in Brazil following VP Michel Temer’s nomination by congress as Interim President (potentially becoming the official president if President Dilma Rousseff’s impeachment is approved by the senate within 180 days, from mid-April) has brought in some names well regarded by the market (including Henrique Meirelles as finance minister and Ilan Goldfajn as central bank head), and we believe they have a good shot at reviving confidence in the economy and improving governance at state-owned companies, including Petrobras. In our view, this could spark faster cost and capex cuts, faster asset sales and, along with a well-anchored BRL, faster deleveraging. In fact, press reports indicate that Petrobras might be close to announce the sale of one of its gas pipeline company for around BRL18bn (USD5.0bn).
Pedro Parente, the new CEO of Petrobras, brings high-caliber public- and private-sector experience BM&FBovespa’s current chairman and former CEO of Bunge’s Brazil unit Pedro Parente has accepted an invitation from Brazil’s interim president Michel Temer to replace Aldemir Bendine as CEO of Petrobras, as reported by the interim president’s press office. Parente was also CEO of Brazilian media company RBS and energy minister under former president Fernando Henrique Cardoso, where he oversaw a drought-related energy crisis in 2002. Although Mr. Parente has apparently no experience in the oil sector, we welcome his appointment due to his experience in important jobs in both the private and public sectors.
Positive momentum in oil
Oil is receiving short-term price support from unplanned supply disruptions (Nigeria, Canada, Libya); fundamentals point to supply-demand rebalancing starting in 2H16 Deutsche Bank’s Commodities team forecasts a Brent oil price of USD45/bbl-USD50/bbl in 2H16, with a long-term price of USD70/bbl. Underpinning this view is the belief that the process of rebalancing crude oil supply-demand is underway, as two consecutive years of capex cutbacks eventually must cause production rates to suffer, while unplanned supply disruptions have so far negated the impact of incremental oil production.

20 May 2016
HY Corporate Credit,Energy,Commodities,Energy
Petroleo Brasileiro S.A.
Deutsche Bank Securities Inc. Page 11
Key credit anchors
Strong implicit government support (if needed) In our view, the ultimate anchor for Petrobras as a credit is our belief that any Brazilian government would have a high incentive to support the company’s funding requirements (if needed) and thus avoid a credit event that would be very disruptive for the Brazilian financial system and for Brazilian corporates’ ability to tap funding (domestically and abroad). We believe that government support, if needed, would happen on an as-needed basis, most likely through Treasury guarantees to new loans (without immediate cash impact and not requiring approval from congress), similar to what has happened at other SOEs in the country. Debt-to-equity conversion of credits held by state-owned banks (up to ~USD25-30bn) is also a possibility, in our view, implying deleveraging of up to 1.1x-1.4x EBITDA. Moreover, we estimate that the main state-owned banks in Brazil (with a loan book of about USD400bn) would have the ability to extend at least USD10bn of additional loans (on top of rollovers) to Petrobras without threatening their capitalizations and without crowding out the Brazilian corporate sector.
Stressed scenario points to 3% of GDP in potential support needs through 2020, which would be feasible through debt-to-equity conversion of credits held by state-owned banks and Treasury guarantees to new loans, in our view Petrobras has USD125bn of debt (of which USD53bn are bonds. The key driver for Petrobras’ leverage (and ability to refinance) is the USDBRL rate, as about 65% of the company’s revenue is linked to the BRL (domestic fuel prices frozen in BRL terms), while 86% of the debt and about 50% of costs and capex are linked to the USD. Only in a scenario of very weak USDBRL (above 4.3x) and oil prices (below USD35/bbl) Petrobras would be at risk of needing substantial government support, which we believe they would get most likely through a combination of debt-to-equity conversion of credits held by state-owned banks and Treasury guarantees to new loans. In a stressed scenario of USD30/bbl Brent price and 4.4 USDBRL, we estimate that Petrobras’ gross funding gap (before debt rollovers and asset sales) would be USD54bn through the end of 2020. We estimate that at least USD8bn of that number is owed to state-owned banks, which would most likely continue to roll over, leaving the company on the hook for about USD46bn in funding needs, which account to about 3% of Brazil’s USD1.5tn GDP.
Sizable hydrocarbon reserves in Brazil Petrobras holds sizable pre-salt hydrocarbon prospects, whose break-even prices might be in the mid-to-high-30s (USD/boe), according the company. Wood Mackenzie valued these reserves at USD167bn (NPV10) when oil prices were at USD100/bbl (see figure 17). Several global oil companies are present in the Brazilian E&P sector and many of those are industry partners of Petrobras (through projects in E&P concessions). Sales of stakes in E&P projects and/or farm-outs are a real possibility for Petrobras, in our view. Potential further improvement in oil prices and a more market-friendly government in Brazil could be the sparks for major deals in this area.
20 May 2016
HY Corporate Credit,Energy,Commodities,Energy
Petroleo Brasileiro S.A.
Page 12 Deutsche Bank Securities Inc.
Revised forecasts
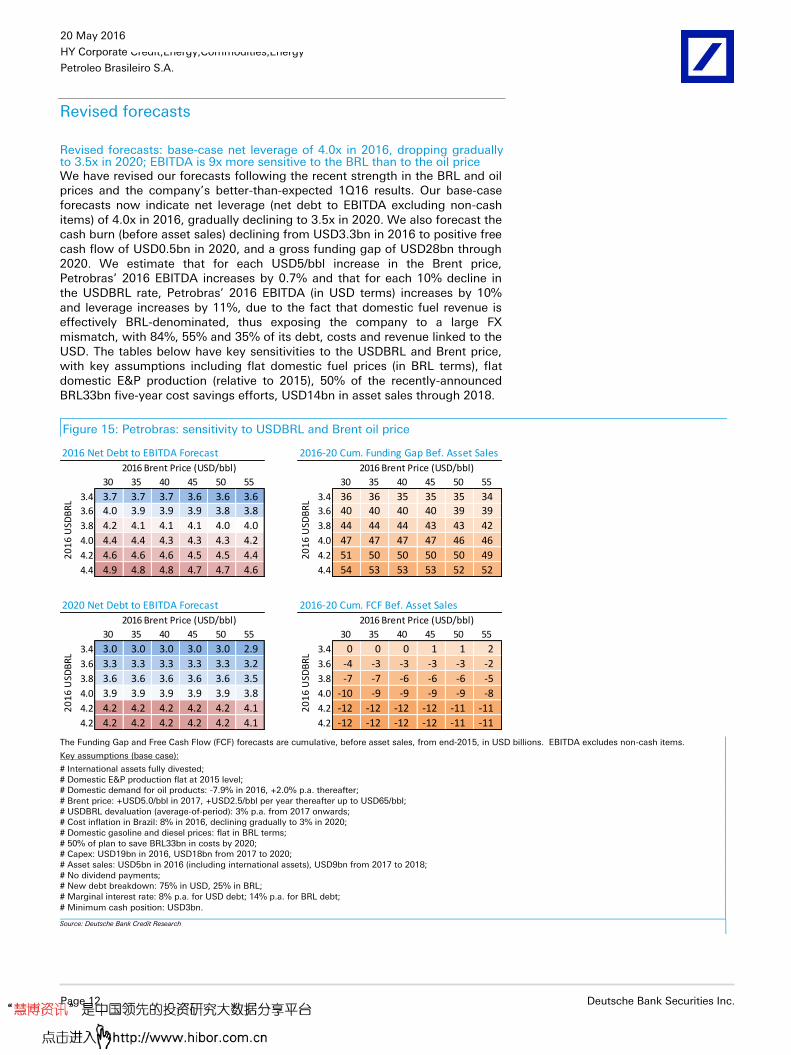
Revised forecasts: base-case net leverage of 4.0x in 2016, dropping gradually to 3.5x in 2020; EBITDA is 9x more sensitive to the BRL than to the oil price We have revised our forecasts following the recent strength in the BRL and oil prices and the company’s better-than-expected 1Q16 results. Our base-case forecasts now indicate net leverage (net debt to EBITDA excluding non-cash items) of 4.0x in 2016, gradually declining to 3.5x in 2020. We also forecast the cash burn (before asset sales) declining from USD3.3bn in 2016 to positive free cash flow of USD0.5bn in 2020, and a gross funding gap of USD28bn through 2020. We estimate that for each USD5/bbl increase in the Brent price, Petrobras’ 2016 EBITDA increases by 0.7% and that for each 10% decline in the USDBRL rate, Petrobras’ 2016 EBITDA (in USD terms) increases by 10% and leverage increases by 11%, due to the fact that domestic fuel revenue is effectively BRL-denominated, thus exposing the company to a large FX mismatch, with 84%, 55% and 35% of its debt, costs and revenue linked to the USD. The tables below have key sensitivities to the USDBRL and Brent price, with key assumptions including flat domestic fuel prices (in BRL terms), flat domestic E&P production (relative to 2015), 50% of the recently-announced BRL33bn five-year cost savings efforts, USD14bn in asset sales through 2018.
Figure 15: Petrobras: sensitivity to USDBRL and Brent oil price
2016 Net Debt to EBITDA Forecast 2016-20 Cum. Funding Gap Bef. Asset Sales
30 35 40 45 50 55 30 35 40 45 50 55
3.4 3.7 3.7 3.7 3.6 3.6 3.6 3.4 36 36 35 35 35 343.6 4.0 3.9 3.9 3.9 3.8 3.8 3.6 40 40 40 40 39 39
3.8 4.2 4.1 4.1 4.1 4.0 4.0 3.8 44 44 44 43 43 42
4.0 4.4 4.4 4.3 4.3 4.3 4.2 4.0 47 47 47 47 46 46
4.2 4.6 4.6 4.6 4.5 4.5 4.4 4.2 51 50 50 50 50 49
4.4 4.9 4.8 4.8 4.7 4.7 4.6 4.4 54 53 53 53 52 52
2020 Net Debt to EBITDA Forecast 2016-20 Cum. FCF Bef. Asset Sales
30 35 40 45 50 55 30 35 40 45 50 55
3.4 3.0 3.0 3.0 3.0 3.0 2.9 3.4 0 0 0 1 1 2
3.6 3.3 3.3 3.3 3.3 3.3 3.2 3.6 -4 -3 -3 -3 -3 -2
3.8 3.6 3.6 3.6 3.6 3.6 3.5 3.8 -7 -7 -6 -6 -6 -5
4.0 3.9 3.9 3.9 3.9 3.9 3.8 4.0 -10 -9 -9 -9 -9 -8
4.2 4.2 4.2 4.2 4.2 4.2 4.1 4.2 -12 -12 -12 -12 -11 -11
4.2 4.2 4.2 4.2 4.2 4.2 4.1 4.2 -12 -12 -12 -12 -11 -11
2016 Brent Price (USD/bbl)
20
16
USD
BR
L2
01
6 U
SDB
RL
20
16
USD
BR
L
2016 Brent Price (USD/bbl) 2016 Brent Price (USD/bbl)
20
16
USD
BR
L
2016 Brent Price (USD/bbl)
The Funding Gap and Free Cash Flow (FCF) forecasts are cumulative, before asset sales, from end-2015, in USD billions. EBITDA excludes non-cash items.
Key assumptions (base case):
# International assets fully divested; # Domestic E&P production flat at 2015 level; # Domestic demand for oil products: -7.9% in 2016, +2.0% p.a. thereafter; # Brent price: +USD5.0/bbl in 2017, +USD2.5/bbl per year thereafter up to USD65/bbl; # USDBRL devaluation (average-of-period): 3% p.a. from 2017 onwards; # Cost inflation in Brazil: 8% in 2016, declining gradually to 3% in 2020; # Domestic gasoline and diesel prices: flat in BRL terms; # 50% of plan to save BRL33bn in costs by 2020; # Capex: USD19bn in 2016, USD18bn from 2017 to 2020; # Asset sales: USD5bn in 2016 (including international assets), USD9bn from 2017 to 2018; # No dividend payments; # New debt breakdown: 75% in USD, 25% in BRL; # Marginal interest rate: 8% p.a. for USD debt; 14% p.a. for BRL debt;
# Minimum cash position: USD3bn.
Source: Deutsche Bank Credit Research

20 May 2016
HY Corporate Credit,Energy,Commodities,Energy
Petroleo Brasileiro S.A.
Deutsche Bank Securities Inc. Page 13
Figure 16: Petrobras: base-case forecasts by Deutsche Bank Credit Research
2014 2015 2016E 2017E 2018E 2019E 2020E
Net Revenue USDmn 143,210 97,283 74,240 76,986 78,545 79,944 81,170
COGS (without D&A) USDmn (96,028) (57,129) (37,376) (39,410) (40,531) (41,621) (42,690)
Operating Expenses (without D&A) USDmn (22,070) (17,404) (12,582) (12,357) (12,592) (12,748) (12,820)
Reported EBITDA USDmn 25,113 22,750 24,283 25,218 25,422 25,576 25,660
(-) Non-cash Items USDmn 8,161 4,365 - - - - -
EBITDA (Adjusted by DB Credit Research) USDmn 33,273 27,115 24,283 25,218 25,422 25,576 25,660
Interest Expense USDmn (7,045) (6,436) (6,741) (7,513) (6,266) (5,214) (4,892)
Interest Income USDmn 1,085 1,412 545 557 426 201 58
Cash Taxes USDmn (1,902) (1,924) (1,314) (1,403) (1,687) (1,908) (2,002)
Other FFO Items USDmn 2,367 1,631 - - - - -
FFO (Funds From Operations) USDmn 27,778 21,799 16,773 16,860 17,895 18,655 18,823
Changes in WC USDmn (7,340) (2,194) (1,035) (497) (385) (373) (360)
OCF USDmn 20,438 19,605 15,739 16,363 17,510 18,282 18,463
Capex USDmn (34,732) (21,494) (19,001) (18,000) (18,000) (18,000) (18,000)
Asset Sales USDmn 3,991 726 5,000 5,000 4,000 - -
Dividends and other FCF Items USDmn 282 - - - - - -
Free Cash Flow USDmn (14,012) (1,163) 1,738 3,363 3,510 282 463
Debt Amortizations USDmn (10,033) (14,810) (18,057) (9,287) (14,435) (21,045) (14,281)
New Debt USDmn 30,943 17,430 17,750 - - 13,693 13,905
Impact of FX on Cash Position USDmn 1,544 (1,867) 927 (418) (319) (151) (44)
Net Change in Cash & Equivalent USDmn 9,634 (410) 3,285 (6,760) (11,564) (7,373) -
FCF Before Asset Sales and Dividends USDmn (18,285) (1,888) (3,262) (1,637) (490) 282 463
Cumulative Funding Gap USDmn - - - - - 13,693 27,598
Cash & Equivalent USDmn 25,822 25,412 28,697 21,937 10,373 3,000 3,000
Total Debt USDmn 131,474 124,143 125,312 115,387 100,380 92,514 91,593
Net Debt USDmn 105,651 98,731 96,614 93,450 90,008 89,514 88,593
Total Debt / EBITDA 4.0 4.6 5.2 4.6 3.9 3.6 3.6
Net Debt / EBITDA 3.2 3.6 4.0 3.7 3.5 3.5 3.5
EBITDA / Interest Expense 4.7 4.2 3.6 3.4 4.1 4.9 5.2
EBITDA Margin 23% 28% 33% 33% 32% 32% 32%
Net Revenue Growth -32.1% -23.7% 3.7% 2.0% 1.8% 1.5%
EBITDA Growth -18.5% -10.4% 3.9% 0.8% 0.6% 0.3%
Net Debt Growth -6.6% -2.1% -3.3% -3.7% -0.5% -1.0%
EBITDA - Domestic Oil and Gas USDmn 33,036 15,129 12,147 14,850 16,263 17,706 19,176
EBITDA - Domestic Downstream USDmn 3,877 13,493 15,183 13,488 12,332 11,065 9,668
EBITDA - Overhead and Other Businesses USDmn (3,639) (1,506) (3,048) (3,120) (3,174) (3,196) (3,184)
Revenue Linked to International Oil Prices USDmn 54,957 30,458 17,429 19,479 20,593 21,728 22,886
Costs Linked to International Oil Prices USDmn (66,134) (30,204) (14,172) (16,843) (18,685) (20,636) (22,698)
EBITDA Linked to International Oil Prices USDmn (11,177) 254 3,258 2,636 1,908 1,093 188
Revenue Linked to the USD USDmn 54,957 30,458 17,429 19,479 20,593 21,728 22,886
Costs Linked to the USD USDmn (56,847) (32,551) (16,675) (19,225) (20,955) (22,803) (24,771)
EBITDA Linked to the USD USDmn (1,891) (2,093) 755 255 (362) (1,075) (1,885)
% of Net Revenue Linked to USD and Intern. Oil Prices 38% 31% 23% 25% 26% 27% 28%
% of Cash Costs and Expenses Linked to USD 52% 46% 33% 37% 39% 42% 45%
% of Cash Costs and Expenses Linked to Intern. Oil Prices 60% 43% 28% 33% 35% 38% 41%
Domestic E&P Production kboepd 2,460 2,597 2,597 2,597 2,597 2,597 2,597
Domestic Oil & NGL Production kboepd 2,034 2,128 2,128 2,128 2,128 2,128 2,128
Domestic Oil & NGL Production growth, yoy 5.3% 4.6% 0.0% 0.0% 0.0% 0.0% 0.0%
Domestic Refining Production kboepd 2,170 2,026 2,026 2,026 2,026 2,026 2,026
Domestic Refining Production growth, yoy 2.2% -6.7% 0.0% 0.0% 0.0% 0.0% 0.0%
Sales Volume in Brazil kboepd 3,003 2,789 2,568 2,619 2,672 2,725 2,780
Sales Volume in Brazil Growth, yoy 4.2% -7.1% -7.9% 2.0% 2.0% 2.0% 2.0%
Domestic Net Exports - Crude Oil and Products kboepd (412) (24) 377 65 24 (18) (61)
Domestic Net Exports - Natural Gas and LNG kboepd (349) (304) (305) (305) (305) (305) (305)
Domestic Gasoline Refinery Price Change in BRL, yoy 3.8% 7.2% 1.5% 0.0% 0.0% 0.0% 0.0%
Gasoline Refinery Price (Brazil vs. US) -9% 30% 45% 27% 17% 8% 0%
Domestic Diesel Refinery Price Change in BRL, yoy 5.0% 10.4% 1.0% 0.0% 0.0% 0.0% 0.0%
Diesel Refinery Price (Brazil vs. US) -7% 38% 53% 33% 22% 13% 5%
Brent Reference Price USD/boe 98.9 52.4 43.0 48.0 50.5 53.0 55.5
BRL/USD (eop) 2.67 3.97 3.70 3.81 3.93 4.04 4.16
BRL/USD (avg) 2.36 3.33 3.70 3.81 3.93 4.04 4.16
Cost Inflation 6.3% 9.0% 8.0% 6.0% 5.0% 4.0% 3.0% Source: Deutsche Bank

20 May 2016
HY Corporate Credit,Energy,Commodities,Energy
Petroleo Brasileiro S.A.
Page 14 Deutsche Bank Securities Inc.
Figure 17: Petrobras’ recoverable oil reserves as estimated by Wood
Mackenzie with long-term oil price (real) of USD100/bbl
Basin Oil Oil & Gas
Brazilian assets 317,264 9.2 32,035 34,381
Key pre-salt offshore assets 166,770 33.8 6.7 23,441 24,729
Buzios Santos 100% 41,509 32.6 13.6 2,931 3,051
Lula Santos 65% 34,294 22.8 6.4 5,052 5,396
Buzios (Surplus) Santos 100% 16,057 24.5 2.9 5,269 5,480
Iara Santos 65% 15,074 28.3 6 2,381 2,516
Sapinhoa Santos 45% 10,887 36.6 11.5 863 950
Jubarte Campos 100% 9,828 57.0 21.9 445 449
Cernambi Santos 65% 9,788 52.2 10.1 885 970
Libra Santos 40% 7,479 17.0 3.2 2,226 2,323
Iara Entorno Santos 100% 6,643 31.1 11.4 547 583
Iara Entorno (Surplus) Santos 100% 6,206 19.6 2.6 2,244 2,391
Florim Santos 100% 4,743 33.3 10.2 443 465
Baleia Azul Campos 100% 4,262 141.4 27.6 155 155
Key post-salt offshore assets 53,861 61.3 21.8 2,416 2,472
Marlim Sul Campos 100% 16,683 38.1 17.9 897 934
Marlim Campos 100% 10,439 31.8 26.2 399 399
Marlim Leste Area Campos 100% 5,652 32.6 23.5 227 240
Papa-Terra Campos 63% 5,112 17.7 21.5 237 237
Barracuda Area Campos 100% 4,613 28.7 26.5 169 174
Cachalote Campos 100% 4,491 215.1 21.6 208 208
Caratinga Area Campos 100% 3,751 25.1 26.7 140 141
Baleia Franca Campos 100% 3,120 277.7 22.5 139 139
Key onshore assets 11,642 18.8 500 618
Ceara Potiguar 100% 5,342 - 19.1 253 279
Reconcavo Tucano 100% 2,548 7.4 19.4 100 131
Sergipe Alagoas 100% 2,333 19.1 14.9 101 156
Espiritu Santo 100% 1,419 211.1 27.5 46 52
Other assets in Brazil 84,991 13.0 5,678 6,562
Others - Campos Basin NA 58,026 NA 16.5 3,272 3,516
Others - Santos Basin NA 22,419 NA 9.3 2,025 2,417
Urucu Area 100% 2,787 124.1 7.9 190 352
Manati 35% 640 40.4 18.3 1 35
Camarupim 76% 393 4.3 14.4 5 27
Peroa 100% 259 28.5 26.3 1 10
Canapu 100% 212 13.7 20.1 1 11
Piranema 100% 143 8 20.1 7 7
Others NA 112 NA 0.6 176 187
International assets 11,794 8.2 878 1,446
Argentina 1,208 6.5 83 187
Bolivia 1,713 3.6 68 472
Venezuela 96 5.5 17 17
UF Gulf of Mexico 6,762 10.5 582 642
Nigeria 2,015 15.7 128 128
Total Petrobras 329,058 9.2 32,913 35,825
Asset
Recoverable reserves
(mnboe)USD/
boeIRR (%)
NPV10
(USDm)
Equity
(%)
Source: Deutsche Bank, Wood Mackenzie.

20 May 2016
HY Corporate Credit,Energy,Commodities,Energy
Petroleo Brasileiro S.A.
Deutsche Bank Securities Inc. Page 15
Figure 18: Z spread vs. Brent Price Figure 19: Z spread vs. USDBRL
Source: Deutsche Bank. Pricing is indicative (mid side), as of May 19, 2016. Source: Deutsche Bank. Pricing is indicative (mid side), as of May 19, 2016.
Figure 20: Z spread history – belly Figure 21: Sov spread history – belly
Source: Deutsche Bank. Pricing is indicative (mid side), as of May 19, 2016. Source: Deutsche Bank. Pricing is indicative (mid side), as of May 19, 2016.
Figure 22: Z spread history – long end Figure 23: Sov spread history – long end
Source: Deutsche Bank. Pricing is indicative (mid side), as of May 19, 2016. Source: Deutsche Bank. Pricing is indicative (mid side), as of May 19, 2016.

20 May 2016
HY Corporate Credit,Energy,Commodities,Energy
Petroleo Brasileiro S.A.
Page 16 Deutsche Bank Securities Inc.
Figure 24: Petrobras 1Q16 summary financials (BRLm)
Income Statement (R$mm) 1Q15 2Q15 3Q15 4Q15 1Q16 qoq yoy 2014 2015 LTM
Total Rev enues 74,353.0 79,943.0 82,239.0 85,103.0 70,337.0 -17.4% -5.4% 337,260.0 321,638.0 317,622.0
COGS (51,943.0) (54,381.0) (58,484.0) (58,254.0) (49,329.0) -15.3% -5.0% (256,823.0) (223,062.0) (220,448.0)
Gross Profi t 22,410.0 25,562.0 23,755.0 26,849.0 21,008.0 -21.8% -6.3% 80,437.0 98,576.0 97,174.0
Gross Margin 30.1% 32.0% 28.9% 31.5% 29.9% (168.1) (27.2) 23.9% 30.6% 30.6%
Gross interest expense (4,864.0) (6,463.0) (4,868.0) (9,650.0) (7,221.0) -25.2% 48.5% (16,211.0) (25,845.0) (28,202.0)
SG&A (4,434.0) (6,650.0) (6,609.0) (9,231.0) (6,403.0) -30.6% 44.4% (27,197.0) (26,924.0) (28,893.0)
Cash F low (R$mm) 1Q15 2Q15 3Q15 4Q15 1Q16 qoq yoy 2014 2015 LTM
Reported EBITDA 21,518.0 19,771.0 15,506.0 17,064.0 21,091.0 23.6% -2.0% 59,140.0 73,859.0 73,432.0
Reported EBITDA Margin 28.9% 24.7% 18.9% 20.1% 30.0% 993.5 104.5 17.5% 23.0% 23.1%
Change in W C 2,000.0 1 ,540.0 (2 ,141.0) (296.0) 405.0 NM -79.8% (2,354.0) 1 ,103.0 (492.0)
Net In terest paid (7,391.0) (2 ,914.0) (4 ,149.0) (8 ,999.0) (11,336.0) 26.0% 53.4% (13,941.0) (23,453.0) (27,398.0)
Net capex (17,843.0) (17,153.0) (17,977.0) (20,826.0) (15,593.0) -25.1% -12.6% (87,140.0) (76,315.0) (71,549.0)
Acquisitions 396.0 109.0 (190.0) (72.0) 146.0 NM -63.1% (250.0) 243.0 (7.0)
Cash dividends paid - - - - - NM NM (8,735.0) - -
Balance Sheet (R$mm) 1Q15 2Q15 3Q15 4Q15 1Q16 qoq yoy 2014 2015 LTM
S-T Debt 39,721.0 44,655.0 53,376.0 57,382.0 62,126.0 8.3% 56.4% 31,565.0 57,382.0 62,126.0
L-T Debt 360,918.0 370,894.0 453,208.0 435,467.0 387,889.0 -10.9% 7.5% 319,470.0 435,467.0 387,889.0
Total Debt 400,639.0 415,549.0 506,584.0 492,849.0 450,015.0 -8.7% 12.3% 351,035.0 492,849.0 450,015.0
Adjusted Cash and Cash equivalents 68,182.0 91,636.0 104,236.0 100,887.0 80,521.0 -20.2% 18.1% 68,946.0 100,887.0 80,521.0
Adjusted Net Debt 332,457.0 323,913.0 402,348.0 391,962.0 369,494.0 -5.7% 11.1% 282,089.0 391,962.0 369,494.0
Credi t Ratios 1Q15 2Q15 3Q15 4Q15 1Q16 qoq bps yoy bps 2014 2015 LTM
S-T Debt/Tot Debt 9.9% 10.7% 10.5% 11.6% 13.8% 216.2 389.1 9.0% 11.6% 13.8%
Cash/S-T Debt 1.72x 2.05x 1.95x 1.76x 1.30x -46.2 -42.0 2.18x 1.76x 1.30x
Total debt/LTM Reported EBITDA (x) 6.04x 5.95x 6.59x 6.67x 6.13x -54.5 8.6 5.94x 6.67x 6.13x
Adjusted Net debt/LTM Reported EBITDA (x) 5.01x 4.64x 5.24x 5.31x 5.03x -27.5 1.8 4.77x 5.31x 5.03x
LTM Rec OCF/Total Debt (%) 17.8% 17.8% 15.0% 14.8% 16.4% 166.5 -137.2 17.5% 14.8% 24.2%
Working Capital turnover (days) 32 32 31 29 35 6 2 27 30 31
CAPEX (%) Revenues 24.0% 21.5% 21.9% 24.5% 22.2% -230.3 -182.9 25.8% 23.7% 22.5%
amount as % total
Bonds 134,569.7 18.9% Adjusted Cash and Cash equivalents 80,521.0
Banks 315,445.3 44.3% Total 80,521.0
Total Debt 450,015.0 63.1% S-T Debt 62,126.0
Shareholders' Equity 262,666.0 36.9% Surplus/(Defici t) 18,395.0
Total Capi tal i zation 712,681.0 100.0%
Market Cap. As on 5/17/2016 144,820.2
Adjusted Net Debt 369,494.0
Enterprise Value 514,314.2
EV/LTM EBITDA 7.00x
*Adjusted numbers add government securities with maturities of +90 days to cash
Debt maturi ty profi le , R$mn as of 1Q16
Petroleo Brasileiro SA
Liqu idi ty
Equi ty Value
Petrobras 1Q16 rev enue breakdow nCapital Structure 1Q16 (R$mm)
E&P
21%
Supply
46%
Gas & Power
& BioFuel
8%
Distrib.
25%
17,40550,267 44,787
63,63989,260
241,024
2015 2016 2017 2018 2019 2020+
Source: Deutsche Bank, Company Data.

20 May 2016
HY Corporate Credit,Energy,Commodities,Energy
Petroleo Brasileiro S.A.
Deutsche Bank Securities Inc. Page 17
Figure 25: Petrobras 4Q15 summary financials (USDm)
Income Statement (USDm) 1Q15 2Q15 3Q15 4Q15 1Q16 qoq yoy 2014 2015 LTM
Total Rev enues 25,883.5 26,039.2 23,252.4 22,135.1 18,039.8 -18.5% -30.3% 143,198.0 96,345.0 89,466.5
COGS (18,082.2) (17,713.1) (16,535.9) (15,151.8) (12,651.7) -16.5% -30.0% (109,045.1) (66,817.0) (62,052.4)
Gross Profi t 7 ,801.3 8,326.1 6,716.5 6,983.4 5,388.0 -22.8% -30.9% 34,152.9 29,527.9 27,414.1
Gross Margin 30.1% 32.0% 28.9% 31.5% 29.9% (168.1) (27.2) 23.9% 30.6% 30.6%
Gross interest expense (1,693.2) (2,105.1) (1,376.4) (2,509.9) (1,852.0) -26.2% 9.4% (6,883.1) (7,741.7) (7,843.5)
SG&A (1,543.5) (2,166.1) (1,868.6) (2,401.0) (1,642.2) -31.6% 6.4% (11,547.6) (8,064.9) (8,077.9)
Cash F low (USDm) 1Q15 2Q15 3Q15 4Q15 1Q16 qoq yoy 2014 2015 LTM
Reported EBITDA 7,490.8 6,439.9 4,384.2 4,438.3 5,409.3 21.9% -27.8% 25,110.4 22,124.1 20,671.7
Reported EBITDA Margin 28.9% 24.7% 18.9% 20.1% 30.0% 993.5 104.5 17.5% 23.0% 23.1%
Change in W C (1,094.3) 847.0 (2 ,558.3) (97.8) 807.1 NM NM (2 ,206.3) (2 ,903.3) (1 ,001.9)
Net In terest paid (2,572.9) (949.2) (1 ,173.1) (2 ,340.6) (2 ,907.4) 24.2% 13.0% (5 ,919.2) (7 ,025.2) (7 ,370.3)
Net capex (6,211.4) (5 ,587.1) (5 ,082.8) (5 ,416.8) (3 ,999.2) -26.2% -35.6% (36,999.0) (22,859.8) (20,086.0)
Acquisitions 137.9 35.5 (53.7) (18.7) 37.4 NM -72.8% (106.1) 72.8 0.5
Cash dividends paid - - - - - NM NM (3,708.8) - -
Balance Sheet (USDm) 1Q15 2Q15 3Q15 4Q15 1Q16 qoq yoy 2014 2015 LTM
S-T Debt 12,297.9 14,390.9 13,521.5 14,487.5 17,294.7 19.4% 40.6% 11,877.3 14,487.5 17,294.7
L-T Debt 111,742.8 119,527.6 114,808.9 109,944.2 107,980.9 -1.8% -3.4% 120,210.0 109,944.2 107,980.9
Total Debt 124,040.7 133,918.5 128,330.3 124,431.7 125,275.6 0.7% 1.0% 132,087.2 124,431.7 125,275.6
Adjusted Cash and Cash equivalents 21,109.6 29,531.4 26,405.6 25,471.4 22,415.5 -12.0% 6.2% 25,943.0 25,471.4 22,415.5
Adjusted Net Debt 102,931.1 104,387.0 101,924.8 98,960.3 102,860.1 3.9% -0.1% 106,144.3 98,960.3 102,860.1
Credi t Ratios 1Q15 2Q15 3Q15 4Q15 1Q16 qoq bps yoy bps 2014 2015 LTM
S-T Debt/Tot Debt 9.9% 10.7% 10.5% 11.6% 13.8% 216.2 389.1 9.0% 11.6% 13.8%
Cash/S-T Debt 1.72x 2.05x 1.95x 1.76x 1.30x -46.2 -42.0 2.18x 1.76x 1.30x
Total debt/LTM Reported EBITDA (x) 4.70x 5.24x 4.90x 5.47x 6.06x 59.1 135.9 5.26x 5.62x 6.06x
Adjusted Net debt/LTM Reported EBITDA (x) 3.90x 4.09x 3.89x 4.35x 4.98x 19.6 95.6 4.23x 4.47x 4.98x
LTM Rec OCF/Total Debt (%) 26.0% 23.4% 23.4% 20.6% 17.3% -331.8 -866.1 20.7% 20.1% 26.5%
Working Capital turnover (days) 32 31 32 28 36 8.1 4.1 24 25 30
CAPEX (%) Revenues 24.0% 21.5% 21.9% 24.5% 22.2% -230.3 -182.9 25.8% 23.7% 22.5%
amount as % total
Bonds 37,461.6 18.9% Adjusted Cash and Cash equivalents 22,415.5
Banks 87,814.0 44.3% Total 22,415.5
Total Debt 125,275.6 63.1% S-T Debt 17,294.7
Shareholders' Equity 73,121.2 36.9% Surplus/(Defici t) 5 ,120.8
Total Capi tal i zation 198,396.8 100.0%
Market Cap. As on 5/17/2016 41,453.0
Adjusted Net Debt 102,860.1
Enterprise Value 144,313.1
EV/LTM EBITDA 6.98x
*Adjusted numbers add government securities with maturities of +90 days to cash
Debt maturi ty profi le , USDm as of 1Q16 Equi ty Value
Petroleo Brasileiro SA
Liqu idi ty Petrobras 1Q16 rev enue breakdow nCapital Structure 1Q16 (USDm)
E&P
26%
Supply
43%
Gas & Power
& BioFuel
8%
Distrib.
23%
4,40912,734 11,346
16,12122,612
61,057
2015 2016 2017 2018 2019 2020+
Source: Deutsche Bank, Company Data.
20 May 2016
HY Corporate Credit,Energy,Commodities,Energy
Petroleo Brasileiro S.A.
Page 18 Deutsche Bank Securities Inc.

20 May 2016
HY Corporate Credit,Energy,Commodities,Energy
Petroleo Brasileiro S.A.
Deutsche Bank Securities Inc. Page 19
Appendix 1
Important Disclosures
Additional information available upon request
Disclosure checklist
Institution Disclosure
Petrobras
Petroleo Brasileiro S.A. 5.625% 2043 1,8,14,15
Petroleo Brasileiro S.A. 4.375% 2023 1,8,14,15
Petroleo Brasileiro S.A. 3.25% 2017 1,8,14,15
Petroleo Brasileiro S.A. 6.25% 2024 1,8,14,15
Petroleo Brasileiro S.A. 6.85% 2115 1,8,14,15
Petroleo Brasileiro S.A. 4.875% 2020 1,8,14,15
Petroleo Brasileiro S.A. 3% 2019 1,8,14,15
Petroleo Brasileiro S.A. 7.25% 2044 1,8,14,15
Petroleo Brasileiro S.A. 7.875% 2019 1,8,14,15
Petroleo Brasileiro S.A. 5.875% 2018 1,8,14,15
Petroleo Brasileiro S.A. 5.75% 2020 1,8,14,15
Petroleo Brasileiro S.A. 6.75% 2041 1,8,14,15
PETBRA 8.375% '21 1,8,14,15
Petroleo Brasileiro S.A. 6.875% 2040 1,8,14,15
PETBRA 8.750% '26 1,8,14,15
Petroleo Brasileiro S.A. 3.5% 2017 1,8,14,15
Petroleo Brasileiro S.A. 5.375% 2021 1,8,14,15 *Prices are current as of the end of the previous trading session unless otherwise indicated and are sourced from local exchanges via Reuters, Bloomberg and other vendors . Other information is sourced from Deutsche Bank, subject companies, and other sources. For disclosures pertaining to recommendations or estimates made on securities other than the primary subject of this research, please see the most recently published company report or visit our global disclosure look-up page on our website at http://gm.db.com/ger/disclosure/DisclosureDirectory.eqsr.
Important Disclosures Required by U.S. Regulators
Disclosures marked with an asterisk may also be required by at least one jurisdiction in addition to the United States. See Important Disclosures Required by Non-US Regulators and Explanatory Notes.
1. Within the past year, Deutsche Bank and/or its affiliate(s) has managed or co-managed a public or private offering for this company, for which it received fees.
8. Deutsche Bank and/or its affiliate(s) expects to receive, or intends to seek, compensation for investment banking services from this company in the next three months.
14. Deutsche Bank and/or its affiliate(s) has received non-investment banking related compensation from this company within the past year.
15. This company has been a client of Deutsche Bank Securities Inc. within the past year, during which time it received non-investment banking securities-related services.

20 May 2016
HY Corporate Credit,Energy,Commodities,Energy
Petroleo Brasileiro S.A.
Page 20 Deutsche Bank Securities Inc.
Important Disclosures Required by Non-U.S. Regulators
Please also refer to disclosures in the Important Disclosures Required by US Regulators and the Explanatory Notes.
1. Within the past year, Deutsche Bank and/or its affiliate(s) has managed or co-managed a public or private offering for this company, for which it received fees.
For disclosures pertaining to recommendations or estimates made on a security mentioned in this report, please see the most recently published company report or visit our global disclosure look-up page on our website at http://gm.db.com/ger/disclosure/DisclosureDirectory.eqsr
Analyst Certification
The views expressed in this report accurately reflect the personal views of the undersigned lead analyst(s) about the subject issuer and the securities of the issuer. In addition, the undersigned lead analyst(s) has not and will not receive any compensation for providing a specific recommendation or view in this report. Eduardo Vieira
Deutsche Bank debt rating key Bond rating dispersion and banking relationships
Buy: These bonds are expected to outperform other issues in the sector/industry group over the next three to six-month period.
Hold: These bonds are fairly valued currently. If owned, no need to sell, but we await events/ releases/ conditions that would make the bond attractive enough for us to upgrade. In the interim, the bond will likely perform as well as the average issue in the sector/industry group.
Sell: There exists a significant likelihood that these bonds will underperform relative to other issues in their sector/industry group, at least over the next three months.
63 %
38 %
0 %
100 %
100 %
0
1
2
3
4
5
6
Buy Hold Sell
Global Universe
Companies Covered Cos. w/ Banking Relationship
(a) Regulatory Disclosures
(b) 1.Important Additional Conflict Disclosures
Aside from within this report, important conflict disclosures can also be found at https://gm.db.com/equities under the "Disclosures Lookup" and "Legal" tabs. Investors are strongly encouraged to review this information before investing.
(c) 2.Short-Term Trade Ideas
Deutsche Bank equity research analysts sometimes have shorter-term trade ideas (known as SOLAR ideas) that are consistent or inconsistent with Deutsche Bank's existing longer term ratings. These trade ideas can be found at the SOLAR link at http://gm.db.com.
20 May 2016
HY Corporate Credit,Energy,Commodities,Energy
Petroleo Brasileiro S.A.
Deutsche Bank Securities Inc. Page 21
(d) Additional Information
The information and opinions in this report were prepared by Deutsche Bank AG or one of its affiliates (collectively
"Deutsche Bank"). Though the information herein is believed to be reliable and has been obtained from public sources
believed to be reliable, Deutsche Bank makes no representation as to its accuracy or completeness.
If you use the services of Deutsche Bank in connection with a purchase or sale of a security that is discussed in this
report, or is included or discussed in another communication (oral or written) from a Deutsche Bank analyst, Deutsche
Bank may act as principal for its own account or as agent for another person.
Deutsche Bank may consider this report in deciding to trade as principal. It may also engage in transactions, for its own
account or with customers, in a manner inconsistent with the views taken in this research report. Others within
Deutsche Bank, including strategists, sales staff and other analysts, may take views that are inconsistent with those
taken in this research report. Deutsche Bank issues a variety of research products, including fundamental analysis,
equity-linked analysis, quantitative analysis and trade ideas. Recommendations contained in one type of communication
may differ from recommendations contained in others, whether as a result of differing time horizons, methodologies or
otherwise. Deutsche Bank and/or its affiliates may also be holding debt securities of the issuers it writes on.
Analysts are paid in part based on the profitability of Deutsche Bank AG and its affiliates, which includes investment
banking revenues.
Opinions, estimates and projections constitute the current judgment of the author as of the date of this report. They do
not necessarily reflect the opinions of Deutsche Bank and are subject to change without notice. Deutsche Bank has no
obligation to update, modify or amend this report or to otherwise notify a recipient thereof if any opinion, forecast or
estimate contained herein changes or subsequently becomes inaccurate. This report is provided for informational
purposes only. It is not an offer or a solicitation of an offer to buy or sell any financial instruments or to participate in any
particular trading strategy. Target prices are inherently imprecise and a product of the analyst’s judgment. The financial
instruments discussed in this report may not be suitable for all investors and investors must make their own informed
investment decisions. Prices and availability of financial instruments are subject to change without notice and
investment transactions can lead to losses as a result of price fluctuations and other factors. If a financial instrument is
denominated in a currency other than an investor's currency, a change in exchange rates may adversely affect the
investment. Past performance is not necessarily indicative of future results. Unless otherwise indicated, prices are
current as of the end of the previous trading session, and are sourced from local exchanges via Reuters, Bloomberg and
other vendors. Data is sourced from Deutsche Bank, subject companies, and in some cases, other parties.
Macroeconomic fluctuations often account for most of the risks associated with exposures to instruments that promise
to pay fixed or variable interest rates. For an investor who is long fixed rate instruments (thus receiving these cash
flows), increases in interest rates naturally lift the discount factors applied to the expected cash flows and thus cause a
loss. The longer the maturity of a certain cash flow and the higher the move in the discount factor, the higher will be the
loss. Upside surprises in inflation, fiscal funding needs, and FX depreciation rates are among the most common adverse
macroeconomic shocks to receivers. But counterparty exposure, issuer creditworthiness, client segmentation, regulation
(including changes in assets holding limits for different types of investors), changes in tax policies, currency
convertibility (which may constrain currency conversion, repatriation of profits and/or the liquidation of positions), and
settlement issues related to local clearing houses are also important risk factors to be considered. The sensitivity of fixed
income instruments to macroeconomic shocks may be mitigated by indexing the contracted cash flows to inflation, to
FX depreciation, or to specified interest rates – these are common in emerging markets. It is important to note that the
index fixings may -- by construction -- lag or mis-measure the actual move in the underlying variables they are intended
to track. The choice of the proper fixing (or metric) is particularly important in swaps markets, where floating coupon
rates (i.e., coupons indexed to a typically short-dated interest rate reference index) are exchanged for fixed coupons. It is
also important to acknowledge that funding in a currency that differs from the currency in which coupons are
denominated carries FX risk. Naturally, options on swaps (swaptions) also bear the risks typical to options in addition to
the risks related to rates movements.

20 May 2016
HY Corporate Credit,Energy,Commodities,Energy
Petroleo Brasileiro S.A.
Page 22 Deutsche Bank Securities Inc.
Derivative transactions involve numerous risks including, among others, market, counterparty default and illiquidity risk.
The appropriateness or otherwise of these products for use by investors is dependent on the investors' own
circumstances including their tax position, their regulatory environment and the nature of their other assets and
liabilities, and as such, investors should take expert legal and financial advice before entering into any transaction similar
to or inspired by the contents of this publication. The risk of loss in futures trading and options, foreign or domestic, can
be substantial. As a result of the high degree of leverage obtainable in futures and options trading, losses may be
incurred that are greater than the amount of funds initially deposited. Trading in options involves risk and is not suitable
for all investors. Prior to buying or selling an option investors must review the "Characteristics and Risks of Standardized
Options”, at http://www.optionsclearing.com/about/publications/character-risks.jsp. If you are unable to access the
website please contact your Deutsche Bank representative for a copy of this important document.
Participants in foreign exchange transactions may incur risks arising from several factors, including the following: ( i)
exchange rates can be volatile and are subject to large fluctuations; ( ii) the value of currencies may be affected by
numerous market factors, including world and national economic, political and regulatory events, events in equity and
debt markets and changes in interest rates; and (iii) currencies may be subject to devaluation or government imposed
exchange controls which could affect the value of the currency. Investors in securities such as ADRs, whose values are
affected by the currency of an underlying security, effectively assume currency risk.
Unless governing law provides otherwise, all transactions should be executed through the Deutsche Bank entity in the
investor's home jurisdiction.
United States: Approved and/or distributed by Deutsche Bank Securities Incorporated, a member of FINRA, NFA and
SIPC. Analysts employed by non-US affiliates may not be associated persons of Deutsche Bank Securities Incorporated
and therefore not subject to FINRA regulations concerning communications with subject companies, public appearances
and securities held by analysts.
Germany: Approved and/or distributed by Deutsche Bank AG, a joint stock corporation with limited liability incorporated
in the Federal Republic of Germany with its principal office in Frankfurt am Main. Deutsche Bank AG is authorized under
German Banking Law and is subject to supervision by the European Central Bank and by BaFin, Germany’s Federal
Financial Supervisory Authority.
United Kingdom: Approved and/or distributed by Deutsche Bank AG acting through its London Branch at Winchester
House, 1 Great Winchester Street, London EC2N 2DB. Deutsche Bank AG in the United Kingdom is authorised by the
Prudential Regulation Authority and is subject to limited regulation by the Prudential Regulation Authority and Financial
Conduct Authority. Details about the extent of our authorisation and regulation are available on request.
Hong Kong: Distributed by Deutsche Bank AG, Hong Kong Branch.
India: Prepared by Deutsche Equities India Pvt Ltd, which is registered by the Securities and Exchange Board of India
(SEBI) as a stock broker. Research Analyst SEBI Registration Number is INH000001741. DEIPL may have received
administrative warnings from the SEBI for breaches of Indian regulations.
Japan: Approved and/or distributed by Deutsche Securities Inc.(DSI). Registration number - Registered as a financial
instruments dealer by the Head of the Kanto Local Finance Bureau (Kinsho) No. 117. Member of associations: JSDA,
Type II Financial Instruments Firms Association and The Financial Futures Association of Japan. Commissions and risks
involved in stock transactions - for stock transactions, we charge stock commissions and consumption tax by
multiplying the transaction amount by the commission rate agreed with each customer. Stock transactions can lead to
losses as a result of share price fluctuations and other factors. Transactions in foreign stocks can lead to additional
losses stemming from foreign exchange fluctuations. We may also charge commissions and fees for certain categories
of investment advice, products and services. Recommended investment strategies, products and services carry the risk
of losses to principal and other losses as a result of changes in market and/or economic trends, and/or fluctuations in
market value. Before deciding on the purchase of financial products and/or services, customers should carefully read the
relevant disclosures, prospectuses and other documentation. "Moody's", "Standard & Poor's", and "Fitch" mentioned in
this report are not registered credit rating agencies in Japan unless Japan or "Nippon" is specifically designated in the
name of the entity. Reports on Japanese listed companies not written by analysts of DSI are written by Deutsche Bank

20 May 2016
HY Corporate Credit,Energy,Commodities,Energy
Petroleo Brasileiro S.A.
Deutsche Bank Securities Inc. Page 23
Group's analysts with the coverage companies specified by DSI. Some of the foreign securities stated on this report are
not disclosed according to the Financial Instruments and Exchange Law of Japan.
Korea: Distributed by Deutsche Securities Korea Co.
South Africa: Deutsche Bank AG Johannesburg is incorporated in the Federal Republic of Germany (Branch Register
Number in South Africa: 1998/003298/10).
Singapore: by Deutsche Bank AG, Singapore Branch or Deutsche Securities Asia Limited, Singapore Branch (One Raffles
Quay #18-00 South Tower Singapore 048583, +65 6423 8001), which may be contacted in respect of any matters
arising from, or in connection with, this report. Where this report is issued or promulgated in Singapore to a person who
is not an accredited investor, expert investor or institutional investor (as defined in the applicable Singapore laws and
regulations), they accept legal responsibility to such person for its contents.
Taiwan: Information on securities/investments that trade in Taiwan is for your reference only. Readers should
independently evaluate investment risks and are solely responsible for their investment decisions. Deutsche Bank
research may not be distributed to the Taiwan public media or quoted or used by the Taiwan public media without
written consent. Information on securities/instruments that do not trade in Taiwan is for informational purposes only and
is not to be construed as a recommendation to trade in such securities/instruments. Deutsche Securities Asia Limited,
Taipei Branch may not execute transactions for clients in these securities/instruments.
Qatar: Deutsche Bank AG in the Qatar Financial Centre (registered no. 00032) is regulated by the Qatar Financial Centre
Regulatory Authority. Deutsche Bank AG - QFC Branch may only undertake the financial services activities that fall
within the scope of its existing QFCRA license. Principal place of business in the QFC: Qatar Financial Centre, Tower,
West Bay, Level 5, PO Box 14928, Doha, Qatar. This information has been distributed by Deutsche Bank AG. Related
financial products or services are only available to Business Customers, as defined by the Qatar Financial Centre
Regulatory Authority.
Russia: This information, interpretation and opinions submitted herein are not in the context of, and do not constitute,
any appraisal or evaluation activity requiring a license in the Russian Federation.
Kingdom of Saudi Arabia: Deutsche Securities Saudi Arabia LLC Company, (registered no. 07073-37) is regulated by the
Capital Market Authority. Deutsche Securities Saudi Arabia may only undertake the financial services activities that fall
within the scope of its existing CMA license. Principal place of business in Saudi Arabia: King Fahad Road, Al Olaya
District, P.O. Box 301809, Faisaliah Tower - 17th Floor, 11372 Riyadh, Saudi Arabia.
United Arab Emirates: Deutsche Bank AG in the Dubai International Financial Centre (registered no. 00045) is regulated
by the Dubai Financial Services Authority. Deutsche Bank AG - DIFC Branch may only undertake the financial services
activities that fall within the scope of its existing DFSA license. Principal place of business in the DIFC: Dubai
International Financial Centre, The Gate Village, Building 5, PO Box 504902, Dubai, U.A.E. This information has been
distributed by Deutsche Bank AG. Related financial products or services are only available to Professional Clients, as
defined by the Dubai Financial Services Authority.
Australia: Retail clients should obtain a copy of a Product Disclosure Statement (PDS) relating to any financial product
referred to in this report and consider the PDS before making any decision about whether to acquire the product. Please
refer to Australian specific research disclosures and related information at
https://australia.db.com/australia/content/research-information.html
Australia and New Zealand: This research, and any access to it, is intended only for "wholesale clients" within the
meaning of the Australian Corporations Act and New Zealand Financial Advisors Act respectively.
Additional information relative to securities, other financial products or issuers discussed in this report is available upon
request. This report may not be reproduced, distributed or published without Deutsche Bank's prior written consent.
Copyright © 2016 Deutsche Bank AG

David Folkerts-Landau Chief Economist and Global Head of Research
Raj Hindocha Global Chief Operating Officer
Research
Marcel Cassard Global Head
FICC Research & Global Macro Economics
Steve Pollard Global Head
Equity Research
Michael Spencer Regional Head
Asia Pacific Research
Ralf Hoffmann Regional Head
Deutsche Bank Research, Germany
Andreas Neubauer Regional Head
Equity Research, Germany
International Locations
Deutsche Bank AG
Deutsche Bank Place
Level 16
Corner of Hunter & Phillip Streets
Sydney, NSW 2000
Australia
Tel: (61) 2 8258 1234
Deutsche Bank AG
Große Gallusstraße 10-14
60272 Frankfurt am Main
Germany
Tel: (49) 69 910 00
Deutsche Bank AG
Filiale Hongkong
International Commerce Centre,
1 Austin Road West,Kowloon,
Hong Kong
Tel: (852) 2203 8888
Deutsche Securities Inc.
2-11-1 Nagatacho
Sanno Park Tower
Chiyoda-ku, Tokyo 100-6171
Japan
Tel: (81) 3 5156 6770
Deutsche Bank AG London
1 Great Winchester Street
London EC2N 2EQ
United Kingdom
Tel: (44) 20 7545 8000
Deutsche Bank Securities Inc.
60 Wall Street
New York, NY 10005
United States of America
Tel: (1) 212 250 2500