comparing a single-sensor camera with a multisensor …
TRANSCRIPT
Engenharia Agrícola
ISSN: 1809-4430 (on-line)
www.engenhariaagricola.org.br
1 Universidade Federal de Viçosa/ Departamento de Engenharia Agrícola/ Viçosa - MG, Brasil. 2 Universidade de São Paulo/ Escola Superior de Agricultura “Luiz de Queiroz”/ Departamento de Solos e Nutrição de Plantas/ Piracicaba - SP, Brasil.
Area Editor: Lucas Rios do Amaral
Received in: 5-28-2020
Accepted in: 11-16-2020 Engenharia Agrícola, Jaboticabal, v.41, n.1, p.87-97, jan./feb. 2021
Edited by SBEA
Doi: http://dx.doi.org/10.1590/1809-4430-Eng.Agric.v41n1p87-97/2021
COMPARING A SINGLE-SENSOR CAMERA WITH A MULTISENSOR CAMERA FOR
MONITORING COFFEE CROP USING UNMANNED AERIAL VEHICLES
Amanda P. A. Gomes1*, Daniel M. de Queiroz1, Domingos S. M. Valente1,
Francisco de A. de C. Pinto1, Jorge T. F. Rosas2
1*Corresponding author. Universidade Federal de Viçosa/ Departamento de Engenharia Agrícola/ Viçosa - MG, Brasil.
E-mail: [email protected] | ORCID ID: https://orcid.org/0000-0002-8912-2690
KEYWORDS
precision agriculture,
UAV, radiometric
calibration, modified
RGB camera.
ABSTRACT
There exist two options for digital cameras that can capture the near-infrared (NIR) band.
Conventional red–green–blue (RGB, visible bands) cameras with a single sensor provide
NIR band visibility based on the removal of the internal NIR-blocking filter.
Alternatively, multisensor cameras exist that have a specific sensor for each band. The
modified RGB cameras are of a lower price. In this context, the objective of this study
was to compare the performance of a modified RGB camera with that of a multisensor
camera for obtaining the normalized difference vegetation index (NDVI) in an area with
coffee cultivations. A multispectral camera with five sensors and another camera with
only one sensor were used. The NDVI of the coffee field was also measured using the
GreenSeeker handheld NDVI sensor manufactured by Trimble. The images were
calibrated radiometrically based on the targets in shades of gray made of napa, and the
NDVI was calculated after image calibration. The calibration curves showed a high
coefficient of determination. The NDVI value obtained with the calibrated images from
the cameras showed a significant correlation with the values obtained by the GreenSeeker
NDVI sensor, making it possible to obtain the variability pattern of the vegetation index.
However, the NDVI obtained using the multisensor camera was closer to the NDVI
obtained by the GreenSeeker NDVI sensor.
INTRODUCTION
The increase in coffee consumption around the
world has made the importance of this crop even greater.
Brazil is the largest coffee producing and exporting country
(International Coffee Organization, 2019). However,
because of international competition, it is necessary to
develop strategies that can positively influence coffee
production and quality. One of the alternatives to improve
the efficiency of coffee production systems is the adoption
of precision agriculture by coffee growers. The correct
prescription and efficient use of agricultural inputs can be
an alternative to meet the growing food demand and
requirements for environmental sustainability. This can be
achieved by applying inputs in variable dosages according
to the spatial variability of the attributes associated with soil
and plants (Mulla, 2013; Murugan et al., 2017).
To monitor the production fields so that they can be
treated in a spatial variable fashion, remote sensing (RS) can
be used. However, few studies have applied RS to coffee
cultivation because of the difficulties imposed by this crop.
The architecture and biomass of the trees cause some
vegetation indices to lose sensitivity in the perception of
chlorophyll (Manzano et al., 2019). The results obtained are
better when working with images with higher spatial
resolutions (Bernardes et al., 2012). The application of RS
in areas with mountainous relief is more difficult because of
the interaction of electromagnetic radiation with the relief.
To monitor a crop and detect the spatial variability of
production factors in a coffee field, multispectral images
can be used. Multispectral images can be obtained using
sensors coupled to aerial or orbital platforms. Satellite
images are widely used for crop monitoring; however, their
Amanda P. A. Gomes, Daniel M. de Queiroz, Domingos S. M. Valente, et al. 88
Engenharia Agrícola, Jaboticabal, v.41, n.1, p.87-97, jan./feb. 2021
use depends on the temporal resolution, spatial resolution,
and spectral resolution of the sensor (Corti et al., 2019).
The use of unmanned aerial vehicles (UAVs) for
agricultural purposes is growing. One of their advantages is
the flexibility in scheduling data collection, because it
depends only on the availability of the operator and
environmental conditions. These devices are equipped with
multispectral digital cameras that are characterized by the
ability to obtain images with high temporal and spatial
resolutions. The cameras are coupled to the UAVs and used
to obtain periodic crop spectral information. Information on
the development of vegetation from images is generally
based on indices that compare the reflectance of vegetation
in more than one spectral band (Nijland et al., 2014). The
most common indices use the difference in the reflectance
of the targets between the near-infrared (NIR) and red (R)
bands or other bands of the spectrum (Hunt et al., 2011;
Nijland et al., 2014), as is the case of the normalized
difference vegetation index (NDVI), which is applied when
investigating the vigor status of the crop.
Commercial cameras generally work in the visible
band, and sensors that can acquire NIR image data tend to be
more expensive, because of which these are not adopted
extensively (Hunt et al., 2011; Logie & Coburn, 2018). Some
of these cameras are modified by the application of filters to
acquire data in specific bands, such as the NIR band. The
modification of red–green–blue (RGB) cameras involves
removing the NIR blocking filter (Hunt et al. 2010;
Lebourgeois et al., 2008). However, sensors to assess the
condition of vegetation must undergo a calibration whereby the
radiometric behavior of each pixel is analyzed in the different
regions of the spectrum where the information was recorded
(Corti et al., 2019; Pozo et al., 2014; Putra & Soni, 2017). This
process depends on the characteristics of the sensor and
climatic conditions, including the variation of ambient light
(Wang & Myint, 2015). Thus, radiometric calibration is
essential when working with multispectral images.
However, the price of multispectral cameras is one
of the limiting factors for their use in agriculture. Their
prices rise with the increase in the number of spectral bands
and with an increase in spatial resolution. The number of
bands that the camera collects determines which and how
many vegetation indices can be obtained. Therefore, the
objective of this study was to compare the performance of a
single-sensor camera with that of a multisensor camera in
obtaining the NDVI in areas cultivated with coffee in a
mountainous region.
MATERIAL AND METHODS
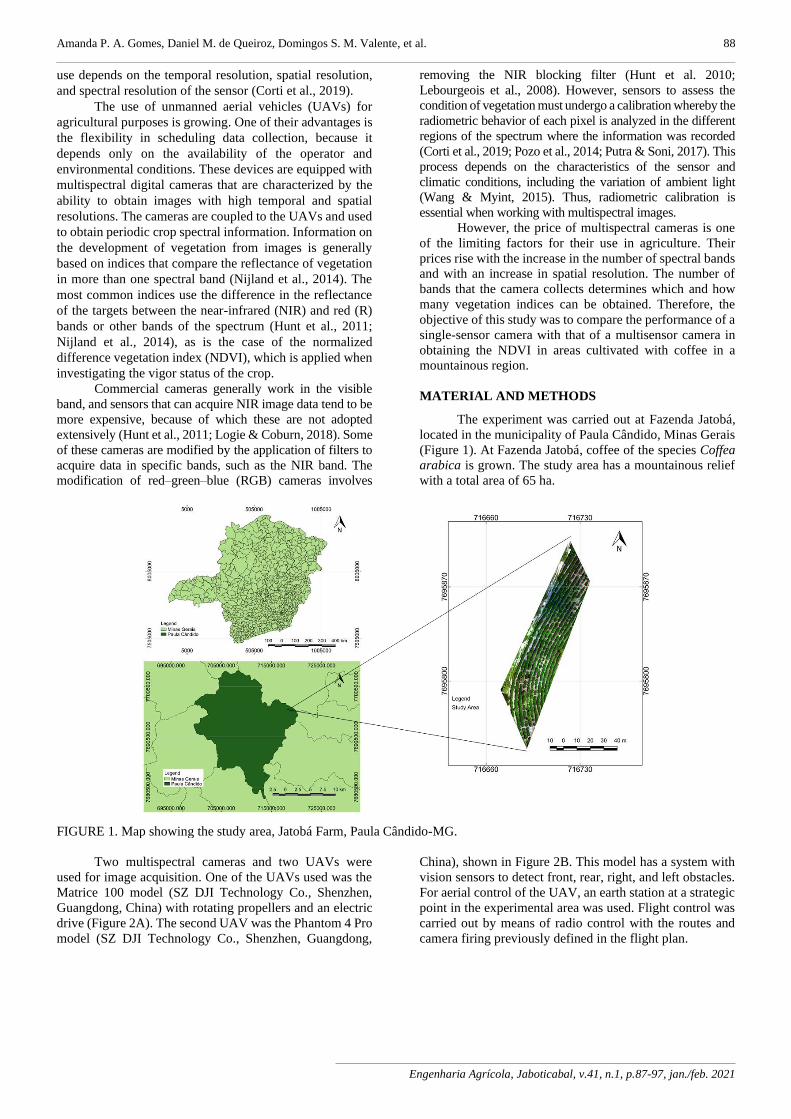
The experiment was carried out at Fazenda Jatobá,
located in the municipality of Paula Cândido, Minas Gerais
(Figure 1). At Fazenda Jatobá, coffee of the species Coffea
arabica is grown. The study area has a mountainous relief
with a total area of 65 ha.
FIGURE 1. Map showing the study area, Jatobá Farm, Paula Cândido-MG.
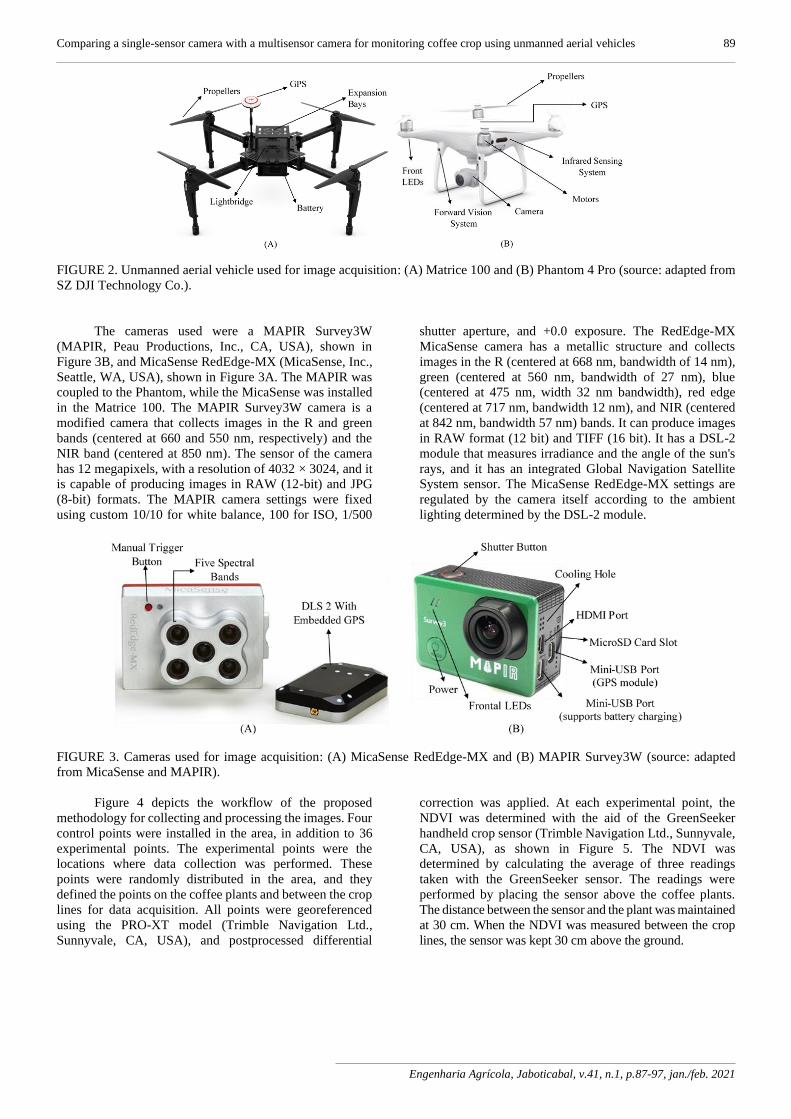
Two multispectral cameras and two UAVs were
used for image acquisition. One of the UAVs used was the
Matrice 100 model (SZ DJI Technology Co., Shenzhen,
Guangdong, China) with rotating propellers and an electric
drive (Figure 2A). The second UAV was the Phantom 4 Pro
model (SZ DJI Technology Co., Shenzhen, Guangdong,
China), shown in Figure 2B. This model has a system with
vision sensors to detect front, rear, right, and left obstacles.
For aerial control of the UAV, an earth station at a strategic
point in the experimental area was used. Flight control was
carried out by means of radio control with the routes and
camera firing previously defined in the flight plan.
Comparing a single-sensor camera with a multisensor camera for monitoring coffee crop using unmanned aerial vehicles 89
Engenharia Agrícola, Jaboticabal, v.41, n.1, p.87-97, jan./feb. 2021
FIGURE 2. Unmanned aerial vehicle used for image acquisition: (A) Matrice 100 and (B) Phantom 4 Pro (source: adapted from
SZ DJI Technology Co.).
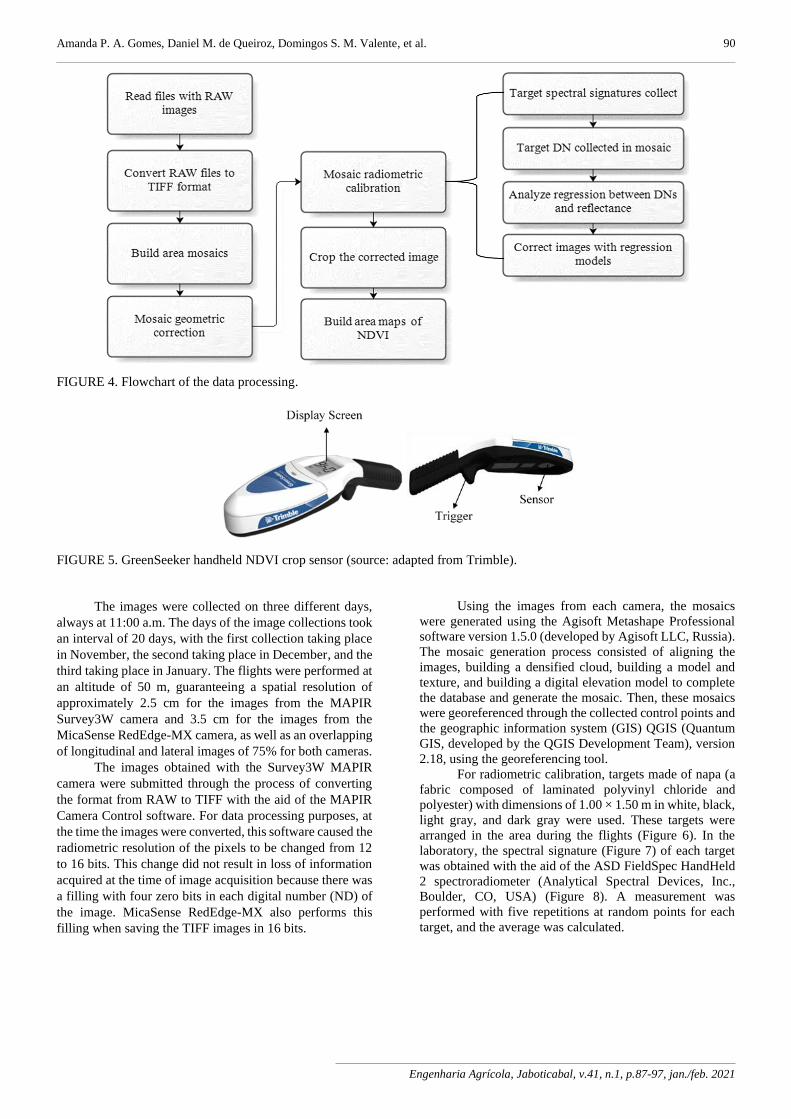
The cameras used were a MAPIR Survey3W
(MAPIR, Peau Productions, Inc., CA, USA), shown in
Figure 3B, and MicaSense RedEdge-MX (MicaSense, Inc.,
Seattle, WA, USA), shown in Figure 3A. The MAPIR was
coupled to the Phantom, while the MicaSense was installed
in the Matrice 100. The MAPIR Survey3W camera is a
modified camera that collects images in the R and green
bands (centered at 660 and 550 nm, respectively) and the
NIR band (centered at 850 nm). The sensor of the camera
has 12 megapixels, with a resolution of 4032 × 3024, and it
is capable of producing images in RAW (12-bit) and JPG
(8-bit) formats. The MAPIR camera settings were fixed
using custom 10/10 for white balance, 100 for ISO, 1/500
shutter aperture, and +0.0 exposure. The RedEdge-MX
MicaSense camera has a metallic structure and collects
images in the R (centered at 668 nm, bandwidth of 14 nm),
green (centered at 560 nm, bandwidth of 27 nm), blue
(centered at 475 nm, width 32 nm bandwidth), red edge
(centered at 717 nm, bandwidth 12 nm), and NIR (centered
at 842 nm, bandwidth 57 nm) bands. It can produce images
in RAW format (12 bit) and TIFF (16 bit). It has a DSL-2
module that measures irradiance and the angle of the sun's
rays, and it has an integrated Global Navigation Satellite
System sensor. The MicaSense RedEdge-MX settings are
regulated by the camera itself according to the ambient
lighting determined by the DSL-2 module.
FIGURE 3. Cameras used for image acquisition: (A) MicaSense RedEdge-MX and (B) MAPIR Survey3W (source: adapted
from MicaSense and MAPIR).
Figure 4 depicts the workflow of the proposed
methodology for collecting and processing the images. Four
control points were installed in the area, in addition to 36
experimental points. The experimental points were the
locations where data collection was performed. These
points were randomly distributed in the area, and they
defined the points on the coffee plants and between the crop
lines for data acquisition. All points were georeferenced
using the PRO-XT model (Trimble Navigation Ltd.,
Sunnyvale, CA, USA), and postprocessed differential
correction was applied. At each experimental point, the
NDVI was determined with the aid of the GreenSeeker
handheld crop sensor (Trimble Navigation Ltd., Sunnyvale,
CA, USA), as shown in Figure 5. The NDVI was
determined by calculating the average of three readings
taken with the GreenSeeker sensor. The readings were
performed by placing the sensor above the coffee plants.
The distance between the sensor and the plant was maintained
at 30 cm. When the NDVI was measured between the crop
lines, the sensor was kept 30 cm above the ground.
Amanda P. A. Gomes, Daniel M. de Queiroz, Domingos S. M. Valente, et al. 90
Engenharia Agrícola, Jaboticabal, v.41, n.1, p.87-97, jan./feb. 2021
FIGURE 4. Flowchart of the data processing.
FIGURE 5. GreenSeeker handheld NDVI crop sensor (source: adapted from Trimble).
The images were collected on three different days,
always at 11:00 a.m. The days of the image collections took
an interval of 20 days, with the first collection taking place
in November, the second taking place in December, and the
third taking place in January. The flights were performed at
an altitude of 50 m, guaranteeing a spatial resolution of
approximately 2.5 cm for the images from the MAPIR
Survey3W camera and 3.5 cm for the images from the
MicaSense RedEdge-MX camera, as well as an overlapping
of longitudinal and lateral images of 75% for both cameras.
The images obtained with the Survey3W MAPIR
camera were submitted through the process of converting
the format from RAW to TIFF with the aid of the MAPIR
Camera Control software. For data processing purposes, at
the time the images were converted, this software caused the
radiometric resolution of the pixels to be changed from 12
to 16 bits. This change did not result in loss of information
acquired at the time of image acquisition because there was
a filling with four zero bits in each digital number (ND) of
the image. MicaSense RedEdge-MX also performs this
filling when saving the TIFF images in 16 bits.
Using the images from each camera, the mosaics
were generated using the Agisoft Metashape Professional
software version 1.5.0 (developed by Agisoft LLC, Russia).
The mosaic generation process consisted of aligning the
images, building a densified cloud, building a model and
texture, and building a digital elevation model to complete
the database and generate the mosaic. Then, these mosaics
were georeferenced through the collected control points and
the geographic information system (GIS) QGIS (Quantum
GIS, developed by the QGIS Development Team), version
2.18, using the georeferencing tool.
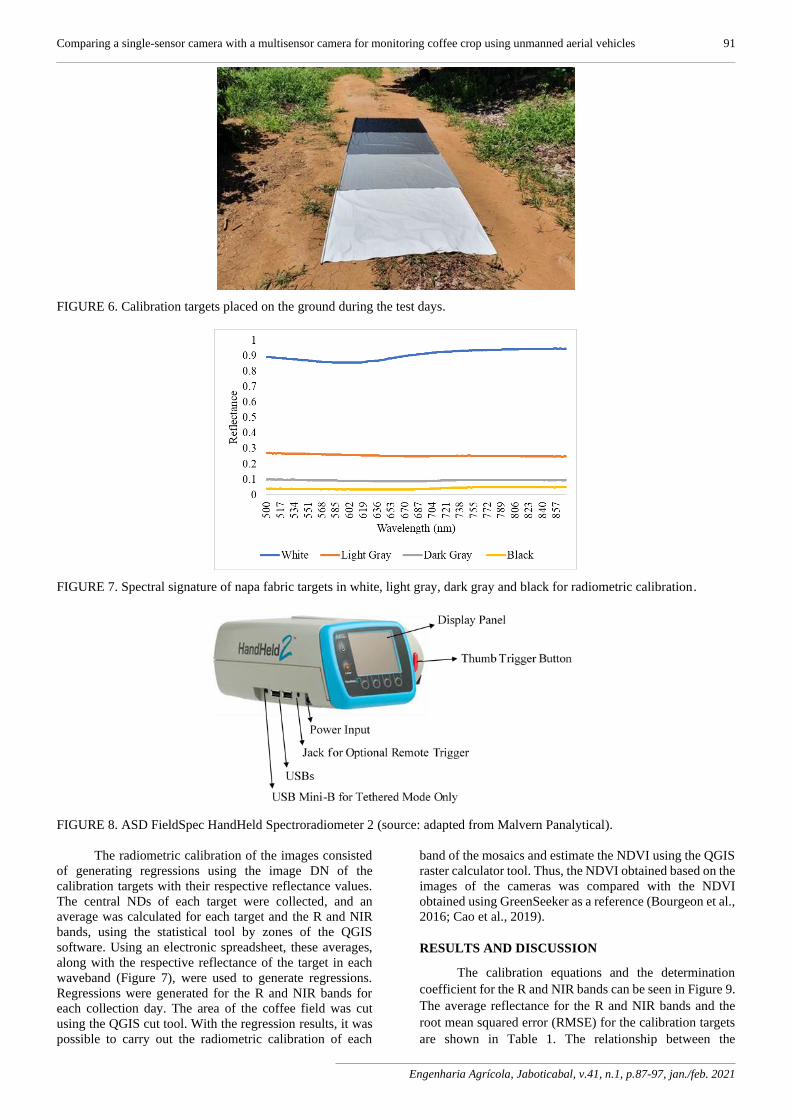
For radiometric calibration, targets made of napa (a
fabric composed of laminated polyvinyl chloride and
polyester) with dimensions of 1.00 × 1.50 m in white, black,
light gray, and dark gray were used. These targets were
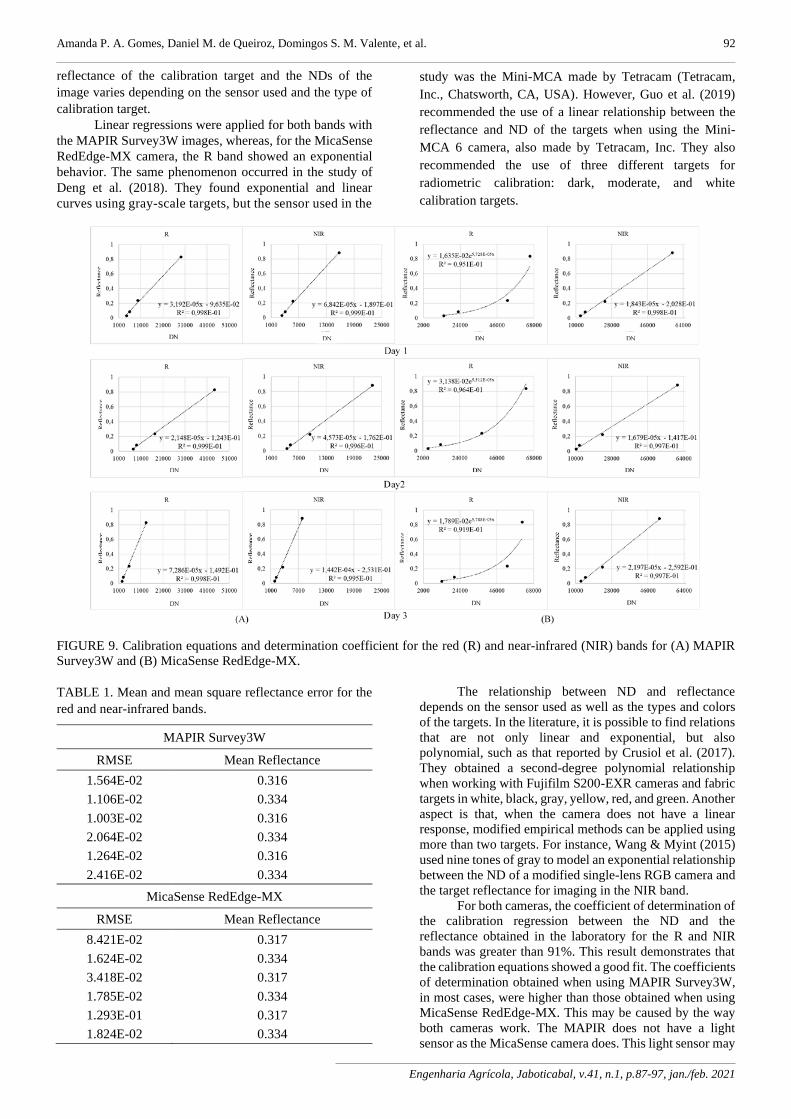
arranged in the area during the flights (Figure 6). In the
laboratory, the spectral signature (Figure 7) of each target
was obtained with the aid of the ASD FieldSpec HandHeld
2 spectroradiometer (Analytical Spectral Devices, Inc.,
Boulder, CO, USA) (Figure 8). A measurement was
performed with five repetitions at random points for each
target, and the average was calculated.
Comparing a single-sensor camera with a multisensor camera for monitoring coffee crop using unmanned aerial vehicles 91
Engenharia Agrícola, Jaboticabal, v.41, n.1, p.87-97, jan./feb. 2021
FIGURE 6. Calibration targets placed on the ground during the test days.
FIGURE 7. Spectral signature of napa fabric targets in white, light gray, dark gray and black for radiometric calibration.
FIGURE 8. ASD FieldSpec HandHeld Spectroradiometer 2 (source: adapted from Malvern Panalytical).
The radiometric calibration of the images consisted
of generating regressions using the image DN of the
calibration targets with their respective reflectance values.
The central NDs of each target were collected, and an
average was calculated for each target and the R and NIR
bands, using the statistical tool by zones of the QGIS
software. Using an electronic spreadsheet, these averages,
along with the respective reflectance of the target in each
waveband (Figure 7), were used to generate regressions.
Regressions were generated for the R and NIR bands for
each collection day. The area of the coffee field was cut
using the QGIS cut tool. With the regression results, it was
possible to carry out the radiometric calibration of each
band of the mosaics and estimate the NDVI using the QGIS
raster calculator tool. Thus, the NDVI obtained based on the
images of the cameras was compared with the NDVI
obtained using GreenSeeker as a reference (Bourgeon et al.,
2016; Cao et al., 2019).
RESULTS AND DISCUSSION
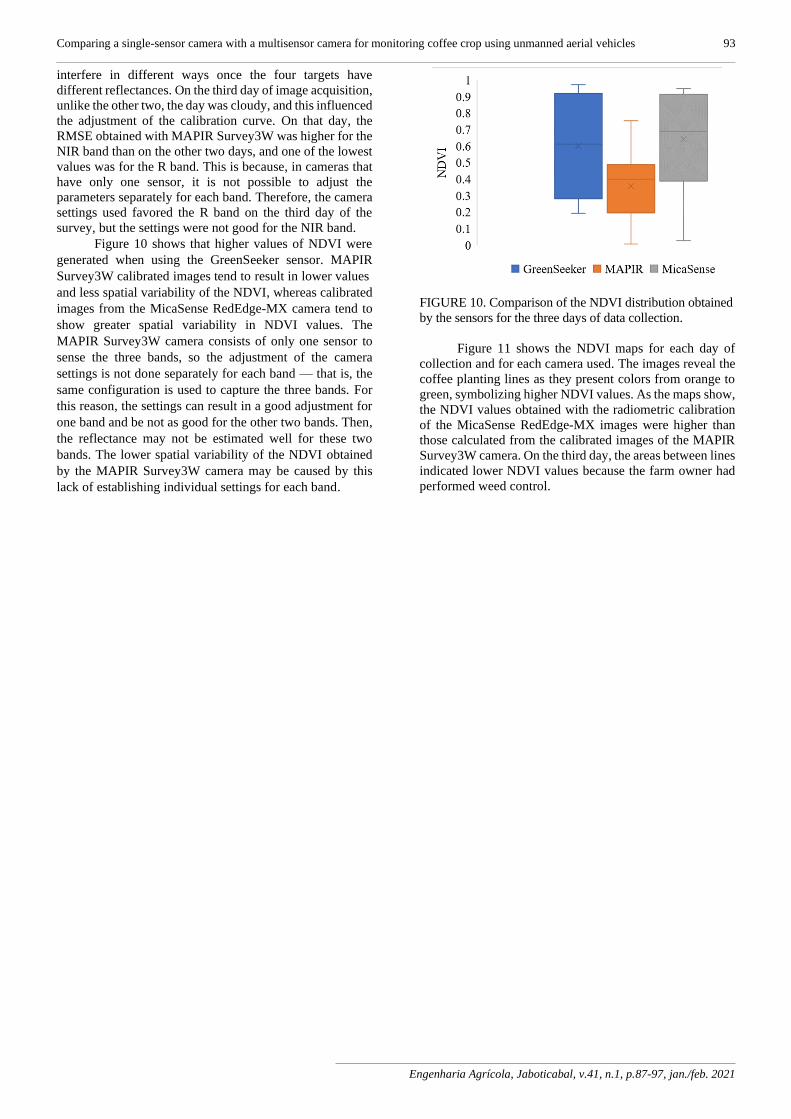
The calibration equations and the determination
coefficient for the R and NIR bands can be seen in Figure 9.
The average reflectance for the R and NIR bands and the
root mean squared error (RMSE) for the calibration targets
are shown in Table 1. The relationship between the
Amanda P. A. Gomes, Daniel M. de Queiroz, Domingos S. M. Valente, et al. 92
Engenharia Agrícola, Jaboticabal, v.41, n.1, p.87-97, jan./feb. 2021
reflectance of the calibration target and the NDs of the
image varies depending on the sensor used and the type of
calibration target.
Linear regressions were applied for both bands with
the MAPIR Survey3W images, whereas, for the MicaSense
RedEdge-MX camera, the R band showed an exponential
behavior. The same phenomenon occurred in the study of
Deng et al. (2018). They found exponential and linear
curves using gray-scale targets, but the sensor used in the
study was the Mini-MCA made by Tetracam (Tetracam,
Inc., Chatsworth, CA, USA). However, Guo et al. (2019)
recommended the use of a linear relationship between the
reflectance and ND of the targets when using the Mini-
MCA 6 camera, also made by Tetracam, Inc. They also
recommended the use of three different targets for
radiometric calibration: dark, moderate, and white
calibration targets.
FIGURE 9. Calibration equations and determination coefficient for the red (R) and near-infrared (NIR) bands for (A) MAPIR
Survey3W and (B) MicaSense RedEdge-MX.
TABLE 1. Mean and mean square reflectance error for the
red and near-infrared bands.
MAPIR Survey3W
RMSE Mean Reflectance
1.564E-02 0.316
1.106E-02 0.334
1.003E-02 0.316
2.064E-02 0.334
1.264E-02 0.316
2.416E-02 0.334
MicaSense RedEdge-MX
RMSE Mean Reflectance
8.421E-02 0.317
1.624E-02 0.334
3.418E-02 0.317
1.785E-02 0.334
1.293E-01 0.317
1.824E-02 0.334
The relationship between ND and reflectance
depends on the sensor used as well as the types and colors
of the targets. In the literature, it is possible to find relations
that are not only linear and exponential, but also
polynomial, such as that reported by Crusiol et al. (2017).
They obtained a second-degree polynomial relationship
when working with Fujifilm S200-EXR cameras and fabric
targets in white, black, gray, yellow, red, and green. Another
aspect is that, when the camera does not have a linear
response, modified empirical methods can be applied using
more than two targets. For instance, Wang & Myint (2015)
used nine tones of gray to model an exponential relationship
between the ND of a modified single-lens RGB camera and
the target reflectance for imaging in the NIR band.
For both cameras, the coefficient of determination of
the calibration regression between the ND and the
reflectance obtained in the laboratory for the R and NIR
bands was greater than 91%. This result demonstrates that
the calibration equations showed a good fit. The coefficients
of determination obtained when using MAPIR Survey3W,
in most cases, were higher than those obtained when using
MicaSense RedEdge-MX. This may be caused by the way
both cameras work. The MAPIR does not have a light
sensor as the MicaSense camera does. This light sensor may
Comparing a single-sensor camera with a multisensor camera for monitoring coffee crop using unmanned aerial vehicles 93
Engenharia Agrícola, Jaboticabal, v.41, n.1, p.87-97, jan./feb. 2021
interfere in different ways once the four targets have
different reflectances. On the third day of image acquisition,
unlike the other two, the day was cloudy, and this influenced
the adjustment of the calibration curve. On that day, the
RMSE obtained with MAPIR Survey3W was higher for the
NIR band than on the other two days, and one of the lowest
values was for the R band. This is because, in cameras that
have only one sensor, it is not possible to adjust the
parameters separately for each band. Therefore, the camera
settings used favored the R band on the third day of the
survey, but the settings were not good for the NIR band.
Figure 10 shows that higher values of NDVI were
generated when using the GreenSeeker sensor. MAPIR
Survey3W calibrated images tend to result in lower values
and less spatial variability of the NDVI, whereas calibrated
images from the MicaSense RedEdge-MX camera tend to
show greater spatial variability in NDVI values. The
MAPIR Survey3W camera consists of only one sensor to
sense the three bands, so the adjustment of the camera
settings is not done separately for each band — that is, the
same configuration is used to capture the three bands. For
this reason, the settings can result in a good adjustment for
one band and be not as good for the other two bands. Then,
the reflectance may not be estimated well for these two
bands. The lower spatial variability of the NDVI obtained
by the MAPIR Survey3W camera may be caused by this
lack of establishing individual settings for each band.
FIGURE 10. Comparison of the NDVI distribution obtained
by the sensors for the three days of data collection.
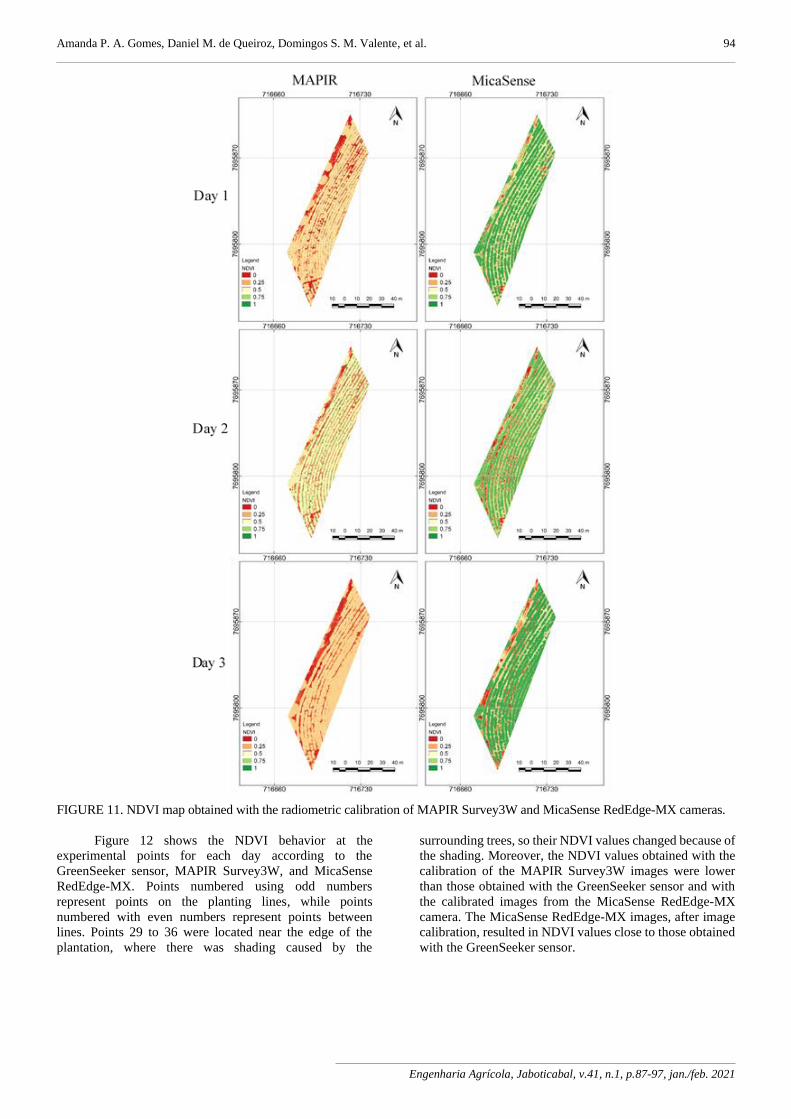
Figure 11 shows the NDVI maps for each day of
collection and for each camera used. The images reveal the
coffee planting lines as they present colors from orange to
green, symbolizing higher NDVI values. As the maps show,
the NDVI values obtained with the radiometric calibration
of the MicaSense RedEdge-MX images were higher than
those calculated from the calibrated images of the MAPIR
Survey3W camera. On the third day, the areas between lines
indicated lower NDVI values because the farm owner had
performed weed control.
Amanda P. A. Gomes, Daniel M. de Queiroz, Domingos S. M. Valente, et al. 94
Engenharia Agrícola, Jaboticabal, v.41, n.1, p.87-97, jan./feb. 2021
FIGURE 11. NDVI map obtained with the radiometric calibration of MAPIR Survey3W and MicaSense RedEdge-MX cameras.
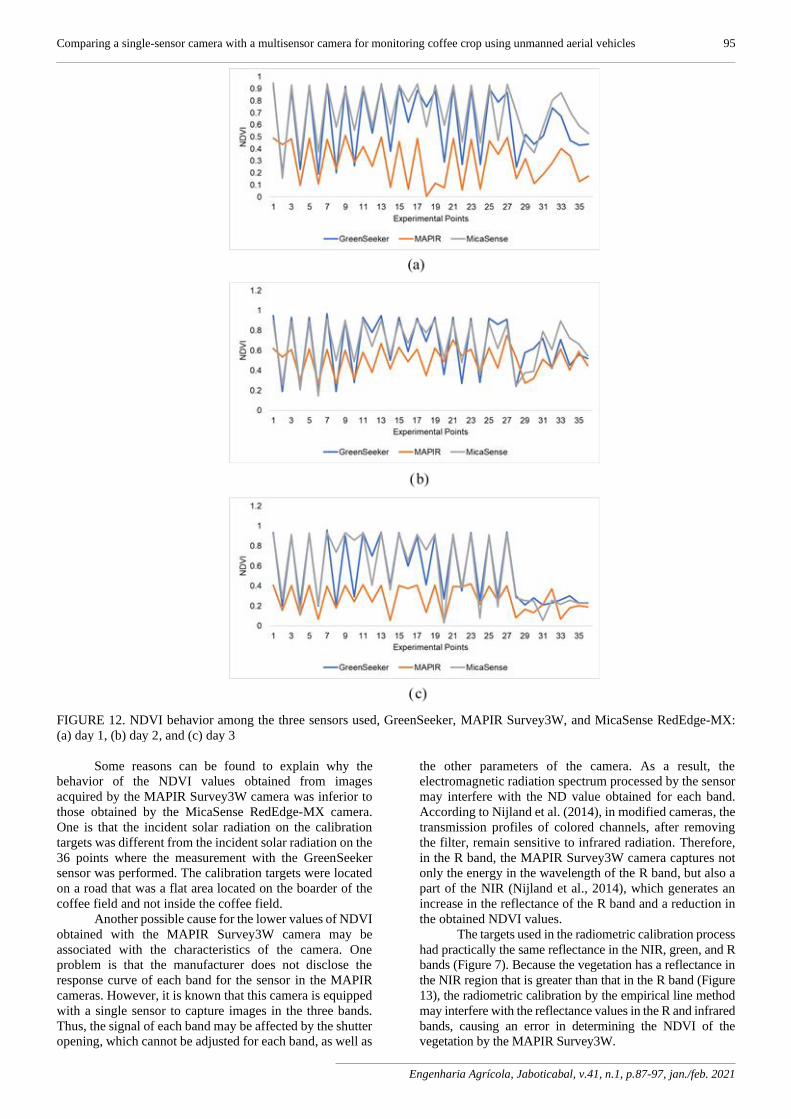
Figure 12 shows the NDVI behavior at the
experimental points for each day according to the
GreenSeeker sensor, MAPIR Survey3W, and MicaSense
RedEdge-MX. Points numbered using odd numbers
represent points on the planting lines, while points
numbered with even numbers represent points between
lines. Points 29 to 36 were located near the edge of the
plantation, where there was shading caused by the
surrounding trees, so their NDVI values changed because of
the shading. Moreover, the NDVI values obtained with the
calibration of the MAPIR Survey3W images were lower
than those obtained with the GreenSeeker sensor and with
the calibrated images from the MicaSense RedEdge-MX
camera. The MicaSense RedEdge-MX images, after image
calibration, resulted in NDVI values close to those obtained
with the GreenSeeker sensor.
Comparing a single-sensor camera with a multisensor camera for monitoring coffee crop using unmanned aerial vehicles 95
Engenharia Agrícola, Jaboticabal, v.41, n.1, p.87-97, jan./feb. 2021
FIGURE 12. NDVI behavior among the three sensors used, GreenSeeker, MAPIR Survey3W, and MicaSense RedEdge-MX:
(a) day 1, (b) day 2, and (c) day 3
Some reasons can be found to explain why the
behavior of the NDVI values obtained from images
acquired by the MAPIR Survey3W camera was inferior to
those obtained by the MicaSense RedEdge-MX camera.
One is that the incident solar radiation on the calibration
targets was different from the incident solar radiation on the
36 points where the measurement with the GreenSeeker
sensor was performed. The calibration targets were located
on a road that was a flat area located on the boarder of the
coffee field and not inside the coffee field.
Another possible cause for the lower values of NDVI
obtained with the MAPIR Survey3W camera may be
associated with the characteristics of the camera. One
problem is that the manufacturer does not disclose the
response curve of each band for the sensor in the MAPIR
cameras. However, it is known that this camera is equipped
with a single sensor to capture images in the three bands.
Thus, the signal of each band may be affected by the shutter
opening, which cannot be adjusted for each band, as well as
the other parameters of the camera. As a result, the
electromagnetic radiation spectrum processed by the sensor
may interfere with the ND value obtained for each band.
According to Nijland et al. (2014), in modified cameras, the
transmission profiles of colored channels, after removing
the filter, remain sensitive to infrared radiation. Therefore,
in the R band, the MAPIR Survey3W camera captures not
only the energy in the wavelength of the R band, but also a
part of the NIR (Nijland et al., 2014), which generates an
increase in the reflectance of the R band and a reduction in
the obtained NDVI values.
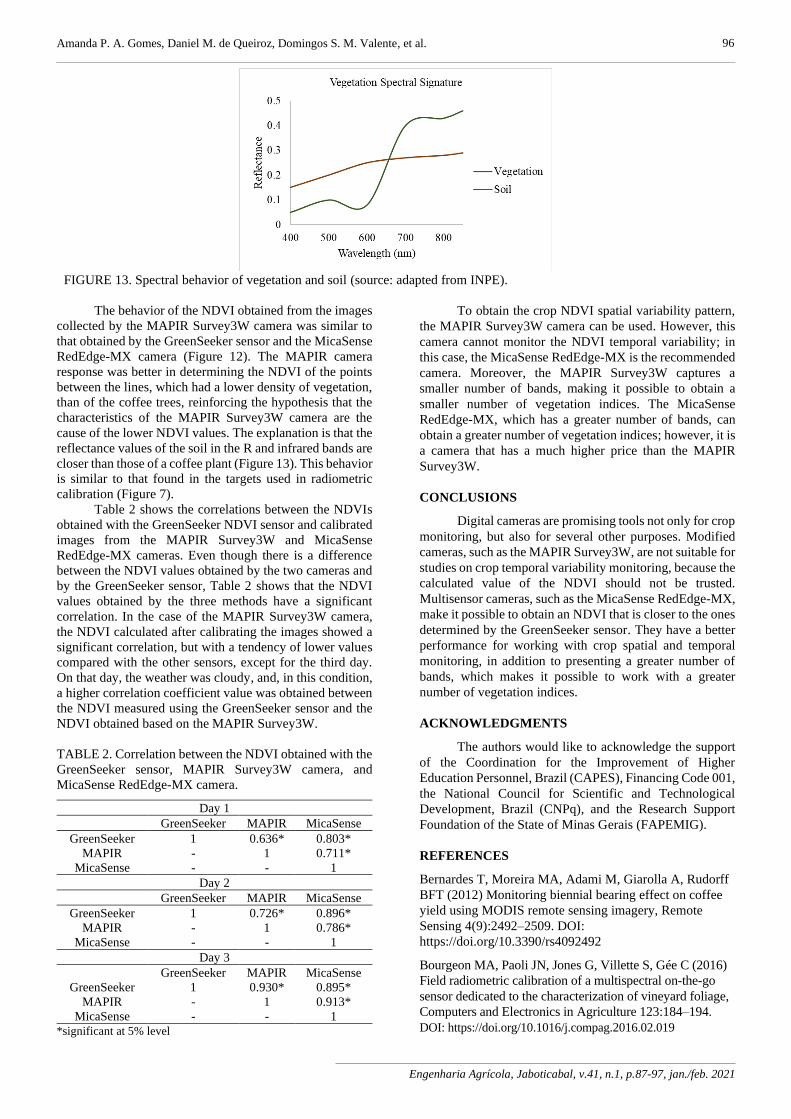
The targets used in the radiometric calibration process
had practically the same reflectance in the NIR, green, and R
bands (Figure 7). Because the vegetation has a reflectance in
the NIR region that is greater than that in the R band (Figure
13), the radiometric calibration by the empirical line method
may interfere with the reflectance values in the R and infrared
bands, causing an error in determining the NDVI of the
vegetation by the MAPIR Survey3W.
Amanda P. A. Gomes, Daniel M. de Queiroz, Domingos S. M. Valente, et al.
Engenharia Agrícola, Jaboticabal, v.41, n.1, p.87-97, jan./feb. 2021
FIGURE 13. Spectral behavior of vegetation and soil (source: adapted from INPE).
The behavior of the NDVI obtained from the images
collected by the MAPIR Survey3W camera was similar to
that obtained by the GreenSeeker sensor and the MicaSense
RedEdge-MX camera (Figure 12). The MAPIR camera
response was better in determining the NDVI of the points
between the lines, which had a lower density of vegetation,
than of the coffee trees, reinforcing the hypothesis that the
characteristics of the MAPIR Survey3W camera are the
cause of the lower NDVI values. The explanation is that the
reflectance values of the soil in the R and infrared bands are
closer than those of a coffee plant (Figure 13). This behavior
is similar to that found in the targets used in radiometric
calibration (Figure 7).
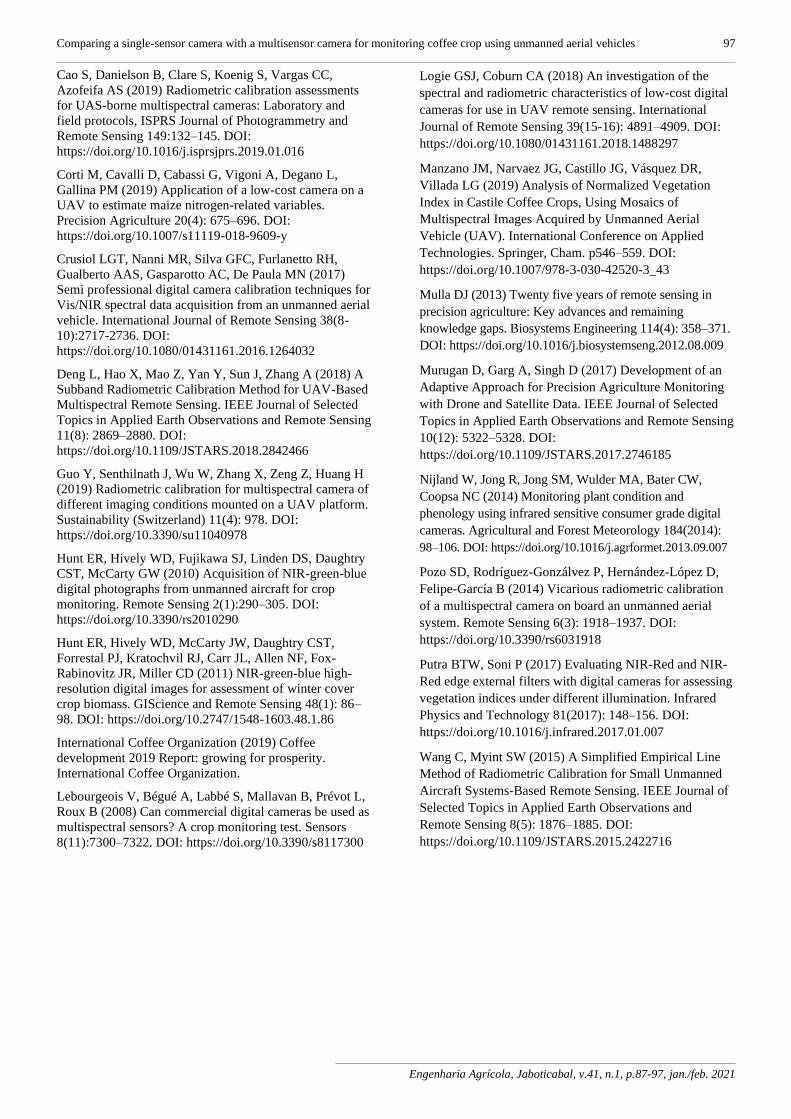
Table 2 shows the correlations between the NDVIs
obtained with the GreenSeeker NDVI sensor and calibrated
images from the MAPIR Survey3W and MicaSense
RedEdge-MX cameras. Even though there is a difference
between the NDVI values obtained by the two cameras and
by the GreenSeeker sensor, Table 2 shows that the NDVI
values obtained by the three methods have a significant
correlation. In the case of the MAPIR Survey3W camera,
the NDVI calculated after calibrating the images showed a
significant correlation, but with a tendency of lower values
compared with the other sensors, except for the third day.
On that day, the weather was cloudy, and, in this condition,
a higher correlation coefficient value was obtained between
the NDVI measured using the GreenSeeker sensor and the
NDVI obtained based on the MAPIR Survey3W.
TABLE 2. Correlation between the NDVI obtained with the
GreenSeeker sensor, MAPIR Survey3W camera, and
MicaSense RedEdge-MX camera.
Day 1
GreenSeeker MAPIR MicaSense
GreenSeeker 1 0.636* 0.803*
MAPIR - 1 0.711*
MicaSense - - 1
Day 2
GreenSeeker MAPIR MicaSense
GreenSeeker 1 0.726* 0.896*
MAPIR - 1 0.786*
MicaSense - - 1
Day 3
GreenSeeker MAPIR MicaSense
GreenSeeker 1 0.930* 0.895*
MAPIR - 1 0.913*
MicaSense - - 1
*significant at 5% level
To obtain the crop NDVI spatial variability pattern,
the MAPIR Survey3W camera can be used. However, this
camera cannot monitor the NDVI temporal variability; in
this case, the MicaSense RedEdge-MX is the recommended
camera. Moreover, the MAPIR Survey3W captures a
smaller number of bands, making it possible to obtain a
smaller number of vegetation indices. The MicaSense
RedEdge-MX, which has a greater number of bands, can
obtain a greater number of vegetation indices; however, it is
a camera that has a much higher price than the MAPIR
Survey3W.
CONCLUSIONS
Digital cameras are promising tools not only for crop
monitoring, but also for several other purposes. Modified
cameras, such as the MAPIR Survey3W, are not suitable for
studies on crop temporal variability monitoring, because the
calculated value of the NDVI should not be trusted.
Multisensor cameras, such as the MicaSense RedEdge-MX,
make it possible to obtain an NDVI that is closer to the ones
determined by the GreenSeeker sensor. They have a better
performance for working with crop spatial and temporal
monitoring, in addition to presenting a greater number of
bands, which makes it possible to work with a greater
number of vegetation indices.
ACKNOWLEDGMENTS
The authors would like to acknowledge the support
of the Coordination for the Improvement of Higher
Education Personnel, Brazil (CAPES), Financing Code 001,
the National Council for Scientific and Technological
Development, Brazil (CNPq), and the Research Support
Foundation of the State of Minas Gerais (FAPEMIG).
REFERENCES
Bernardes T, Moreira MA, Adami M, Giarolla A, Rudorff
BFT (2012) Monitoring biennial bearing effect on coffee
yield using MODIS remote sensing imagery, Remote
Sensing 4(9):2492–2509. DOI:
https://doi.org/10.3390/rs4092492
Bourgeon MA, Paoli JN, Jones G, Villette S, Gée C (2016)
Field radiometric calibration of a multispectral on-the-go
sensor dedicated to the characterization of vineyard foliage,
Computers and Electronics in Agriculture 123:184–194.
DOI: https://doi.org/10.1016/j.compag.2016.02.019
96
Comparing a single-sensor camera with a multisensor camera for monitoring coffee crop using unmanned aerial vehicles 97
Engenharia Agrícola, Jaboticabal, v.41, n.1, p.87-97, jan./feb. 2021
Cao S, Danielson B, Clare S, Koenig S, Vargas CC,
Azofeifa AS (2019) Radiometric calibration assessments
for UAS-borne multispectral cameras: Laboratory and
field protocols, ISPRS Journal of Photogrammetry and
Remote Sensing 149:132–145. DOI:
https://doi.org/10.1016/j.isprsjprs.2019.01.016
Corti M, Cavalli D, Cabassi G, Vigoni A, Degano L,
Gallina PM (2019) Application of a low-cost camera on a
UAV to estimate maize nitrogen-related variables.
Precision Agriculture 20(4): 675–696. DOI:
https://doi.org/10.1007/s11119-018-9609-y
Crusiol LGT, Nanni MR, Silva GFC, Furlanetto RH,
Gualberto AAS, Gasparotto AC, De Paula MN (2017)
Semi professional digital camera calibration techniques for
Vis/NIR spectral data acquisition from an unmanned aerial
vehicle. International Journal of Remote Sensing 38(8-
10):2717-2736. DOI:
https://doi.org/10.1080/01431161.2016.1264032
Deng L, Hao X, Mao Z, Yan Y, Sun J, Zhang A (2018) A
Subband Radiometric Calibration Method for UAV-Based
Multispectral Remote Sensing. IEEE Journal of Selected
Topics in Applied Earth Observations and Remote Sensing
11(8): 2869–2880. DOI:
https://doi.org/10.1109/JSTARS.2018.2842466
Guo Y, Senthilnath J, Wu W, Zhang X, Zeng Z, Huang H
(2019) Radiometric calibration for multispectral camera of
different imaging conditions mounted on a UAV platform.
Sustainability (Switzerland) 11(4): 978. DOI:
https://doi.org/10.3390/su11040978
Hunt ER, Hively WD, Fujikawa SJ, Linden DS, Daughtry
CST, McCarty GW (2010) Acquisition of NIR-green-blue
digital photographs from unmanned aircraft for crop
monitoring. Remote Sensing 2(1):290–305. DOI:
https://doi.org/10.3390/rs2010290
Hunt ER, Hively WD, McCarty JW, Daughtry CST,
Forrestal PJ, Kratochvil RJ, Carr JL, Allen NF, Fox-
Rabinovitz JR, Miller CD (2011) NIR-green-blue high-
resolution digital images for assessment of winter cover
crop biomass. GIScience and Remote Sensing 48(1): 86–
98. DOI: https://doi.org/10.2747/1548-1603.48.1.86
International Coffee Organization (2019) Coffee
development 2019 Report: growing for prosperity.
International Coffee Organization.
Lebourgeois V, Bégué A, Labbé S, Mallavan B, Prévot L,
Roux B (2008) Can commercial digital cameras be used as
multispectral sensors? A crop monitoring test. Sensors
8(11):7300–7322. DOI: https://doi.org/10.3390/s8117300
Logie GSJ, Coburn CA (2018) An investigation of the
spectral and radiometric characteristics of low-cost digital
cameras for use in UAV remote sensing. International
Journal of Remote Sensing 39(15-16): 4891–4909. DOI:
https://doi.org/10.1080/01431161.2018.1488297
Manzano JM, Narvaez JG, Castillo JG, Vásquez DR,
Villada LG (2019) Analysis of Normalized Vegetation
Index in Castile Coffee Crops, Using Mosaics of
Multispectral Images Acquired by Unmanned Aerial
Vehicle (UAV). International Conference on Applied
Technologies. Springer, Cham. p546–559. DOI:
https://doi.org/10.1007/978-3-030-42520-3_43
Mulla DJ (2013) Twenty five years of remote sensing in
precision agriculture: Key advances and remaining
knowledge gaps. Biosystems Engineering 114(4): 358–371.
DOI: https://doi.org/10.1016/j.biosystemseng.2012.08.009
Murugan D, Garg A, Singh D (2017) Development of an
Adaptive Approach for Precision Agriculture Monitoring
with Drone and Satellite Data. IEEE Journal of Selected
Topics in Applied Earth Observations and Remote Sensing
10(12): 5322–5328. DOI:
https://doi.org/10.1109/JSTARS.2017.2746185
Nijland W, Jong R, Jong SM, Wulder MA, Bater CW,
Coopsa NC (2014) Monitoring plant condition and
phenology using infrared sensitive consumer grade digital
cameras. Agricultural and Forest Meteorology 184(2014):
98–106. DOI: https://doi.org/10.1016/j.agrformet.2013.09.007
Pozo SD, Rodríguez-Gonzálvez P, Hernández-López D,
Felipe-García B (2014) Vicarious radiometric calibration
of a multispectral camera on board an unmanned aerial
system. Remote Sensing 6(3): 1918–1937. DOI:
https://doi.org/10.3390/rs6031918
Putra BTW, Soni P (2017) Evaluating NIR-Red and NIR-
Red edge external filters with digital cameras for assessing
vegetation indices under different illumination. Infrared
Physics and Technology 81(2017): 148–156. DOI:
https://doi.org/10.1016/j.infrared.2017.01.007
Wang C, Myint SW (2015) A Simplified Empirical Line
Method of Radiometric Calibration for Small Unmanned
Aircraft Systems-Based Remote Sensing. IEEE Journal of
Selected Topics in Applied Earth Observations and
Remote Sensing 8(5): 1876–1885. DOI:
https://doi.org/10.1109/JSTARS.2015.2422716