confidence interval a confidence interval (or interval estimate) is a range (or an interval) of...
TRANSCRIPT
Confidence Interval
A confidence interval (or interval estimate) is a range (or an interval) of values used to estimate the true value of a population parameter. A confidence interval is sometimes abbreviated as CI.
A confidence level is the probability 1 – α (often expressed as the equivalent percentage value) that the confidence interval actually does contain the population parameter, assuming that the estimation process is repeated a large number of times. (The value α is later called significance level.)
Most common choices are 90%, 95%, or 99%.
(α = 10%), (α= 5%), (α = 1%)
Confidence level
Student t Distribution
Methods for estimating a population mean is discussed when the population standard deviation is not known. With the standard deviation unknown, we use the Student t distribution assuming that (I) data come from a normal distribution, or (II) data size is at least 30.
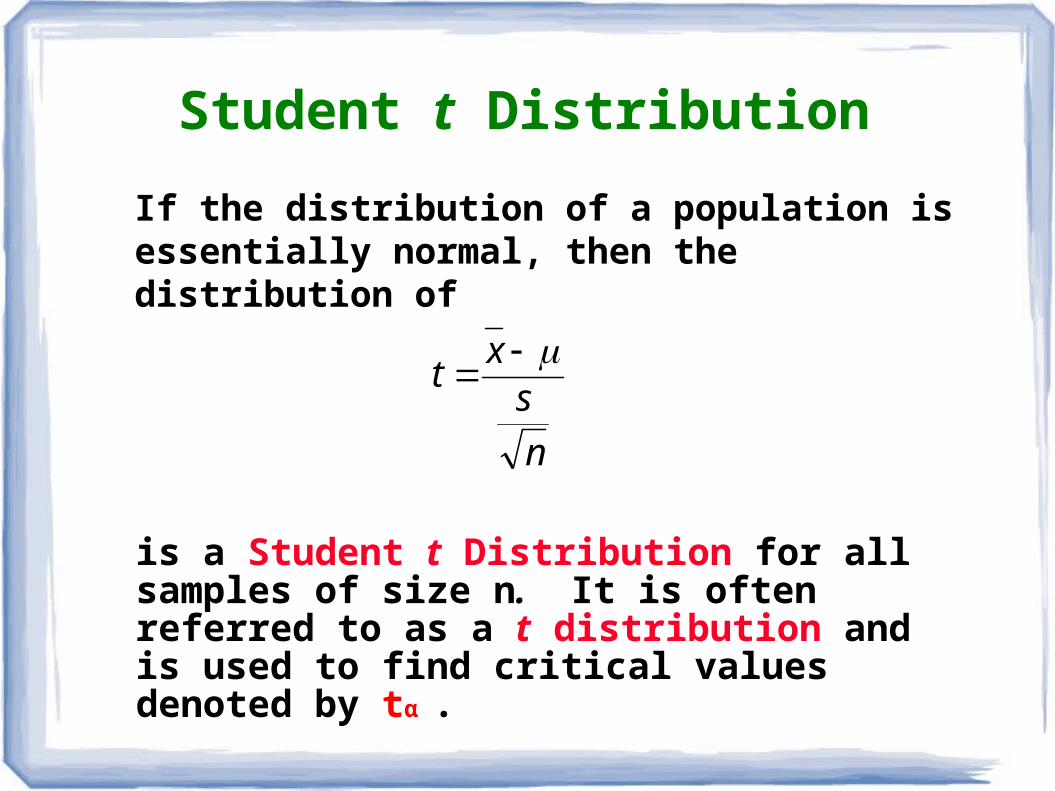
If the distribution of a population is essentially normal, then the distribution of
is a Student t Distribution for all samples of size n. It is often referred to as a t distribution and is used to find critical values denoted by tα .
Student t Distribution
n
sx
t
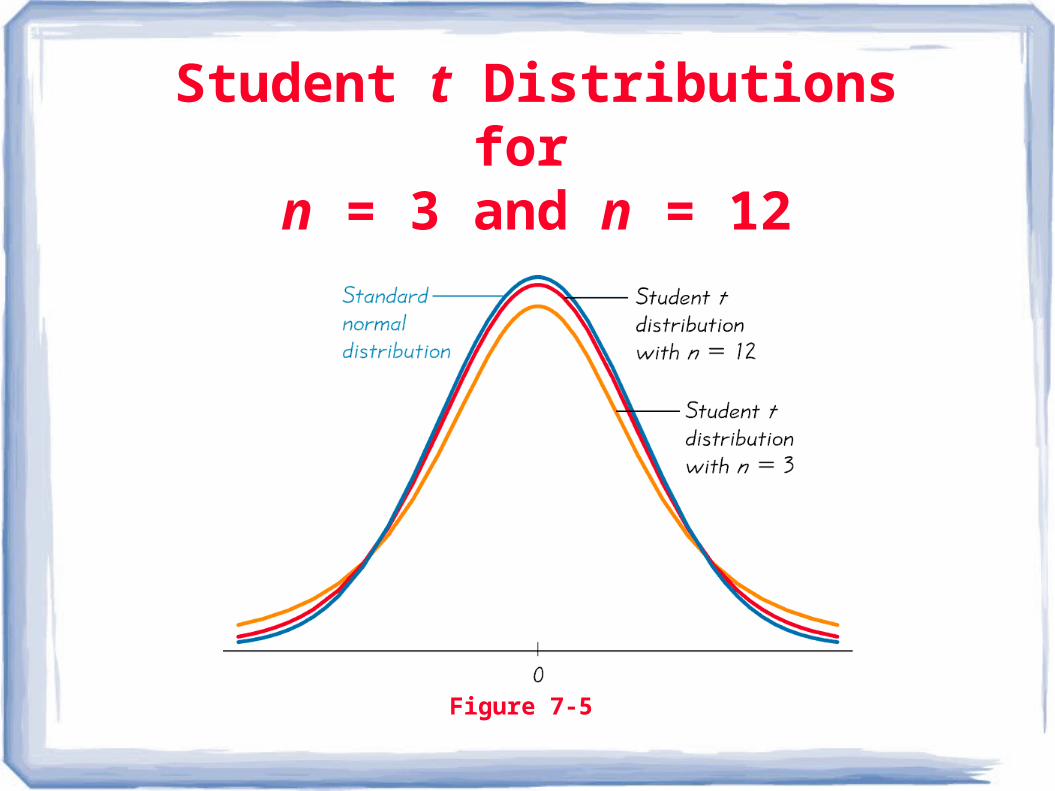
Student t Distributions for n = 3 and n = 12
Figure 7-5
degrees of freedom = n – 1
in this section.
Degrees of freedom
The number of degrees of freedom for a collection of sample data is the number of sample values that can vary after certain restrictions have been imposed on all data values. The degree of freedom is often abbreviated df.
Critical Values
The value separating the right-tail region is commonly denoted by tα and is referred to as a critical value because it is on the borderline separating values from a specified distribution that are likely to occur from those that are unlikely to occur.
Important Properties of the Student t Distribution
1. The Student t distribution is different for different sample sizes (see the previous slide, for the cases n = 3 and n = 12).
2. The Student t distribution has the same general symmetric bell shape as the standard normal distribution but it reflects the greater variability (with wider distributions) that is expected with small samples.
3. The Student t distribution has a mean of t = 0 (just as the standard normal distribution has a mean of z = 0).
4. The standard deviation of the Student t distribution varies with the sample size and is greater than 1 (unlike the standard normal distribution, which has a σ = 1).
5. As the sample size n gets larger, the Student t distribution gets closer to the normal distribution.
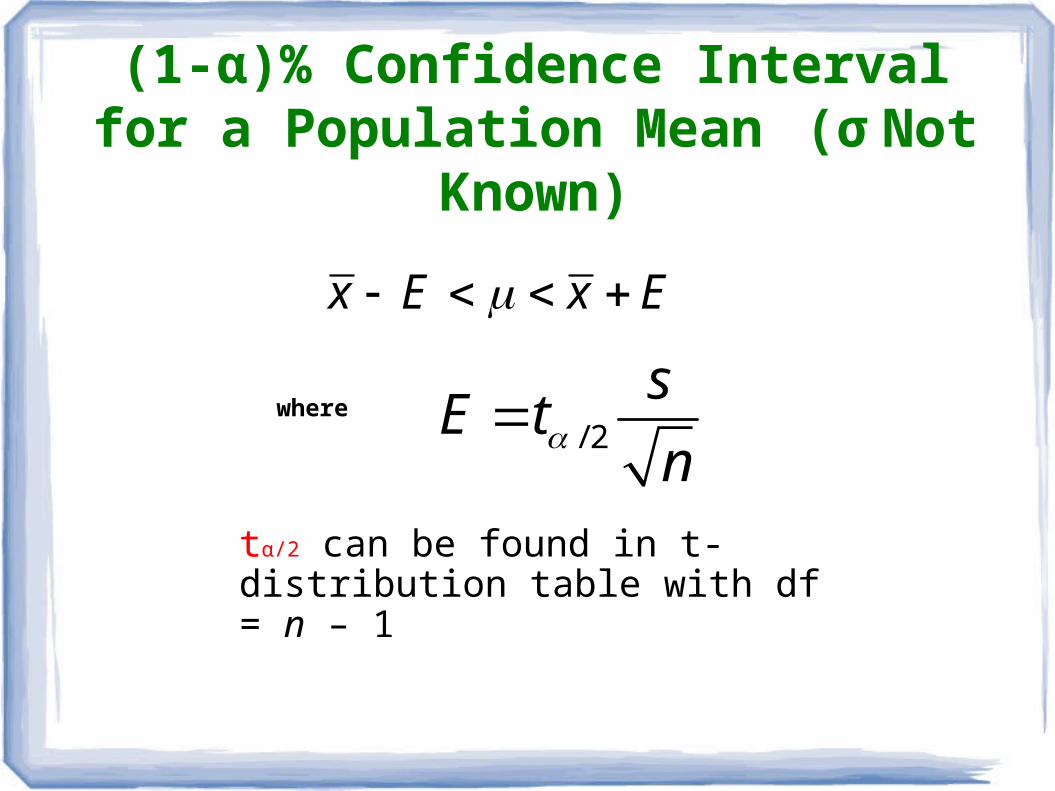
where
tα/2 can be found in t-distribution table with df = n – 1
(1-α)% Confidence Interval for a Population Mean (σ Not Known)
x E x E
/ 2
sE t
n
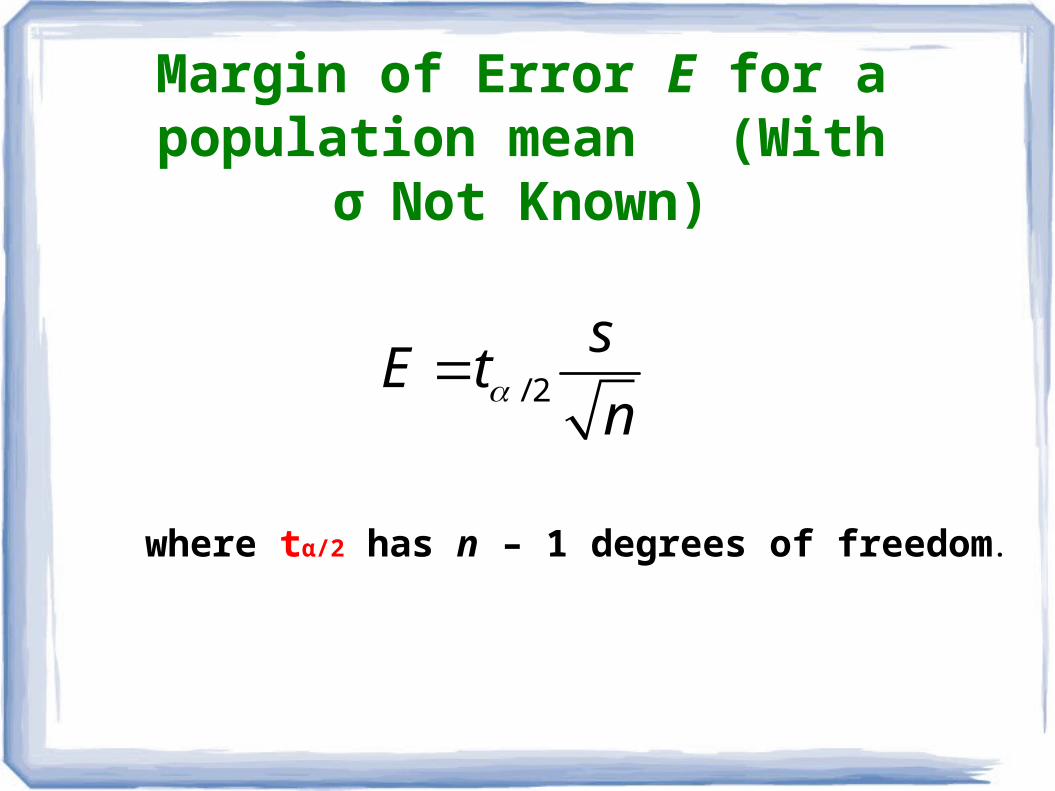
Margin of Error E for a population mean (With σNot Known)
where tα/2 has n – 1 degrees of freedom.
/ 2
sE t
n
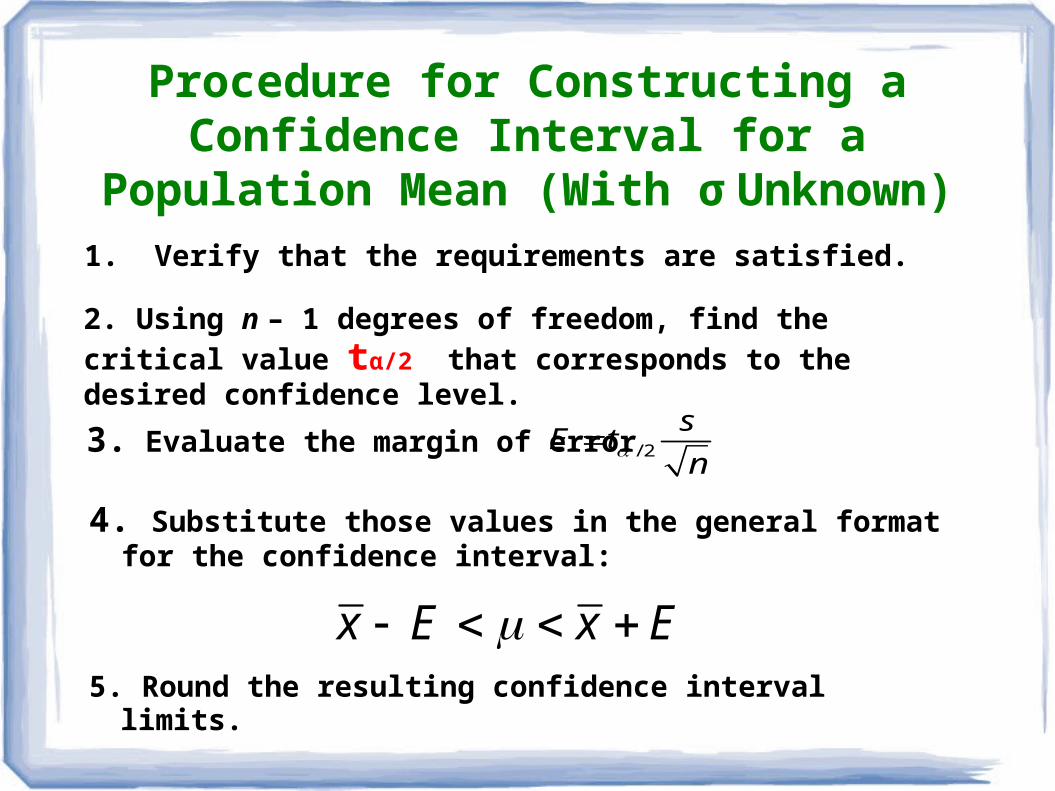
2. Using n – 1 degrees of freedom, find the critical value tα/2 that corresponds to the desired confidence level.
Procedure for Constructing aConfidence Interval for a Population
Mean (With σ Unknown)1. Verify that the requirements are satisfied.
3. Evaluate the margin of error
4. Substitute those values in the general format for the confidence interval:
5. Round the resulting confidence interval limits.
x E x E
/ 2
sE t
n
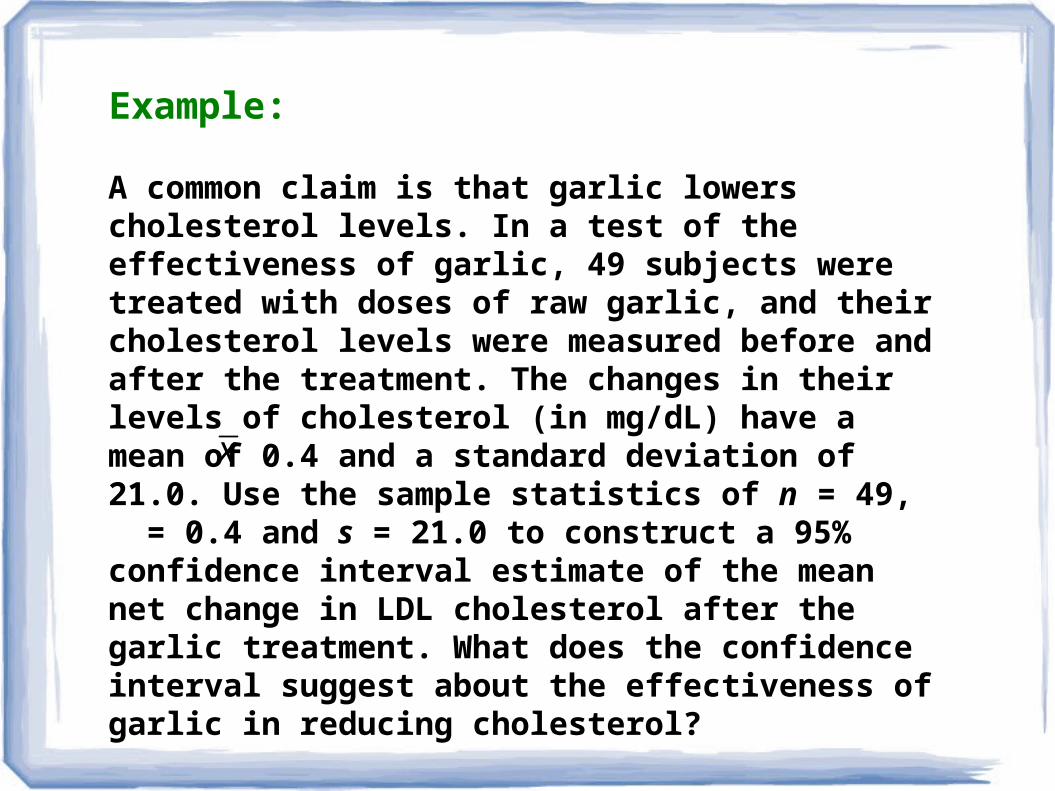
Example:
A common claim is that garlic lowers cholesterol levels. In a test of the effectiveness of garlic, 49 subjects were treated with doses of raw garlic, and their cholesterol levels were measured before and after the treatment. The changes in their levels of cholesterol (in mg/dL) have a mean of 0.4 and a standard deviation of 21.0. Use the sample statistics of n = 49, = 0.4 and s = 21.0 to construct a 95% confidence interval estimate of the mean net change in LDL cholesterol after the garlic treatment. What does the confidence interval suggest about the effectiveness of garlic in reducing cholesterol?
x
Example:
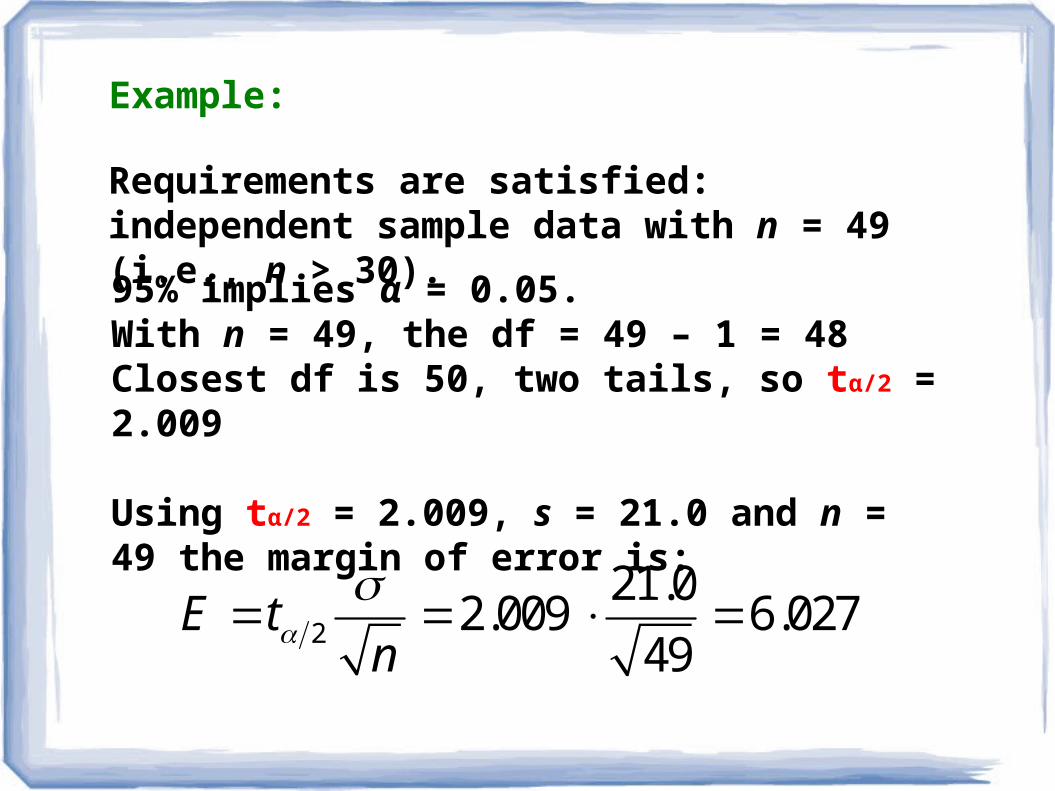
Requirements are satisfied: independent sample data with n = 49 (i.e., n > 30).
2
21 02 009 6 027
49
.. .E t
n
95% implies α = 0.05.With n = 49, the df = 49 – 1 = 48Closest df is 50, two tails, so tα/2 = 2.009
Using tα/2 = 2.009, s = 21.0 and n = 49 the margin of error is:
Example:
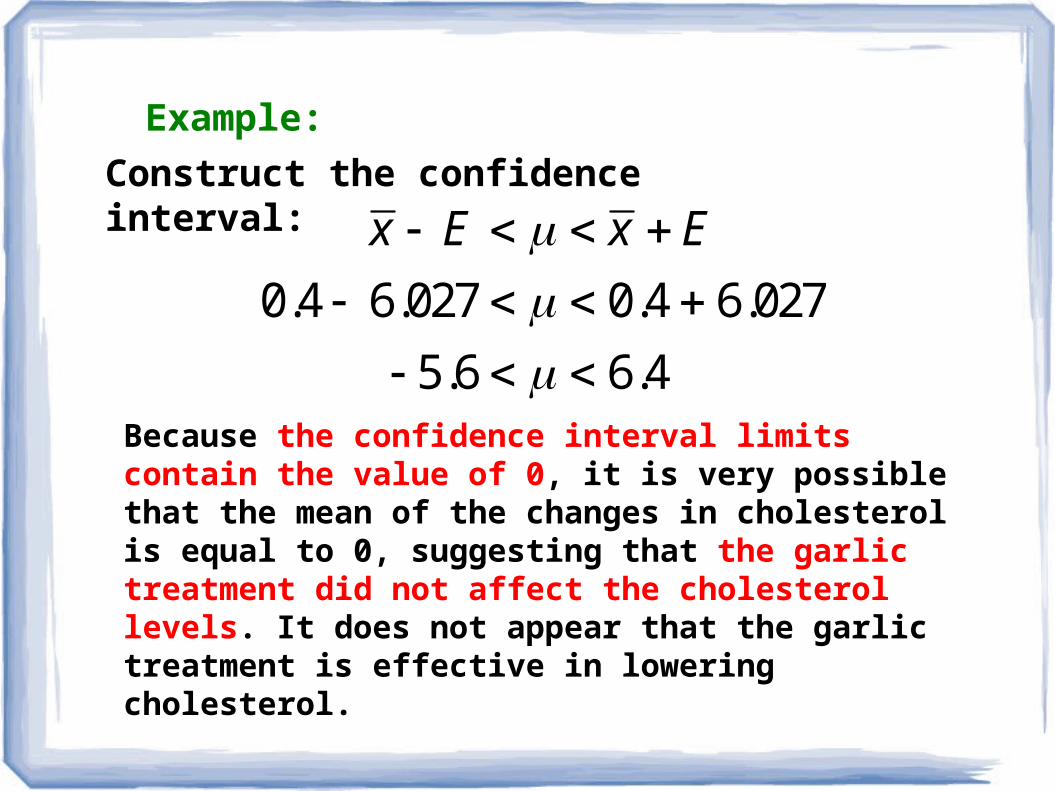
Construct the confidence interval:
Because the confidence interval limits contain the value of 0, it is very possible that the mean of the changes in cholesterol is equal to 0, suggesting that the garlic treatment did not affect the cholesterol levels. It does not appear that the garlic treatment is effective in lowering cholesterol.
x E x E
0.4 6.027 0.4 6.027
5.6 6.4
Inference on two groups
Confidence interval for the difference between two groups uses sample data from two independent samples, and tests hypotheses made about two population
means μ1and μ2, or simply shows confidence
interval estimates of the difference μ1μ2 between two population means.
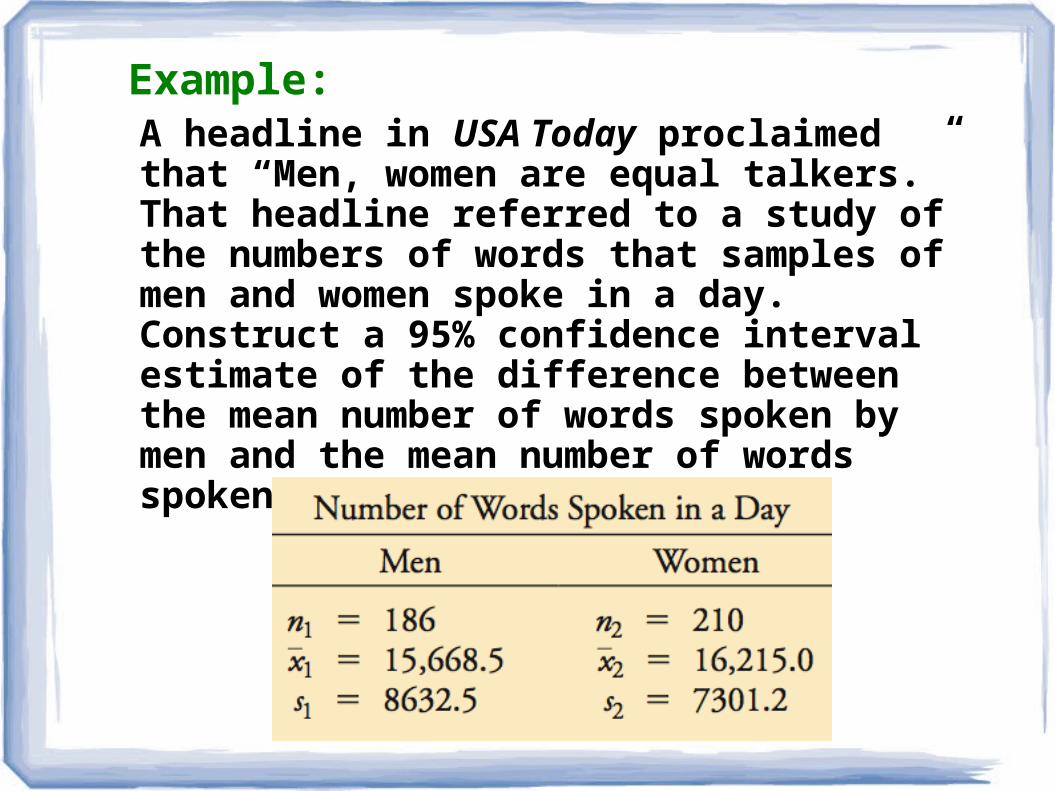
Example:A headline in USA Today proclaimed that “Men, women are equal talkers.” That headline referred to a study of the numbers of words that samples of men and women spoke in a day. Construct a 95% confidence interval estimate of the difference between the mean number of words spoken by men and the mean number of words spoken by women.
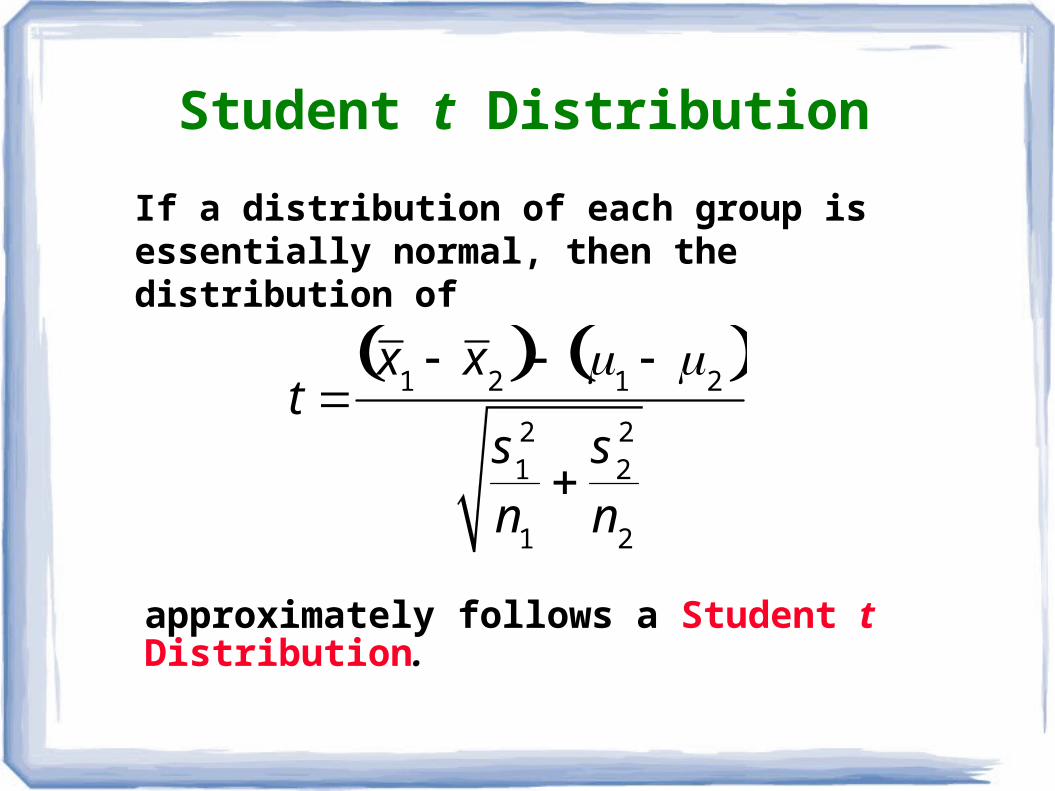
If a distribution of each group is essentially normal, then the distribution of
approximately follows a Student t Distribution.
Student t Distribution
t x
1 x
2 1
2 s
12
n1
s
22
n2
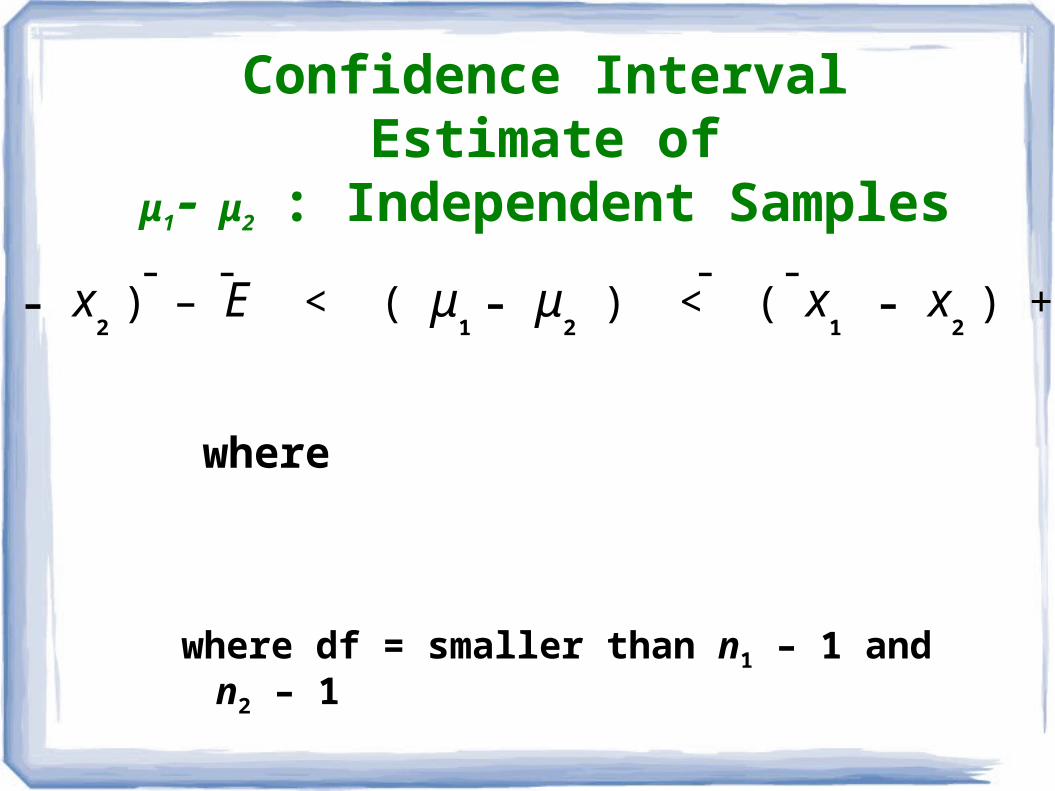
Confidence Interval Estimate ofμ1μ2: Independent Samples
where df = smaller than n1 – 1 and n2 – 1
where2 21 2
21 2
s sE t
n n
( x1
– x2 ) – E < ( μ
1 – μ
2 ) < ( x
1 – x
2 ) + E
- - --
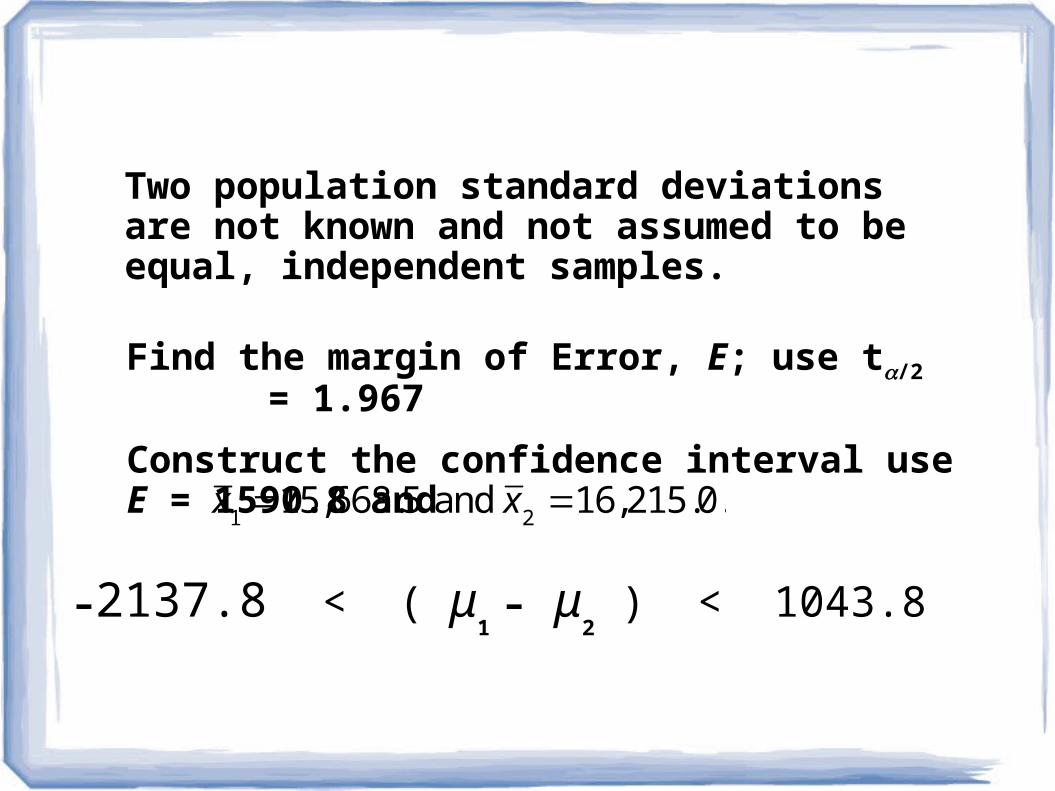
Two population standard deviations are not known and not assumed to be equal, independent samples.
Find the margin of Error, E; use t/2 = 1.967
Construct the confidence interval use E = 1590.8 and x1
15,668.5 and x216,215.0.
–2137.8 < ( μ1 – μ
2 ) < 1043.8
The standard error of estimate, denoted by SE is a measure of the deviation (or standard deviation) between the parameter θ of interest and the estimate that is obtained from the observed sample.
Standard Error
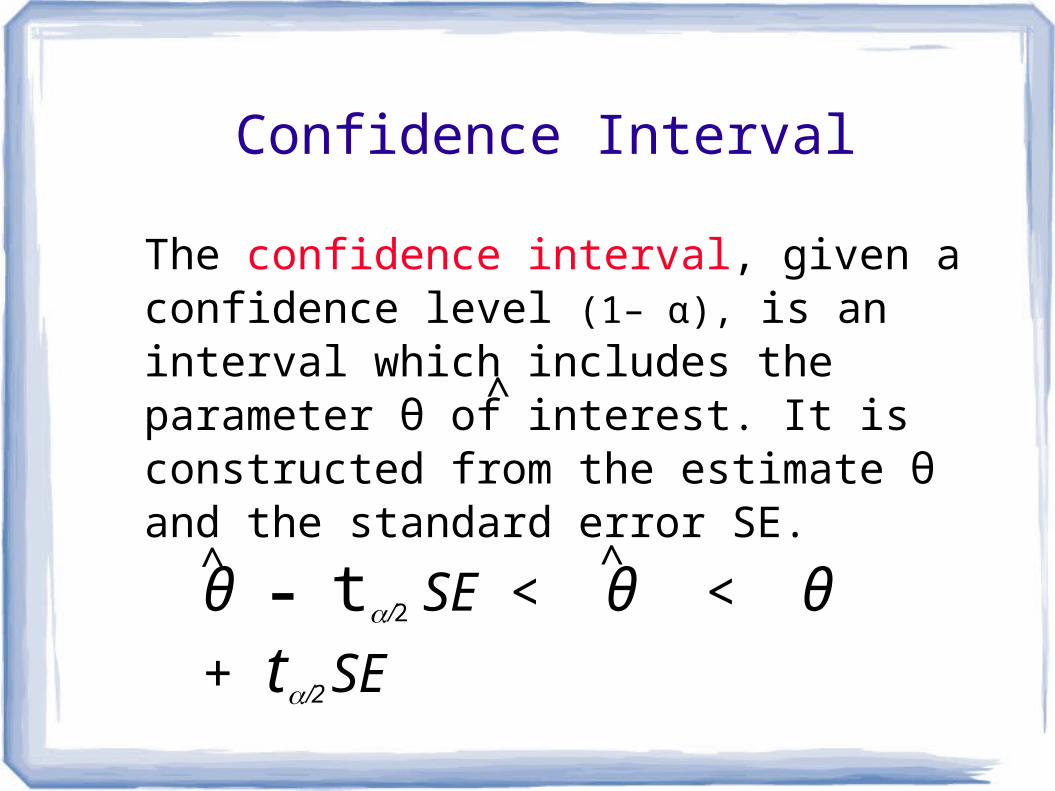
The confidence interval, given a confidence level (1– α), is an interval which includes the parameter θ of interest. It is constructed from the estimate θ and the standard error SE.
Confidence Interval
θ – t2 SE < θ < θ + t2 SE^ ^
^
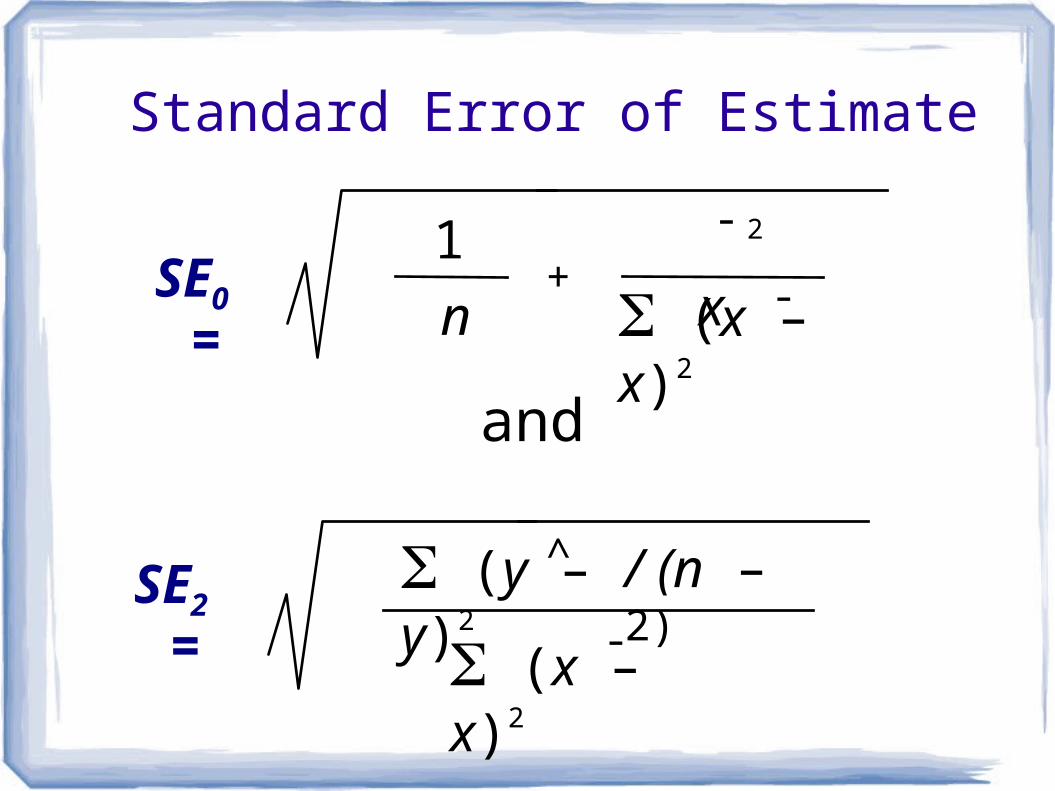
Standard Error of Estimate
SE0 =
and
+
SE2 = (y – y)2 / (n – 2)^
(x – x)2-
(x – x)2-
- x 2
n
1
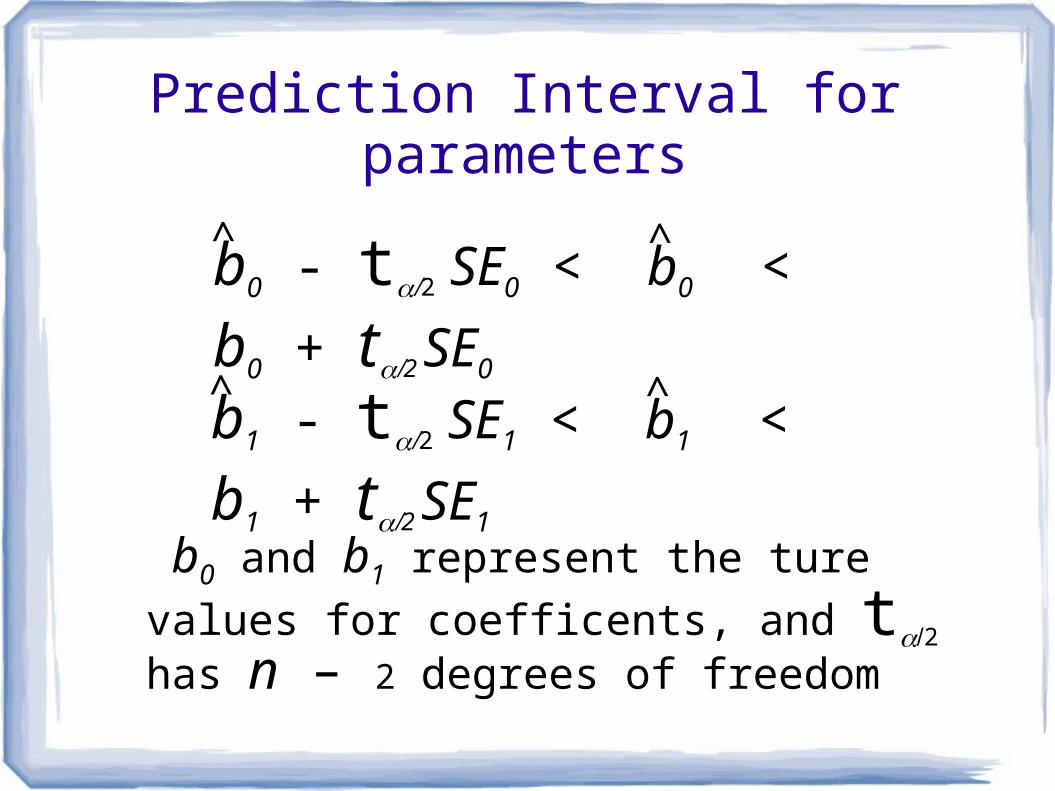
b0 - t2 SE0 < b0 < b0 + t2 SE0
^ ^
Prediction Interval for parameters
b0 and b1 represent the ture values for
coefficents, and t2 has n – 2 degrees of freedom
b1 - t2 SE1 < b1 < b1 + t2 SE1
^ ^