corporate presentation - indusind · pdf fileenterprise-wide risk management framework for...
TRANSCRIPT
June 2015
Corporate Presentation
hvsv
2
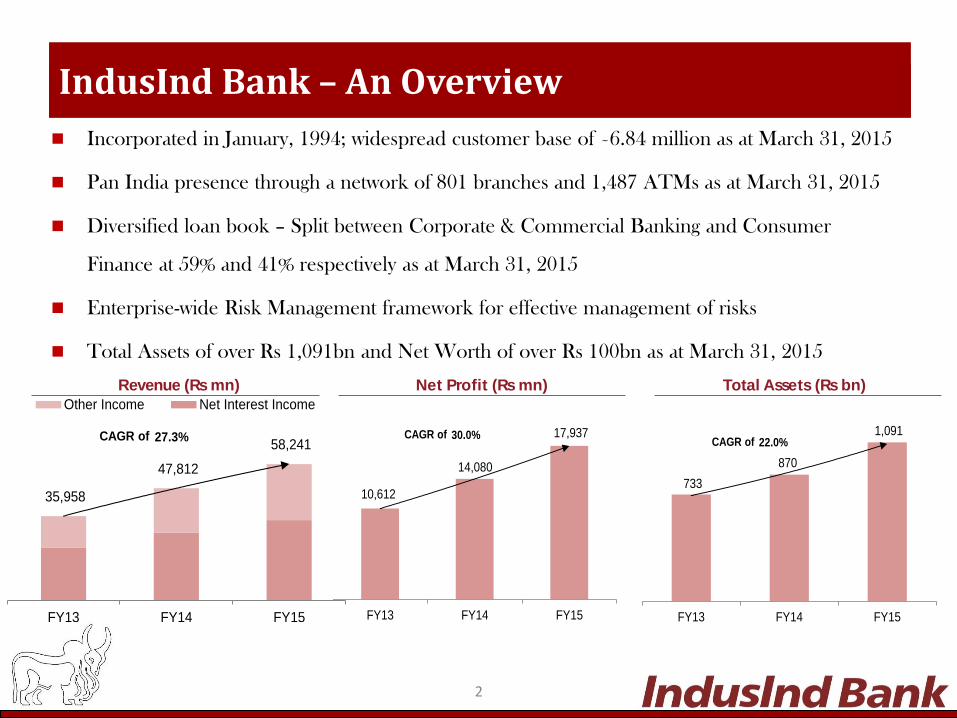
Incorporated in January, 1994; widespread customer base of ~6.84 million as at March 31, 2015
Pan India presence through a network of 801 branches and 1,487 ATMs as at March 31, 2015
Diversified loan book – Split between Corporate & Commercial Banking and Consumer
Finance at 59% and 41% respectively as at March 31, 2015
Enterprise-wide Risk Management framework for effective management of risks
Total Assets of over Rs 1,091bn and Net Worth of over Rs 100bn as at March 31, 2015
IndusInd Bank – An Overview
Revenue (Rs mn) Net Profit (Rs mn) Total Assets (Rs bn)
733
870
1,091
FY13 FY14 FY15
CAGR of 22.0%
10,612
14,080
17,937
FY13 FY14 FY15
CAGR of 30.0%
35,958
47,812
58,241
FY13 FY14 FY15
Other Income Net Interest Income
CAGR of 27.3%
3
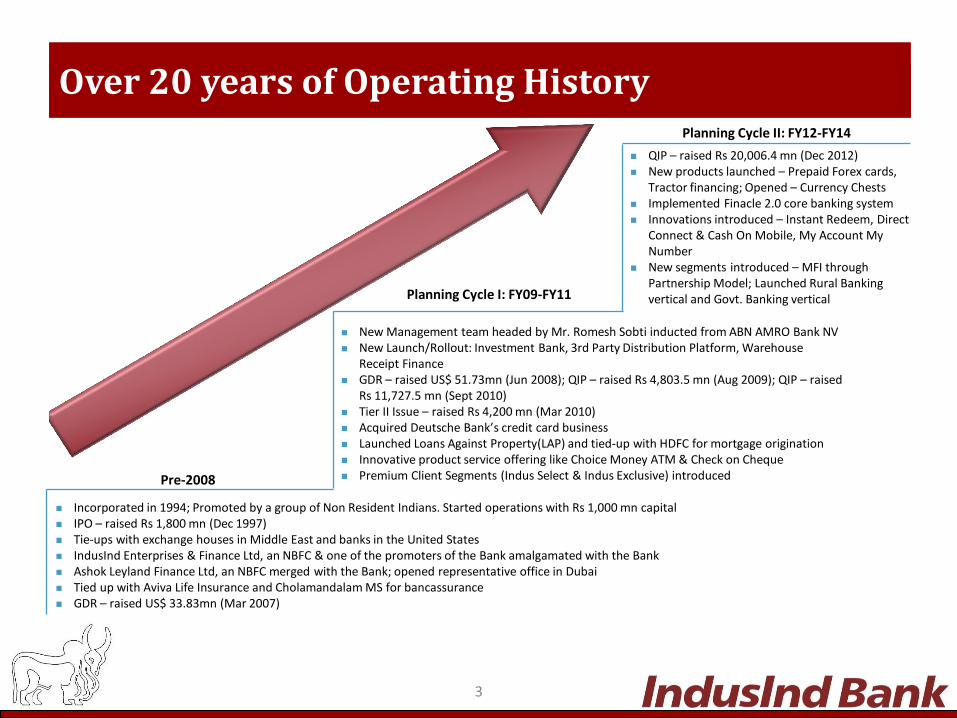
Over 20 years of Operating History
New Management team headed by Mr. Romesh Sobti inducted from ABN AMRO Bank NV New Launch/Rollout: Investment Bank, 3rd Party Distribution Platform, Warehouse
Receipt Finance GDR – raised US$ 51.73mn (Jun 2008); QIP – raised Rs 4,803.5 mn (Aug 2009); QIP – raised
Rs 11,727.5 mn (Sept 2010) Tier II Issue – raised Rs 4,200 mn (Mar 2010) Acquired Deutsche Bank’s credit card business Launched Loans Against Property(LAP) and tied-up with HDFC for mortgage origination Innovative product service offering like Choice Money ATM & Check on Cheque Premium Client Segments (Indus Select & Indus Exclusive) introduced Pre-2008
Planning Cycle I: FY09-FY11
Incorporated in 1994; Promoted by a group of Non Resident Indians. Started operations with Rs 1,000 mn capital IPO – raised Rs 1,800 mn (Dec 1997) Tie-ups with exchange houses in Middle East and banks in the United States IndusInd Enterprises & Finance Ltd, an NBFC & one of the promoters of the Bank amalgamated with the Bank Ashok Leyland Finance Ltd, an NBFC merged with the Bank; opened representative office in Dubai Tied up with Aviva Life Insurance and Cholamandalam MS for bancassurance GDR – raised US$ 33.83mn (Mar 2007)
QIP – raised Rs 20,006.4 mn (Dec 2012) New products launched – Prepaid Forex cards,
Tractor financing; Opened – Currency Chests Implemented Finacle 2.0 core banking system Innovations introduced – Instant Redeem, Direct
Connect & Cash On Mobile, My Account My Number
New segments introduced – MFI through Partnership Model; Launched Rural Banking vertical and Govt. Banking vertical
Planning Cycle II: FY12-FY14
ow
4
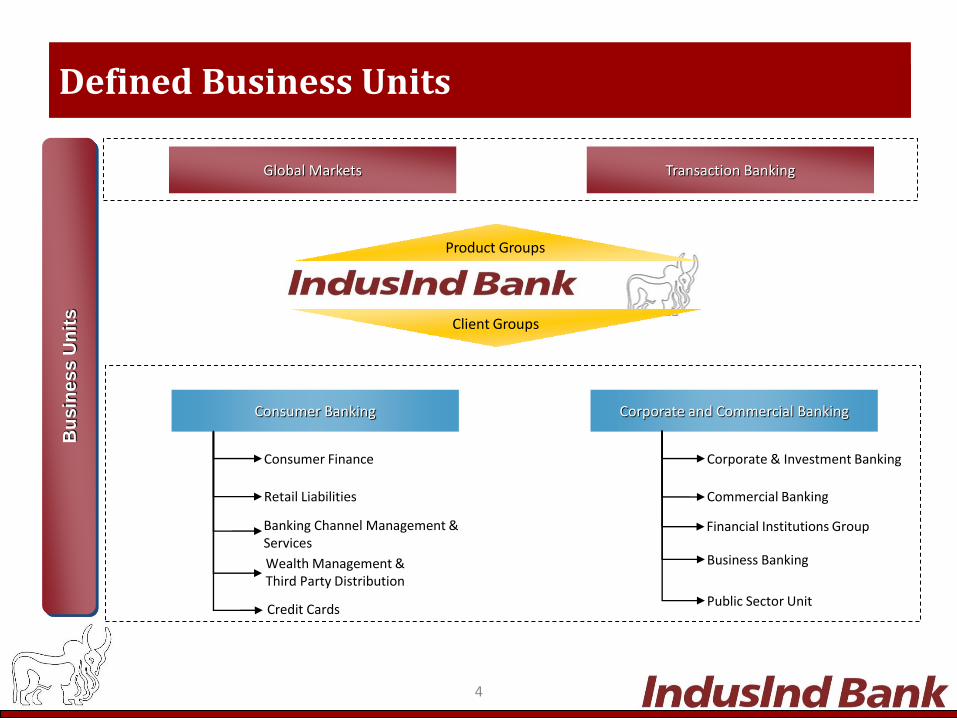
Defined Business Units
Product Groups
Client Groups
Consumer Banking Corporate and Commercial Banking
Consumer Finance
Retail Liabilities
Corporate & Investment Banking
Commercial Banking
Business Banking
Public Sector Unit
Banking Channel Management & Services
Wealth Management & Third Party Distribution
Global Markets Transaction Banking
Bu
sin
ess U
nit
s
Financial Institutions Group
Credit Cards
5
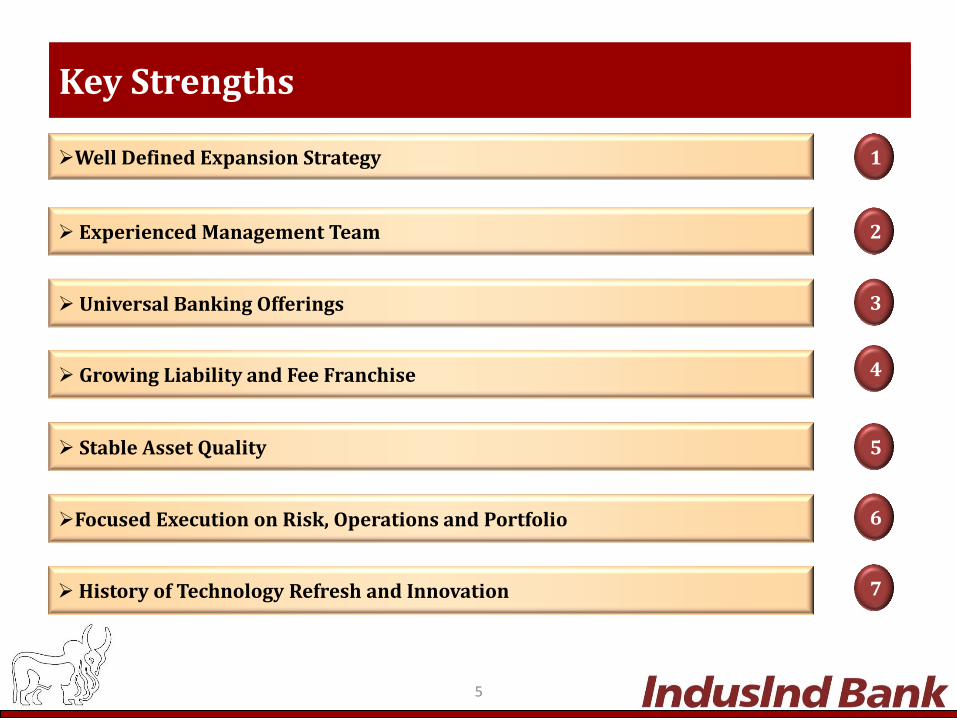
Key Strengths
Universal Banking Offerings
Growing Liability and Fee Franchise
Focused Execution on Risk, Operations and Portfolio
Well Defined Expansion Strategy
History of Technology Refresh and Innovation
Stable Asset Quality
Experienced Management Team
1
2
3
4
5
6
7
6
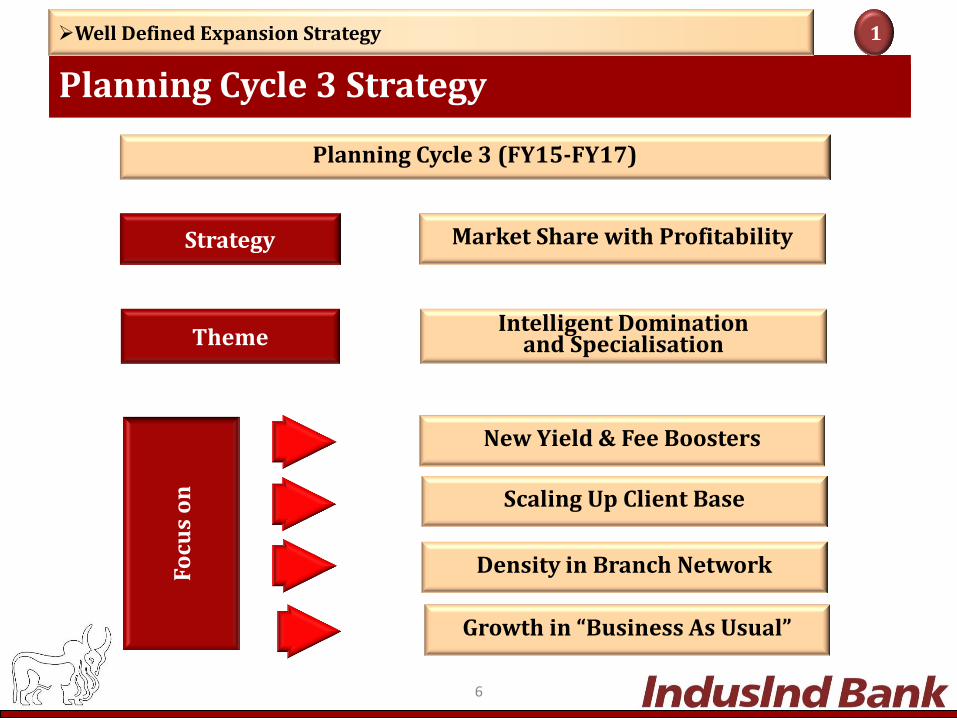
Planning Cycle 3 (FY15-FY17) F
ocu
s o
n
Market Share with Profitability Strategy
Intelligent Domination and Specialisation Theme
New Yield & Fee Boosters
Scaling Up Client Base
Density in Branch Network
Growth in “Business As Usual”
Planning Cycle 3 Strategy
Well Defined Expansion Strategy 1
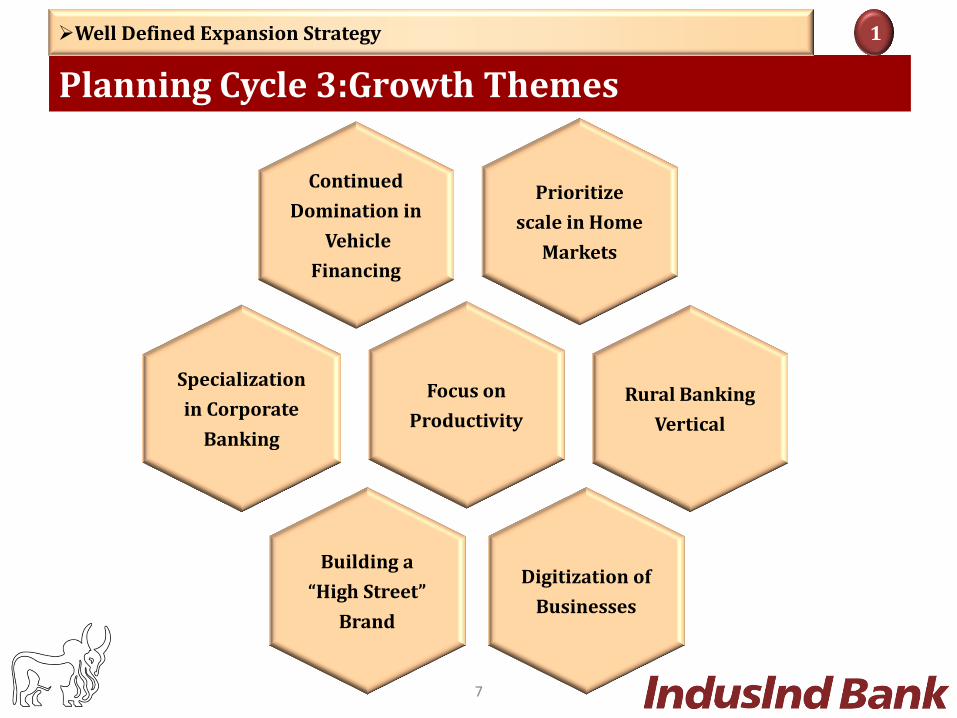
Planning Cycle 3:Growth Themes
Specialization
in Corporate
Banking
Building a
“High Street”
Brand
Digitization of
Businesses
Rural Banking
Vertical
Focus on
Productivity
Continued
Domination in
Vehicle
Financing
Prioritize
scale in Home
Markets
Well Defined Expansion Strategy 1
7

Tractor Financing Targeting “S” of SME Retail Trade / FX
Retail Assets Ramp Up Real Estate Innovative Customer
Offerings
Front and Back Office
optimization
Full suite of Rural
Products
Retail Assets
Ramp Up
Asset Reconstruction
Planning Cycle 3: Key New Initiatives
Well Defined Expansion Strategy 1
8
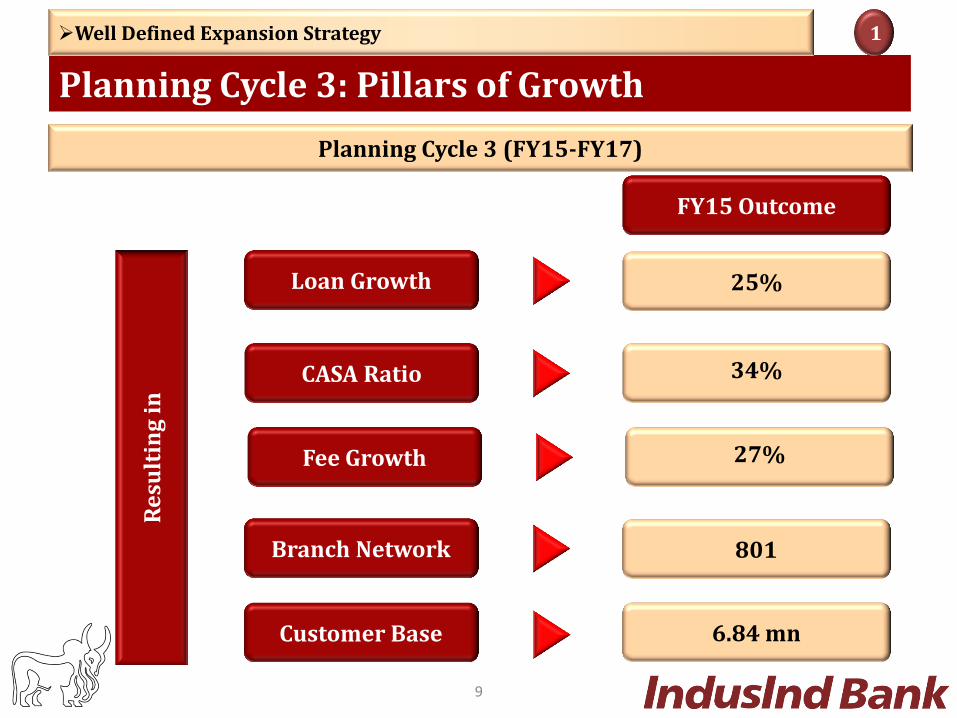
CASA Ratio
Branch Network
Customer Base
Loan Growth
34%
801
6.84 mn
25%
Planning Cycle 3 (FY15-FY17) R
esu
ltin
g i
n
Planning Cycle 3: Pillars of Growth
Well Defined Expansion Strategy 1
9
FY15 Outcome
Fee Growth 27%
10
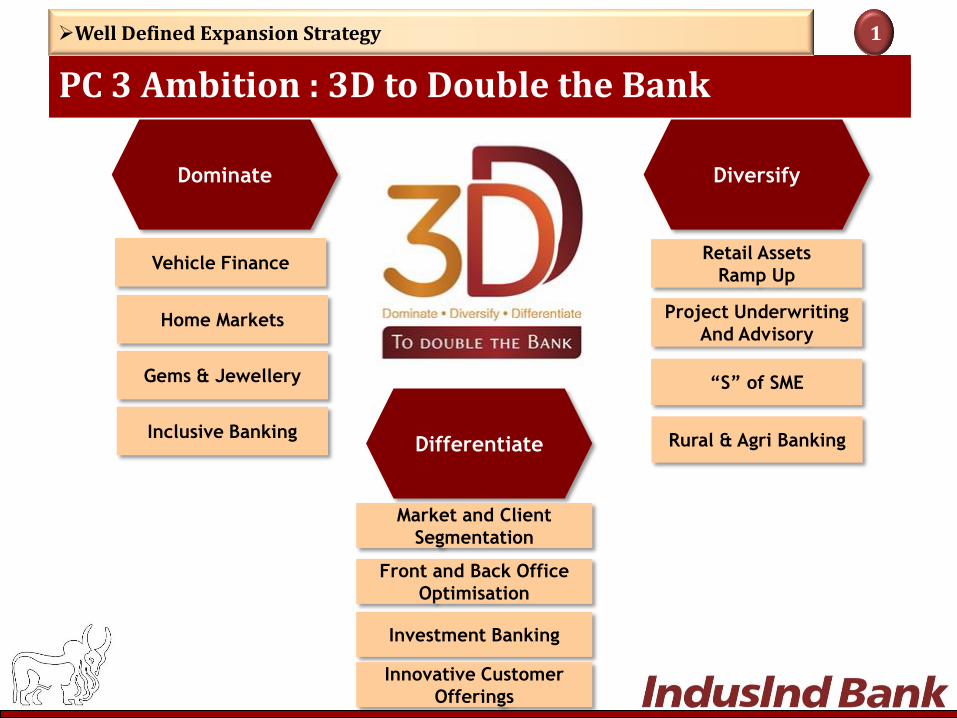
Diversify Dominate
Differentiate
Retail Assets
Ramp Up
Project Underwriting
And Advisory
Vehicle Finance
Market and Client
Segmentation
Investment Banking
“S” of SME
Home Markets
Front and Back Office
Optimisation
Gems & Jewellery
Inclusive Banking
Innovative Customer
Offerings
Rural & Agri Banking
PC 3 Ambition : 3D to Double the Bank
Well Defined Expansion Strategy 1
11
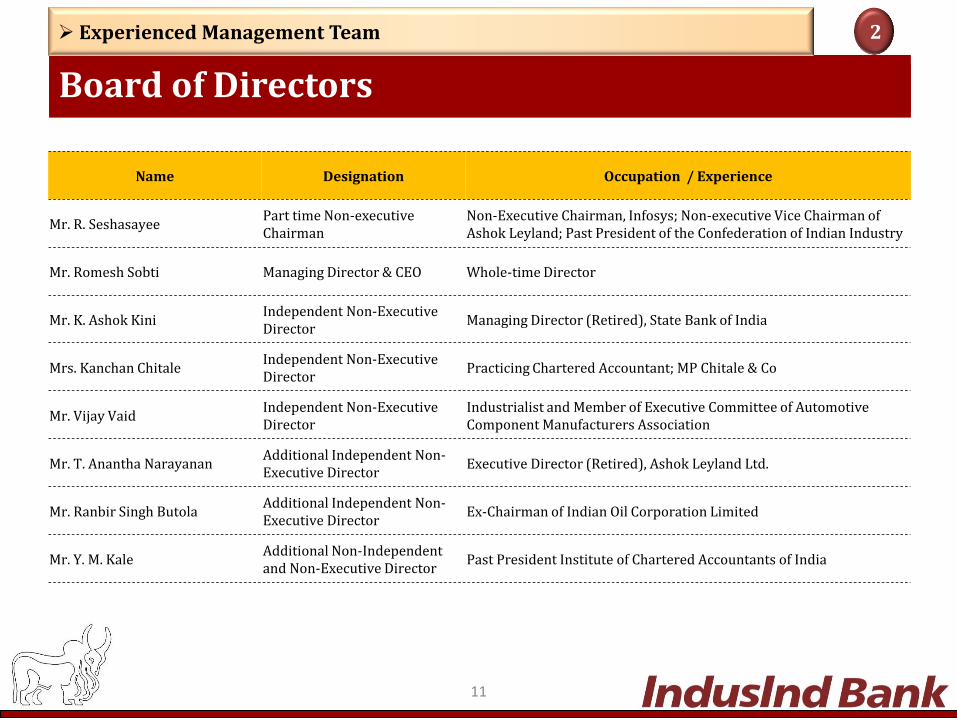
Name Designation Occupation / Experience
Mr. R. Seshasayee Part time Non-executive Chairman
Non-Executive Chairman, Infosys; Non-executive Vice Chairman of Ashok Leyland; Past President of the Confederation of Indian Industry
Mr. Romesh Sobti Managing Director & CEO Whole-time Director
Mr. K. Ashok Kini Independent Non-Executive Director
Managing Director (Retired), State Bank of India
Mrs. Kanchan Chitale Independent Non-Executive Director
Practicing Chartered Accountant; MP Chitale & Co
Mr. Vijay Vaid Independent Non-Executive Director
Industrialist and Member of Executive Committee of Automotive Component Manufacturers Association
Mr. T. Anantha Narayanan Additional Independent Non-Executive Director
Executive Director (Retired), Ashok Leyland Ltd.
Mr. Ranbir Singh Butola Additional Independent Non-Executive Director
Ex-Chairman of Indian Oil Corporation Limited
Mr. Y. M. Kale Additional Non-Independent and Non-Executive Director
Past President Institute of Chartered Accountants of India
Board of Directors
Experienced Management Team 2
12
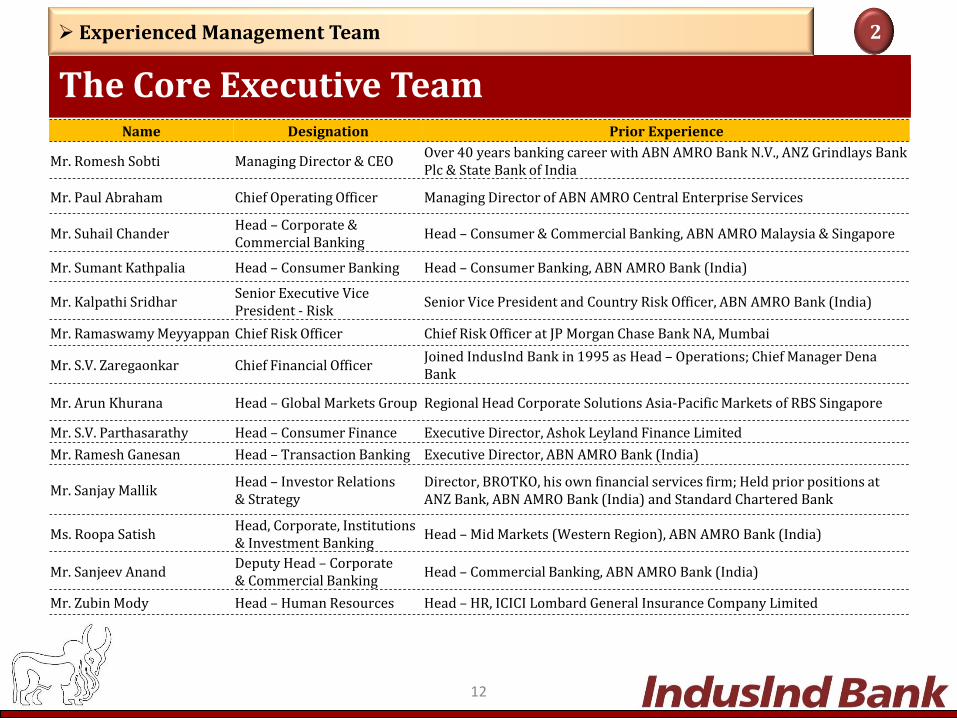
Name Designation Prior Experience
Mr. Romesh Sobti Managing Director & CEO Over 40 years banking career with ABN AMRO Bank N.V., ANZ Grindlays Bank Plc & State Bank of India
Mr. Paul Abraham Chief Operating Officer Managing Director of ABN AMRO Central Enterprise Services
Mr. Suhail Chander Head – Corporate & Commercial Banking
Head – Consumer & Commercial Banking, ABN AMRO Malaysia & Singapore
Mr. Sumant Kathpalia Head – Consumer Banking Head – Consumer Banking, ABN AMRO Bank (India)
Mr. Kalpathi Sridhar Senior Executive Vice President - Risk
Senior Vice President and Country Risk Officer, ABN AMRO Bank (India)
Mr. Ramaswamy Meyyappan Chief Risk Officer Chief Risk Officer at JP Morgan Chase Bank NA, Mumbai
Mr. S.V. Zaregaonkar Chief Financial Officer Joined IndusInd Bank in 1995 as Head – Operations; Chief Manager Dena Bank
Mr. Arun Khurana Head – Global Markets Group Regional Head Corporate Solutions Asia-Pacific Markets of RBS Singapore
Mr. S.V. Parthasarathy Head – Consumer Finance Executive Director, Ashok Leyland Finance Limited
Mr. Ramesh Ganesan Head – Transaction Banking Executive Director, ABN AMRO Bank (India)
Mr. Sanjay Mallik Head – Investor Relations & Strategy
Director, BROTKO, his own financial services firm; Held prior positions at ANZ Bank, ABN AMRO Bank (India) and Standard Chartered Bank
Ms. Roopa Satish Head, Corporate, Institutions & Investment Banking
Head – Mid Markets (Western Region), ABN AMRO Bank (India)
Mr. Sanjeev Anand Deputy Head – Corporate & Commercial Banking
Head – Commercial Banking, ABN AMRO Bank (India)
Mr. Zubin Mody Head – Human Resources Head – HR, ICICI Lombard General Insurance Company Limited
The Core Executive Team
Experienced Management Team 2
13
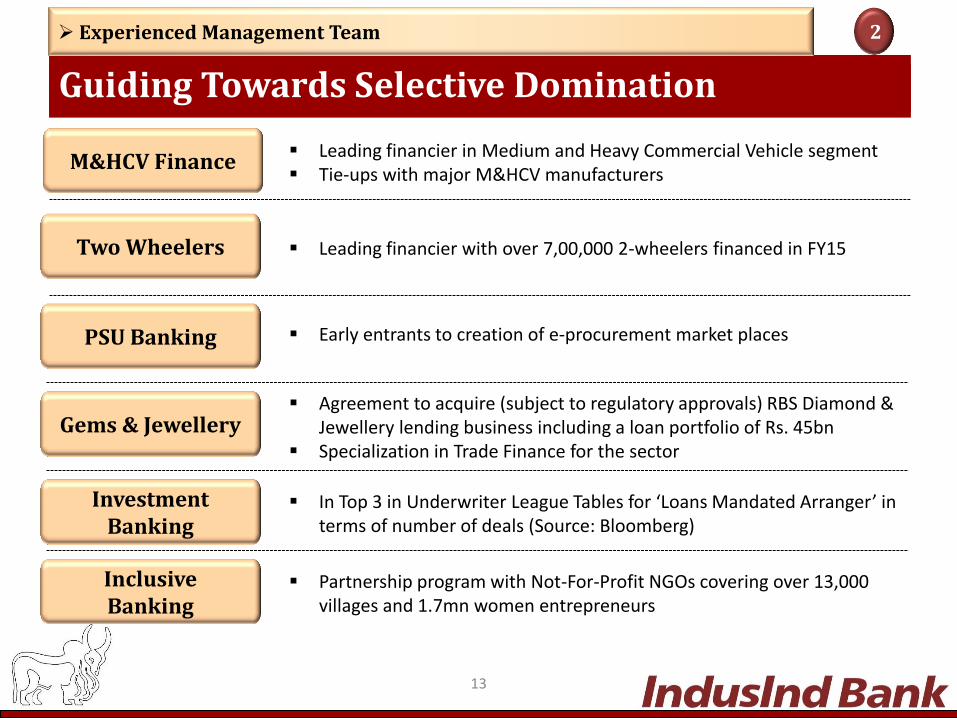
M&HCV Finance
PSU Banking
Gems & Jewellery
Investment Banking
Leading financier in Medium and Heavy Commercial Vehicle segment Tie-ups with major M&HCV manufacturers
Early entrants to creation of e-procurement market places
Agreement to acquire (subject to regulatory approvals) RBS Diamond & Jewellery lending business including a loan portfolio of Rs. 45bn
Specialization in Trade Finance for the sector
In Top 3 in Underwriter League Tables for ‘Loans Mandated Arranger’ in terms of number of deals (Source: Bloomberg)
Inclusive Banking
Partnership program with Not-For-Profit NGOs covering over 13,000 villages and 1.7mn women entrepreneurs
Guiding Towards Selective Domination
Experienced Management Team 2
Two Wheelers Leading financier with over 7,00,000 2-wheelers financed in FY15
14
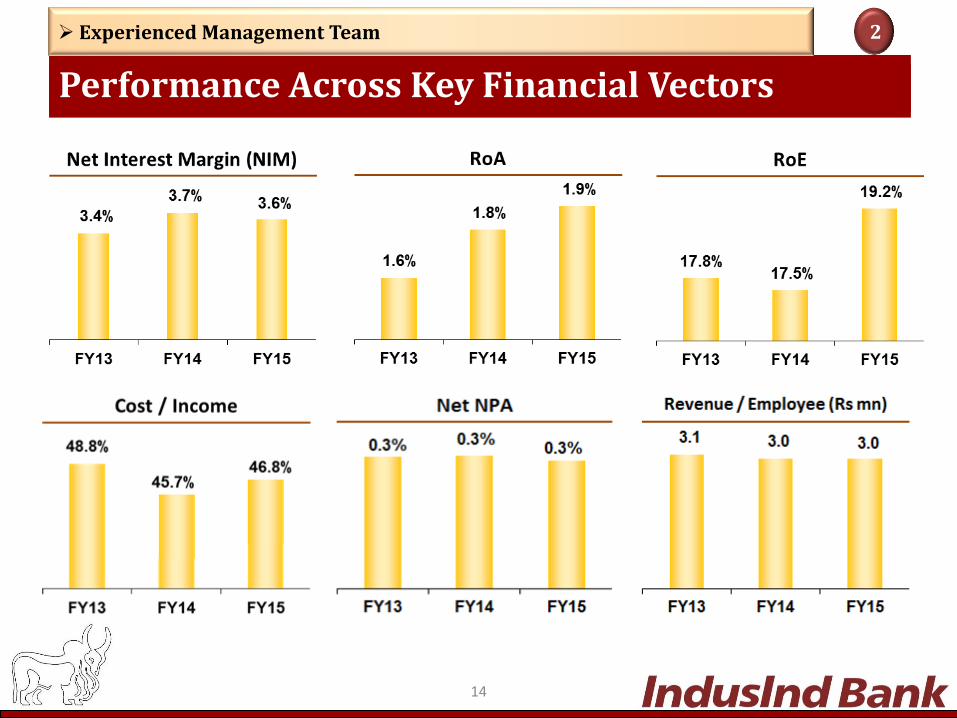
Performance Across Key Financial Vectors
Experienced Management Team 2
15
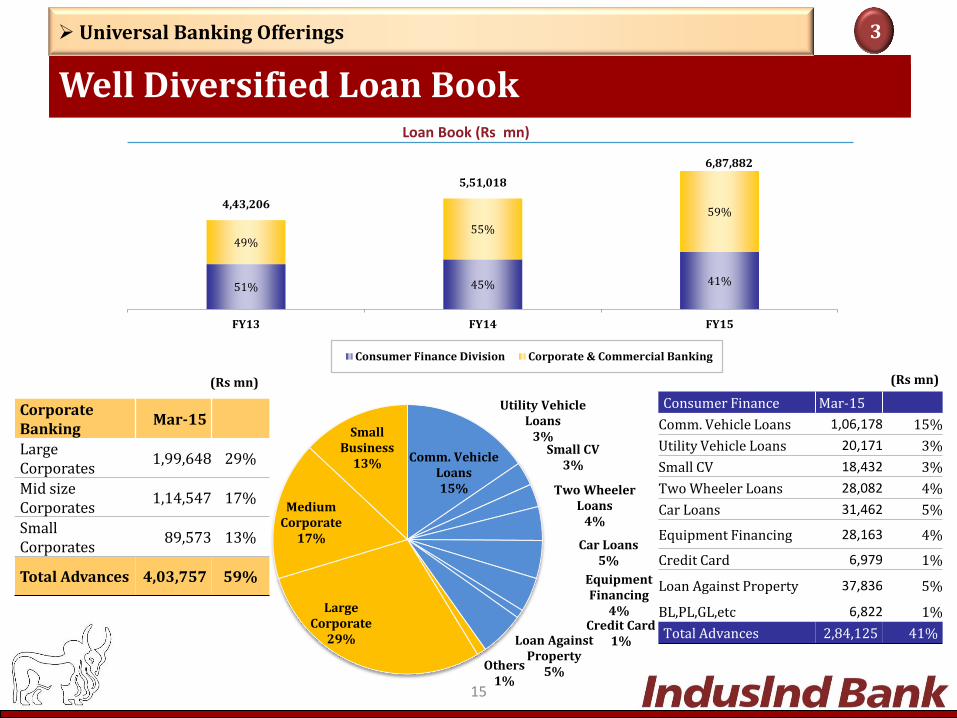
Well Diversified Loan Book
Universal Banking Offerings 3
Corporate Banking
Mar-15
Large Corporates
1,99,648 29%
Mid size Corporates
1,14,547 17%
Small Corporates
89,573 13%
Total Advances 4,03,757 59%
Loan Book (Rs mn)
(Rs mn) (Rs mn)
Consumer Finance Mar-15
Comm. Vehicle Loans 1,06,178 15%
Utility Vehicle Loans 20,171 3%
Small CV 18,432 3%
Two Wheeler Loans 28,082 4%
Car Loans 31,462 5%
Equipment Financing 28,163 4%
Credit Card 6,979 1%
Loan Against Property 37,836 5%
BL,PL,GL,etc 6,822 1%
Total Advances 2,84,125 41%
51% 45% 41%
49% 55%
59% 4,43,206
5,51,018
6,87,882
FY13 FY14 FY15
Consumer Finance Division Corporate & Commercial Banking
Comm. Vehicle Loans 15%
Utility Vehicle Loans
3% Small CV
3%
Two Wheeler Loans
4%
Car Loans 5%
Equipment Financing
4% Credit Card
1% Loan Against Property
5% Others 1%
Large Corporate
29%
Medium Corporate
17%
Small Business
13%
●Andhra Pradesh 5%
●Assam 2%
●Bihar 2%
Chandigarh 0% ●
●Chhatisgarh 3% Dadra & Nagar
Haveli 0%
● Delhi 2%
Goa 1% ●
●Gujarat 6%
Haryana 6% ●
●Himachal Pradesh 1%
●J&K 0%
●Jharkhand 3%
Karnataka 3% ●
Kerala 10% ●
●Madhya Pradesh 5%
●Maharashtra 5%
● Mizoram 0%
●Orissa 3%
● Pondicherry 0%
Punjab 4% ●
Rajasthan 11% ●
●Uttaranchal 0%
●West Bengal 6%
Sikkim 0% ●
●Tamil Nadu 10%
Tripura 1%
●UP 6%
●
●
16
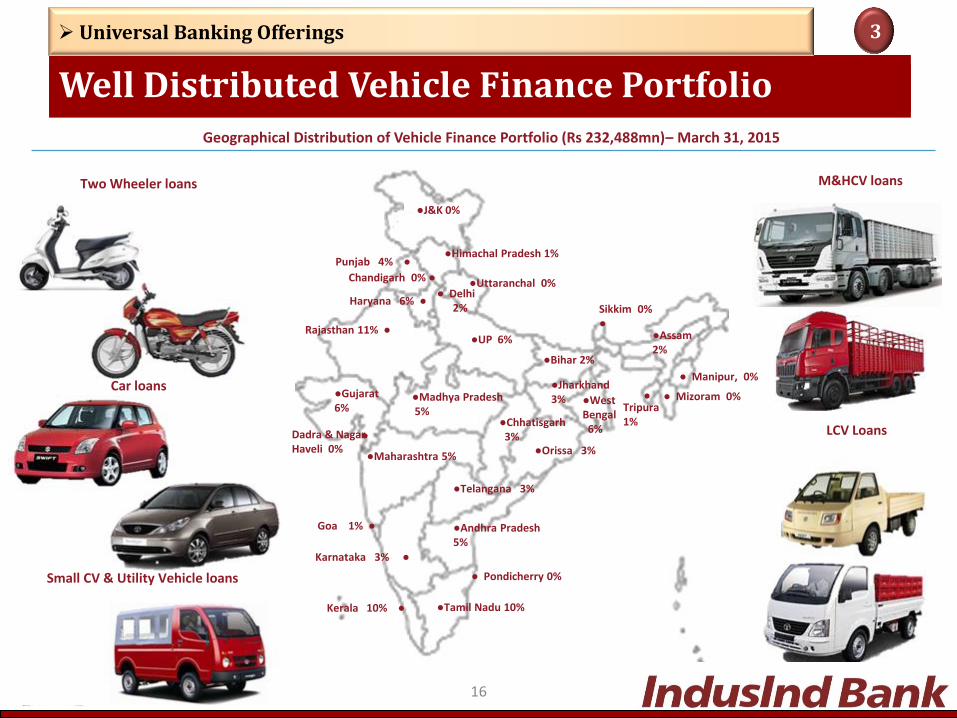
Well Distributed Vehicle Finance Portfolio
Universal Banking Offerings 3
Geographical Distribution of Vehicle Finance Portfolio (Rs 232,488mn)– March 31, 2015
Two Wheeler loans
Car loans
M&HCV loans
Small CV & Utility Vehicle loans
LCV Loans
●Telangana 3%
● Manipur, 0%
17
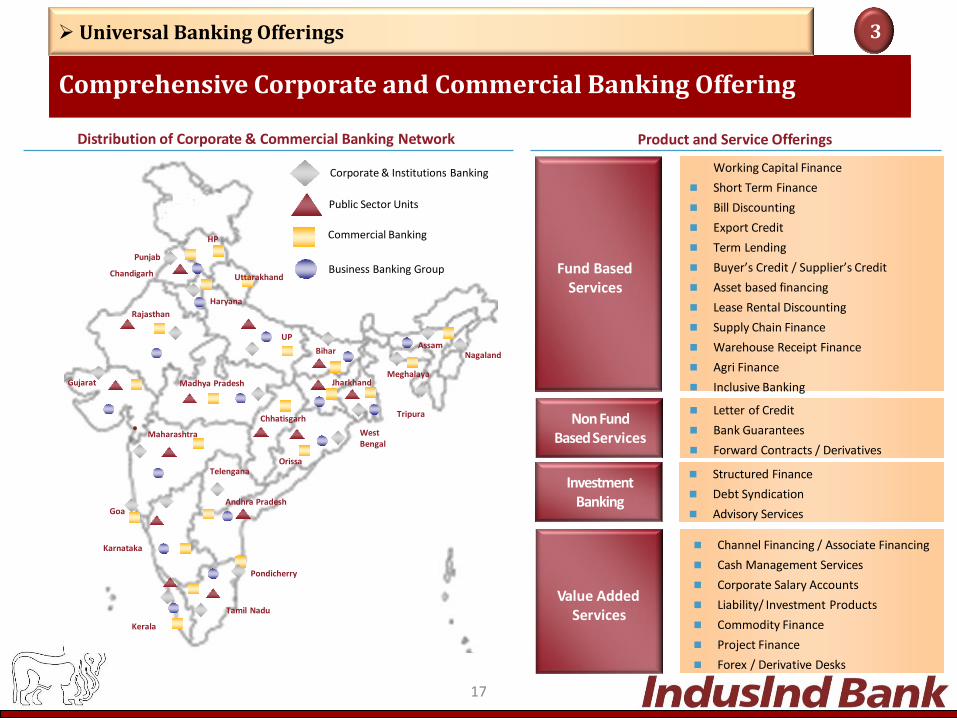
Distribution of Corporate & Commercial Banking Network Product and Service Offerings
Working Capital Finance
Short Term Finance
Bill Discounting
Export Credit
Term Lending
Buyer’s Credit / Supplier’s Credit
Asset based financing
Lease Rental Discounting
Supply Chain Finance
Warehouse Receipt Finance
Agri Finance
Inclusive Banking
Non Fund Based Services
Value Added Services
Letter of Credit
Bank Guarantees
Forward Contracts / Derivatives
Channel Financing / Associate Financing
Cash Management Services
Corporate Salary Accounts
Liability/ Investment Products
Commodity Finance
Project Finance
Forex / Derivative Desks
Fund Based Services
Comprehensive Corporate and Commercial Banking Offering
Universal Banking Offerings 3
Andhra Pradesh
Assam Bihar
Punjab
Chandigarh
Chhatisgarh
Gujarat
Haryana
Jharkhand
Karnataka
Kerala
Madhya Pradesh
Maharashtra
Orissa
Rajasthan
West Bengal
Tamil Nadu
UP
●
Corporate & Institutions Banking
Public Sector Units
Business Banking Group
Commercial Banking
Goa
Tripura
Nagaland
Meghalaya
Pondicherry
Uttarakhand
HP
Non Fund Based Services
Structured Finance
Debt Syndication
Advisory Services
Investment Banking
Telengana
18
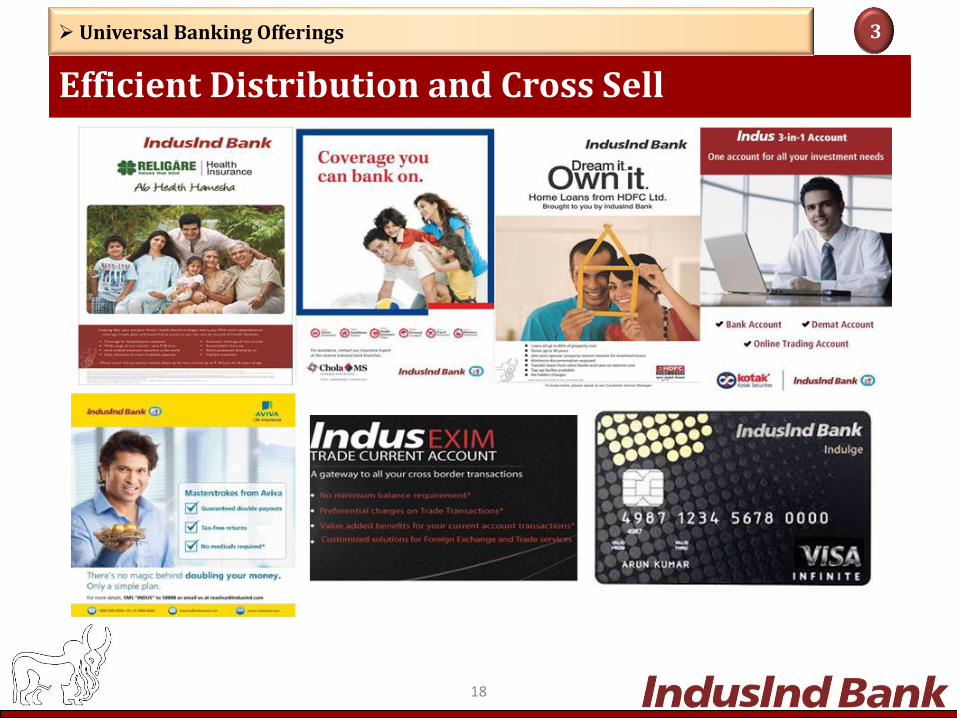
Efficient Distribution and Cross Sell
Universal Banking Offerings 3
19
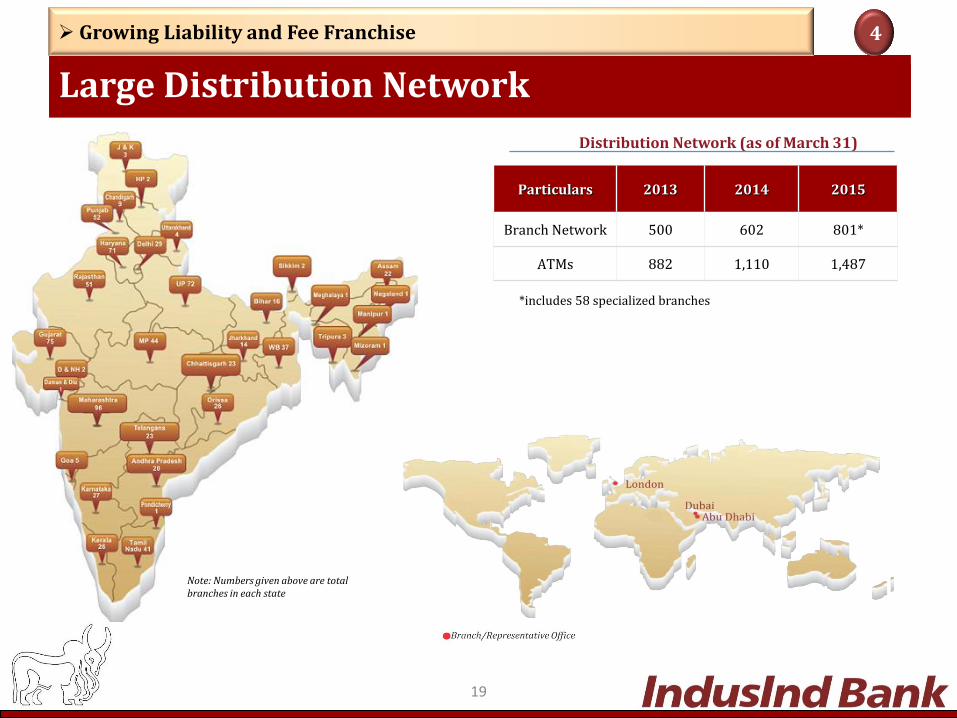
*includes 58 specialized branches
Particulars 2013 2014 2015
Branch Network 500 602 801*
ATMs 882 1,110 1,487
Distribution Network (as of March 31)
Large Distribution Network
Growing Liability and Fee Franchise 4
Note: Numbers given above are total branches in each state
20
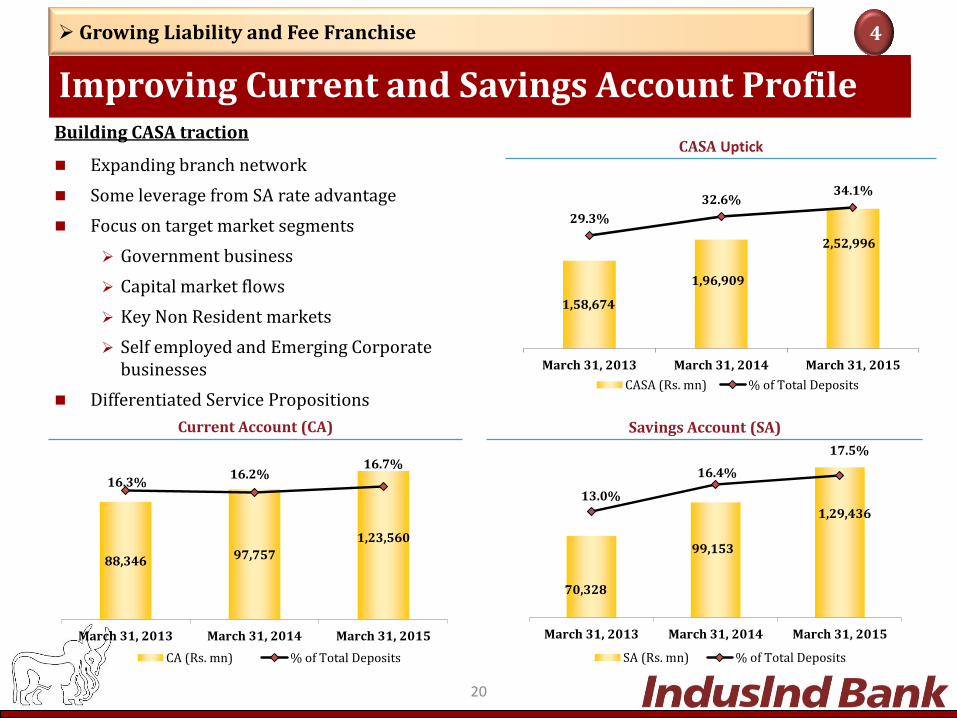
CASA Uptick
Savings Account (SA) Current Account (CA)
Building CASA traction
Expanding branch network
Some leverage from SA rate advantage
Focus on target market segments
Government business
Capital market flows
Key Non Resident markets
Self employed and Emerging Corporate businesses
Differentiated Service Propositions
Improving Current and Savings Account Profile
Growing Liability and Fee Franchise 4
1,58,674
1,96,909
2,52,996
29.3%
32.6% 34.1%
10%
16%
21%
27%
33%
38%
0
50,000
1,00,000
1,50,000
2,00,000
2,50,000
3,00,000
March 31, 2013 March 31, 2014 March 31, 2015
CASA (Rs. mn) % of Total Deposits
88,346 97,757
1,23,560
16.3% 16.2%
16.7%
5%
7%
9%
11%
13%
15%
17%
0
20,000
40,000
60,000
80,000
1,00,000
March 31, 2013 March 31, 2014 March 31, 2015
CA (Rs. mn) % of Total Deposits
70,328
99,153
1,29,436
13.0%
16.4%
17.5%
0.00%
4.00%
8.00%
12.00%
16.00%
20.00%
1
20,001
40,001
60,001
80,001
1,00,001
1,20,001
1,40,001
March 31, 2013 March 31, 2014 March 31, 2015
SA (Rs. mn) % of Total Deposits
21
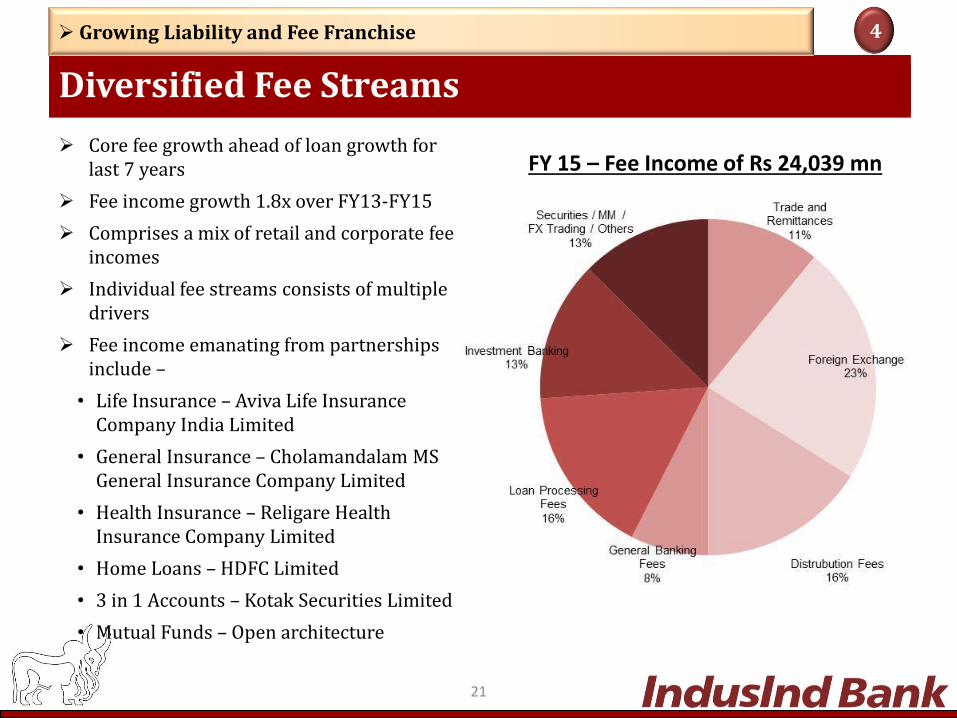
Diversified Fee Streams
Growing Liability and Fee Franchise 4
Core fee growth ahead of loan growth for last 7 years
Fee income growth 1.8x over FY13-FY15
Comprises a mix of retail and corporate fee incomes
Individual fee streams consists of multiple drivers
Fee income emanating from partnerships include –
• Life Insurance – Aviva Life Insurance Company India Limited
• General Insurance – Cholamandalam MS General Insurance Company Limited
• Health Insurance – Religare Health Insurance Company Limited
• Home Loans – HDFC Limited
• 3 in 1 Accounts – Kotak Securities Limited
• Mutual Funds – Open architecture
FY 15 – Fee Income of Rs 24,039 mn
22
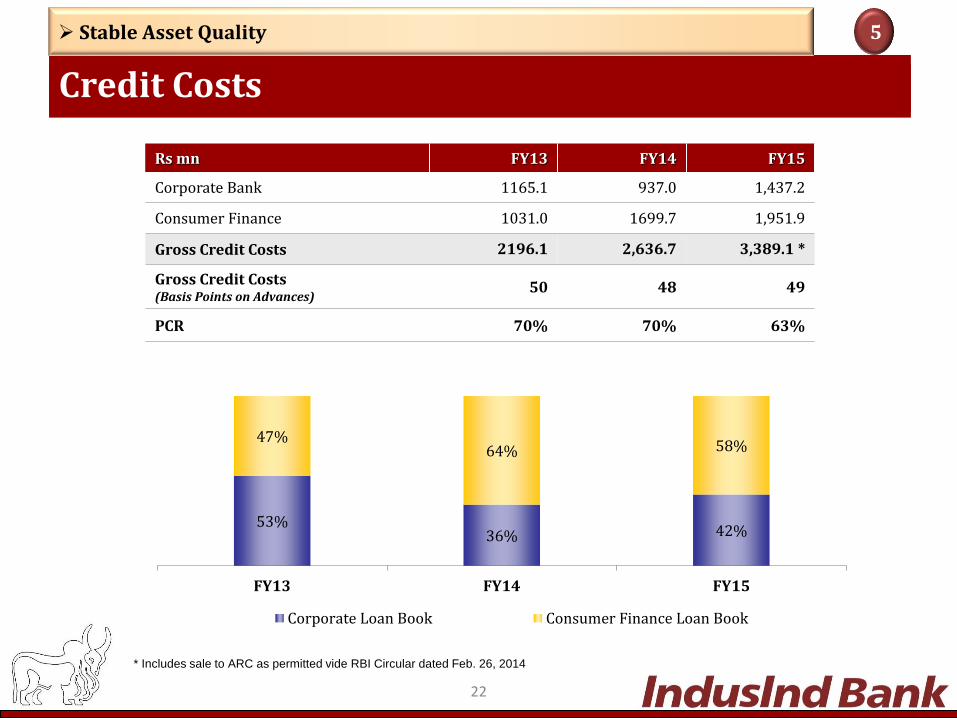
Rs mn FY13 FY14 FY15
Corporate Bank 1165.1 937.0 1,437.2
Consumer Finance 1031.0 1699.7 1,951.9
Gross Credit Costs 2196.1 2,636.7 3,389.1 *
Gross Credit Costs (Basis Points on Advances)
50 48 49
PCR 70% 70% 63%
53% 36% 42%
47% 64% 58%
FY13 FY14 FY15
Corporate Loan Book Consumer Finance Loan Book
Credit Costs
Stable Asset Quality 5
* Includes sale to ARC as permitted vide RBI Circular dated Feb. 26, 2014
23
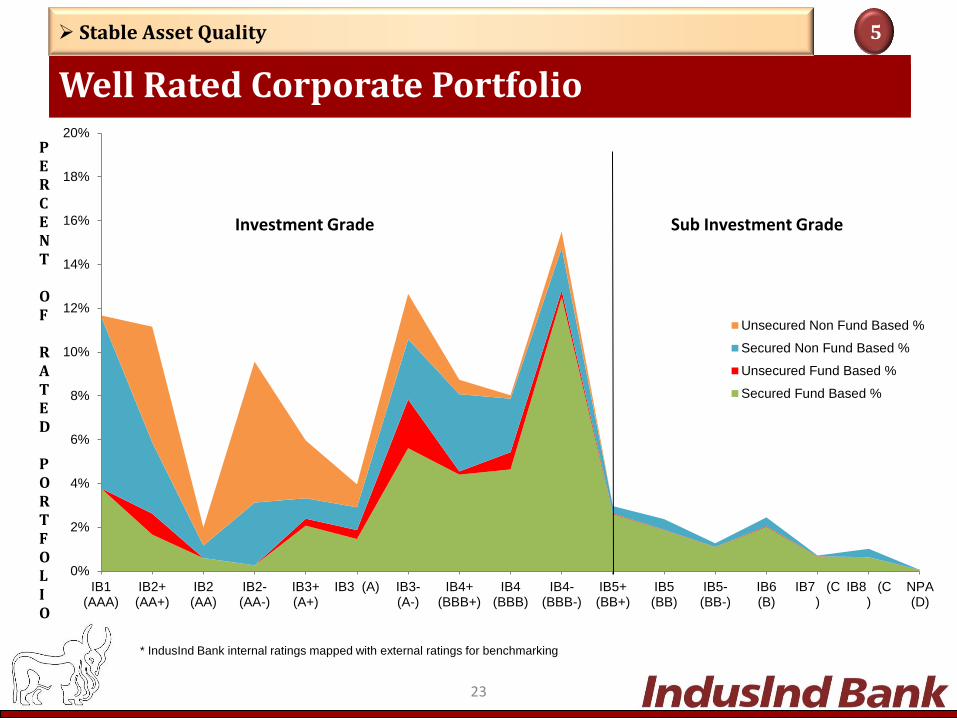
0%
2%
4%
6%
8%
10%
12%
14%
16%
18%
20%
IB1(AAA)
IB2+(AA+)
IB2(AA)
IB2-(AA-)
IB3+(A+)
IB3 (A) IB3-(A-)
IB4+(BBB+)
IB4(BBB)
IB4-(BBB-)
IB5+(BB+)
IB5(BB)
IB5-(BB-)
IB6(B)
IB7 (C)
IB8 (C)
NPA(D)
Unsecured Non Fund Based %
Secured Non Fund Based %
Unsecured Fund Based %
Secured Fund Based %
PERCENT OF RATED PORTFOLIO
Investment Grade Sub Investment Grade
Well Rated Corporate Portfolio
Stable Asset Quality 5
* IndusInd Bank internal ratings mapped with external ratings for benchmarking
24
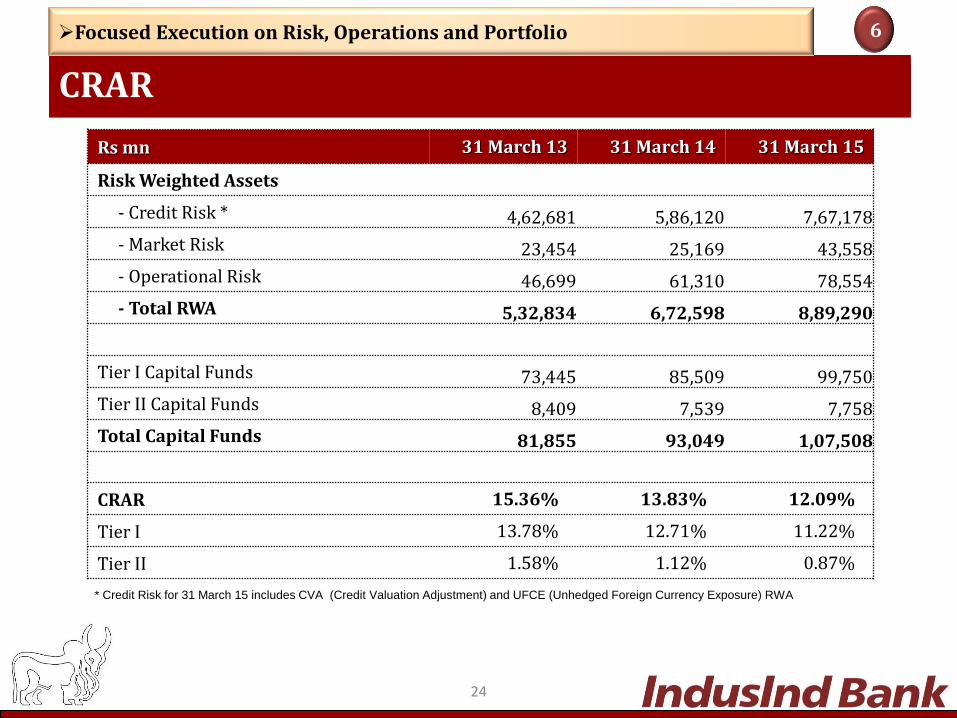
* Credit Risk for 31 March 15 includes CVA (Credit Valuation Adjustment) and UFCE (Unhedged Foreign Currency Exposure) RWA
Rs mn 31 March 13 31 March 14 31 March 15
Risk Weighted Assets
- Credit Risk * 4,62,681 5,86,120 7,67,178
- Market Risk 23,454 25,169 43,558
- Operational Risk 46,699 61,310 78,554
- Total RWA 5,32,834 6,72,598 8,89,290
Tier I Capital Funds 73,445 85,509 99,750
Tier II Capital Funds 8,409 7,539 7,758
Total Capital Funds 81,855 93,049 1,07,508
CRAR 15.36% 13.83% 12.09%
Tier I 13.78% 12.71% 11.22%
Tier II 1.58% 1.12% 0.87%
CRAR
Focused Execution on Risk, Operations and Portfolio 6
25
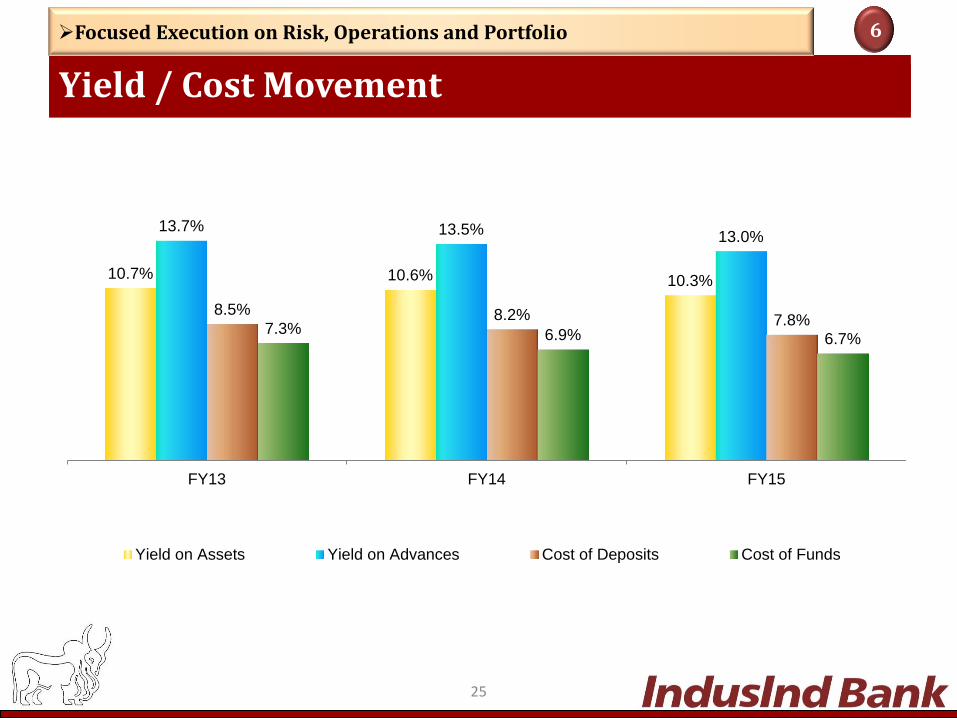
Yield / Cost Movement
Focused Execution on Risk, Operations and Portfolio 6
10.7% 10.6% 10.3%
13.7% 13.5% 13.0%
8.5% 8.2% 7.8% 7.3% 6.9% 6.7%
FY13 FY14 FY15
Yield on Assets Yield on Advances Cost of Deposits Cost of Funds
26
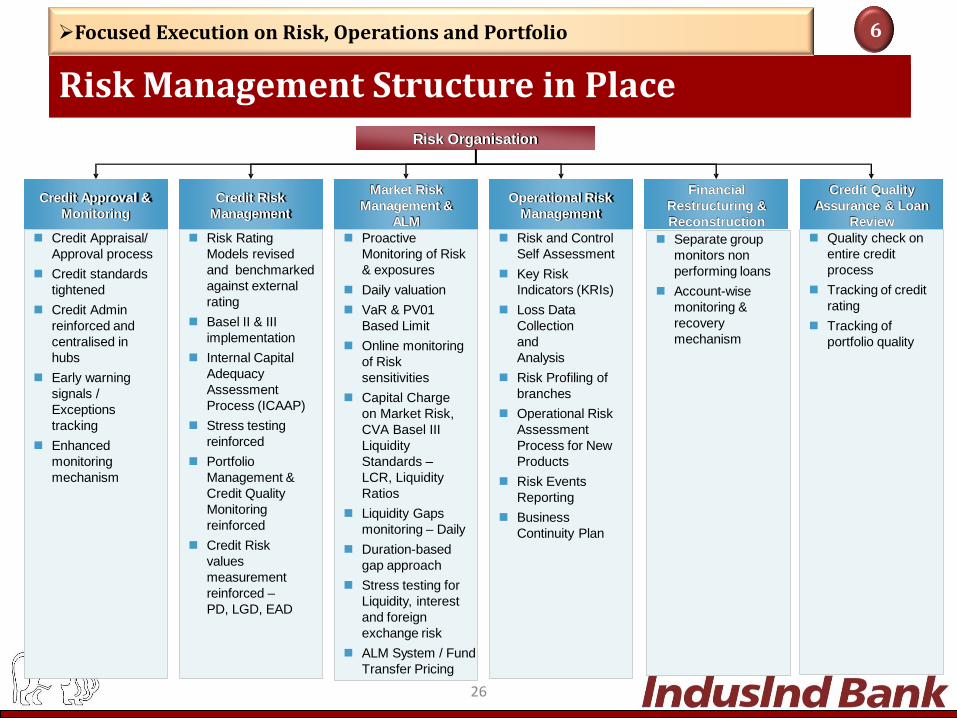
Risk Management Structure in Place
Focused Execution on Risk, Operations and Portfolio 6
Risk Organisation
Credit Approval &
Monitoring
Credit Risk
Management
Market Risk
Management &
ALM
Operational Risk
Management
Financial
Restructuring &
Reconstruction
Credit Quality
Assurance & Loan
Review
Risk and Control
Self Assessment
Key Risk
Indicators (KRIs)
Loss Data
Collection
and
Analysis
Risk Profiling of
branches
Operational Risk
Assessment
Process for New
Products
Risk Events
Reporting
Business
Continuity Plan
Separate group
monitors non
performing loans
Account-wise
monitoring &
recovery
mechanism
Quality check on
entire credit
process
Tracking of credit
rating
Tracking of
portfolio quality
Proactive
Monitoring of Risk
& exposures
Daily valuation
VaR & PV01
Based Limit
Online monitoring
of Risk
sensitivities
Capital Charge
on Market Risk,
CVA Basel III
Liquidity
Standards –
LCR, Liquidity
Ratios
Liquidity Gaps
monitoring – Daily
Duration-based
gap approach
Stress testing for
Liquidity, interest
and foreign
exchange risk
ALM System / Fund
Transfer Pricing
Risk Rating
Models revised
and benchmarked
against external
rating
Basel II & III
implementation
Internal Capital
Adequacy
Assessment
Process (ICAAP)
Stress testing
reinforced
Portfolio
Management &
Credit Quality
Monitoring
reinforced
Credit Risk
values
measurement
reinforced –
PD, LGD, EAD
Credit Appraisal/
Approval process
Credit standards
tightened
Credit Admin
reinforced and
centralised in
hubs
Early warning
signals /
Exceptions
tracking
Enhanced
monitoring
mechanism
27
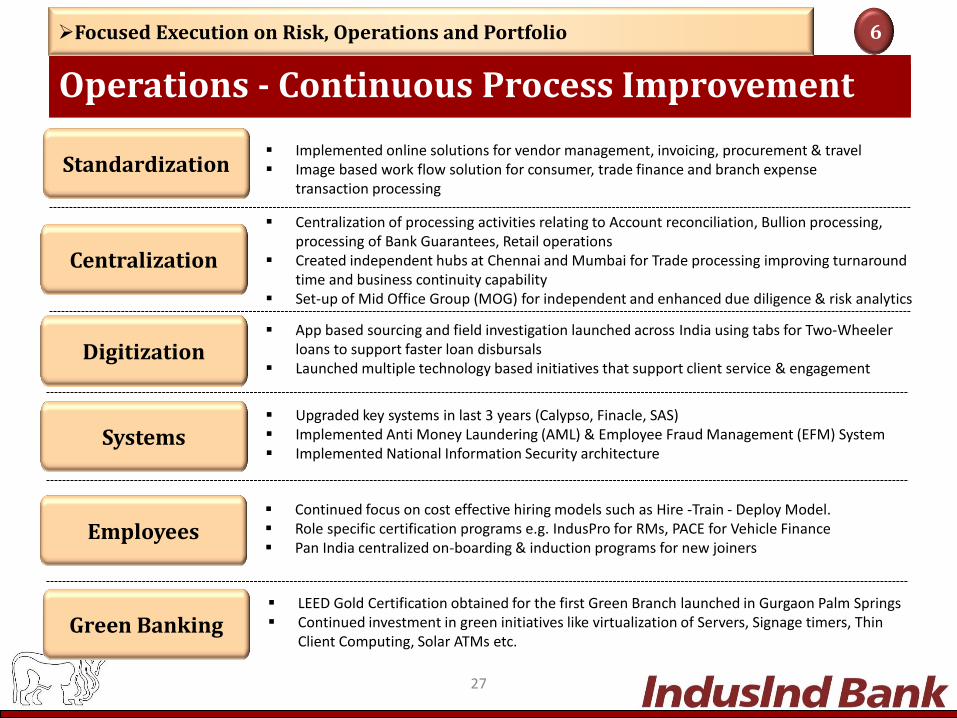
Standardization
Digitization
Systems
Green Banking
Implemented online solutions for vendor management, invoicing, procurement & travel Image based work flow solution for consumer, trade finance and branch expense
transaction processing
App based sourcing and field investigation launched across India using tabs for Two-Wheeler loans to support faster loan disbursals
Launched multiple technology based initiatives that support client service & engagement
Upgraded key systems in last 3 years (Calypso, Finacle, SAS) Implemented Anti Money Laundering (AML) & Employee Fraud Management (EFM) System Implemented National Information Security architecture
LEED Gold Certification obtained for the first Green Branch launched in Gurgaon Palm Springs Continued investment in green initiatives like virtualization of Servers, Signage timers, Thin
Client Computing, Solar ATMs etc.
Employees Continued focus on cost effective hiring models such as Hire -Train - Deploy Model. Role specific certification programs e.g. IndusPro for RMs, PACE for Vehicle Finance Pan India centralized on-boarding & induction programs for new joiners
Operations - Continuous Process Improvement
Focused Execution on Risk, Operations and Portfolio 6
Centralization
Centralization of processing activities relating to Account reconciliation, Bullion processing, processing of Bank Guarantees, Retail operations
Created independent hubs at Chennai and Mumbai for Trade processing improving turnaround time and business continuity capability
Set-up of Mid Office Group (MOG) for independent and enhanced due diligence & risk analytics
28
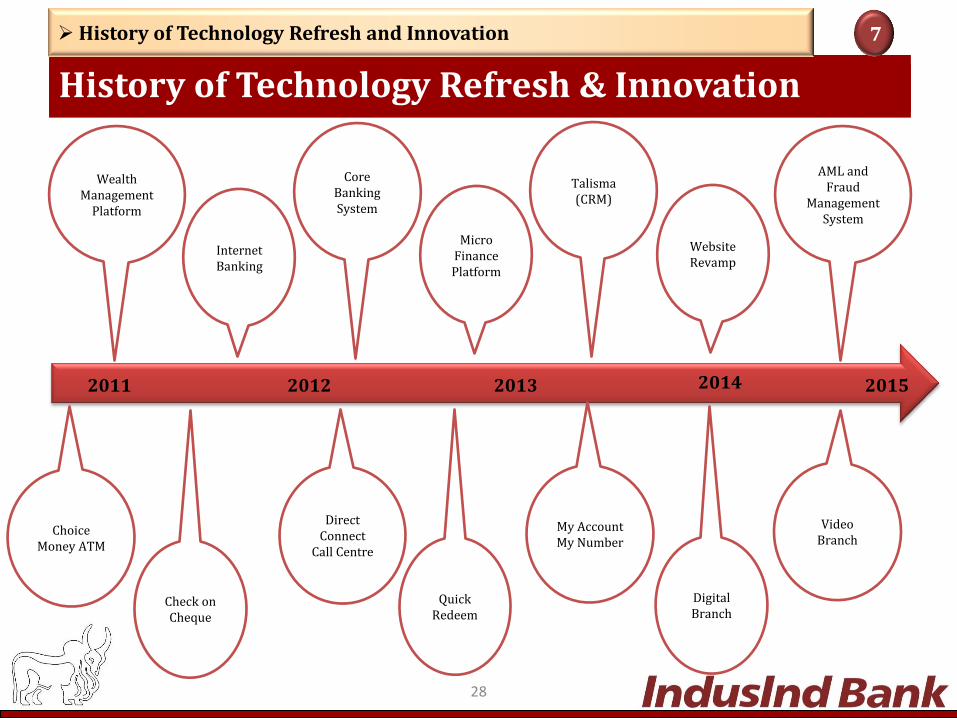
2015 2014 2013 2012 2011
Wealth Management
Platform
Internet Banking
Core Banking System
Micro Finance Platform
Talisma (CRM)
Website Revamp
AML and Fraud
Management System
Choice Money ATM
Check on Cheque
Direct Connect
Call Centre
Quick Redeem
My Account My Number
Digital Branch
Video Branch
History of Technology Refresh & Innovation
History of Technology Refresh and Innovation 7
29
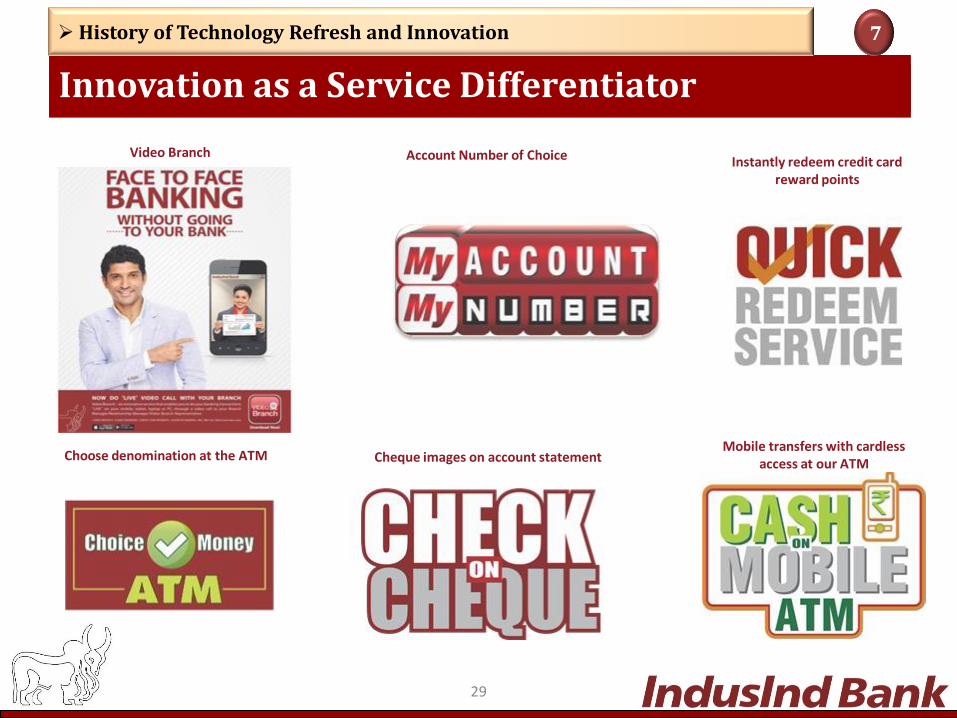
Video Branch
Choose denomination at the ATM
Account Number of Choice Instantly redeem credit card reward points
Cheque images on account statement Mobile transfers with cardless
access at our ATM
Innovation as a Service Differentiator
History of Technology Refresh and Innovation 7
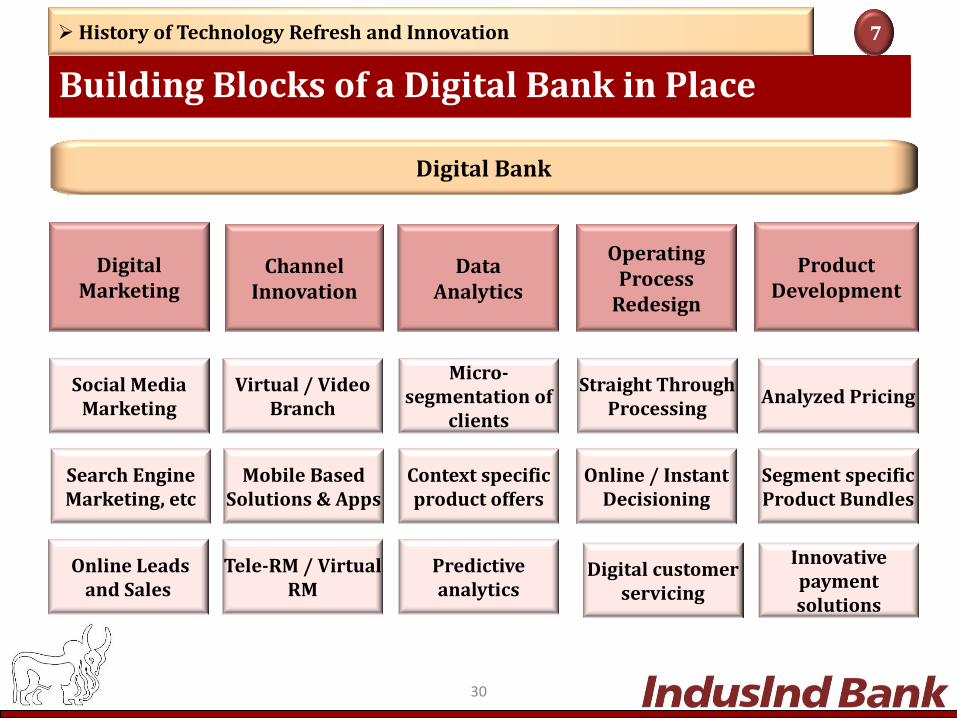
30
Digital Marketing
Data Analytics
Channel Innovation
Product Development
Operating Process
Redesign
Digital Bank
Social Media Marketing
Search Engine Marketing, etc
Virtual / Video Branch
Mobile Based Solutions & Apps
Micro-segmentation of
clients
Straight Through Processing
Online / Instant Decisioning
Analyzed Pricing
Segment specific Product Bundles
Tele-RM / Virtual RM
Context specific product offers
Predictive analytics
Building Blocks of a Digital Bank in Place
History of Technology Refresh and Innovation 7
Digital customer servicing
Innovative payment solutions
Online Leads and Sales
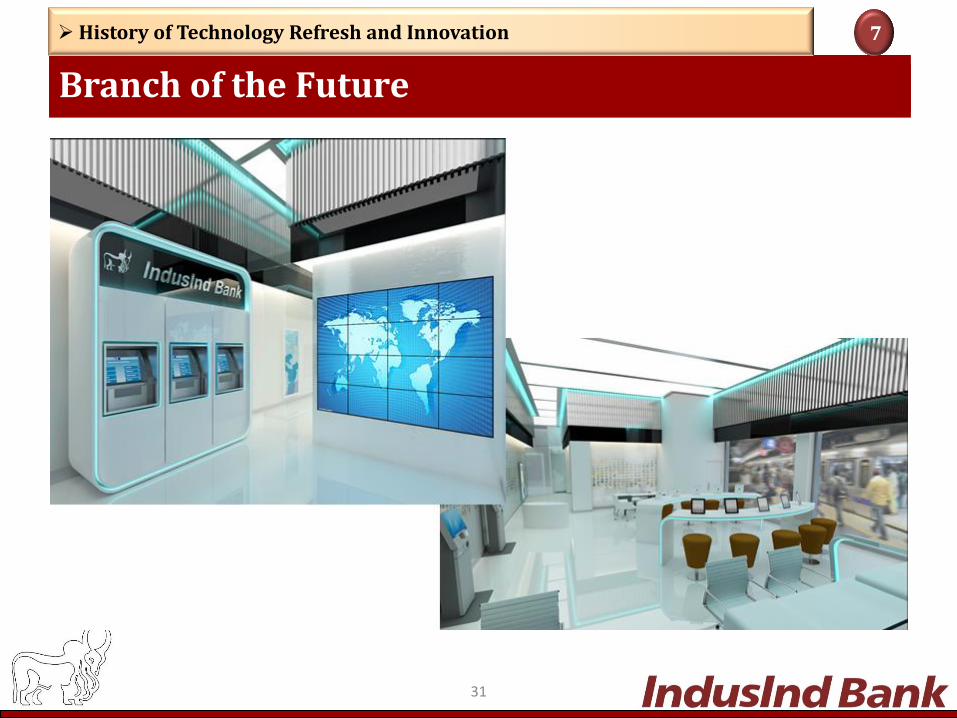
31
Branch of the Future
History of Technology Refresh and Innovation 7
Financial Performance
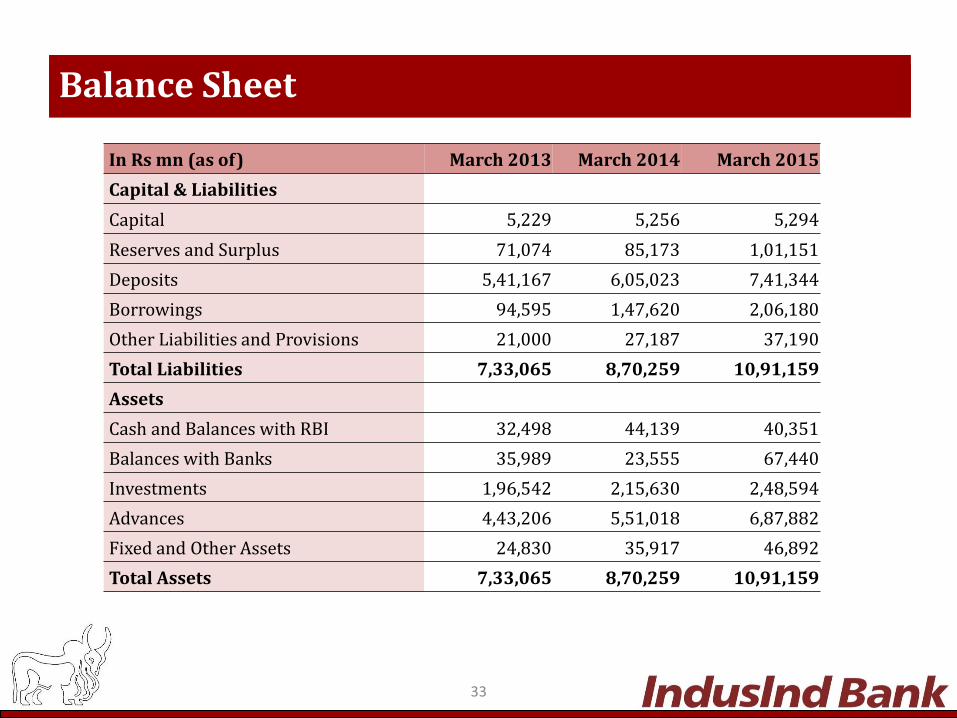
33
In Rs mn (as of) March 2013 March 2014 March 2015
Capital & Liabilities
Capital 5,229 5,256 5,294
Reserves and Surplus 71,074 85,173 1,01,151
Deposits 5,41,167 6,05,023 7,41,344
Borrowings 94,595 1,47,620 2,06,180
Other Liabilities and Provisions 21,000 27,187 37,190
Total Liabilities 7,33,065 8,70,259 10,91,159
Assets
Cash and Balances with RBI 32,498 44,139 40,351
Balances with Banks 35,989 23,555 67,440
Investments 1,96,542 2,15,630 2,48,594
Advances 4,43,206 5,51,018 6,87,882
Fixed and Other Assets 24,830 35,917 46,892
Total Assets 7,33,065 8,70,259 10,91,159
Balance Sheet
34
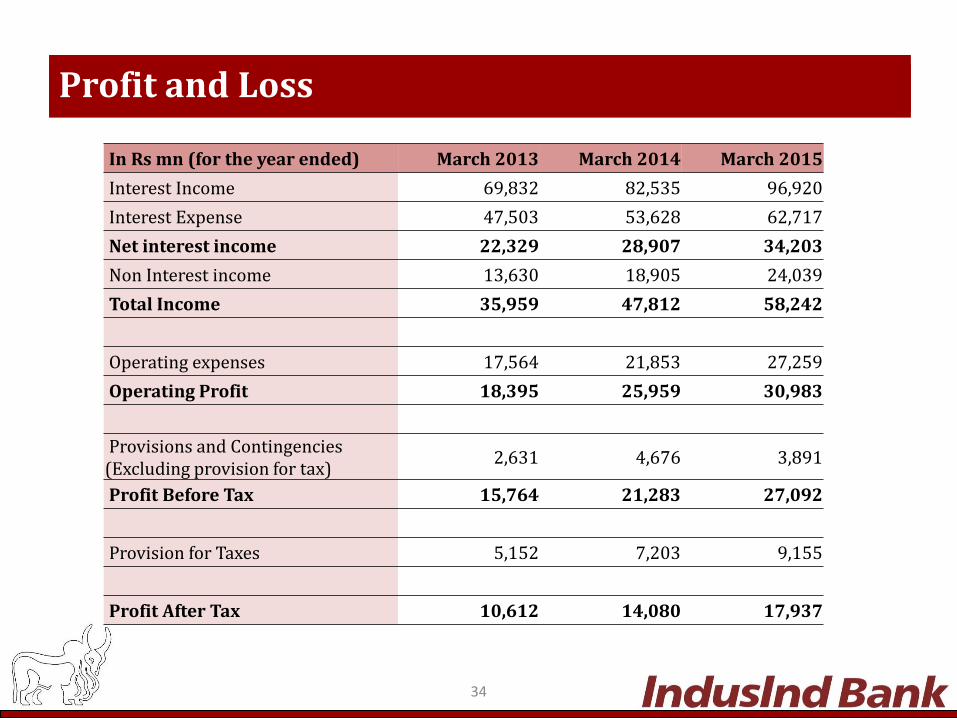
In Rs mn (for the year ended) March 2013 March 2014 March 2015
Interest Income 69,832 82,535 96,920
Interest Expense 47,503 53,628 62,717
Net interest income 22,329 28,907 34,203
Non Interest income 13,630 18,905 24,039
Total Income 35,959 47,812 58,242
Operating expenses 17,564 21,853 27,259
Operating Profit 18,395 25,959 30,983
Provisions and Contingencies (Excluding provision for tax)
2,631 4,676 3,891
Profit Before Tax 15,764 21,283 27,092
Provision for Taxes 5,152 7,203 9,155
Profit After Tax 10,612 14,080 17,937
Profit and Loss

Additional Information
36
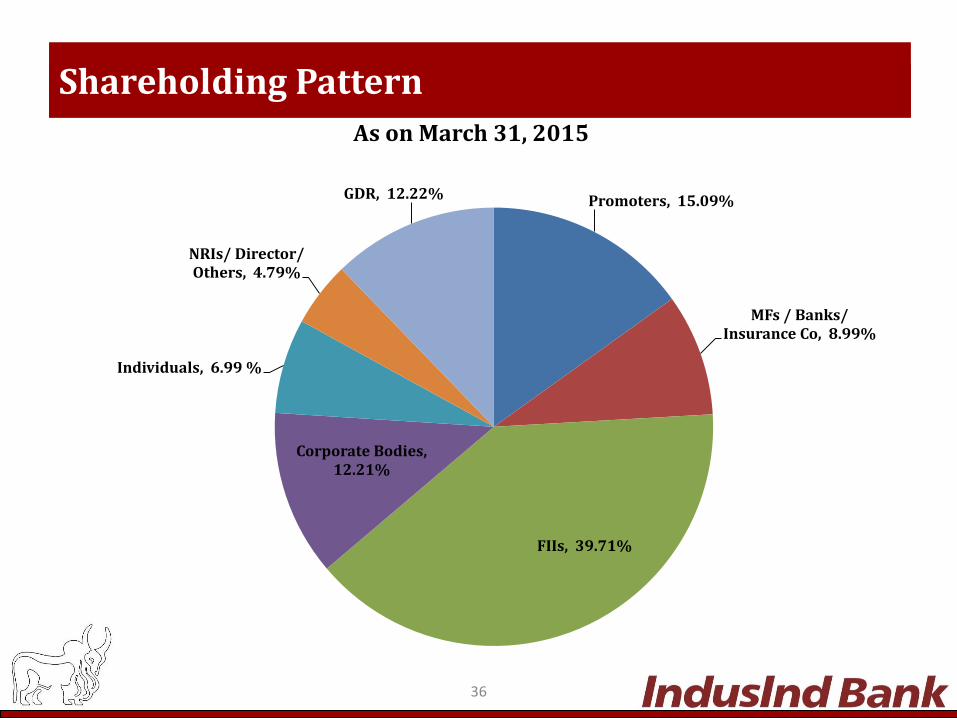
Shareholding Pattern
As on March 31, 2015
Promoters, 15.09%
MFs / Banks/ Insurance Co, 8.99%
FIIs, 39.71%
Corporate Bodies, 12.21%
Individuals, 6.99 %
NRIs/ Director/ Others, 4.79%
GDR, 12.22%

37
Ratings
ICRA AA+ for Lower Tier II subordinate debt program by ICRA
ICRA AA for Upper Tier II bond program by ICRA
CRISIL A1+ for certificate of deposit program by CRISIL
CARE AA+ for Lower Tier II subordinate debt program by CARE
IND A1+ for Short Term Debt Instruments by India Ratings and Research
IND AA+ for Lower Tier II subordinate debt program by India Ratings and Research
IND AA for Upper Tier II bond program by India Ratings and Research
IND AA+ for Senior unsecured bonds program by India Ratings and Research
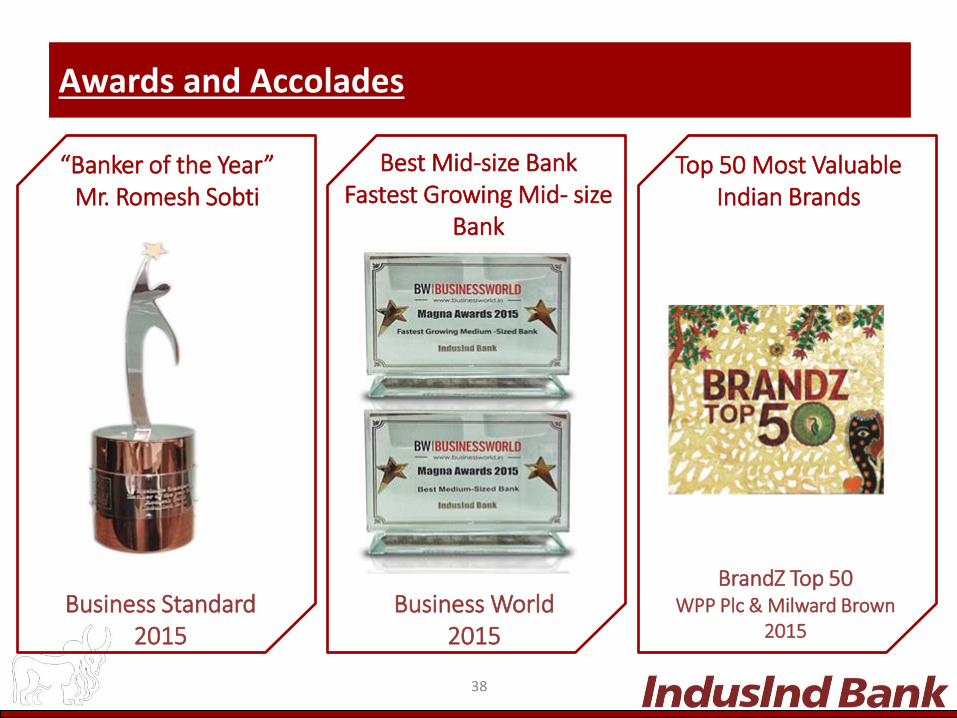
Awards and Accolades
Business Standard 2015
“Banker of the Year” Mr. Romesh Sobti
Business World 2015
Best Mid-size Bank Fastest Growing Mid- size
Bank
BrandZ Top 50 WPP Plc & Milward Brown
2015
Top 50 Most Valuable Indian Brands
38
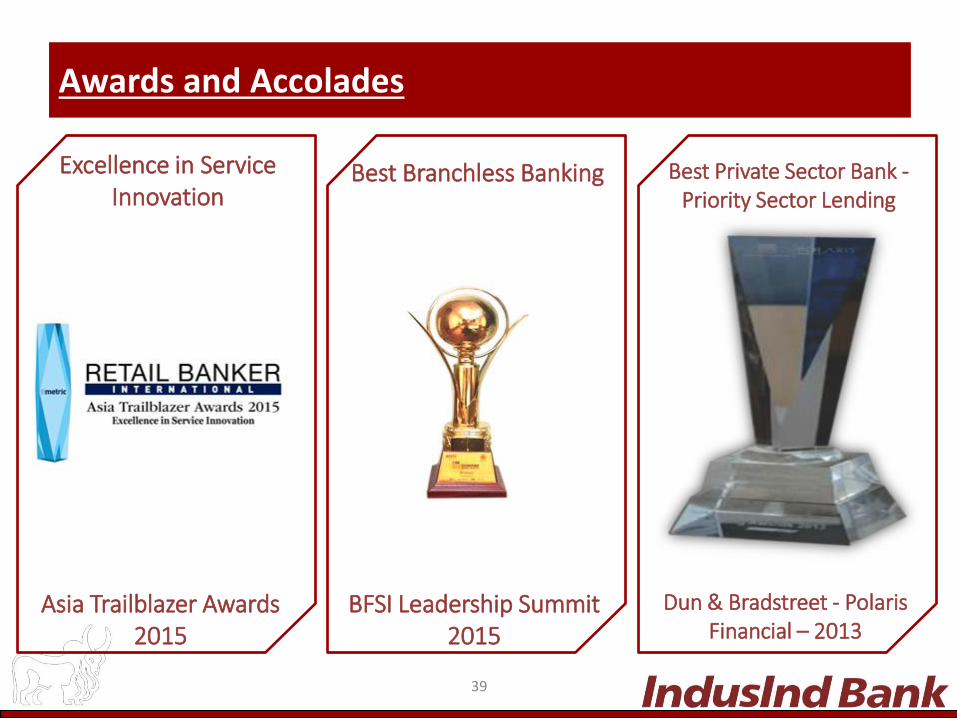
Awards and Accolades
Dun & Bradstreet - Polaris Financial – 2013
Best Private Sector Bank - Priority Sector Lending
Asia Trailblazer Awards 2015
Excellence in Service Innovation
BFSI Leadership Summit 2015
Best Branchless Banking
39
40
Disclaimer This presentation has been prepared by IndusInd Bank Limited (the “Bank”) solely for information purposes, without regard to any specific objectives, financial situations or informational needs of any particular person. All information contained has been prepared solely by the Bank. No information contained herein has been independently verified by anyone else. This presentation may not be copied, distributed, redistributed or disseminated, directly or indirectly, in any manner. This presentation does not constitute or form a part of and should not be construed directly or indirectly, as an offer or invitation, to purchase or subscribe for any securities of the Bank by any person in any jurisdiction, including India and the United States. No part of it should form the basis of or be relied upon in connection with any investment decision or any contract or commitment to purchase or subscribe for any securities. Any person placing reliance on the information contained in this presentation or any other communication by the Bank does so at his or her own risk and the Bank shall not be liable for any loss or damage however arising from this presentation, or its contents or otherwise therewith or caused pursuant to any act or omission based on or in reliance upon the information contained herein. No representation or warranty, express or implied, is made as to, and no reliance should be placed on, the fairness, accuracy, completeness or correctness of the information, estimates, projections or opinions contained in this presentation. Such information and opinions are in all events not current after the date of this presentation. Further, past performance is not necessarily indicative of future results. This presentation is not a complete description of the Bank. This presentation may contain statements that constitute forward-looking statements. All forward looking statements are subject to risks, uncertainties and assumptions that could cause actual results to differ materially from those contemplated by the relevant forward-looking statement. Important factors that could cause actual results to differ materially include, among others, future changes or developments in the Bank’s business, its competitive environment and political, economic, legal and social conditions. Given these risks, uncertainties and other factors, viewers of this presentation are cautioned not to place undue reliance on these forward-looking statements. The Bank disclaims any obligation to update these forward-looking statements to reflect future events or developments. Except as otherwise noted, all of the information contained herein is indicative and is based on management information, current plans and estimates in the form as it has been disclosed in this presentation and has not been independently verified. Any opinion, estimate or projection herein constitutes a judgment as of the date of this presentation and there can be no assurance that future results or events will be consistent with any such opinion, estimate or projection. The Bank may alter, modify or otherwise change in any manner the content of this presentation, without obligation to notify any person of such change or changes. The accuracy of this presentation is not guaranteed, it may be incomplete or condensed and it may not contain all material information concerning the Bank. This presentation is not an offering circular, offer letter, offering document, invitation or solicitation of an offer, a prospectus or an advertisement as defined under the Companies Act, 2013, together with the rules and regulations made thereunder, each as amended, the Securities and Exchange Board of India (Issue of Capital and Disclosure Requirements) Regulations, 2009, as amended, or any other applicable law in India. Figures for the previous period / year have been regrouped wherever necessary to conform to the current period’s / year’s presentation. Total in some
columns / rows may not agree due to rounding off. Note: All financial numbers in the presentation are from Audited Financials or based on Management estimates.

Thank You