cover page - government of india, ministry of human...
TRANSCRIPT
STATUS OF INTERNATIONAL STUDENTS IN
INDIA FOR HIGHER EDUCATION
2014

Contents
Acknowledgements 3
International Student Mobility in INDIA 4
Indian Students Studying Abroad 5
Foreign Students in INDIA 6
Students from SAARC Region in INDIA 7
Section 1 Foreign Students at the Under‐Graduate Level 8
Section 1.1 Female Enrolment among Foreign Students at the Under‐Graduate Level 12
Section 2 Foreign Student at the Post Graduate Level 15
Section 2.1 Female Enrolment among Foreign Students at the Post‐Graduate Level 17
Section 3 Foreign Students at Doctoral Level 18
Conclusion 19
References 21
List of Figures Figure 1
Percentage enrolments from top ten countries of origin of foreign students in India,2010‐11 and 2011‐12
6
Figure 2 Popular subjects among foreign students at the under‐graduate level, 2010‐11 and 2011‐12
8
Figure 3 Percentage of female enrolled in popular subjects at the under‐graduate level, 2011‐12 12
Figure 4 Popular subjects among foreign students at the post‐graduate level 15
Figure 5 Percentage of female enrolled in popular subjects at the post‐graduate level, 2011‐12
17
Figure 6 Distribution of foreign enrolment at the doctoral level by country of origin, 2011‐12
18
List of Tables Table 1
Top ten sources of internationally mobile students worldwide, 1995, 2005 and 2012 4
Table 2 Top Ten destinations of Indian students, 2005,2008 and 2012 5
Table 3 Mobile students from the SAARC Region to India, USA, UK and Australia in 2011‐12
7
Table 4 Enrolment by country of origin in popular subjects at the under‐graduate level, 2011‐12
9
Table 5 State‐wise foreign enrolment in popular subjects at the under‐graduate level, 2011‐12
10
Table 6 Contribution of top ten and SAARC countries in popular subjects, 2011‐12 11
Table 7 Female enrolment in popular subjects and highest enrolling state by subject, 2011‐12
13
Table 8 Percentage of female foreign enrolment and the proportion at home country, 2011‐12
14
Table 9 Top 3 countries making contribution in enrolment in popular subjects at the post‐graduate level, 2011‐12
16
Table 10 State‐wise highest contribution in enrolment in popular subjects at the post‐graduate level, 2011‐12
16
List of Boxes Box 1 Definitions of international (or internationally mobile) students 4
List of Annexures Annex 1 Enrolment of foreign students in major Programmes 2010‐2011 T‐1 Annex 2 Enrolment of foreign students in Ph.D. by country 2010‐11 T‐5 Annex 3 Enrolment of foreign students in M.A by country 2010‐11 T‐7 Annex 4 Enrolment of foreign students in MBA by country 2010‐11 T‐11 Annex 5 Enrolment of foreign students in M.Sc. by country 2010‐11 T‐13 Annex 6 Enrolment of foreign students in MBBS by country 2010‐11 T‐15 Annex 7 Enrolment of foreign students in B.Tech. by country 2010‐11 T‐17
Annex 8 Enrolment of foreign students in Bachelor of Science in Nursing by country 2010‐11 T‐20
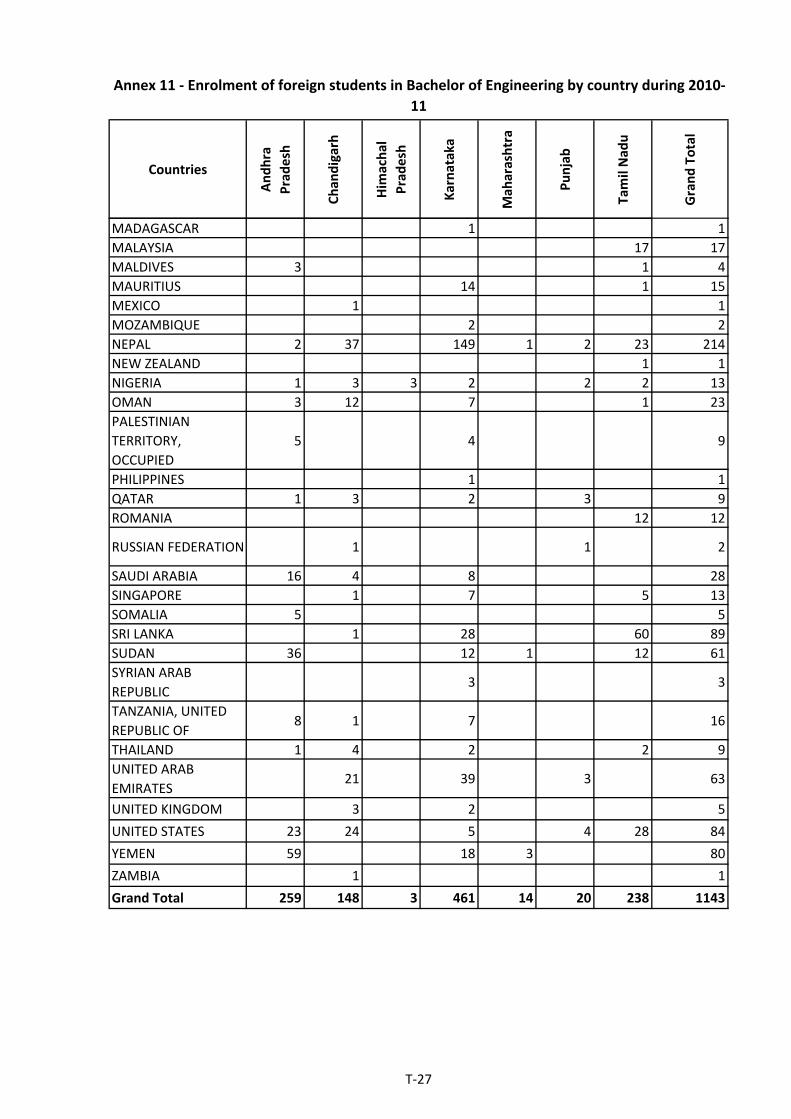
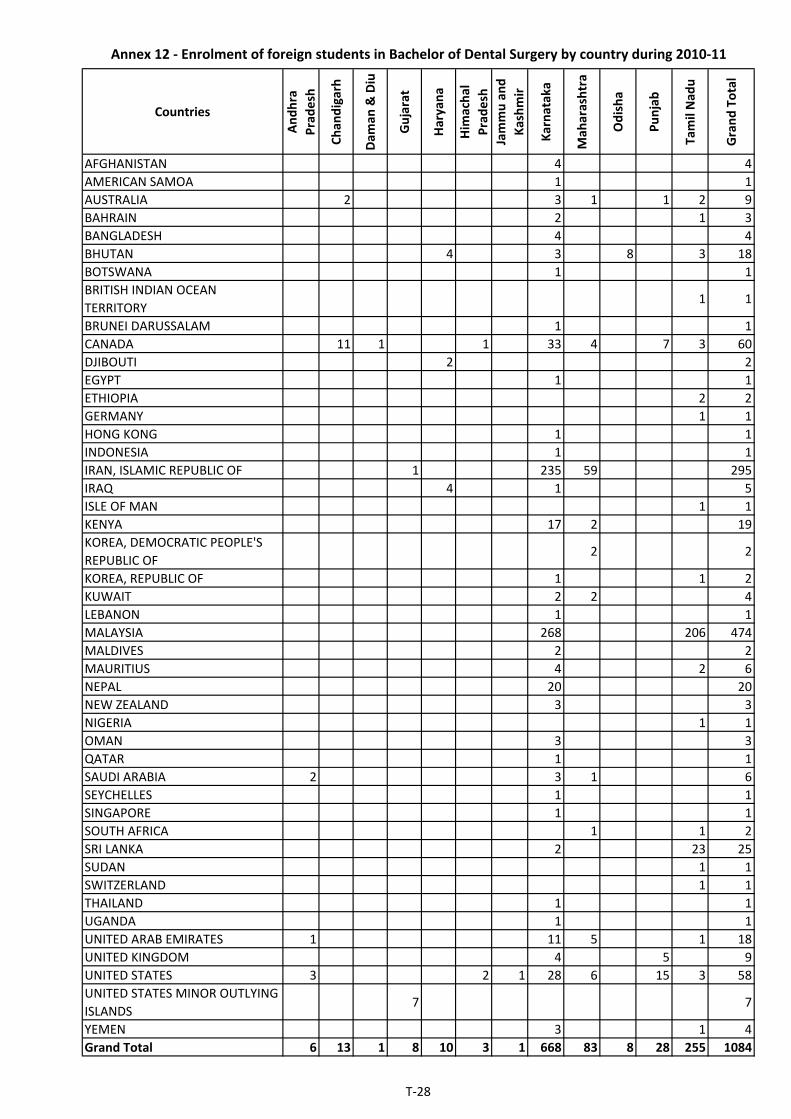
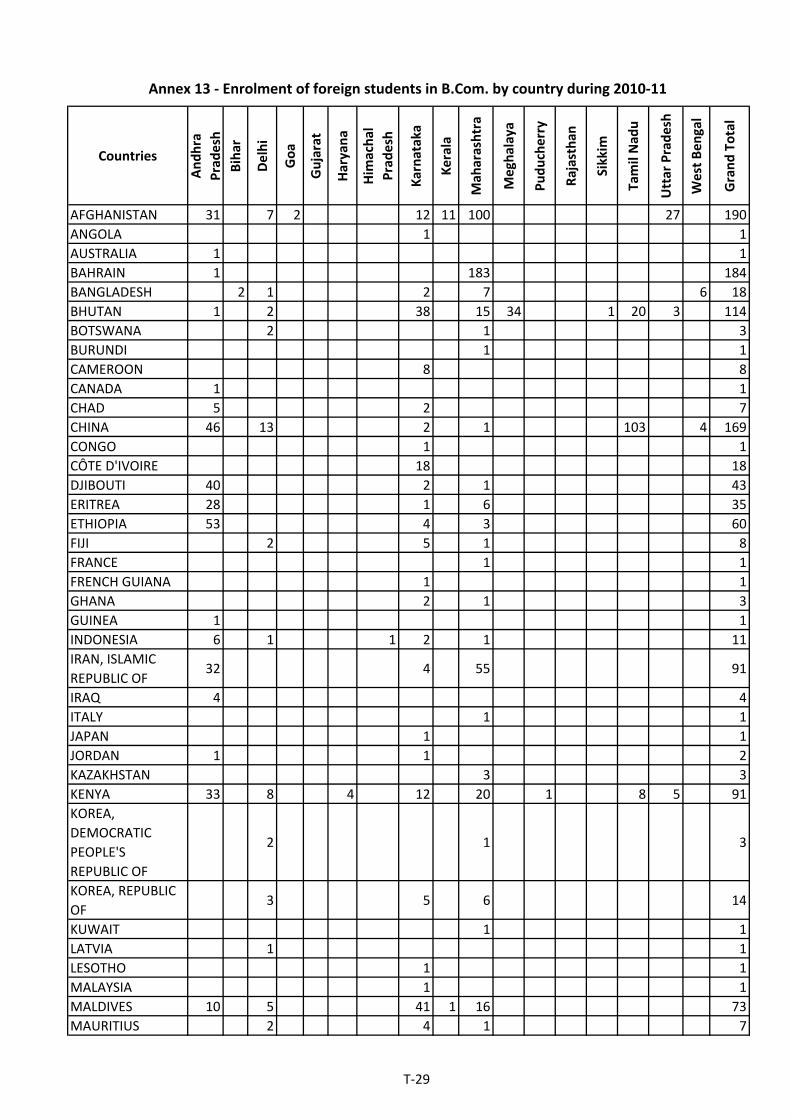
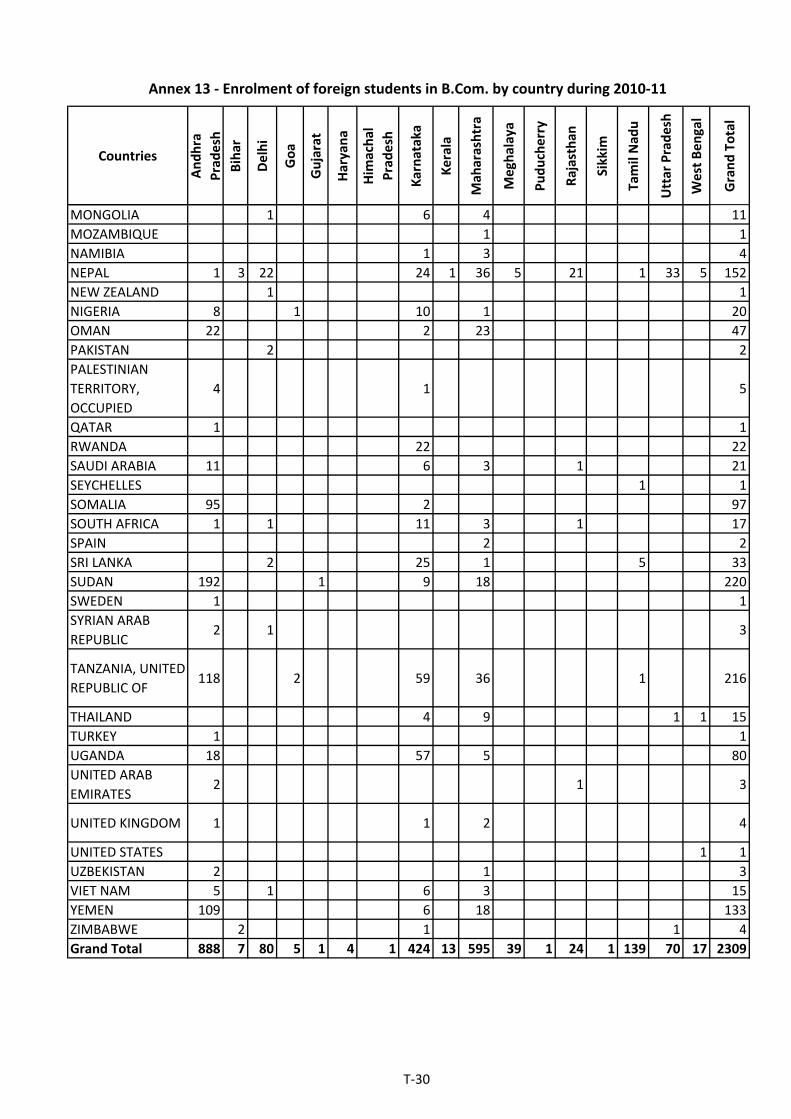
Annex 9 Enrolment of foreign students in B.Sc. by country 2010‐11 T‐21 Annex 10 Enrolment of foreign students in Bachelor of Pharmacy by country 2010‐11 T‐25 Annex 11 Enrolment of foreign students in Bachelor of Engineering by country 2010‐11 T‐26 Annex 12 Enrolment of foreign students in Bachelor of Dental Surgery by country 2010‐11 T‐28 Annex 13 Enrolment of foreign students in B.Com. by country 2010‐11 T‐29
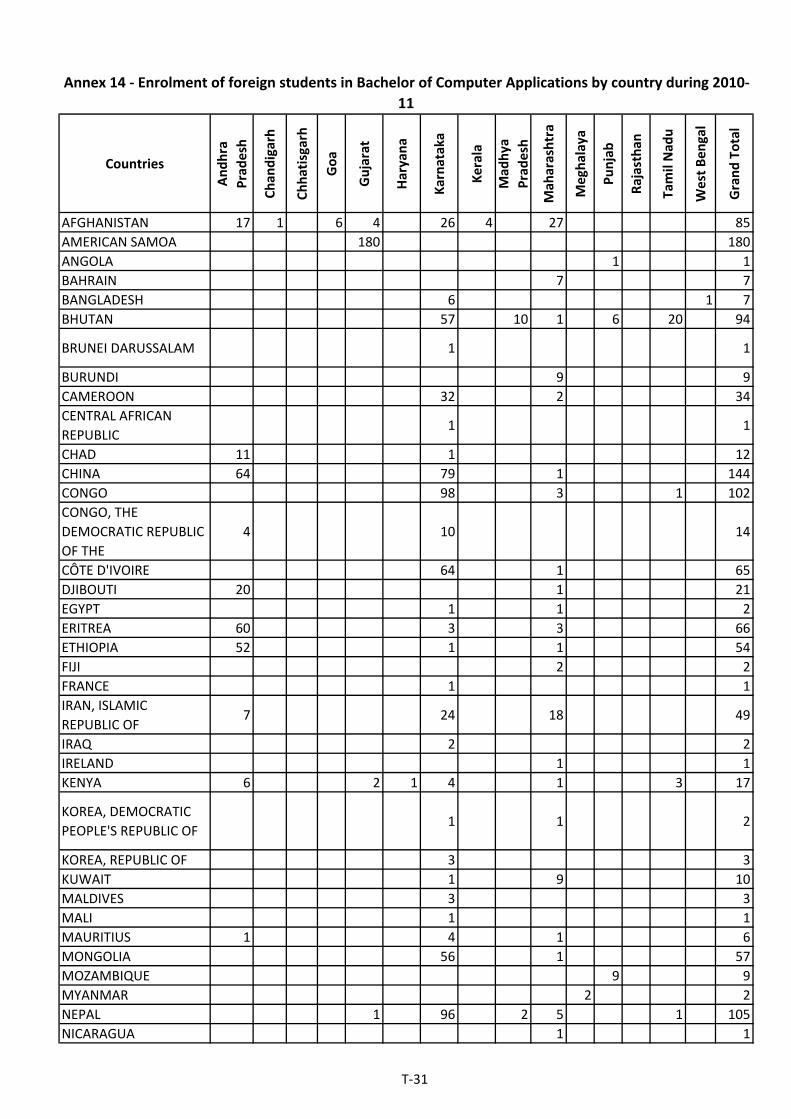
Annex 14 Enrolment of foreign students in Bachelor of Computer Applications by country 2010‐11
T‐31
Annex 15 Enrolment of foreign students in Bachelor of Business Management by country 2010‐11
T‐33
Annex 16 Enrolment of foreign students in Bachelor of Business Administration by country 2010‐11 T‐35
Annex 17 Enrolment of foreign students in B.A. by country 2010‐11 T‐37 Annex 18 Enrolment of foreign students in major Programmes 2011‐2012 T‐41 Annex 19 Enrolment of foreign students in Ph.D. by country 2011‐12 T‐45 Annex 20 Enrolment of foreign students in M.A by country 2011‐12 T‐47 Annex 21 Enrolment of foreign students in MBA by country 2011‐12 T‐51 Annex 22 Enrolment of foreign students in M.Sc. by country 2011‐12 T‐53 Annex 23 Enrolment of foreign students in MBBS by country 2011‐12 T‐55 Annex 24 Enrolment of foreign students in B.Tech. by country 2011‐12 T‐56
Annex 25 Enrolment of foreign students in Bachelor of Science in Nursing by country 2011‐12 T‐60
Annex 26 Enrolment of foreign students in B.Sc. by country 2011‐12 T‐61 Annex 27 Enrolment of foreign students in Bachelor of Pharmacy by country 2011‐12 T‐65 Annex 28 Enrolment of foreign students in Bachelor of Engineering by country 2011‐12 T‐66 Annex 29 Enrolment of foreign students in Bachelor of Dental Surgery by country 2011‐12 T‐68 Annex 30 Enrolment of foreign students in B.Com. by country 2011‐12 T‐69
Annex 31 Enrolment of foreign students in Bachelor of Computer Applications by country 2011‐12
T‐71
Annex 32 Enrolment of foreign students in Bachelor of Business Management by country 2011‐12
T‐73
Annex 33 Enrolment of foreign students in Bachelor of Business Administration by country 2011‐12 T‐75
Annex 34 Enrolment of foreign students in B.A. by country 2011‐12 T‐77


INTERNATIONAL STUDENT MOBILITY IN INDIA
According to the UNESCO Institute for Statistics (UIS), the number of internationally mobile students globally1 has
increased to 4.0 million in 2012 with a 135 percentage increment from 1.7 million in 1995 (see Box 1 and Table 1).
China has been the largest contributor of the world’s mobile students since 1995. India became the second largest
contributor since 2005.
Table 1: Top ten sources of internationally mobile students worldwide, 1995, 2005 and 2012
1995 2005 2012
Country Number Country Number Country Number
China 115871 China 403128 China 694365
Republic of Korea 69736 India 146267 India 189472
Japan 62324 Republic of Korea 100895 Republic of Korea 123674
Germany 45432 Japan 64291 Germany 117576
Greece 43941 Germany 64263 Saudi Arabia 62535
Malaysia 41159 Turkey 53402 France 62416
India 39626 United States 50850 United States 58133
Turkey 37629 France 49177 Malaysia 55579
Italy 36515 Morocco 46009 Viet Nam 53802
Hong Kong 35141 Canada 43335 Iran (Islamic Republic of) 51549Total 1702788 Total 2830788 Total 4009312
Source: Wit (2008: 33–34) for 1995 and UNESCO Institute for Statistics (UIS) for 2005 and 2012
1 The use of the word “internationally mobile students” or “international students” in this section is only for exposition purpose. Hereon, “foreign” students in India and “mobile students” will be used interchangeably.
Box 1: Definitions of international (or internationally mobile) students
International (or internationally mobile) students are defined as students who have crossed a national border and moved to
another country with the objective of studying. Two operational definitions are used in the international dataset developed by the
UIS, the Organization of for Economic Co‐operation and Development (OECD) and Eurostat:
Students who are not usual residents of their country of study i.e. those who have recently moved to the destination
(host) country from somewhere else
Students who received their prior qualifying education in another country, indicating that they have crossed a border
When data on these two definition characteristics are not available, data on foreign students (who are non‐citizens of the country
in which they study) and commonly used as a proxy for international (or internationally mobile) students.
Currently, the international dataset does not include students in exchange programs that usually last less than a school year and
who fulfils part of the studies at an educational institution abroad but are credited at their home institutions.
Source: UNESCO –UIS/OECD/Eurostat (2013)

5
INDIAN STUDENTS STUDYING ABROAD
In 2012, over 189 thousand Indian students were enrolled in higher education institutions abroad. This population
accounts for 4.7% of the total internationally mobile students worldwide and is the second largest source of
foreign students after China (17.3%). Despite its magnitude, this population represents a small proportion (0.7%)
of total higher education enrolment in India (29.18 million). At the same time, India’s gross outbound enrolment
ratio2 is of 0.11%, which is quite low compared with many other Asian countries, such as China (0.6%), Japan
(0.5%), Malaysia (1.9%), the Republic of Korea (3.6%), and Sri Lanka (1.0%).
Indian foreign students are dispersed over 50 countries of the world3. Out of the 189, 472 Indian foreign students
in 2012, more than 85% students were concentrated in six countries: the United States (51%), United Kingdom
(16%), Australia (6%), Canada (4%), United Arab Emirates (4%) and New Zealand (4%). It is noted that between
2008 and 2012, the popularity of Australia as a destination for Indian students has declined. There were 55%
fewer students in 2012 as compared to 2008 (Table 2).
Table 2: Top Ten destinations of Indian students, 2005,2008 and 2012
2005 2008 2012
Country Number Country Number Country Number
United States 84044 United States 94664 United States 97120
Australia 20515 Australia 26520 United Kingdom 29713
United Kingdom 16685 United Kingdom 25901 Australia 11684
United Arab Emirates 6684 Russian Federation 4314 Canada 8142
Germany 4339 New Zealand 4094 United Arab Emirates 7310
Canada 2829 Germany 3257 New Zealand 7248
New Zealand 1563 Canada 3219 Germany 4312
Kazakhstan 1003 Ukraine 1785 Russian Federation 3351
Ukraine 957 Cyprus 1076 Ukraine 2516
Malaysia 828.5 Malaysia 1065 France 1955
WORLDWIDE 146267 WORLDWIDE 176881 WORLDWIDE 189472
Source: UNESCO Institute for Statistics (UIS)
2Gross outbound enrolment ratio, which is the total number of students from a given country studying abroad, expressed as a percentage of the population of tertiary age in that country. Outbound enrolment ratio is the total number of students from a given country who are studying abroad, expressed as a percentage of total tertiary enrolment in that country. Inbound enrolment ratio is the number of students from abroad studying in a given country as a percentage of total tertiary enrolment in that country. 3Counted only if number of Indian students in a particular country are more than 10 in 2011

6
FOREIGN STUDENTS IN INDIA
India is gradually emerging as a preferred destination for foreign students, particularly from the South Asian
region. The growth in the number of foreign students in India has been impressive. The recent data for 2011‐12
shows that within a year, India received 5625 more students, an increase of almost 20.43% from the last year4. In
2011, these students came from 153 countries. India is slowly expanding not only in terms of the number of
students but also the number countries from which these students come.
According to the All India Survey on Higher Education (AISHE) 2011‐12, Nepal contributed the highest percentage
of foreign students in India. Of the total foreign students, nearly 19% were from Nepal, followed by, in descending
order, Bhutan, Iran, Afghanistan, Malaysia, Sudan and Iraq (Figure 1). Even though, the share of foreign students
from the top ten countries has increased in a year’s time, the rise is not uniform. The top ten countries of foreign
students in India constitute 62% of the total foreign students in the country. The rise in the number of students
from Nepal and Bhutan has been the highest, while the number from United States, China and Iran has declined
compared with 2010‐11.
Out of the total foreign students, 76% came to India for under‐graduate5 studies and 18% came for post‐graduate
studies6. The remaining who came for their Ph.D.7 studies were from Iran (39%), Iraq (5%). Nepal, which was the
highest contributor for students at the under‐graduate level had only 3% share of its students enrolled at the
doctoral level. Interestingly, out of the total 983 foreign students who came to India for higher studies from United
States only six were enrolled at the Ph.D. level (Annex 19).
Source: All India Survey on Higher Education
4Number of foreign students in 2000 was 6,988. In 2011 and 2012 the numbers of foreign students were 27531 and 33156 respectively. 5Under graduate level broadly refers to ISCED 6 first as per ISCED 2011 classification 6Post graduate level broadly refers to ISCED 7 second degree as per ISCED 2011classification 7Ph.D. refers to ISCED Level 8 and students enrolled in Doctor of Philosophy
010203040506070
Nepal
Afghan
istan
Iran
Bhutan
Sudan
United States
China
Iraq
Sri Lan
ka
Malaysia
Total from top
ten sources
Figure 1: Percentage enrolments from top ten countries of origin of foreign students in India,2010‐11 and 2011‐12
2010‐11
2011‐12
7
STUDENTS FROM SAARC REGION IN INDIA
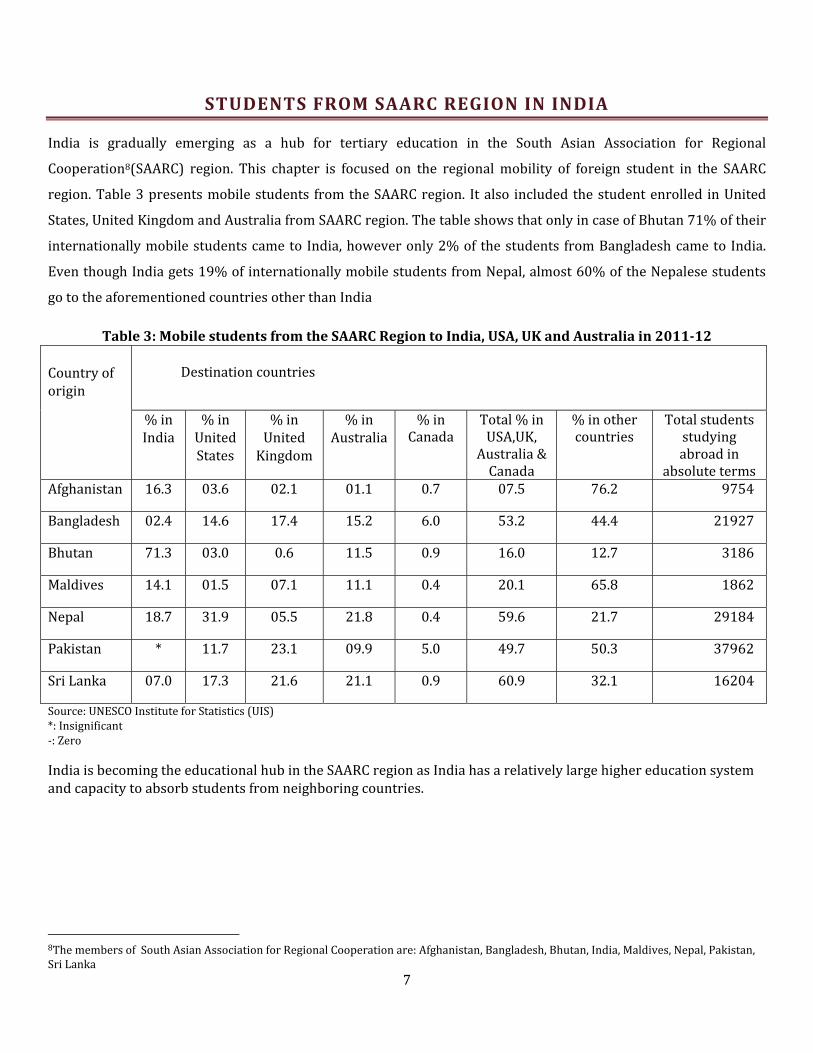
India is gradually emerging as a hub for tertiary education in the South Asian Association for Regional
Cooperation8(SAARC) region. This chapter is focused on the regional mobility of foreign student in the SAARC
region. Table 3 presents mobile students from the SAARC region. It also included the student enrolled in United
States, United Kingdom and Australia from SAARC region. The table shows that only in case of Bhutan 71% of their
internationally mobile students came to India, however only 2% of the students from Bangladesh came to India.
Even though India gets 19% of internationally mobile students from Nepal, almost 60% of the Nepalese students
go to the aforementioned countries other than India
Table 3: Mobile students from the SAARC Region to India, USA, UK and Australia in 201112 Country of origin
Destination countries
% in India
% in United States
% in United Kingdom
% in Australia
% in Canada
Total % in USA,UK,
Australia & Canada
% in other countries
Total students studying abroad in
absolute terms Afghanistan 16.3 03.6 02.1 01.1 0.7 07.5 76.2 9754
Bangladesh 02.4 14.6 17.4 15.2 6.0 53.2 44.4 21927
Bhutan 71.3 03.0 0.6 11.5 0.9 16.0 12.7 3186
Maldives 14.1 01.5 07.1 11.1 0.4 20.1 65.8 1862
Nepal 18.7 31.9 05.5 21.8 0.4 59.6 21.7 29184
Pakistan * 11.7 23.1 09.9 5.0 49.7 50.3 37962
Sri Lanka 07.0 17.3 21.6 21.1 0.9 60.9 32.1 16204
Source: UNESCO Institute for Statistics (UIS) *: Insignificant ‐: Zero
India is becoming the educational hub in the SAARC region as India has a relatively large higher education system and capacity to absorb students from neighboring countries.
8The members of South Asian Association for Regional Cooperation are: Afghanistan, Bangladesh, Bhutan, India, Maldives, Nepal, Pakistan, Sri Lanka

8
SECTION 1: FOREIGN STUDENTS AT THE UNDERGRADUATE LEVEL
This section analyses the major subjects for which students came to India for their under‐graduate studies. The
majority of foreign students come to India for their under‐graduate studies. In 2011‐12, India received 25283
(77%) foreign students for this level. Out of this majority, the highest number of students at this level came from
Nepal.
Figure 2 shows that in 2011‐12, India hosted the highest number of students for Bachelor of Technology (B.Tech),
followed by Bachelor of Commerce (B.Com), Bachelor of Medicine & Bachelor of Surgery (MBBS), Bachelor of
Pharmacy, Bachelor of Science and Bachelor of Arts. However in 2010‐11, most of the students came to India for
Bachelor of Commerce.
Source: All India Survey on Higher Education
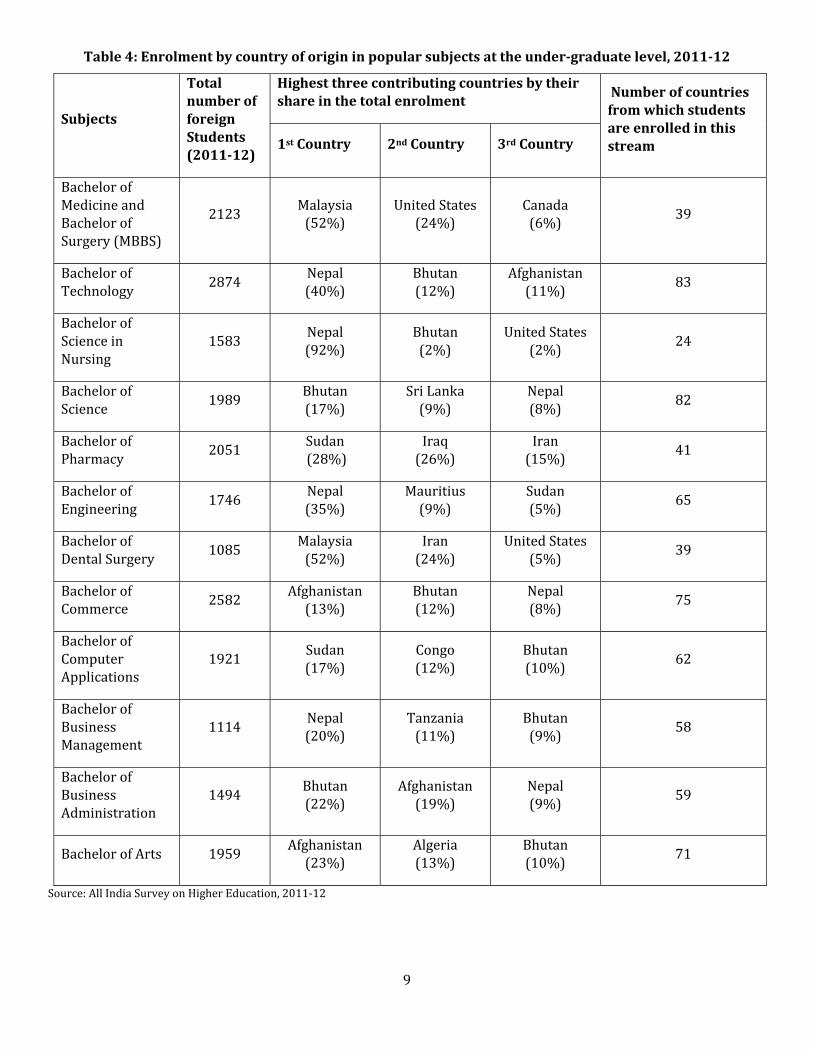
Table 4shows the total number of countries from which students in a particular subject were enrolled and the
country from which the majority came. For instance, India received highest number (92%) of the students in
Nursing from Nepal and the remaining were from 23 other countries (Annex 25). However, Afghanistan was the
highest contributor for enrolments in commerce (13%) and the remaining students came from 74 other countries
(Annex 30). This trend suggests that, India hosted the majority of its foreign students for nursing from Nepal,
however in case of commerce the enrolments were more scattered. It is worth highlighting that of the total
enrolment in MBBS the majority came from Malaysia (52%), the United States (24%), and Canada (6%) (Annex
23).The patterns shown in Table 4 and Table 5 are not very different from that observed in the data for 2010‐11.
0
500
1000
1500
2000
2500
3000
3500
MBBS
B.Tech
Nursing
B.Science
B.Pharmacy
Engineering
Dental Surgery
B.Commerce
Business
Man
agement
Business
Administration
B.Arts
Figure: 2 Popular subjects among foreign students at the under‐graduate level, 2010‐11 and 2011‐12
2010‐11
2011‐12
9
Table 4: Enrolment by country of origin in popular subjects at the undergraduate level, 201112
Subjects
Total number of foreign Students (201112)
Highest three contributing countries by their share in the total enrolment
Number of countries from which students are enrolled in this stream 1st Country 2nd Country 3rd Country
Bachelor of Medicine and Bachelor of Surgery (MBBS)
2123 Malaysia (52%)
United States (24%)
Canada (6%)
39
Bachelor of Technology
2874 Nepal(40%)
Bhutan(12%)
Afghanistan (11%)
83
Bachelor of Science in Nursing
1583 Nepal (92%)
Bhutan (2%)
United States (2%)
24
Bachelor of Science
1989 Bhutan(17%)
Sri Lanka(9%)
Nepal (8%)
82
Bachelor of Pharmacy
2051 Sudan (28%)
Iraq (26%)
Iran (15%)
41
Bachelor of Engineering
1746 Nepal (35%)
Mauritius (9%)
Sudan (5%)
65
Bachelor of Dental Surgery
1085 Malaysia(52%)
Iran(24%)
United States (5%)
39
Bachelor of Commerce
2582 Afghanistan(13%)
Bhutan (12%)
Nepal(8%)
75
Bachelor of Computer Applications
1921 Sudan (17%)
Congo (12%)
Bhutan (10%)
62
Bachelor of Business Management
1114 Nepal (20%)
Tanzania (11%)
Bhutan (9%)
58
Bachelor of Business Administration
1494 Bhutan (22%)
Afghanistan (19%)
Nepal (9%)
59
Bachelor of Arts 1959 Afghanistan(23%)
Algeria(13%)
Bhutan (10%)
71
Source: All India Survey on Higher Education, 2011‐12

10
Table 5 shows the states of India that had the highest enrolment in a particular field and also the countries that
contribute the most to this enrolment. For instance, 93% of the total enrolments in Nursing were in Karnataka and
out of total enrolment Nepalese students made 94% (Annex 25). Karnataka is by far the most preferred destination
for foreign students at the under‐graduate level in India.
Table 5: Statewise foreign enrolment in popular subjects at the undergraduate level, 201112
Major Subjects Total number of foreign Students
The state that has the highest enrolment
% of highest Enrolment of states/UTs mentioned in Column C
Highest contributing country (in%) in highest enrolled State/UT
Bachelor of Medicine and Bachelor of Surgery (MBBS)
2123 Karnataka 59% Malaysia (79%)
Bachelor of Technology 2874 Andhra Pradesh 32% Nepal (46%)
Bachelor of Science in Nursing
1583 Karnataka 93% Nepal(94%)
Bachelor of Science 1989 Karnataka 27% Nepal(18%)
Bachelor of Pharmacy 2051 Karnataka 67% Iraq(31%)
Bachelor of Engineering 1746 Karnataka 52% Nepal(48%)
Bachelor of Dental Surgery
1085 Karnataka 67% Malaysia (52%)
Bachelor of Commerce 2582 Maharashtra 27% Bahrain (18%)
Bachelor of Computer Applications
1921 Karnataka
61%
Congo(18%)
Bachelor of Business Management
1114 Karnataka 93% Nepal (21%)
Bachelor of Business Administration
1494 Maharashtra 32% Afghanistan (27%)
Bachelor of Arts 1959 Maharashtra 26% Afghanistan(53%)
Source: All India Survey on Higher Education, 2011‐12
11
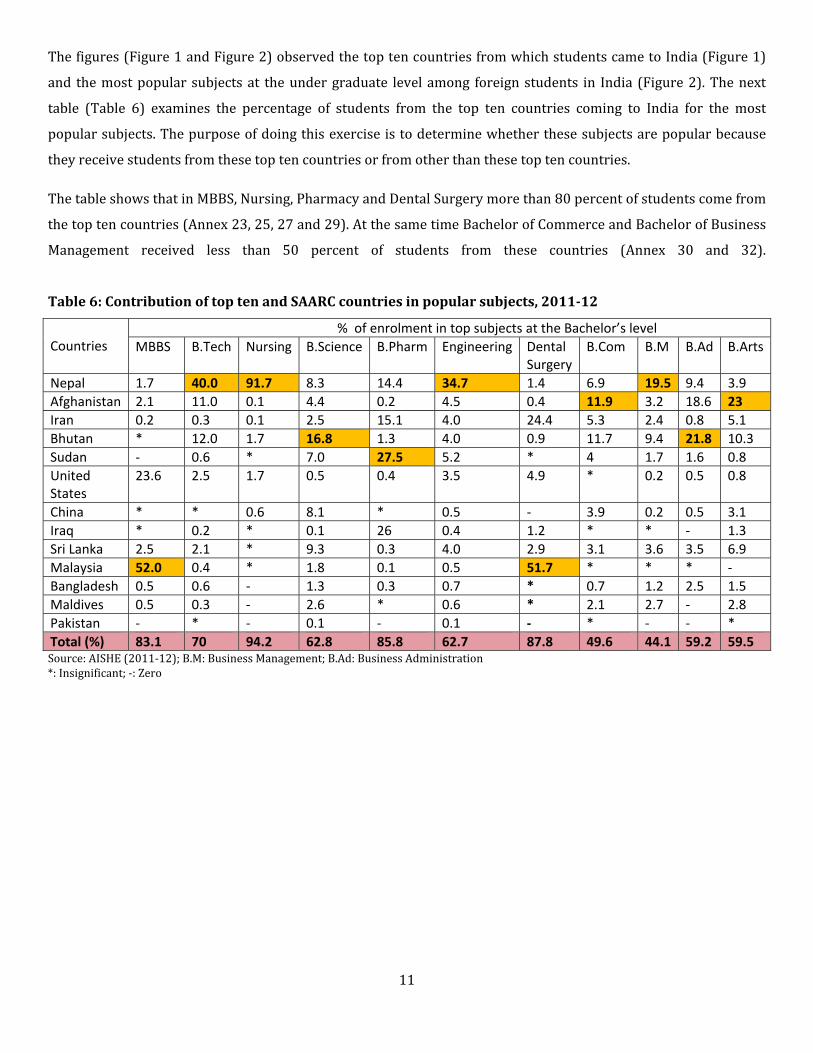
The figures (Figure 1 and Figure 2) observed the top ten countries from which students came to India (Figure 1)
and the most popular subjects at the under graduate level among foreign students in India (Figure 2). The next
table (Table 6) examines the percentage of students from the top ten countries coming to India for the most
popular subjects. The purpose of doing this exercise is to determine whether these subjects are popular because
they receive students from these top ten countries or from other than these top ten countries.
The table shows that in MBBS, Nursing, Pharmacy and Dental Surgery more than 80 percent of students come from
the top ten countries (Annex 23, 25, 27 and 29). At the same time Bachelor of Commerce and Bachelor of Business
Management received less than 50 percent of students from these countries (Annex 30 and 32).
Table 6: Contribution of top ten and SAARC countries in popular subjects, 201112
Countries
% of enrolment in top subjects at the Bachelor’s level
MBBS B.Tech Nursing B.Science B.Pharm Engineering Dental Surgery
B.Com B.M B.Ad B.Arts
Nepal 1.7 40.0 91.7 8.3 14.4 34.7 1.4 6.9 19.5 9.4 3.9
Afghanistan 2.1 11.0 0.1 4.4 0.2 4.5 0.4 11.9 3.2 18.6 23
Iran 0.2 0.3 0.1 2.5 15.1 4.0 24.4 5.3 2.4 0.8 5.1
Bhutan * 12.0 1.7 16.8 1.3 4.0 0.9 11.7 9.4 21.8 10.3
Sudan ‐ 0.6 * 7.0 27.5 5.2 * 4 1.7 1.6 0.8
United States
23.6 2.5 1.7 0.5 0.4 3.5 4.9 * 0.2 0.5 0.8
China * * 0.6 8.1 * 0.5 ‐ 3.9 0.2 0.5 3.1
Iraq * 0.2 * 0.1 26 0.4 1.2 * * ‐ 1.3
Sri Lanka 2.5 2.1 * 9.3 0.3 4.0 2.9 3.1 3.6 3.5 6.9
Malaysia 52.0 0.4 * 1.8 0.1 0.5 51.7 * * * ‐
Bangladesh 0.5 0.6 ‐ 1.3 0.3 0.7 * 0.7 1.2 2.5 1.5
Maldives 0.5 0.3 ‐ 2.6 * 0.6 * 2.1 2.7 ‐ 2.8
Pakistan ‐ * ‐ 0.1 ‐ 0.1 ‐ * ‐ ‐ *
Total (%) 83.1 70 94.2 62.8 85.8 62.7 87.8 49.6 44.1 59.2 59.5 Source: AISHE (2011‐12); B.M: Business Management; B.Ad: Business Administration *: Insignificant; ‐: Zero

12
SECTION 1.1: FEMALE ENROLMENT AMONG FOREIGN STUDENTS AT THE UNDERGRADUATE LEVEL
Apart from determining how far India is a favorable destination for foreign students, it is important to see the
gender composition of foreign enrolment. It is critical to look at this aspect keeping in mind the recent focus
around access with gender and socio‐economic equity.
This section analyses the proportion of women in the most popular fields at the under‐graduate level.Figure3
shows women were enrolled in high numbers in Nursing, Dental Surgery and MBBS (Annex 18). In particular, of
the total students enrolled in Nursing, 97% were women. Of the total 97% women enrolled in Nursing, 93% are
from Nepal (Annex 25).
Source: All India Survey on Higher Education, 2011‐12
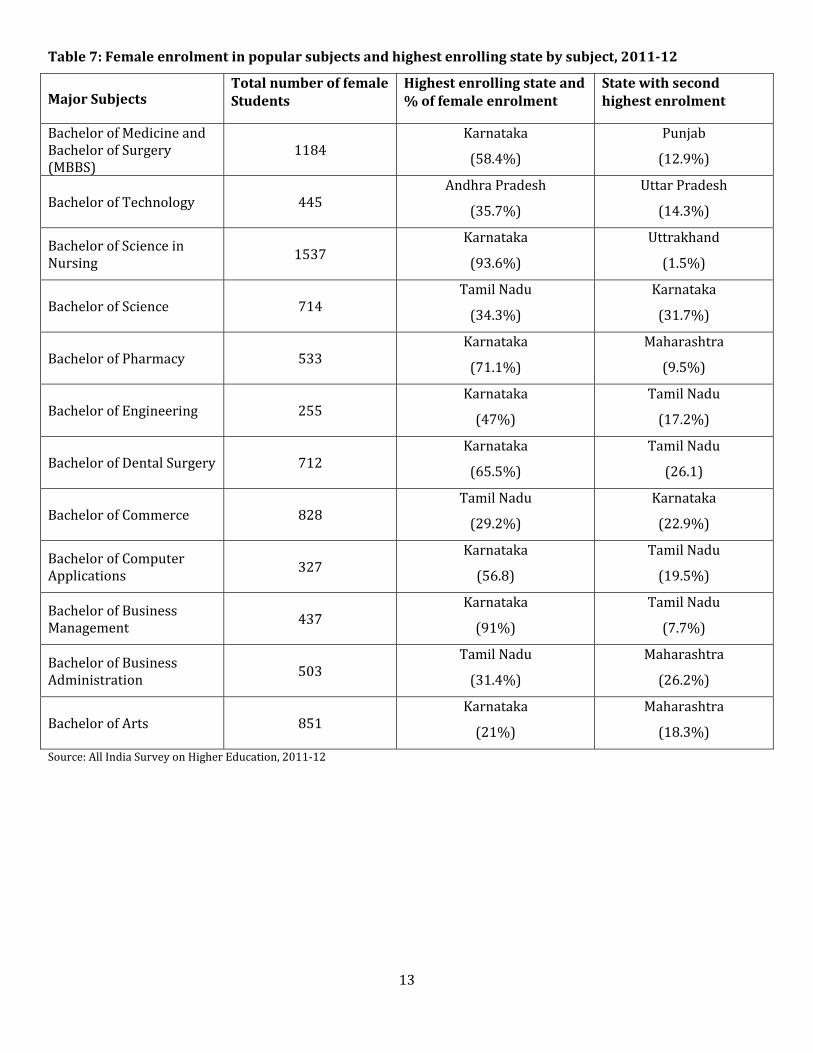
Table 7 shows the state that gets the highest female enrolment in the popular subjects. Nursing has the highest
female enrolment among foreign students and 93.6% of this enrolment is in the state of Karnataka. At the same
time, Engineering has the lowest female enrolment among foreign students and 47% of this enrolment is in
Karnataka. The table also presents the state with the second highest enrolment of female foreign students in
popular subjects. Karnataka has enrolled highest number of MBBS student and out of total 1,184 students are
female. Karnataka hosts 58.4% female out of total female enrolment and Punjab hosts 12.9% female out of total
enrolment in MBBS (Annex 23).
3
3444
57 61 64 66 68 7483 85 85
97
6656
43 39 36 34 32 2617 15 15
0
10
20
30
40
50
60
70
80
90
100
Nursing
Dental Surgery
MBBS
Arts
Business M
anagement
Science
Business Administration
Commerce
Pharmacy
Computer Application
B.Tech
Engineering
Fig 3: Percentage of women enrolled in popular subjects at the under‐graduate level, 2011‐12
Female(%)
Male(%)
13
Table 7: Female enrolment in popular subjects and highest enrolling state by subject, 201112
Major Subjects Total number of female Students
Highest enrolling state and % of female enrolment
State with second highest enrolment
Bachelor of Medicine and Bachelor of Surgery (MBBS)
1184 Karnataka
(58.4%)
Punjab
(12.9%)
Bachelor of Technology 445 Andhra Pradesh
(35.7%)
Uttar Pradesh
(14.3%)
Bachelor of Science in Nursing
1537 Karnataka
(93.6%)
Uttrakhand
(1.5%)
Bachelor of Science 714 Tamil Nadu
(34.3%)
Karnataka
(31.7%)
Bachelor of Pharmacy 533 Karnataka
(71.1%)
Maharashtra
(9.5%)
Bachelor of Engineering 255 Karnataka
(47%)
Tamil Nadu
(17.2%)
Bachelor of Dental Surgery 712 Karnataka
(65.5%)
Tamil Nadu
(26.1)
Bachelor of Commerce 828 Tamil Nadu
(29.2%)
Karnataka
(22.9%)
Bachelor of Computer Applications
327 Karnataka
(56.8)
Tamil Nadu
(19.5%)
Bachelor of Business Management
437 Karnataka
(91%)
Tamil Nadu
(7.7%)
Bachelor of Business Administration
503 Tamil Nadu
(31.4%)
Maharashtra
(26.2%)
Bachelor of Arts 851 Karnataka
(21%)
Maharashtra
(18.3%)
Source: All India Survey on Higher Education, 2011‐12
14
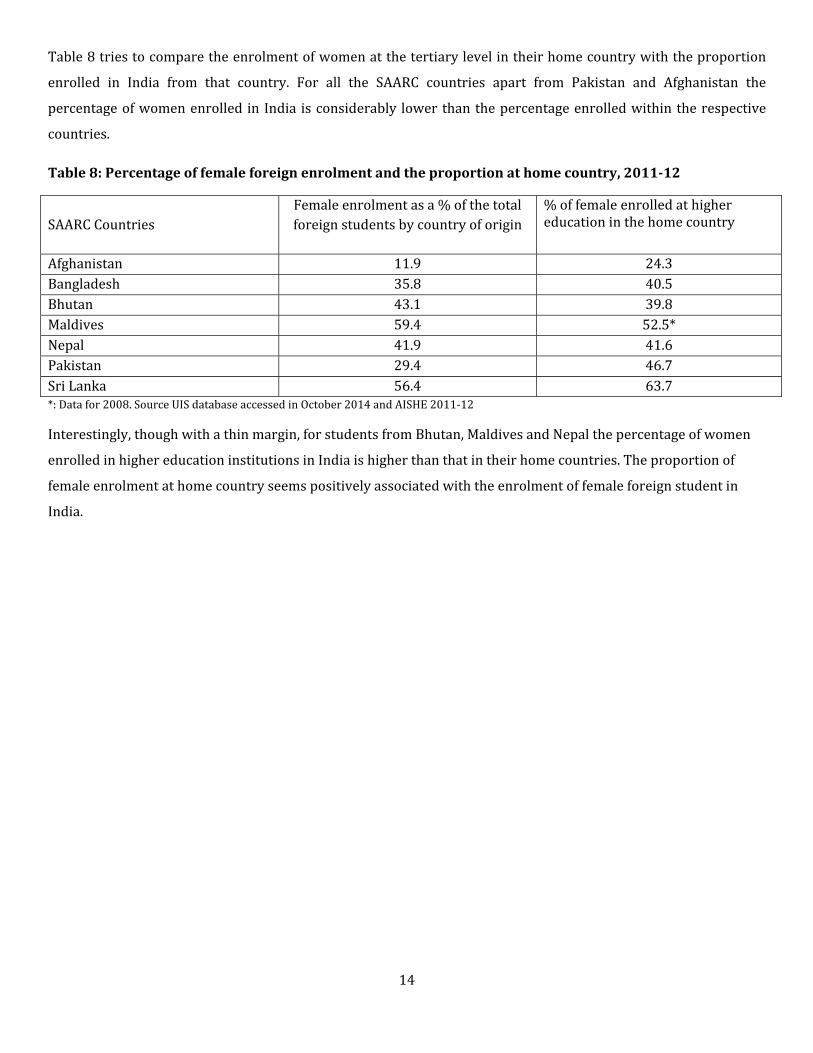
Table 8 tries to compare the enrolment of women at the tertiary level in their home country with the proportion
enrolled in India from that country. For all the SAARC countries apart from Pakistan and Afghanistan the
percentage of women enrolled in India is considerably lower than the percentage enrolled within the respective
countries.
Table 8: Percentage of female foreign enrolment and the proportion at home country, 201112
SAARC Countries
Female enrolment as a % of the total foreign students by country of origin
% of female enrolled at higher education in the home country
Afghanistan 11.9 24.3 Bangladesh 35.8 40.5 Bhutan 43.1 39.8 Maldives 59.4 52.5* Nepal 41.9 41.6 Pakistan 29.4 46.7 Sri Lanka 56.4 63.7 *: Data for 2008. Source UIS database accessed in October 2014 and AISHE 2011‐12
Interestingly, though with a thin margin, for students from Bhutan, Maldives and Nepal the percentage of women
enrolled in higher education institutions in India is higher than that in their home countries. The proportion of
female enrolment at home country seems positively associated with the enrolment of female foreign student in
India.
15
SECTION 2: FOREIGN STUDENTS AT THE POSTGRADUATE LEVEL
This section profiles the inflow of foreign students at the post‐graduate level. In 2011‐12, India received
5847(23.13%) students for post‐graduate studies as opposed to 25283 (77.27%) students at the under‐graduate
level in India9.
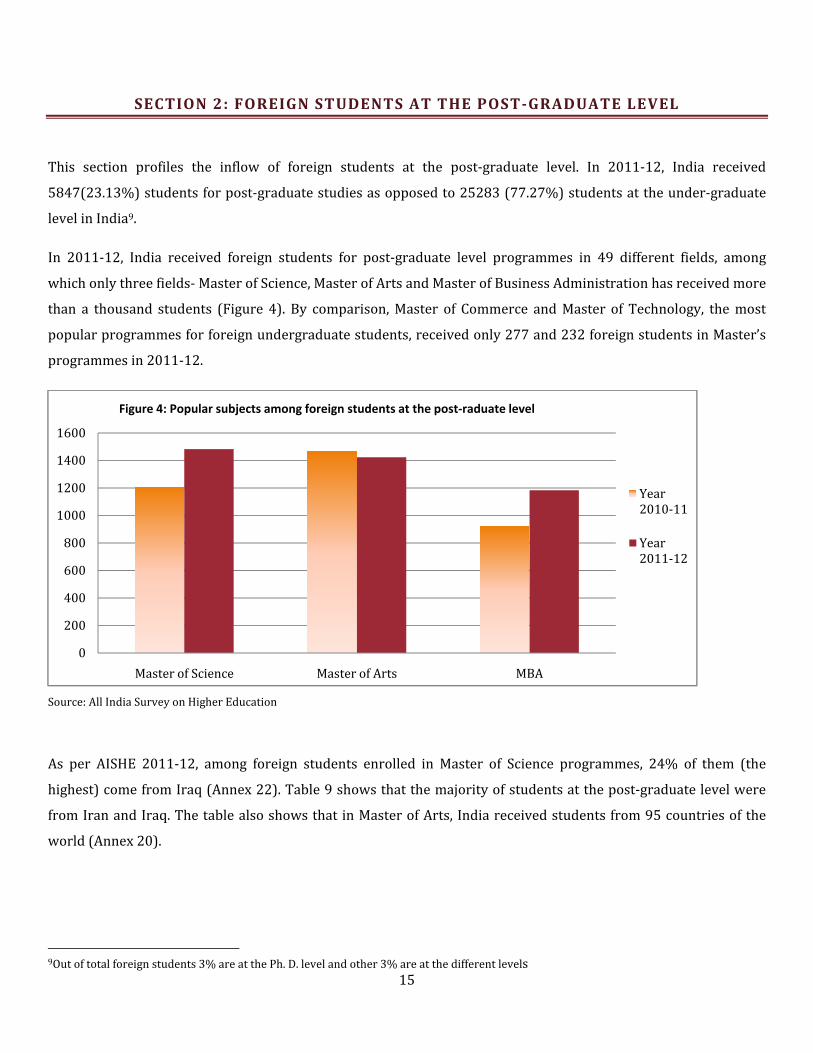
In 2011‐12, India received foreign students for post‐graduate level programmes in 49 different fields, among
which only three fields‐ Master of Science, Master of Arts and Master of Business Administration has received more
than a thousand students (Figure 4). By comparison, Master of Commerce and Master of Technology, the most
popular programmes for foreign undergraduate students, received only 277 and 232 foreign students in Master’s
programmes in 2011‐12.
Source: All India Survey on Higher Education
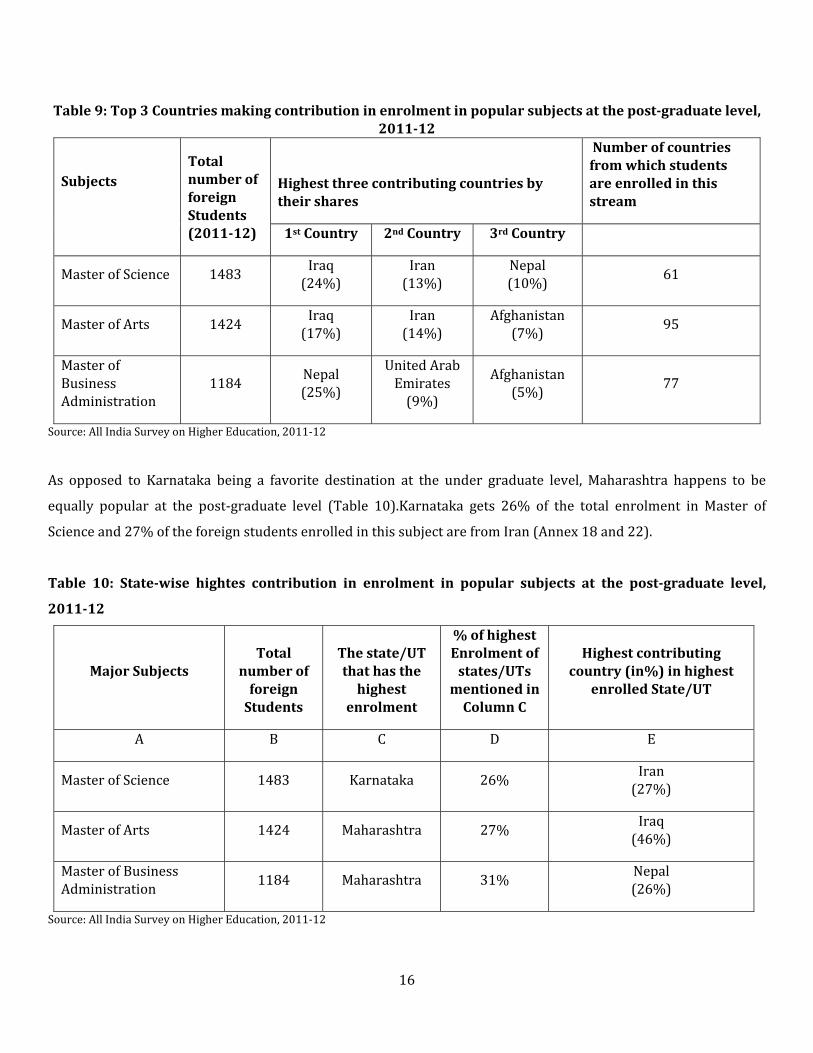
As per AISHE 2011‐12, among foreign students enrolled in Master of Science programmes, 24% of them (the
highest) come from Iraq (Annex 22). Table 9 shows that the majority of students at the post‐graduate level were
from Iran and Iraq. The table also shows that in Master of Arts, India received students from 95 countries of the
world (Annex 20).
9Out of total foreign students 3% are at the Ph. D. level and other 3% are at the different levels
0
200
400
600
800
1000
1200
1400
1600
Master of Science Master of Arts MBA
Figure 4: Popular subjects among foreign students at the post‐raduate level
Year 2010‐11
Year 2011‐12
16
Table 9: Top 3 Countries making contribution in enrolment in popular subjects at the postgraduate level, 201112
Subjects
Total number of foreign Students (201112)
Highest three contributing countries by their shares
Number of countries from which students are enrolled in this stream
1st Country 2nd Country 3rd Country
Master of Science 1483 Iraq (24%)
Iran (13%)
Nepal(10%)
61
Master of Arts 1424 Iraq(17%)
Iran(14%)
Afghanistan(7%)
95
Master of Business Administration
1184 Nepal (25%)
United Arab Emirates (9%)
Afghanistan (5%)
77
Source: All India Survey on Higher Education, 2011‐12
As opposed to Karnataka being a favorite destination at the under graduate level, Maharashtra happens to be
equally popular at the post‐graduate level (Table 10).Karnataka gets 26% of the total enrolment in Master of
Science and 27% of the foreign students enrolled in this subject are from Iran (Annex 18 and 22).
Table 10: Statewise hightes contribution in enrolment in popular subjects at the postgraduate level,
201112
Major Subjects Total
number of foreign Students
The state/UT that has the highest
enrolment
% of highest Enrolment of states/UTs mentioned in Column C
Highest contributing country (in%) in highest
enrolled State/UT
A B C D E
Master of Science 1483 Karnataka 26% Iran (27%)
Master of Arts 1424 Maharashtra 27% Iraq (46%)
Master of Business Administration
1184 Maharashtra 31% Nepal(26%)
Source: All India Survey on Higher Education, 2011‐12
17
SECTION 2.1: FEMALE ENROLMENT AMONG FOREIGN STUDENTS AT THE POSTGRADUATE LEVEL
Despite the improved access to higher education, proportionately less women move up the education ladder. A
recent report on higher education in Asia points out that at the Bachelor’s level the enrolment of women accounts
for 47% and it declines to 37% at the doctoral level10.
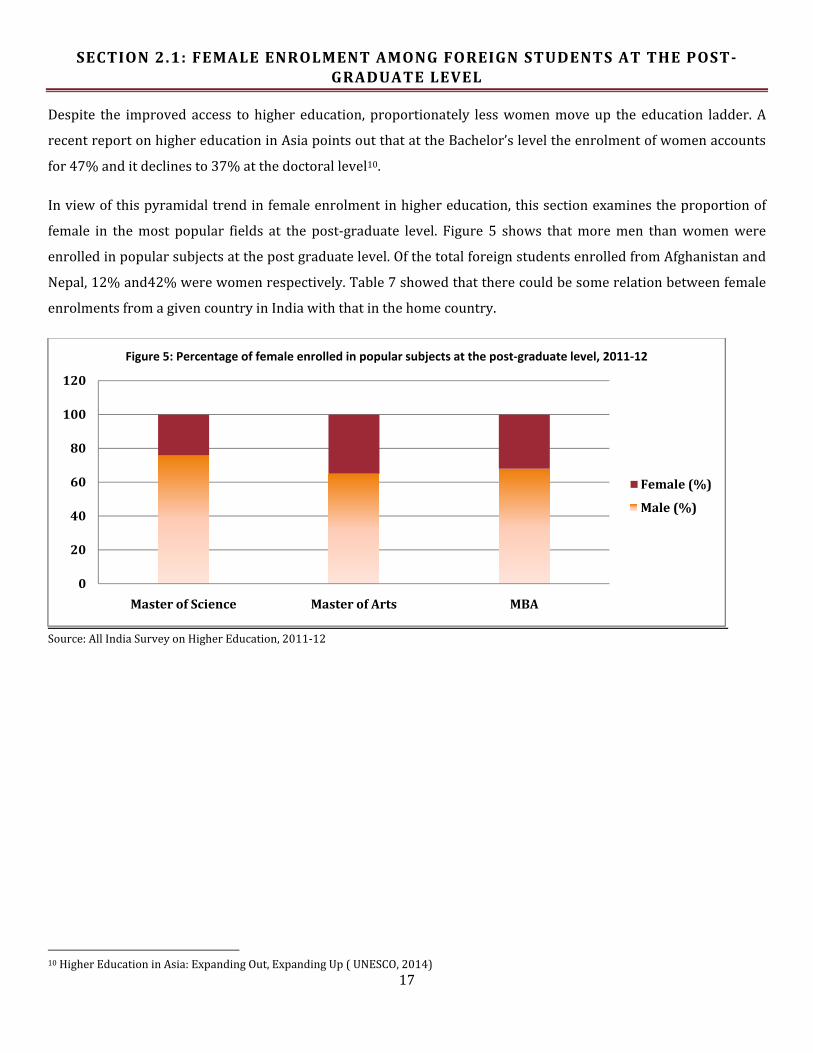
In view of this pyramidal trend in female enrolment in higher education, this section examines the proportion of
female in the most popular fields at the post‐graduate level. Figure 5 shows that more men than women were
enrolled in popular subjects at the post graduate level. Of the total foreign students enrolled from Afghanistan and
Nepal, 12% and42% were women respectively. Table 7 showed that there could be some relation between female
enrolments from a given country in India with that in the home country.
Source: All India Survey on Higher Education, 2011‐12
10 Higher Education in Asia: Expanding Out, Expanding Up ( UNESCO, 2014)
0
20
40
60
80
100
120
Master of Science Master of Arts MBA
Figure 5: Percentage of female enrolled in popular subjects at the post‐graduate level, 2011‐12
Female (%)
Male (%)
18
SECTION 3: FOREIGN STUDENTS AT DOCTORAL LEVEL
Many cross‐country studies demonstrate a virtuous circle in which Research &Development (R&D) spending,
innovation, productivity and national growth and development mutually reinforce each other11. The quantity and
quality of research undertaken in a country could be a factor that contributes to higher enrolments at the Doctoral
level. This section profiles the enrolment status of foreign students in India at the Doctoral level.
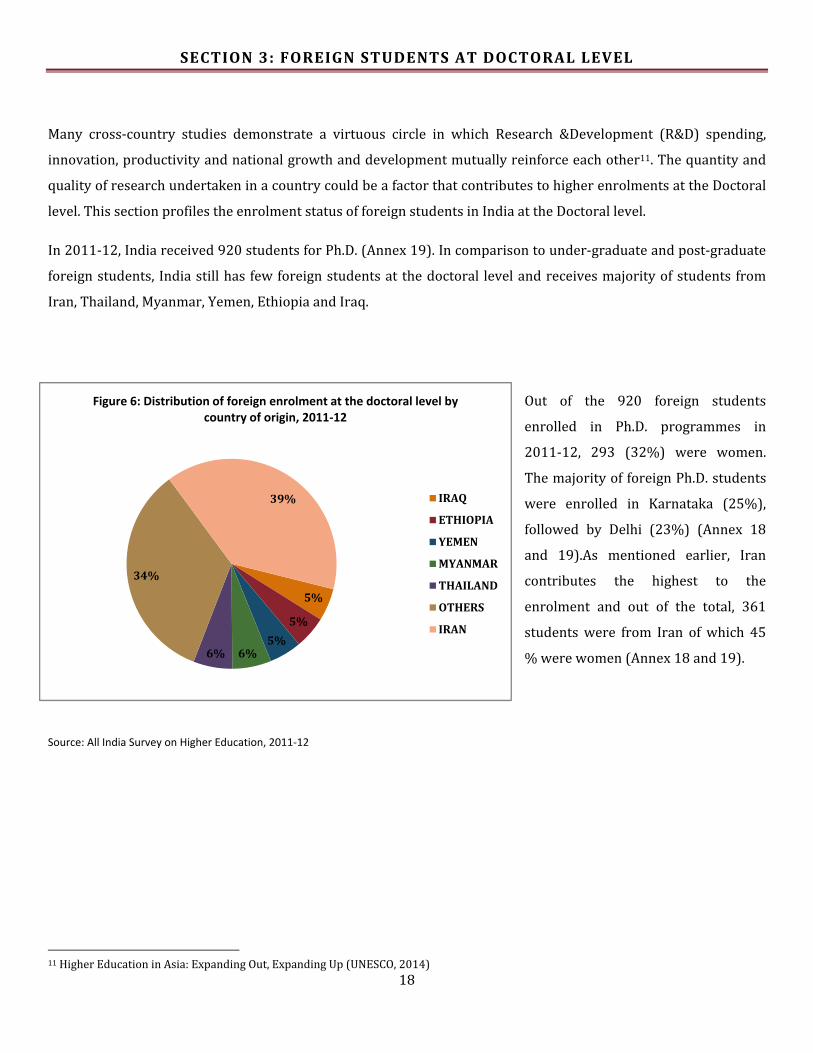
In 2011‐12, India received 920 students for Ph.D. (Annex 19). In comparison to under‐graduate and post‐graduate
foreign students, India still has few foreign students at the doctoral level and receives majority of students from
Iran, Thailand, Myanmar, Yemen, Ethiopia and Iraq.
Out of the 920 foreign students
enrolled in Ph.D. programmes in
2011‐12, 293 (32%) were women.
The majority of foreign Ph.D. students
were enrolled in Karnataka (25%),
followed by Delhi (23%) (Annex 18
and 19).As mentioned earlier, Iran
contributes the highest to the
enrolment and out of the total, 361
students were from Iran of which 45
% were women (Annex 18 and 19).
Source: All India Survey on Higher Education, 2011‐12
11 Higher Education in Asia: Expanding Out, Expanding Up (UNESCO, 2014)
5%
5%
5%6%6%
34%
39%
Figure 6: Distribution of foreign enrolment at the doctoral level by country of origin, 2011‐12
IRAQ
ETHIOPIA
YEMEN
MYANMAR
THAILAND
OTHERS
IRAN

19
CONCLUSION
The globalization of higher education has been a phenomenon since the colonial period12. Since education is
regarded as a right at the elementary level, the later stages of learning need to prepare themselves for the
increasing demand in the future. There are multiple reasons why focusing on enrolment of foreign students in
India is important. First, foreign students not only bring financial contribution to the country but also bring their
socio‐cultural values. They help creating harmony between countries. The mobility of students is expected to grow
in the coming years especially for South‐Asian region.
The increasing number of foreign students in India indicates the quality of education that some universities are
offering is better than the neighboring countries. “There are many reasons why students pursue their higher
education abroad. For some, it is a chance to broaden cultural and intellectual horizons. Others go abroad to avoid
frustrations of under‐resourced universities. Many have no choice but to go abroad in order to pursue a particular
field of education or type of academic programme” (UNESCO 2013: P 80)
In an era where academic mobility is gaining popularity among students from all regions, it is crucial for
institutions to recognize and prepare themselves to attract talented and self‐funded students. The level of
attractiveness to mobile students depends largely on the quality of education that universities provide. It also
depends on other external and internal factors, such as availability of decent facilities, possible job opportunities,
language, security, socio‐economic commonalities etc. Foreign students have bright employment prospects in
China after graduation and many international graduates chose to work in China in recent years because of more
job opportunities in China’s labor market (UNESCO 2013: P 20)
In view of the criticality of higher education, this paper presents a statistical profile of foreign students who come
to India for their tertiary education. India emerged as a popular destination for students from South Asia. In
particular, majority of the students were enrolled at the under‐graduate level in disciplines from medicine,
technology and arts. Female enrolment at the under‐graduate level was predominately in healthcare related
disciplines.
As we progress to higher levels of tertiary education, the enrolments drastically drop. At the post‐graduate level
Master of Science, Master of Arts and Master of Business Administration were the only subjects to get substantial
foreign enrolments. The paper presents disaggregated information about the state with the highest enrolment and
the country from which highest number of students were enrolled in a subject. Karnataka emerged as a popular
destination for students at the under‐graduate level and Maharashtra at the post‐graduate level.
12Globalization of higher education and cross‐border student mobility (UNESCO & IIEP, 2008)

20
It becomes utmost important to layout the limitations of the study, both in terms of data availability and scope. The
study is based on All India Survey on Higher Education, 2010‐11 and 2011‐12. In the process of analysis it was
realized that, in the coming years, it would be useful to include more information. For instance, number of foreign
graduates, new entrants each year, sources of funding. The aspect of student satisfaction could also be included in
the purview of All India Survey on Higher Education or conducting a separate survey. This could focus on the
environment within and outside the university that makes enrolment of foreign students conducive.
India must now focus on tapping its potential for internationalization and bringing more students to the country. It
could be useful to consider formulating a concrete policy that is dedicated to foreign students and focuses on
making India a preferred destination among foreign students.
21
REFERENCES
Higher Education in Asia: Expanding Out, Expanding Up (UNESCO, 2014)
Globalization of higher education and cross‐border student mobility (UNESCO & IIEP, 2008)
All India Survey on Higher Education 2010‐11 All India Survey on Higher Education 2011‐12 de Wit, H. (2008a) Changing dynamics of international student circulation: meanings, push and pull factors, trends, and data, in de Wit, H., Agarwal, P., Said, M.E., Sehoole, M.T. and Sirozi, M. (eds) The Dynamics of International Student Circulation in a Global Context. Rotterdam: Sense Publishers, 15‐45. UNESCO. 2013. The international Mobility of Students in Asia and the Pacific, UNESCO Bangkok office, Thailand Web Links: UIS:http://www.uis.unesco.org/Pages/default.aspx
AISHE: http://aishe.nic.in/aishe/home

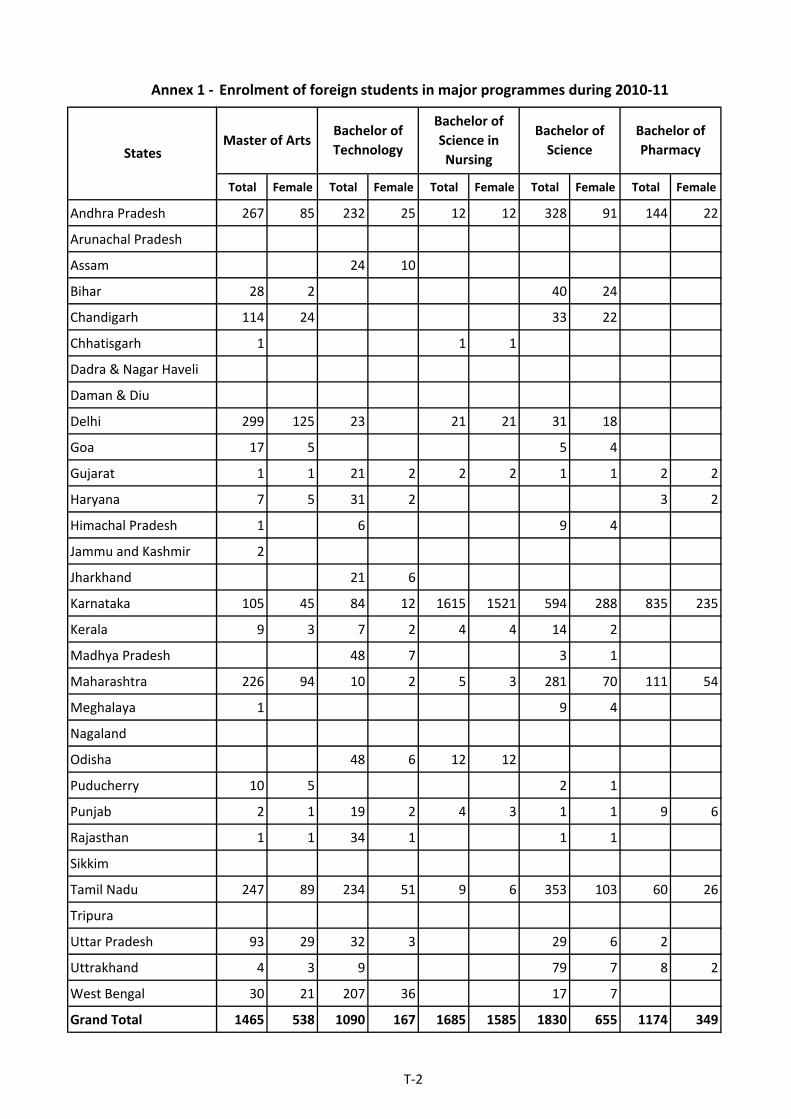
Annex 1 ‐ Enrolment of foreign students in major programmes during 2010‐11
Total Female Total Female Total Female Total Female
Andhra Pradesh 178 28 230 52 21 12 250 79
Arunachal Pradesh
Assam 1
Bihar 11
Chandigarh 35 7 1 1
Chhatisgarh 1
Dadra & Nagar Haveli
Daman & Diu
Delhi 243 91 74 19 54 10
Goa 2
Gujarat 12 2 2 99 46 4 2
Haryana 5 1 10 1 5 3 21
Himachal Pradesh 2 6 1
Jammu and Kashmir
Jharkhand
Karnataka 187 72 402 130 605 325 139 49
Kerala 41 18 12 3 12 2
Madhya Pradesh 7 5
Maharashtra 78 24 206 46 130 72 310 132
Meghalaya 2 1
Nagaland
Odisha 3 3
Puducherry 11 5 5 1 3 2
Punjab 8 2 4 1 48 30 18 5
Rajasthan 1 1
Sikkim 2 1 1
Tamil Nadu 9 3 153 50 211 127 70 17
Tripura
Uttar Pradesh 22 3 66 15 14 4 22 3
Uttrakhand 21 6 1 1
West Bengal 5 5 15 5
Grand Total 850 262 1205 330 1140 622 920 306
States
Doctor of
Philosophy Master of Science
Bachelor of Medicine
and Bachelor of
Surgery
Master of Business
Administration
T‐1
Annex 1 ‐
Andhra Pradesh
Arunachal Pradesh
Assam
Bihar
Chandigarh
Chhatisgarh
Dadra & Nagar Haveli
Daman & Diu
Delhi
Goa
Gujarat
Haryana
Himachal Pradesh
Jammu and Kashmir
Jharkhand
Karnataka
Kerala
Madhya Pradesh
Maharashtra
Meghalaya
Nagaland
Odisha
Puducherry
Punjab
Rajasthan
Sikkim
Tamil Nadu
Tripura
Uttar Pradesh
Uttrakhand
West Bengal
Grand Total
States
Enrolment of foreign students in major programmes during 2010‐11
Total Female Total Female Total Female Total Female Total Female
267 85 232 25 12 12 328 91 144 22
24 10
28 2 40 24
114 24 33 22
1 1 1
299 125 23 21 21 31 18
17 5 5 4
1 1 21 2 2 2 1 1 2 2
7 5 31 2 3 2
1 6 9 4
2
21 6
105 45 84 12 1615 1521 594 288 835 235
9 3 7 2 4 4 14 2
48 7 3 1
226 94 10 2 5 3 281 70 111 54
1 9 4
48 6 12 12
10 5 2 1
2 1 19 2 4 3 1 1 9 6
1 1 34 1 1 1
247 89 234 51 9 6 353 103 60 26
93 29 32 3 29 6 2
4 3 9 79 7 8 2
30 21 207 36 17 7
1465 538 1090 167 1685 1585 1830 655 1174 349
Bachelor of
TechnologyMaster of Arts
Bachelor of
Science in
Nursing
Bachelor of
Science
Bachelor of
Pharmacy
T‐2

Annex 1 ‐
Andhra Pradesh
Arunachal Pradesh
Assam
Bihar
Chandigarh
Chhatisgarh
Dadra & Nagar Haveli
Daman & Diu
Delhi
Goa
Gujarat
Haryana
Himachal Pradesh
Jammu and Kashmir
Jharkhand
Karnataka
Kerala
Madhya Pradesh
Maharashtra
Meghalaya
Nagaland
Odisha
Puducherry
Punjab
Rajasthan
Sikkim
Tamil Nadu
Tripura
Uttar Pradesh
Uttrakhand
West Bengal
Grand Total
States
Enrolment of foreign students in major programmes during 2010‐11
Total Female Total Female Total Female Total Female Total Female
259 24 6 4 888 162 809 25
7
148 47 13 9 1 1
1
1
80 35
5 3 6
8 3 1 1 191 32 9 4
10 4 4 2 1 1
3 3 2 1 1
1
461 68 668 420 424 212 1079 153 922 338
13 4
12 3
14 83 45 595 121 171 20 13 5
39 8 3 1
8 4
1
20 4 28 13 16 6
24 9 1 1 2 2
1 1
238 65 255 195 139 74 38 4 7 2
70 25
17 3 1 1
1143 208 1084 699 2309 657 2334 248 953 351
Bachelor of
Engineering
Bachelor of
Dental Surgery
Bachelor of
Commerce
Bachelor of
Computer
Applications
Bachelor of
Business
Management
T‐3

Annex 1 ‐
Andhra Pradesh
Arunachal Pradesh
Assam
Bihar
Chandigarh
Chhatisgarh
Dadra & Nagar Haveli
Daman & Diu
Delhi
Goa
Gujarat
Haryana
Himachal Pradesh
Jammu and Kashmir
Jharkhand
Karnataka
Kerala
Madhya Pradesh
Maharashtra
Meghalaya
Nagaland
Odisha
Puducherry
Punjab
Rajasthan
Sikkim
Tamil Nadu
Tripura
Uttar Pradesh
Uttrakhand
West Bengal
Grand Total
States
Enrolment of foreign students in major programmes during 2010‐11
Total Female Total Female Total Female Total Female
414 104 660 258 4698 983
2 2 4 1 31 13
182 44 11 279 70
8 8 137 21 490 140
1 1 6 1
1
21 5 264 128 419 162 1529 614
43 5 38 4 8 1 124 22
19 1 18 1 194 82 584 182
1 3 2 30 8 131 31
1 1 5 38 8
3
1 1 5 27 7
16 7 525 308 1442 707 10103 4890
9 2 15 3 50 15 190 54
58 27 75 19 203 62
558 152 461 154 1117 440 4369 1434
7 5 45 22 9 5 115 46
1 1 1 1
2 6 1 82 23
1 1 100 58 133 73
18 11 40 5 235 90
20 8 3 92 19
3 2 8 4 16 11 31 19
69 32 13 8 278 146 2383 998
1 1 1 1
129 47 537 87 1016 222
18 10 27 14 167 43
8 4 38 27 131 48 469 157
856 256 2184 878 5309 2092 27531 10203
Total
Bachelor of
Business
Administration
Bachelor of Arts Other subjects
T‐4
Countries
Andhra Pradesh
Assam
Bihar
Chan
digarh
Delhi
Gujarat
Haryana
Him
achal Pradesh
Karnataka
Kerala
Mah
arashtra
Meghalaya
Puducherry
Punjab
Tamil Nad
u
Uttar Pradesh
West Ben
gal
Grand Total
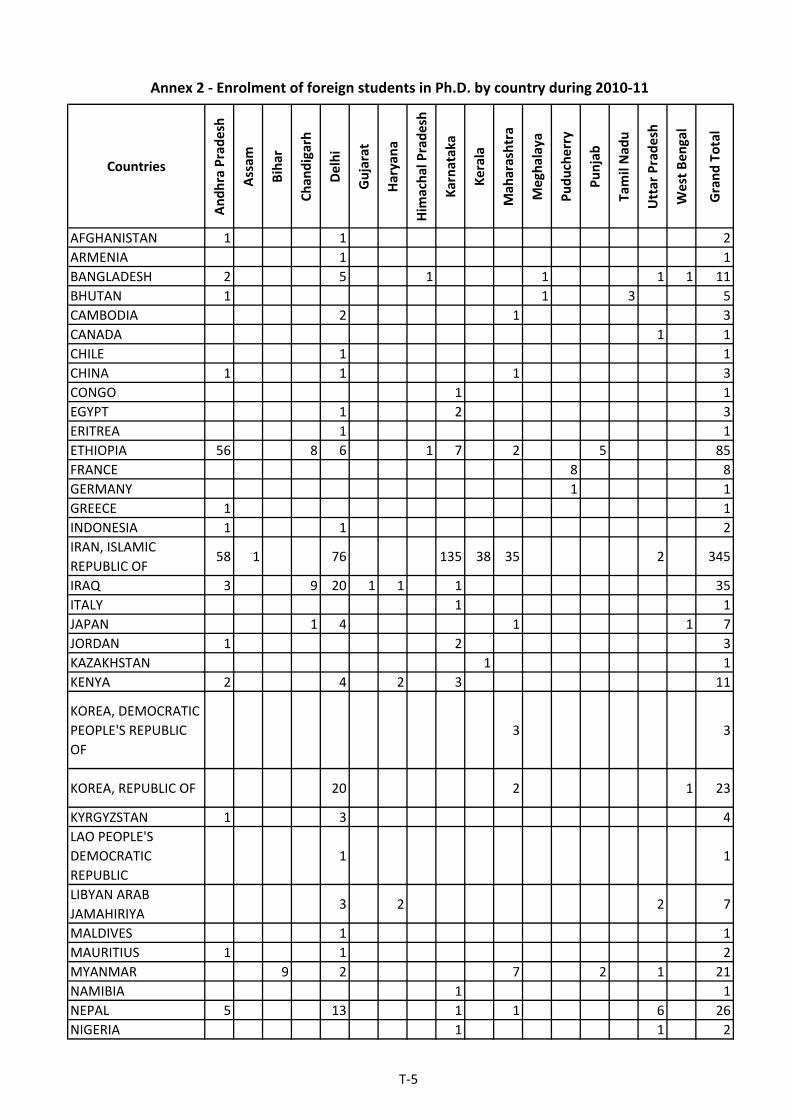
AFGHANISTAN 1 1 2
ARMENIA 1 1
BANGLADESH 2 5 1 1 1 1 11
BHUTAN 1 1 3 5
CAMBODIA 2 1 3
CANADA 1 1
CHILE 1 1
CHINA 1 1 1 3
CONGO 1 1
EGYPT 1 2 3
ERITREA 1 1
ETHIOPIA 56 8 6 1 7 2 5 85
FRANCE 8 8
GERMANY 1 1
GREECE 1 1
INDONESIA 1 1 2
IRAN, ISLAMIC
REPUBLIC OF58 1 76 135 38 35 2 345
IRAQ 3 9 20 1 1 1 35
ITALY 1 1
JAPAN 1 4 1 1 7
JORDAN 1 2 3
KAZAKHSTAN 1 1
KENYA 2 4 2 3 11
KOREA, DEMOCRATIC
PEOPLE'S REPUBLIC
OF
3 3
KOREA, REPUBLIC OF 20 2 1 23
KYRGYZSTAN 1 3 4
LAO PEOPLE'S
DEMOCRATIC
REPUBLIC
1 1
LIBYAN ARAB
JAMAHIRIYA3 2 2 7
MALDIVES 1 1
MAURITIUS 1 1 2
MYANMAR 9 2 7 2 1 21
NAMIBIA 1 1
NEPAL 5 13 1 1 6 26
NIGERIA 1 1 2
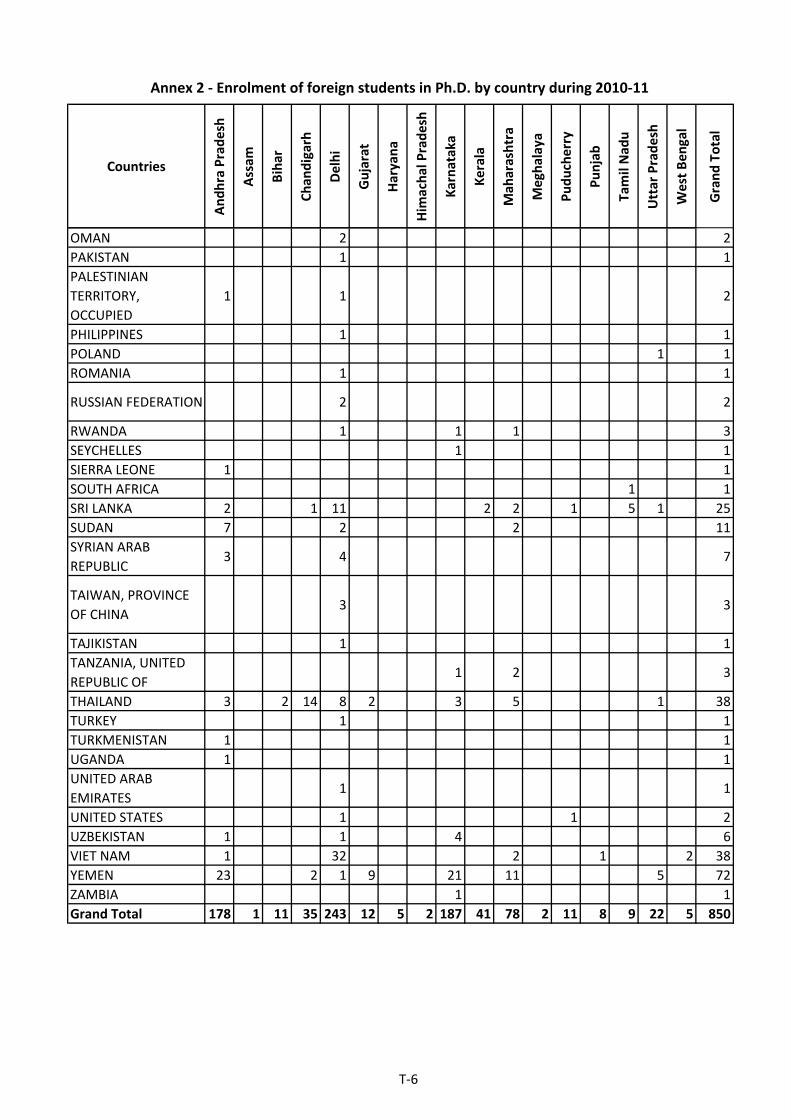
Annex 2 ‐ Enrolment of foreign students in Ph.D. by country during 2010‐11
T‐5
Countries
Andhra Pradesh
Assam
Bihar
Chan
digarh
Delhi
Gujarat
Haryana
Him
achal Pradesh
Karnataka
Kerala
Mah
arashtra
Meghalaya
Puducherry
Punjab
Tamil Nad
u
Uttar Pradesh
West Ben
gal
Grand Total
Annex 2 ‐ Enrolment of foreign students in Ph.D. by country during 2010‐11
OMAN 2 2
PAKISTAN 1 1
PALESTINIAN
TERRITORY,
OCCUPIED
1 1 2
PHILIPPINES 1 1
POLAND 1 1
ROMANIA 1 1
RUSSIAN FEDERATION 2 2
RWANDA 1 1 1 3
SEYCHELLES 1 1
SIERRA LEONE 1 1
SOUTH AFRICA 1 1
SRI LANKA 2 1 11 2 2 1 5 1 25
SUDAN 7 2 2 11
SYRIAN ARAB
REPUBLIC3 4 7
TAIWAN, PROVINCE
OF CHINA3 3
TAJIKISTAN 1 1
TANZANIA, UNITED
REPUBLIC OF1 2 3
THAILAND 3 2 14 8 2 3 5 1 38
TURKEY 1 1
TURKMENISTAN 1 1
UGANDA 1 1
UNITED ARAB
EMIRATES1 1
UNITED STATES 1 1 2
UZBEKISTAN 1 1 4 6
VIET NAM 1 32 2 1 2 38
YEMEN 23 2 1 9 21 11 5 72
ZAMBIA 1 1
Grand Total 178 1 11 35 243 12 5 2 187 41 78 2 11 8 9 22 5 850
T‐6

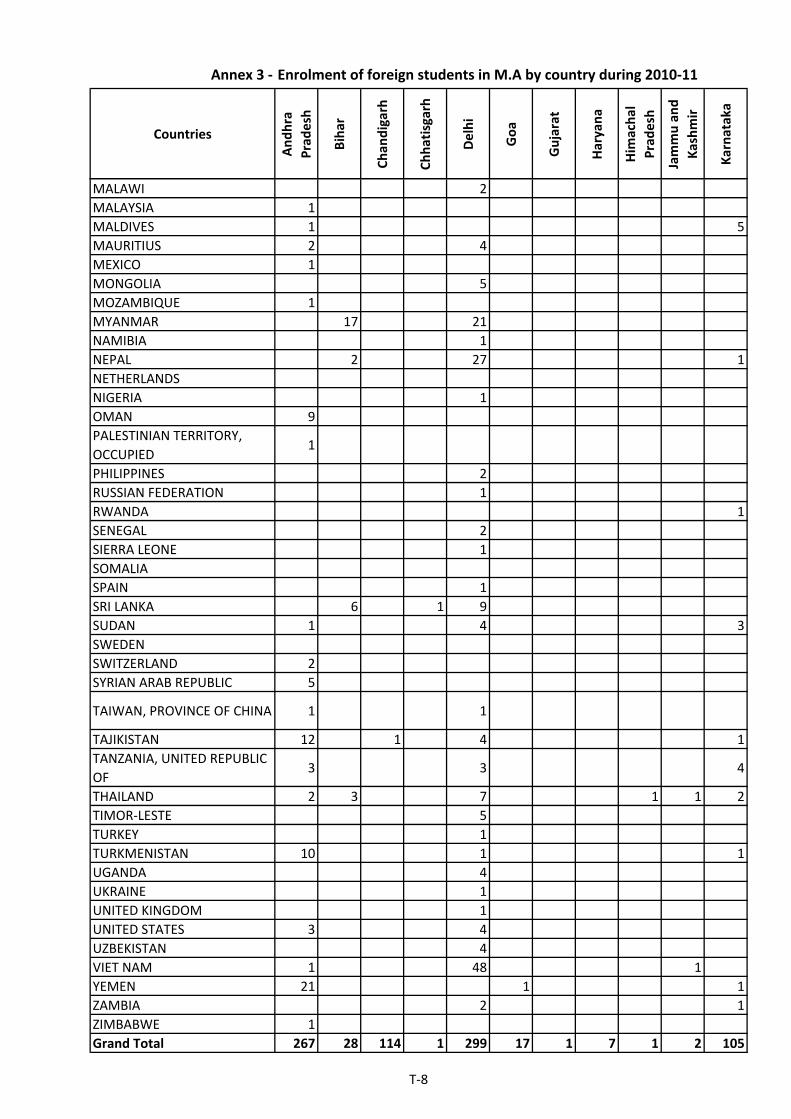
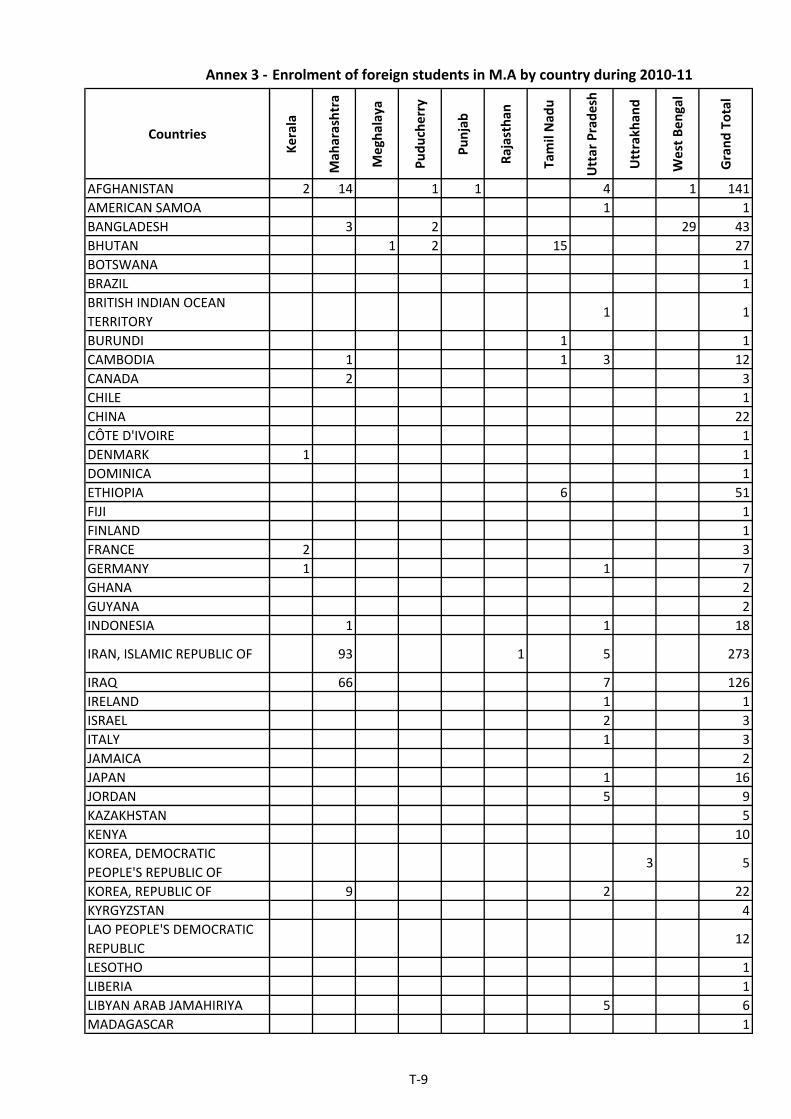
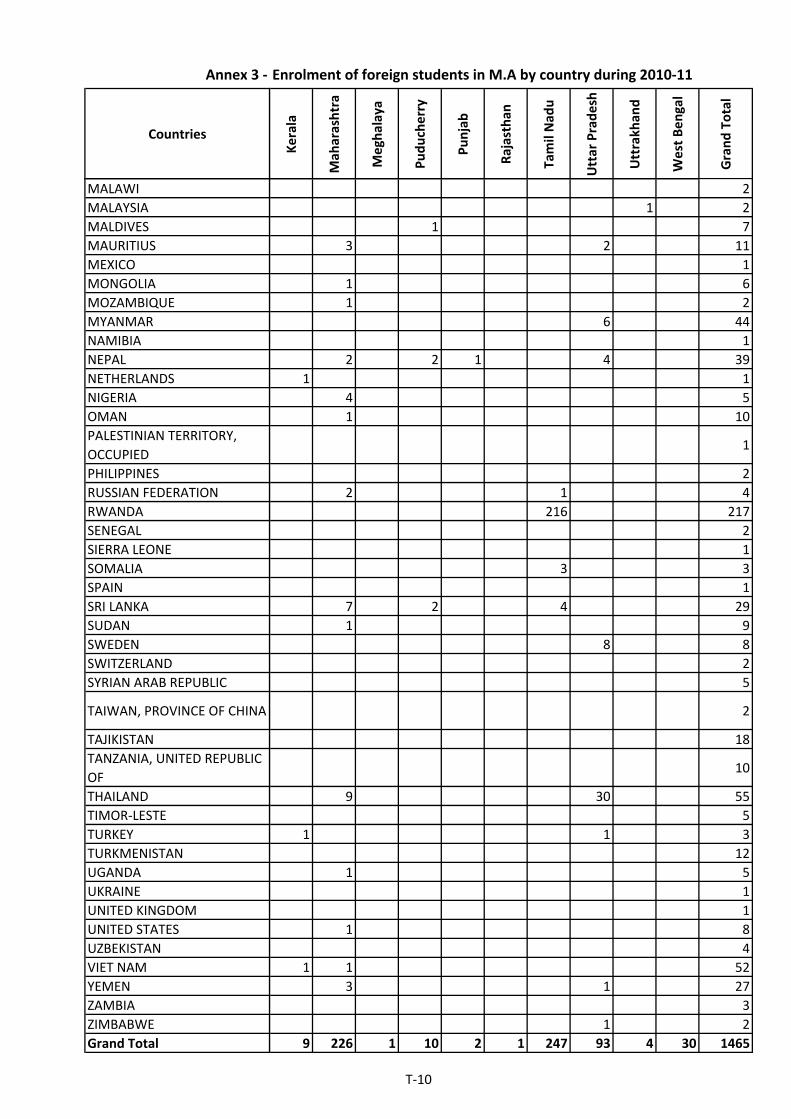
Annex 3 ‐ Enrolment of foreign students in M.A by country during 2010‐11
Countries
Andhra
Pradesh
Bihar
Chan
digarh
Chhatisgarh
Delhi
Goa
Gujarat
Haryana
Him
achal
Pradesh
Jammu and
Kashmir
Karnataka
AFGHANISTAN 29 66 16 7
AMERICAN SAMOA
BANGLADESH 1 7 1
BHUTAN 8 1
BOTSWANA 1
BRAZIL 1
BRITISH INDIAN OCEAN
TERRITORY
BURUNDI
CAMBODIA 1 5 1
CANADA 1
CHILE 1
CHINA 10 12
CÔTE D'IVOIRE 1
DENMARK
DOMINICA 1
ETHIOPIA 26 3 3 13
FIJI 1
FINLAND 1
FRANCE 1
GERMANY 5
GHANA 2
GUYANA 1 1
INDONESIA 5 11
IRAN, ISLAMIC REPUBLIC OF 58 46 13 57
IRAQ 48 1 3 1
IRELAND
ISRAEL 1
ITALY 2
JAMAICA 2
JAPAN 4 9 1 1
JORDAN 1 3
KAZAKHSTAN 1 4
KENYA 2 6 2
KOREA, DEMOCRATIC
PEOPLE'S REPUBLIC OF2
KOREA, REPUBLIC OF 11
KYRGYZSTAN 4
LAO PEOPLE'S DEMOCRATIC
REPUBLIC11 1
LESOTHO 1
LIBERIA 1
LIBYAN ARAB JAMAHIRIYA 1
MADAGASCAR 1
T‐7
Annex 3 ‐ Enrolment of foreign students in M.A by country during 2010‐11
Countries
Andhra
Pradesh
Bihar
Chan
digarh
Chhatisgarh
Delhi
Goa
Gujarat
Haryana
Him
achal
Pradesh
Jammu and
Kashmir
Karnataka
MALAWI 2
MALAYSIA 1
MALDIVES 1 5
MAURITIUS 2 4
MEXICO 1
MONGOLIA 5
MOZAMBIQUE 1
MYANMAR 17 21
NAMIBIA 1
NEPAL 2 27 1
NETHERLANDS
NIGERIA 1
OMAN 9
PALESTINIAN TERRITORY,
OCCUPIED1
PHILIPPINES 2
RUSSIAN FEDERATION 1
RWANDA 1
SENEGAL 2
SIERRA LEONE 1
SOMALIA
SPAIN 1
SRI LANKA 6 1 9
SUDAN 1 4 3
SWEDEN
SWITZERLAND 2
SYRIAN ARAB REPUBLIC 5
TAIWAN, PROVINCE OF CHINA 1 1
TAJIKISTAN 12 1 4 1
TANZANIA, UNITED REPUBLIC
OF3 3 4
THAILAND 2 3 7 1 1 2
TIMOR‐LESTE 5
TURKEY 1
TURKMENISTAN 10 1 1
UGANDA 4
UKRAINE 1
UNITED KINGDOM 1
UNITED STATES 3 4
UZBEKISTAN 4
VIET NAM 1 48 1
YEMEN 21 1 1
ZAMBIA 2 1
ZIMBABWE 1
Grand Total 267 28 114 1 299 17 1 7 1 2 105
T‐8
Annex 3 ‐
Countries
AFGHANISTAN
AMERICAN SAMOA
BANGLADESH
BHUTAN
BOTSWANA
BRAZIL
BRITISH INDIAN OCEAN
TERRITORY
BURUNDI
CAMBODIA
CANADA
CHILE
CHINA
CÔTE D'IVOIRE
DENMARK
DOMINICA
ETHIOPIA
FIJI
FINLAND
FRANCE
GERMANY
GHANA
GUYANA
INDONESIA
IRAN, ISLAMIC REPUBLIC OF
IRAQ
IRELAND
ISRAEL
ITALY
JAMAICA
JAPAN
JORDAN
KAZAKHSTAN
KENYA
KOREA, DEMOCRATIC
PEOPLE'S REPUBLIC OF
KOREA, REPUBLIC OF
KYRGYZSTAN
LAO PEOPLE'S DEMOCRATIC
REPUBLIC
LESOTHO
LIBERIA
LIBYAN ARAB JAMAHIRIYA
MADAGASCAR
Enrolment of foreign students in M.A by country during 2010‐11
Kerala
Mah
arashtra
Meghalaya
Puducherry
Punjab
Rajasthan
Tamil Nad
u
Uttar Pradesh
Uttrakh
and
West Bengal
Grand Total
2 14 1 1 4 1 141
1 1
3 2 29 43
1 2 15 27
1
1
1 1
1 1
1 1 3 12
2 3
1
22
1
1 1
1
6 51
1
1
2 3
1 1 7
2
2
1 1 18
93 1 5 273
66 7 126
1 1
2 3
1 3
2
1 16
5 9
5
10
3 5
9 2 22
4
12
1
1
5 6
1
T‐9
Annex 3 ‐
Countries
MALAWI
MALAYSIA
MALDIVES
MAURITIUS
MEXICO
MONGOLIA
MOZAMBIQUE
MYANMAR
NAMIBIA
NEPAL
NETHERLANDS
NIGERIA
OMAN
PALESTINIAN TERRITORY,
OCCUPIED
PHILIPPINES
RUSSIAN FEDERATION
RWANDA
SENEGAL
SIERRA LEONE
SOMALIA
SPAIN
SRI LANKA
SUDAN
SWEDEN
SWITZERLAND
SYRIAN ARAB REPUBLIC
TAIWAN, PROVINCE OF CHINA
TAJIKISTAN
TANZANIA, UNITED REPUBLIC
OF
THAILAND
TIMOR‐LESTE
TURKEY
TURKMENISTAN
UGANDA
UKRAINE
UNITED KINGDOM
UNITED STATES
UZBEKISTAN
VIET NAM
YEMEN
ZAMBIA
ZIMBABWE
Grand Total
Enrolment of foreign students in M.A by country during 2010‐11
Kerala
Mah
arashtra
Meghalaya
Puducherry
Punjab
Rajasthan
Tamil Nad
u
Uttar Pradesh
Uttrakh
and
West Bengal
Grand Total
2
1 2
1 7
3 2 11
1
1 6
1 2
6 44
1
2 2 1 4 39
1 1
4 5
1 10
1
2
2 1 4
216 217
2
1
3 3
1
7 2 4 29
1 9
8 8
2
5
2
18
10
9 30 55
5
1 1 3
12
1 5
1
1
1 8
4
1 1 52
3 1 27
3
1 2
9 226 1 10 2 1 247 93 4 30 1465
T‐10
Countries
Andhra Pradesh
Chan
digarh
Delhi
Goa
Gujarat
Haryana
Him
achal
Pradesh
Karnataka
Kerala
Mah
arashtra
Punjab
Tamil Nad
u
Uttar Pradesh
Uttrakhan
d
West Ben
gal
Grand Total
AFGHANISTAN 13 7 1 2 4 17 1 45
AUSTRALIA 2 1 2 5
BAHRAIN 1 16 1 18
BANGLADESH 2 4 6
BELGIUM 1 1
BENIN 1 1
BHUTAN 2 3 1 1 5 12
CAMBODIA 3 2 5
CANADA 4 5 9
CHINA 10 1 1 3 15
CONGO 1 1
CONGO, THE
DEMOCRATIC
REPUBLIC OF THE
2 2
CÔTE D'IVOIRE 2 2
DJIBOUTI 1 3 1 5
ERITREA 1 1
ETHIOPIA 28 2 7 16 3 56
FIJI 3 1 4
FRANCE 19 19
GHANA 3 3
INDONESIA 1 1 2 4
IRAN, ISLAMIC
REPUBLIC OF104 49 20 1 174
IRAQ 3 1 1 5
JAPAN 1 2 3
KENYA 1 1 1 1 1 4 9
KOREA, DEMOCRATIC
PEOPLE'S REPUBLIC
OF
1 1
KOREA, REPUBLIC OF 1 1
KUWAIT 2 6 8
KYRGYZSTAN 2 2
LAO PEOPLE'S
DEMOCRATIC
REPUBLIC
1 1 4 6
LESOTHO 1 1
MALAWI 1 1
MALAYSIA 1 1
MALDIVES 1 1 2 4
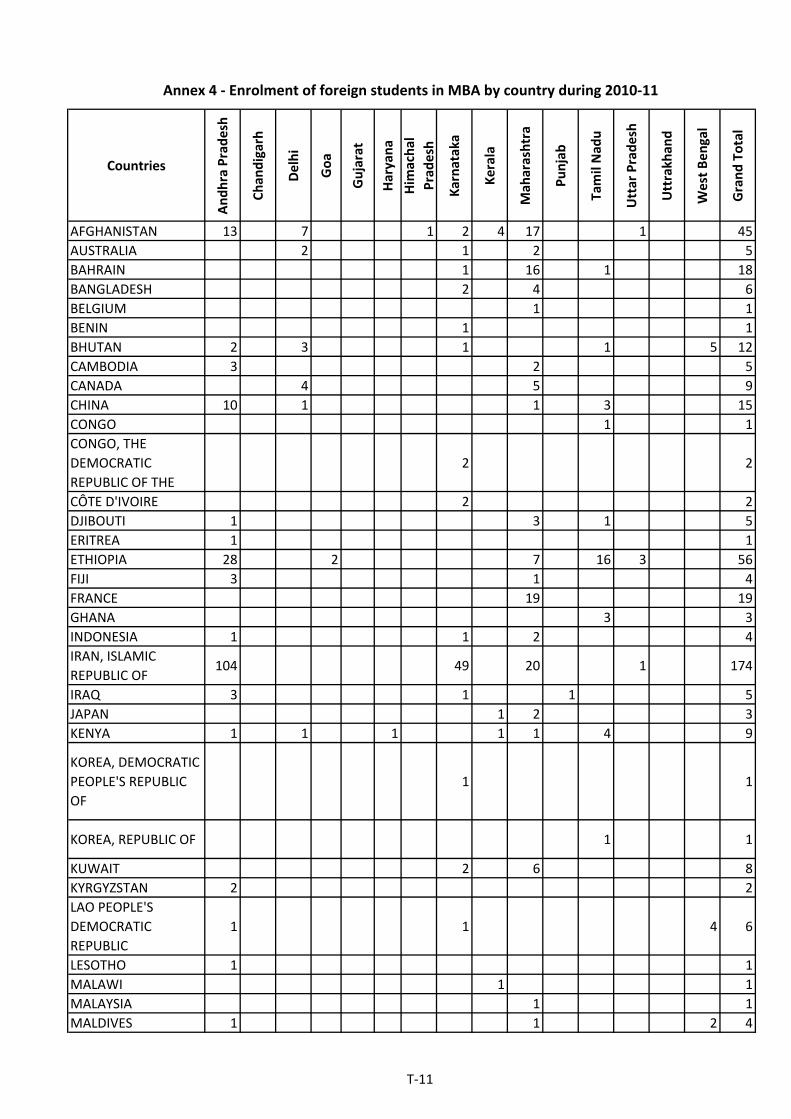
Annex 4 ‐ Enrolment of foreign students in MBA by country during 2010‐11
T‐11

Countries
Andhra Pradesh
Chan
digarh
Delhi
Goa
Gujarat
Haryana
Him
achal
Pradesh
Karnataka
Kerala
Mah
arashtra
Punjab
Tamil Nad
u
Uttar Pradesh
Uttrakhan
d
West Ben
gal
Grand Total
Annex 4 ‐ Enrolment of foreign students in MBA by country during 2010‐11
MAURITIUS 1 1
MONGOLIA 2 3 5
MOZAMBIQUE 3 3
MYANMAR 1 1
NEPAL 19 31 3 19 34 3 78 19 16 1 223
NETHERLANDS 1 1
NEW ZEALAND 1 1 2
NIGERIA 2 1 2 5
OMAN 4 17 1 22
PALESTINIAN
TERRITORY,
OCCUPIED
1 2 3
QATAR 1 3 4
RUSSIAN FEDERATION 3 1 4
RWANDA 11 11
SAUDI ARABIA 1 1 8 10
SINGAPORE 1 1 2
SOMALIA 3 3
SOUTH AFRICA 4 2 1 7
SRI LANKA 3 2 2 3 10
SUDAN 3 1 1 1 2 8
SWAZILAND 2 1 3
SWEDEN 1 1
SYRIAN ARAB
REPUBLIC1 1
TAJIKISTAN 6 4 10
TANZANIA, UNITED
REPUBLIC OF9 2 2 4 17 1 35
THAILAND 2 1 3 6
TURKEY 1 1
UGANDA 2 1 2 5
UKRAINE 1 1
UNITED ARAB
EMIRATES13 38 1 52
UNITED KINGDOM 1 2 2 8 13
UNITED STATES 1 1 12 14
UZBEKISTAN 1 1
VIET NAM 1 2 3
YEMEN 16 3 19
Grand Total 250 1 54 2 4 21 1 139 12 310 18 70 22 1 15 920
T‐12

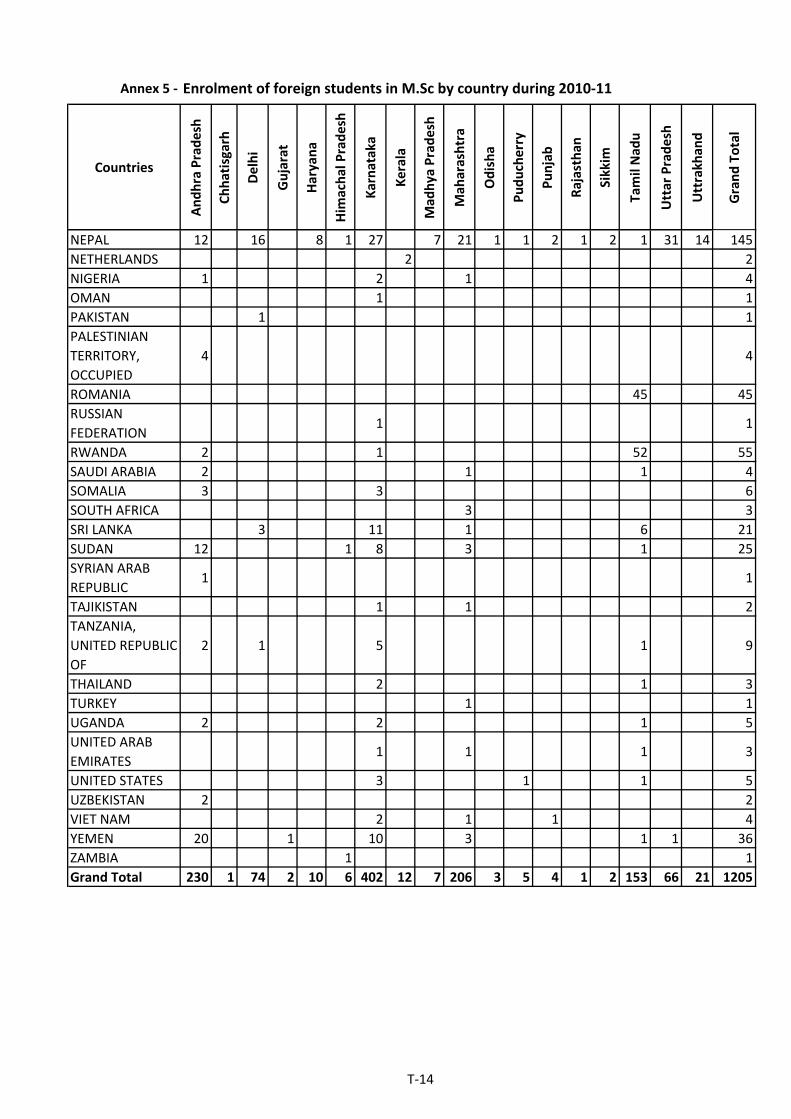
Annex 5 ‐ Enrolment of foreign students in M.Sc by country during 2010‐11
Countries
Andhra Pradesh
Chhatisgarh
Delhi
Gujarat
Haryana
Him
achal Pradesh
Karnataka
Kerala
Mad
hya Pradesh
Mah
arashtra
Odisha
Puducherry
Punjab
Rajasthan
Sikkim
Tamil Nad
u
Uttar Pradesh
Uttrakhan
d
Grand Total
AFGHANISTAN 14 22 1 3 3 4 8 1 56
AUSTRALIA 1 1
BANGLADESH 12 1 1 14
BELARUS 1 1
BELGIUM 1 1
BHUTAN 1 1 1 5 8
BURUNDI 2 1 3
CAMBODIA 2 2
CAMEROON 1 1
CANADA 1 1
CHAD 1 1
CHINA 3 3 87 1 12 106
DENMARK 1 1
DJIBOUTI 1 3 4
ERITREA 1 1
ETHIOPIA 27 1 1 1 4 1 1 1 4 41
FIJI 3 3
FRANCE 1 1
GHANA 2 2 4
INDONESIA 1 1 1 3
IRAN, ISLAMIC
REPUBLIC OF57 5 119 4 64 3 252
IRAQ 59 2 87 82 5 19 254
JAPAN 1 1 2
JORDAN 1 1
KAZAKHSTAN 1 1
KENYA 1 3 1 10 15
KOREA,
DEMOCRATIC
PEOPLE'S
REPUBLIC OF
1 1
KOREA, REPUBLIC
OF3 3
KUWAIT 2 1 3
LIBERIA 1 1
LIBYAN ARAB
JAMAHIRIYA2 2 11 15
MALAYSIA 2 2
MALDIVES 1 4 5
MAURITIUS 1 2 1 4
MONGOLIA 1 2 3
NAMIBIA 1 1
T‐13
Annex 5 ‐ Enrolment of foreign students in M.Sc by country during 2010‐11
Countries
Andhra Pradesh
Chhatisgarh
Delhi
Gujarat
Haryana
Him
achal Pradesh
Karnataka
Kerala
Mad
hya Pradesh
Mah
arashtra
Odisha
Puducherry
Punjab
Rajasthan
Sikkim
Tamil Nad
u
Uttar Pradesh
Uttrakhan
d
Grand Total
NEPAL 12 16 8 1 27 7 21 1 1 2 1 2 1 31 14 145
NETHERLANDS 2 2
NIGERIA 1 2 1 4
OMAN 1 1
PAKISTAN 1 1
PALESTINIAN
TERRITORY,
OCCUPIED
4 4
ROMANIA 45 45
RUSSIAN
FEDERATION1 1
RWANDA 2 1 52 55
SAUDI ARABIA 2 1 1 4
SOMALIA 3 3 6
SOUTH AFRICA 3 3
SRI LANKA 3 11 1 6 21
SUDAN 12 1 8 3 1 25
SYRIAN ARAB
REPUBLIC1 1
TAJIKISTAN 1 1 2
TANZANIA,
UNITED REPUBLIC
OF
2 1 5 1 9
THAILAND 2 1 3
TURKEY 1 1
UGANDA 2 2 1 5
UNITED ARAB
EMIRATES1 1 1 3
UNITED STATES 3 1 1 5
UZBEKISTAN 2 2
VIET NAM 2 1 1 4
YEMEN 20 1 10 3 1 1 36
ZAMBIA 1 1
Grand Total 230 1 74 2 10 6 402 12 7 206 3 5 4 1 2 153 66 21 1205
T‐14
Countries
Andhra
Pradesh
Gujarat
Haryana
Karnataka
Mah
arashtra
Odisha
Puducherry
Punjab
Sikkim
Tamil Nad
u
Uttar Pradesh
Grand Total
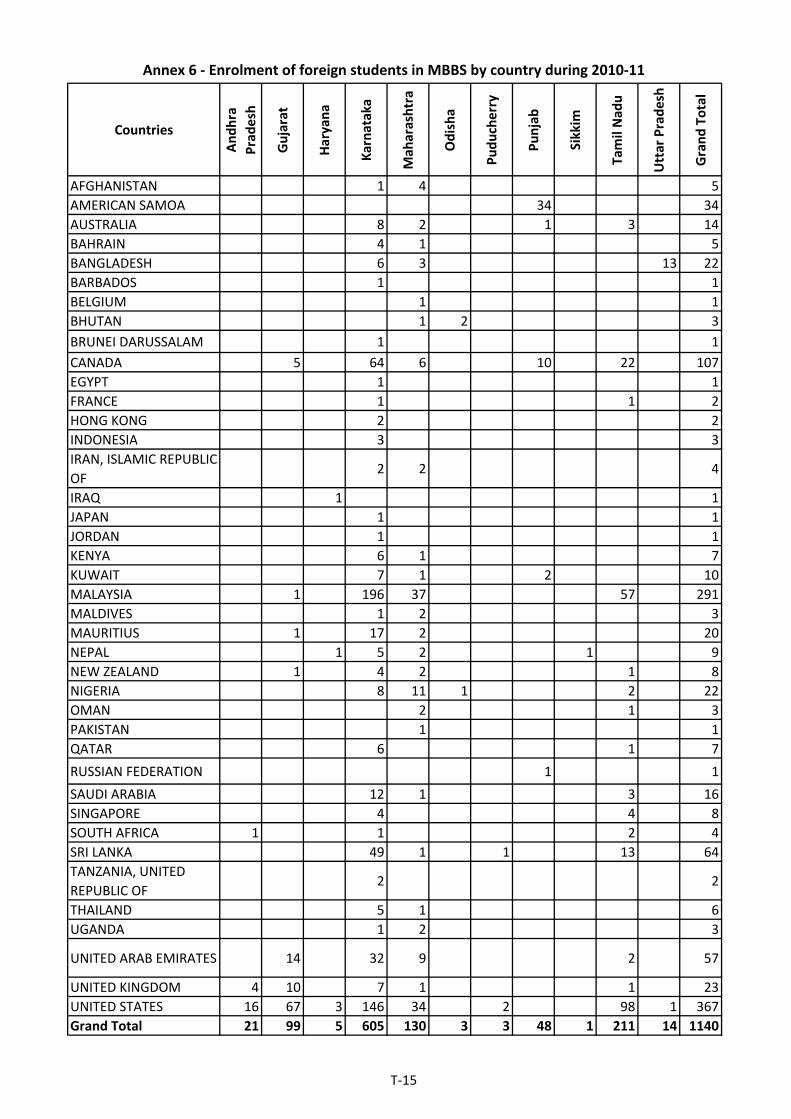
AFGHANISTAN 1 4 5
AMERICAN SAMOA 34 34
AUSTRALIA 8 2 1 3 14
BAHRAIN 4 1 5
BANGLADESH 6 3 13 22
BARBADOS 1 1
BELGIUM 1 1
BHUTAN 1 2 3
BRUNEI DARUSSALAM 1 1
CANADA 5 64 6 10 22 107
EGYPT 1 1
FRANCE 1 1 2
HONG KONG 2 2
INDONESIA 3 3
IRAN, ISLAMIC REPUBLIC
OF2 2 4
IRAQ 1 1
JAPAN 1 1
JORDAN 1 1
KENYA 6 1 7
KUWAIT 7 1 2 10
MALAYSIA 1 196 37 57 291
MALDIVES 1 2 3
MAURITIUS 1 17 2 20
NEPAL 1 5 2 1 9
NEW ZEALAND 1 4 2 1 8
NIGERIA 8 11 1 2 22
OMAN 2 1 3
PAKISTAN 1 1
QATAR 6 1 7
RUSSIAN FEDERATION 1 1
SAUDI ARABIA 12 1 3 16
SINGAPORE 4 4 8
SOUTH AFRICA 1 1 2 4
SRI LANKA 49 1 1 13 64
TANZANIA, UNITED
REPUBLIC OF2 2
THAILAND 5 1 6
UGANDA 1 2 3
UNITED ARAB EMIRATES 14 32 9 2 57
UNITED KINGDOM 4 10 7 1 1 23
UNITED STATES 16 67 3 146 34 2 98 1 367
Grand Total 21 99 5 605 130 3 3 48 1 211 14 1140
Annex 6 ‐ Enrolment of foreign students in MBBS by country during 2010‐11
T‐15
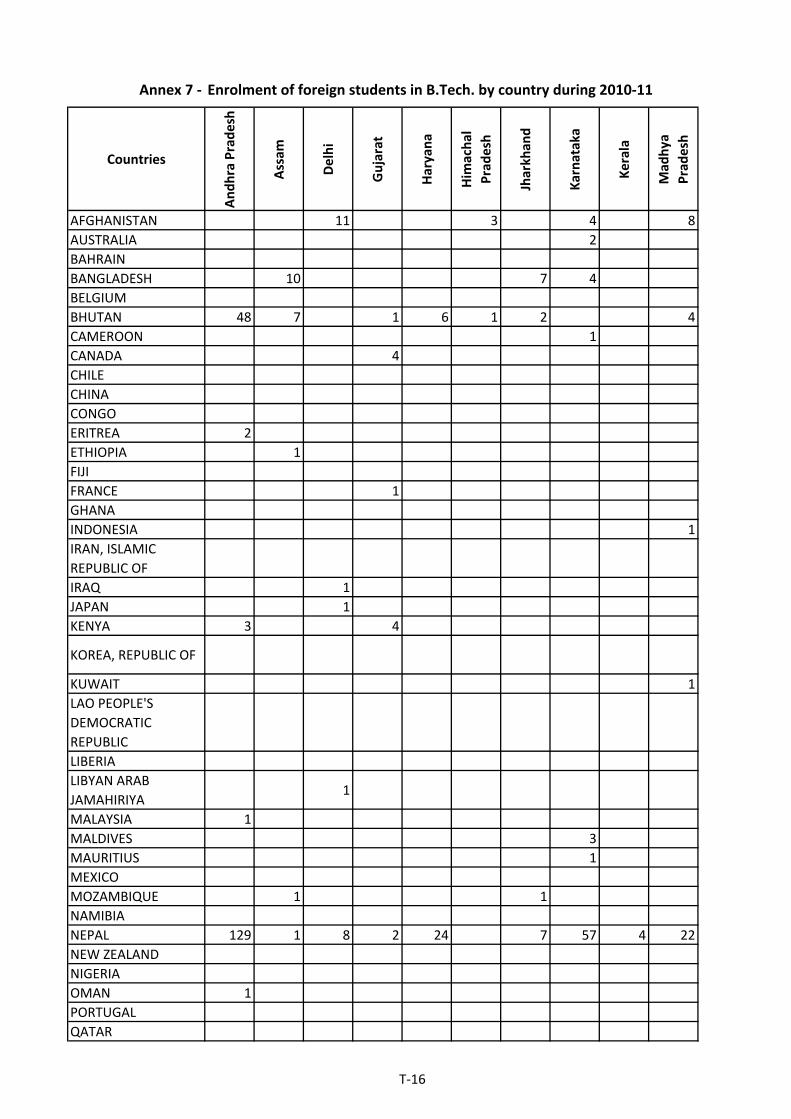
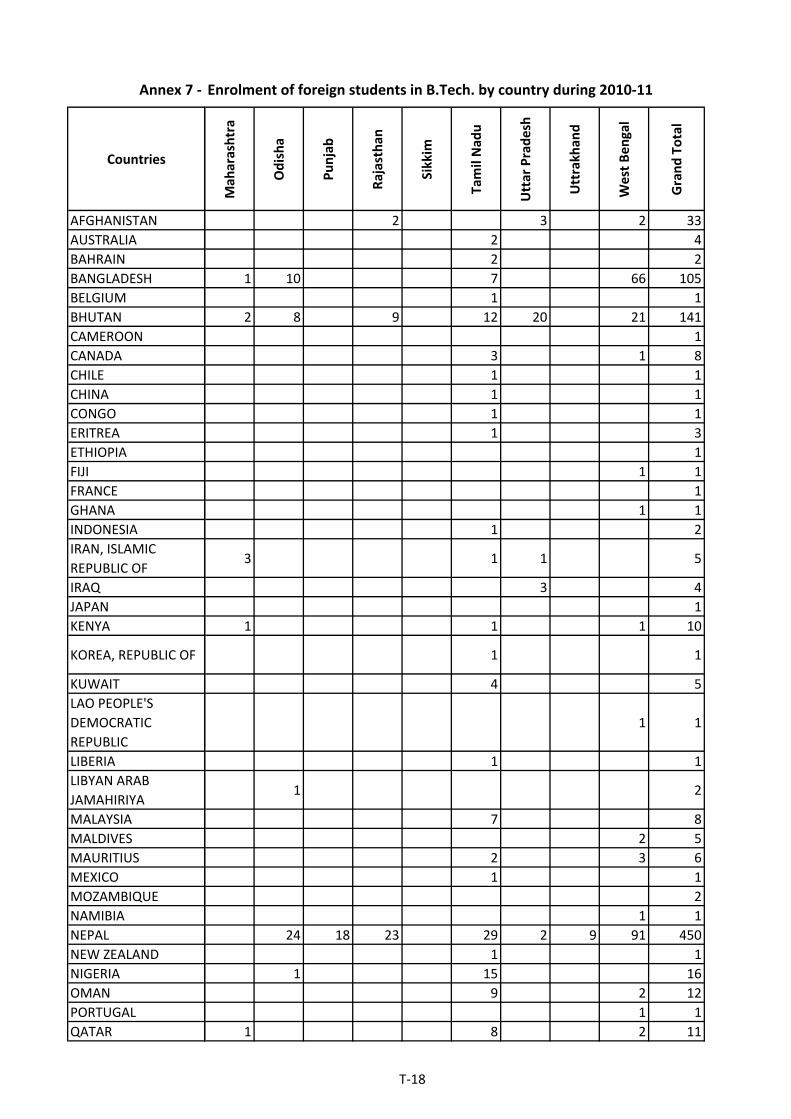
Annex 7 ‐ Enrolment of foreign students in B.Tech. by country during 2010‐11
Countries
Andhra Pradesh
Assam
Delhi
Gujarat
Haryana
Him
achal
Pradesh
Jharkhan
d
Karnataka
Kerala
Mad
hya
Pradesh
AFGHANISTAN 11 3 4 8
AUSTRALIA 2
BAHRAIN
BANGLADESH 10 7 4
BELGIUM
BHUTAN 48 7 1 6 1 2 4
CAMEROON 1
CANADA 4
CHILE
CHINA
CONGO
ERITREA 2
ETHIOPIA 1
FIJI
FRANCE 1
GHANA
INDONESIA 1
IRAN, ISLAMIC
REPUBLIC OF
IRAQ 1
JAPAN 1
KENYA 3 4
KOREA, REPUBLIC OF
KUWAIT 1
LAO PEOPLE'S
DEMOCRATIC
REPUBLIC
LIBERIA
LIBYAN ARAB
JAMAHIRIYA1
MALAYSIA 1
MALDIVES 3
MAURITIUS 1
MEXICO
MOZAMBIQUE 1 1
NAMIBIA
NEPAL 129 1 8 2 24 7 57 4 22
NEW ZEALAND
NIGERIA
OMAN 1
PORTUGAL
QATAR
T‐16

Annex 7 ‐ Enrolment of foreign students in B.Tech. by country during 2010‐11
Countries
Andhra Pradesh
Assam
Delhi
Gujarat
Haryana
Him
achal
Pradesh
Jharkhan
d
Karnataka
Kerala
Mad
hya
Pradesh
ROMANIA
RWANDA 1
SAUDI ARABIA 2 1 4
SINGAPORE
SOUTH AFRICA
SRI LANKA 2 3 1 3 2 1
SUDAN 29 1
TAIWAN, PROVINCE
OF CHINA1
TAJIKISTAN 1
TANZANIA, UNITED
REPUBLIC OF1 1
THAILAND
UGANDA 2 3
UNITED ARAB
EMIRATES4
UNITED KINGDOM 1 1
UNITED STATES 4 8 7
VIET NAM 1 1
YEMEN 10
Grand Total 232 24 23 21 31 6 21 84 7 48
T‐17
Annex 7 ‐
Countries
AFGHANISTAN
AUSTRALIA
BAHRAIN
BANGLADESH
BELGIUM
BHUTAN
CAMEROON
CANADA
CHILE
CHINA
CONGO
ERITREA
ETHIOPIA
FIJI
FRANCE
GHANA
INDONESIA
IRAN, ISLAMIC
REPUBLIC OF
IRAQ
JAPAN
KENYA
KOREA, REPUBLIC OF
KUWAIT
LAO PEOPLE'S
DEMOCRATIC
REPUBLIC
LIBERIA
LIBYAN ARAB
JAMAHIRIYA
MALAYSIA
MALDIVES
MAURITIUS
MEXICO
MOZAMBIQUE
NAMIBIA
NEPAL
NEW ZEALAND
NIGERIA
OMAN
PORTUGAL
QATAR
Enrolment of foreign students in B.Tech. by country during 2010‐11
Mah
arashtra
Odisha
Punjab
Rajasthan
Sikkim
Tamil Nad
u
Uttar Pradesh
Uttrakhan
d
West Ben
gal
Grand Total
2 3 2 33
2 4
2 2
1 10 7 66 105
1 1
2 8 9 12 20 21 141
1
3 1 8
1 1
1 1
1 1
1 3
1
1 1
1
1 1
1 2
3 1 1 5
3 4
1
1 1 1 10
1 1
4 5
1 1
1 1
1 2
7 8
2 5
2 3 6
1 1
2
1 1
24 18 23 29 2 9 91 450
1 1
1 15 16
9 2 12
1 1
1 8 2 11
T‐18

Annex 7 ‐
Countries
ROMANIA
RWANDA
SAUDI ARABIA
SINGAPORE
SOUTH AFRICA
SRI LANKA
SUDAN
TAIWAN, PROVINCE
OF CHINA
TAJIKISTAN
TANZANIA, UNITED
REPUBLIC OF
THAILAND
UGANDA
UNITED ARAB
EMIRATES
UNITED KINGDOM
UNITED STATES
VIET NAM
YEMEN
Grand Total
Enrolment of foreign students in B.Tech. by country during 2010‐11
Mah
arashtra
Odisha
Punjab
Rajasthan
Sikkim
Tamil Nad
u
Uttar Pradesh
Uttrakhan
d
West Ben
gal
Grand Total
1 1
5 6
6 1 14
12 12
3 3
41 3 56
4 1 35
1
1
2 1 1 6
4 1 5
1 6
1 30 2 37
2 2 6
4 12 35
2
2 1 13
10 48 19 34 234 32 9 207 1090
T‐19

Countries
Andhra Pradesh
Chhatisgarh
Delhi
Goa
Gujarat
Karnataka
Kerala
Mah
arashtra
Odisha
Punjab
Tamil Nad
u
Grand Total
AFGHANISTAN 2 1 3
AMERICAN SAMOA 2 1 3
BANGLADESH 1 1
BHUTAN 2 66 68
BRITISH INDIAN
OCEAN TERRITORY1 1
CAMEROON 1 1
CANADA 1 1 2
CHINA 12 12
CONGO 5 5
ETHIOPIA 1 1
IRAN, ISLAMIC
REPUBLIC OF2 2
ITALY 1 1
KENYA 1 2 1 4
KUWAIT 4 4
MALDIVES 1 1
MEXICO 1 1
NAMIBIA 7 7
NEPAL 10 2 1 1462 2 12 1489
NIGERIA 2 18 2 22
RWANDA 3 3
SAUDI ARABIA 4 4
SOMALIA 1 1
SRI LANKA 1 1
SUDAN 1 1
SWITZERLAND 1 1
TANZANIA, UNITED
REPUBLIC OF4 4
UGANDA 1 7 8
UNITED ARAB
EMIRATES2 2
UNITED STATES 1 1 18 3 4 5 32
Grand Total 12 1 21 2 1615 4 5 12 4 9 1685
Annex 8 ‐ Enrolment of foreign students in B. Sc. Nursing by country during 2010‐11
T‐20
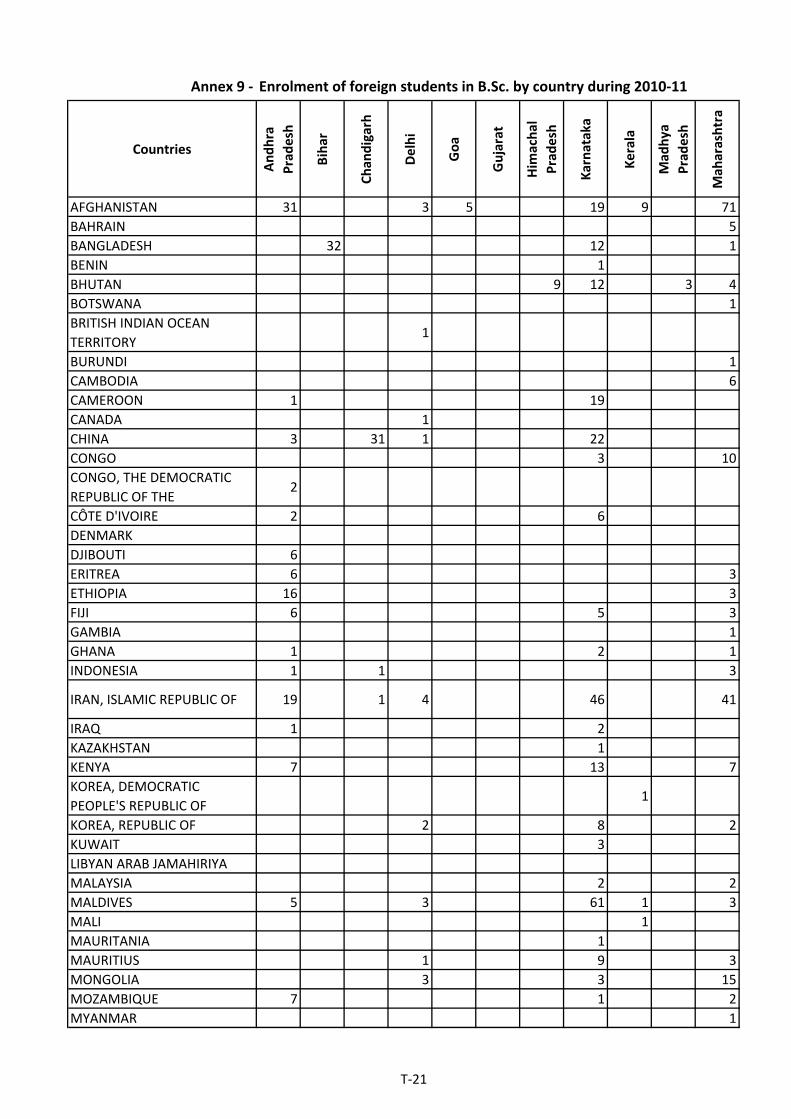
Annex 9 ‐ Enrolment of foreign students in B.Sc. by country during 2010‐11
Countries
Andhra
Pradesh
Bihar
Chan
digarh
Delhi
Goa
Gujarat
Him
achal
Pradesh
Karnataka
Kerala
Mad
hya
Pradesh
Mah
arashtra
AFGHANISTAN 31 3 5 19 9 71
BAHRAIN 5
BANGLADESH 32 12 1
BENIN 1
BHUTAN 9 12 3 4
BOTSWANA 1
BRITISH INDIAN OCEAN
TERRITORY1
BURUNDI 1
CAMBODIA 6
CAMEROON 1 19
CANADA 1
CHINA 3 31 1 22
CONGO 3 10
CONGO, THE DEMOCRATIC
REPUBLIC OF THE2
CÔTE D'IVOIRE 2 6
DENMARK
DJIBOUTI 6
ERITREA 6 3
ETHIOPIA 16 3
FIJI 6 5 3
GAMBIA 1
GHANA 1 2 1
INDONESIA 1 1 3
IRAN, ISLAMIC REPUBLIC OF 19 1 4 46 41
IRAQ 1 2
KAZAKHSTAN 1
KENYA 7 13 7
KOREA, DEMOCRATIC
PEOPLE'S REPUBLIC OF1
KOREA, REPUBLIC OF 2 8 2
KUWAIT 3
LIBYAN ARAB JAMAHIRIYA
MALAYSIA 2 2
MALDIVES 5 3 61 1 3
MALI 1
MAURITANIA 1
MAURITIUS 1 9 3
MONGOLIA 3 3 15
MOZAMBIQUE 7 1 2
MYANMAR 1
T‐21

Annex 9 ‐ Enrolment of foreign students in B.Sc. by country during 2010‐11
Countries
Andhra
Pradesh
Bihar
Chan
digarh
Delhi
Goa
Gujarat
Him
achal
Pradesh
Karnataka
Kerala
Mad
hya
Pradesh
Mah
arashtra
NAMIBIA 1 1
NEPAL 1 8 4 94 1 5
NIGERIA 2 5 4
OMAN 9 11 3
PALESTINIAN TERRITORY,
OCCUPIED1
PHILIPPINES 1
PORTUGAL 1
QATAR 1 1
RUSSIAN FEDERATION 1
RWANDA 1
SAUDI ARABIA 9 6 4
SEYCHELLES 2
SINGAPORE 1 2
SOMALIA 43 3
SOUTH AFRICA 3
SPAIN 1
SRI LANKA 3 1 146 16
SUDAN 85 11 15
SWEDEN 4
SWITZERLAND
SYRIAN ARAB REPUBLIC 1
TAJIKISTAN 7
TANZANIA, UNITED REPUBLIC
OF29 16
THAILAND 1 3
TIMOR‐LESTE 1
TOGO 2
TURKEY 1
TURKMENISTAN 2
UGANDA 3 1 17 1
UNITED ARAB EMIRATES 13 5
UNITED KINGDOM 1
UNITED STATES 1 5 1 3 1
UZBEKISTAN 1
VIET NAM 1
YEMEN 20 7 15
ZAMBIA 1
ZIMBABWE 1
Grand Total 328 40 33 31 5 1 9 594 14 3 281
T‐22

Annex 9 ‐
Countries
AFGHANISTAN
BAHRAIN
BANGLADESH
BENIN
BHUTAN
BOTSWANA
BRITISH INDIAN OCEAN
TERRITORY
BURUNDI
CAMBODIA
CAMEROON
CANADA
CHINA
CONGO
CONGO, THE DEMOCRATIC
REPUBLIC OF THE
CÔTE D'IVOIRE
DENMARK
DJIBOUTI
ERITREA
ETHIOPIA
FIJI
GAMBIA
GHANA
INDONESIA
IRAN, ISLAMIC REPUBLIC OF
IRAQ
KAZAKHSTAN
KENYA
KOREA, DEMOCRATIC
PEOPLE'S REPUBLIC OF
KOREA, REPUBLIC OF
KUWAIT
LIBYAN ARAB JAMAHIRIYA
MALAYSIA
MALDIVES
MALI
MAURITANIA
MAURITIUS
MONGOLIA
MOZAMBIQUE
MYANMAR
Enrolment of foreign students in B.Sc. by country during 2010‐11
Meghalaya
Puducherry
Punjab
Rajasthan
Sikkim
Tamil Nad
u
Uttar Pradesh
Uttrakhan
d
West Ben
gal
Grand Total
138
5
3 2 7 57
1
6 38 12 2 86
1
1
1 2
6
20
1 2
221 5 283
1 1 15
2
8
1 1
6
9
19
14
1
4
5
111
3
1
2 21 50
1
1 13
3
1 1
4
73
1
1
13
21
10
1 2
T‐23

Annex 9 ‐
Countries
NAMIBIA
NEPAL
NIGERIA
OMAN
PALESTINIAN TERRITORY,
OCCUPIED
PHILIPPINES
PORTUGAL
QATAR
RUSSIAN FEDERATION
RWANDA
SAUDI ARABIA
SEYCHELLES
SINGAPORE
SOMALIA
SOUTH AFRICA
SPAIN
SRI LANKA
SUDAN
SWEDEN
SWITZERLAND
SYRIAN ARAB REPUBLIC
TAJIKISTAN
TANZANIA, UNITED REPUBLIC
OF
THAILAND
TIMOR‐LESTE
TOGO
TURKEY
TURKMENISTAN
UGANDA
UNITED ARAB EMIRATES
UNITED KINGDOM
UNITED STATES
UZBEKISTAN
VIET NAM
YEMEN
ZAMBIA
ZIMBABWE
Grand Total
Enrolment of foreign students in B.Sc. by country during 2010‐11
Meghalaya
Puducherry
Punjab
Rajasthan
Sikkim
Tamil Nad
u
Uttar Pradesh
Uttrakhan
d
West Ben
gal
Grand Total
2
1 7 11 79 1 212
3 14
2 25
1 2
1
1
2
1
10 11
1 20
2
1 4
46
2 5
1
18 1 185
13 124
4
1 1
1
7
1 46
1 5
1
2
1
2
2 24
6 24
1 2
1 12
1
1
42
1
1
9 2 1 1 353 29 79 17 1830
T‐24

Annex 10 ‐ Enrolment of foreign students in B. Pharm. by country during 2010‐11
Countries
Andhra
Pradesh
Gujarat
Haryana
Karnataka
Mah
arashtra
Punjab
Tamil Nad
u
Uttar Pradesh
Uttrakhan
d
Grand Total
AFGHANISTAN 1 1 2
AUSTRALIA 1 1
BANGLADESH 2 1 3
BHUTAN 5 5
BOTSWANA 1 1
CANADA 1 3 1 5
CÔTE D'IVOIRE 5 5
ERITREA 2 1 3
FIJI 1 1
GHANA 1 1
HUNGARY 2 2
IRAN, ISLAMIC REPUBLIC
OF2 205 86 4 297
IRAQ 17 1 123 9 1 2 153
KENYA 3 31 1 11 46
KOREA, REPUBLIC OF 1 1
MALAYSIA 3 3
MAURITIUS 6 6
NEPAL 1 296 2 8 307
NIGERIA 3 1 2 2 1 11 20
OMAN 1 1 2
RWANDA 4 4
SAUDI ARABIA 1 1 2
SOMALIA 6 6
SRI LANKA 1 2 3
SUDAN 87 106 1 20 214
SURINAME 1 1
SYRIAN ARAB REPUBLIC 2 2
TANZANIA, UNITED
REPUBLIC OF1 13 3 1 3 21
UGANDA 4 19 2 3 28
UNITED ARAB EMIRATES 2 2
UNITED KINGDOM 1 1
UNITED STATES 1 2 1 4
UZBEKISTAN 1 1
VIET NAM 1 1 2
YEMEN 6 10 2 18
ZAMBIA 1 1
Grand Total 144 2 3 835 111 9 60 2 8 1174
T‐25

Countries
Andhra
Pradesh
Chan
digarh
Him
achal
Pradesh
Karnataka
Mah
arashtra
Punjab
Tamil Nad
u
Grand Total
AFGHANISTAN 34 12 9 55
AMERICAN SAMOA 1 1
ANGOLA 15 15
AUSTRALIA 2 3 5
AUSTRIA 1 1
BAHRAIN 8 9 1 1 19
BANGLADESH 1 7 3 11
BELGIUM 1 1
BHUTAN 1 12 35 48
BOLIVIA 1 1
BOTSWANA 1 1
BRAZIL 1 1 2
BRITISH INDIAN
OCEAN TERRITORY1 1
CAMEROON 4 4
CANADA 4 4 4 5 17
CHAD 2 2
CHINA 20 2 22
CONGO 9 9
CONGO, THE
DEMOCRATIC
REPUBLIC OF THE
2 2
CÔTE D'IVOIRE 2 2
DJIBOUTI 2 2
EGYPT 1 1
ERITREA 2 1 3
ETHIOPIA 8 1 9
FRANCE 1 1
GERMANY 1 1
GHANA 1 1
INDONESIA 3 2 1 2 8
IRAN, ISLAMIC
REPUBLIC OF13 42 1 56
IRAQ 7 7
JAPAN 1 1
JORDAN 2 2 4
KENYA 2 20 2 24
KOREA, REPUBLIC OF 1 1 3 5
KUWAIT 9 8 2 19
LIBYAN ARAB
JAMAHIRIYA1 1
Annex 11 ‐ Enrolment of foreign students in Bachelor of Engineering by country during 2010‐
11
T‐26
Countries
Andhra
Pradesh
Chan
digarh
Him
achal
Pradesh
Karnataka
Mah
arashtra
Punjab
Tamil Nad
u
Grand Total
Annex 11 ‐ Enrolment of foreign students in Bachelor of Engineering by country during 2010‐
11
MADAGASCAR 1 1
MALAYSIA 17 17
MALDIVES 3 1 4
MAURITIUS 14 1 15
MEXICO 1 1
MOZAMBIQUE 2 2
NEPAL 2 37 149 1 2 23 214
NEW ZEALAND 1 1
NIGERIA 1 3 3 2 2 2 13
OMAN 3 12 7 1 23
PALESTINIAN
TERRITORY,
OCCUPIED
5 4 9
PHILIPPINES 1 1
QATAR 1 3 2 3 9
ROMANIA 12 12
RUSSIAN FEDERATION 1 1 2
SAUDI ARABIA 16 4 8 28
SINGAPORE 1 7 5 13
SOMALIA 5 5
SRI LANKA 1 28 60 89
SUDAN 36 12 1 12 61
SYRIAN ARAB
REPUBLIC3 3
TANZANIA, UNITED
REPUBLIC OF8 1 7 16
THAILAND 1 4 2 2 9
UNITED ARAB
EMIRATES21 39 3 63
UNITED KINGDOM 3 2 5
UNITED STATES 23 24 5 4 28 84
YEMEN 59 18 3 80
ZAMBIA 1 1
Grand Total 259 148 3 461 14 20 238 1143
T‐27
Countries
Andhra
Pradesh
Chan
digarh
Dam
an & Diu
Gujarat
Haryana
Him
achal
Pradesh
Jammu and
Kashmir
Karnataka
Mah
arashtra
Odisha
Punjab
Tamil Nad
u
Grand Total
AFGHANISTAN 4 4
AMERICAN SAMOA 1 1
AUSTRALIA 2 3 1 1 2 9
BAHRAIN 2 1 3
BANGLADESH 4 4
BHUTAN 4 3 8 3 18
BOTSWANA 1 1
BRITISH INDIAN OCEAN
TERRITORY1 1
BRUNEI DARUSSALAM 1 1
CANADA 11 1 1 33 4 7 3 60
DJIBOUTI 2 2
EGYPT 1 1
ETHIOPIA 2 2
GERMANY 1 1
HONG KONG 1 1
INDONESIA 1 1
IRAN, ISLAMIC REPUBLIC OF 1 235 59 295
IRAQ 4 1 5
ISLE OF MAN 1 1
KENYA 17 2 19
KOREA, DEMOCRATIC PEOPLE'S
REPUBLIC OF2 2
KOREA, REPUBLIC OF 1 1 2
KUWAIT 2 2 4
LEBANON 1 1
MALAYSIA 268 206 474
MALDIVES 2 2
MAURITIUS 4 2 6
NEPAL 20 20
NEW ZEALAND 3 3
NIGERIA 1 1
OMAN 3 3
QATAR 1 1
SAUDI ARABIA 2 3 1 6
SEYCHELLES 1 1
SINGAPORE 1 1
SOUTH AFRICA 1 1 2
SRI LANKA 2 23 25
SUDAN 1 1
SWITZERLAND 1 1
THAILAND 1 1
UGANDA 1 1
UNITED ARAB EMIRATES 1 11 5 1 18
UNITED KINGDOM 4 5 9
UNITED STATES 3 2 1 28 6 15 3 58
UNITED STATES MINOR OUTLYING
ISLANDS7 7
YEMEN 3 1 4
Grand Total 6 13 1 8 10 3 1 668 83 8 28 255 1084
Annex 12 ‐ Enrolment of foreign students in Bachelor of Dental Surgery by country during 2010‐11
T‐28
Countries
Andhra
Pradesh
Bihar
Delhi
Goa
Gujarat
Haryana
Him
achal
Pradesh
Karnataka
Kerala
Mah
arashtra
Meghalaya
Puducherry
Rajasthan
Sikkim
Tamil Nad
u
Uttar Pradesh
West Ben
gal
Grand Total
AFGHANISTAN 31 7 2 12 11 100 27 190
ANGOLA 1 1
AUSTRALIA 1 1
BAHRAIN 1 183 184
BANGLADESH 2 1 2 7 6 18
BHUTAN 1 2 38 15 34 1 20 3 114
BOTSWANA 2 1 3
BURUNDI 1 1
CAMEROON 8 8
CANADA 1 1
CHAD 5 2 7
CHINA 46 13 2 1 103 4 169
CONGO 1 1
CÔTE D'IVOIRE 18 18
DJIBOUTI 40 2 1 43
ERITREA 28 1 6 35
ETHIOPIA 53 4 3 60
FIJI 2 5 1 8
FRANCE 1 1
FRENCH GUIANA 1 1
GHANA 2 1 3
GUINEA 1 1
INDONESIA 6 1 1 2 1 11
IRAN, ISLAMIC
REPUBLIC OF32 4 55 91
IRAQ 4 4
ITALY 1 1
JAPAN 1 1
JORDAN 1 1 2
KAZAKHSTAN 3 3
KENYA 33 8 4 12 20 1 8 5 91
KOREA,
DEMOCRATIC
PEOPLE'S
REPUBLIC OF
2 1 3
KOREA, REPUBLIC
OF3 5 6 14
KUWAIT 1 1
LATVIA 1 1
LESOTHO 1 1
MALAYSIA 1 1
MALDIVES 10 5 41 1 16 73
MAURITIUS 2 4 1 7
Annex 13 ‐ Enrolment of foreign students in B.Com. by country during 2010‐11
T‐29
Countries
Andhra
Pradesh
Bihar
Delhi
Goa
Gujarat
Haryana
Him
achal
Pradesh
Karnataka
Kerala
Mah
arashtra
Meghalaya
Puducherry
Rajasthan
Sikkim
Tamil Nad
u
Uttar Pradesh
West Ben
gal
Grand Total
Annex 13 ‐ Enrolment of foreign students in B.Com. by country during 2010‐11
MONGOLIA 1 6 4 11
MOZAMBIQUE 1 1
NAMIBIA 1 3 4
NEPAL 1 3 22 24 1 36 5 21 1 33 5 152
NEW ZEALAND 1 1
NIGERIA 8 1 10 1 20
OMAN 22 2 23 47
PAKISTAN 2 2
PALESTINIAN
TERRITORY,
OCCUPIED
4 1 5
QATAR 1 1
RWANDA 22 22
SAUDI ARABIA 11 6 3 1 21
SEYCHELLES 1 1
SOMALIA 95 2 97
SOUTH AFRICA 1 1 11 3 1 17
SPAIN 2 2
SRI LANKA 2 25 1 5 33
SUDAN 192 1 9 18 220
SWEDEN 1 1
SYRIAN ARAB
REPUBLIC2 1 3
TANZANIA, UNITED
REPUBLIC OF118 2 59 36 1 216
THAILAND 4 9 1 1 15
TURKEY 1 1
UGANDA 18 57 5 80
UNITED ARAB
EMIRATES2 1 3
UNITED KINGDOM 1 1 2 4
UNITED STATES 1 1
UZBEKISTAN 2 1 3
VIET NAM 5 1 6 3 15
YEMEN 109 6 18 133
ZIMBABWE 2 1 1 4
Grand Total 888 7 80 5 1 4 1 424 13 595 39 1 24 1 139 70 17 2309
T‐30
Countries
Andhra
Pradesh
Chan
digarh
Chhatisgarh
Goa
Gujarat
Haryana
Karnataka
Kerala
Mad
hya
Pradesh
Mah
arashtra
Meghalaya
Punjab
Rajasthan
Tamil Nad
u
West Ben
gal
Grand Total
AFGHANISTAN 17 1 6 4 26 4 27 85
AMERICAN SAMOA 180 180
ANGOLA 1 1
BAHRAIN 7 7
BANGLADESH 6 1 7
BHUTAN 57 10 1 6 20 94
BRUNEI DARUSSALAM 1 1
BURUNDI 9 9
CAMEROON 32 2 34
CENTRAL AFRICAN
REPUBLIC1 1
CHAD 11 1 12
CHINA 64 79 1 144
CONGO 98 3 1 102
CONGO, THE
DEMOCRATIC REPUBLIC
OF THE
4 10 14
CÔTE D'IVOIRE 64 1 65
DJIBOUTI 20 1 21
EGYPT 1 1 2
ERITREA 60 3 3 66
ETHIOPIA 52 1 1 54
FIJI 2 2
FRANCE 1 1
IRAN, ISLAMIC
REPUBLIC OF7 24 18 49
IRAQ 2 2
IRELAND 1 1
KENYA 6 2 1 4 1 3 17
KOREA, DEMOCRATIC
PEOPLE'S REPUBLIC OF1 1 2
KOREA, REPUBLIC OF 3 3
KUWAIT 1 9 10
MALDIVES 3 3
MALI 1 1
MAURITIUS 1 4 1 6
MONGOLIA 56 1 57
MOZAMBIQUE 9 9
MYANMAR 2 2
NEPAL 1 96 2 5 1 105
NICARAGUA 1 1
Annex 14 ‐ Enrolment of foreign students in Bachelor of Computer Applications by country during 2010‐
11
T‐31

Countries
Andhra
Pradesh
Chan
digarh
Chhatisgarh
Goa
Gujarat
Haryana
Karnataka
Kerala
Mad
hya
Pradesh
Mah
arashtra
Meghalaya
Punjab
Rajasthan
Tamil Nad
u
West Ben
gal
Grand Total
Annex 14 ‐ Enrolment of foreign students in Bachelor of Computer Applications by country during 2010‐
11
NIGER 1 1
NIGERIA 13 11 1 25
OMAN 18 22 8 48
PAKISTAN 1 2 3
PALESTINIAN
TERRITORY, OCCUPIED7 7
PHILIPPINES 1 1
QATAR 2 2
RWANDA 23 1 9 33
SAUDI ARABIA 20 39 15 74
SINGAPORE 2 2
SOMALIA 52 2 1 55
SOUTH AFRICA 2 82 4 88
SRI LANKA 30 3 33
SUDAN 254 118 11 1 384
SWEDEN 1 1
SYRIAN ARAB REPUBLIC 2 2
TANZANIA, UNITED
REPUBLIC OF24 24 8 56
THAILAND 1 60 1 62
TUNISIA 1 1
TURKEY 11 1 12
UGANDA 4 44 1 49
UNITED ARAB
EMIRATES3 3
UNITED KINGDOM 1 1
UNITED STATES 3 3
UZBEKISTAN 1 1
VIET NAM 3 7 10
YEMEN 150 40 17 207
Grand Total 809 1 1 6 191 1 1079 4 12 171 3 16 1 38 1 2334
T‐32

Countries
Gujarat
Karnataka
Mah
arashtra
Rajasthan
Tamil Nad
u
Grand Total
AFGHANISTAN 64 6 70
ANGOLA 2 2
BAHRAIN 3 3
BANGLADESH 4 1 5
BENIN 1 1
BHUTAN 56 1 57
CAMEROON 6 6
CANADA 3 3
CENTRAL AFRICAN REPUBLIC 5 5
CHINA 23 23
CONGO 29 29
CONGO, THE DEMOCRATIC REPUBLIC OF THE 7 7
CÔTE D'IVOIRE 38 38
DJIBOUTI 4 4
ERITREA 1 1
ETHIOPIA 4 4
FRANCE 1 1
INDONESIA 2 2
IRAN, ISLAMIC REPUBLIC OF 41 41
IRAQ 5 5
JAPAN 1 1
KENYA 2 6 8
KOREA, DEMOCRATIC PEOPLE'S REPUBLIC OF 2 1 3
KOREA, REPUBLIC OF 8 8
KUWAIT 6 6
MALDIVES 43 1 44
MALI 1 1
MAURITIUS 6 6
MONGOLIA 17 17
MOZAMBIQUE 3 3
NAMIBIA 1 1
NEPAL 147 1 1 149
NIGERIA 7 7
OMAN 16 16
PHILIPPINES 1 1
QATAR 2 2
RWANDA 22 22
SAUDI ARABIA 14 14
SEYCHELLES 2 2
SINGAPORE 1 1
SOMALIA 6 6
SOUTH AFRICA 52 52
SRI LANKA 61 1 1 63
Annex 15 ‐ Enrolment of foreign students in Bachelor of Business Management by country
during 2010‐11
T‐33

Countries
Gujarat
Karnataka
Mah
arashtra
Rajasthan
Tamil Nad
u
Grand Total
Annex 15 ‐ Enrolment of foreign students in Bachelor of Business Management by country
during 2010‐11
SUDAN 17 17
TAIWAN, PROVINCE OF CHINA 1 1
TANZANIA, UNITED REPUBLIC OF 1 75 76
THAILAND 35 35
UGANDA 1 32 33
UNITED ARAB EMIRATES 2 8 1 11
UNITED KINGDOM 1 1
UNITED STATES 3 3 6
VIET NAM 4 4
YEMEN 26 1 27
ZIMBABWE 2 2
Grand Total 9 922 13 2 7 953
T‐34

CountriesAssam
Chhatisgarh
Delhi
Goa
Gujarat
Haryana
Karnataka
Kerala
Mad
hya Pradesh
Mah
arashtra
Meghalaya
Odisha
Puducherry
Punjab
Rajasthan
Sikkim
Tamil Nad
u
West Ben
gal
Grand Total
AUSTRALIA 1 1
BURUNDI 1 1
CAMEROON 1 1
CÔTE D'IVOIRE 1 1
GERMANY 1 1
GHANA 1 1
IRELAND 1 1
NEW ZEALAND 1 1
PAKISTAN 1 1
RWANDA 1 1
SERBIA 1 1
SEYCHELLES 1 1
TURKMENISTAN 1 1
ZAMBIA 1 1
CANADA 2 2
CONGO 1 1 2
ERITREA 2 2
MALDIVES 1 1 2
MONGOLIA 2 2
NIGERIA 1 1 2
SINGAPORE 1 1 2
SPAIN 2 2
TURKEY 3 3
UNITED KINGDOM 3 3
CHINA 1 2 1 4
KOREA, REPUBLIC
OF2 2 4
MYANMAR 4 4
SOUTH AFRICA 3 1 4
SUDAN 1 3 4
UGANDA 1 3 4
UNITED STATES 1 3 4
BAHRAIN 6 1 7
INDONESIA 7 7
LESOTHO 8 8
KENYA 1 2 1 6 10
THAILAND 2 7 1 10
QATAR 11 11
KUWAIT 2 10 12
ZIMBABWE 8 4 12
IRAN, ISLAMIC
REPUBLIC OF13 13
Annex 16 ‐ Enrolment of foreign students in Bachelor of Business Administration by country during
2010‐11
T‐35
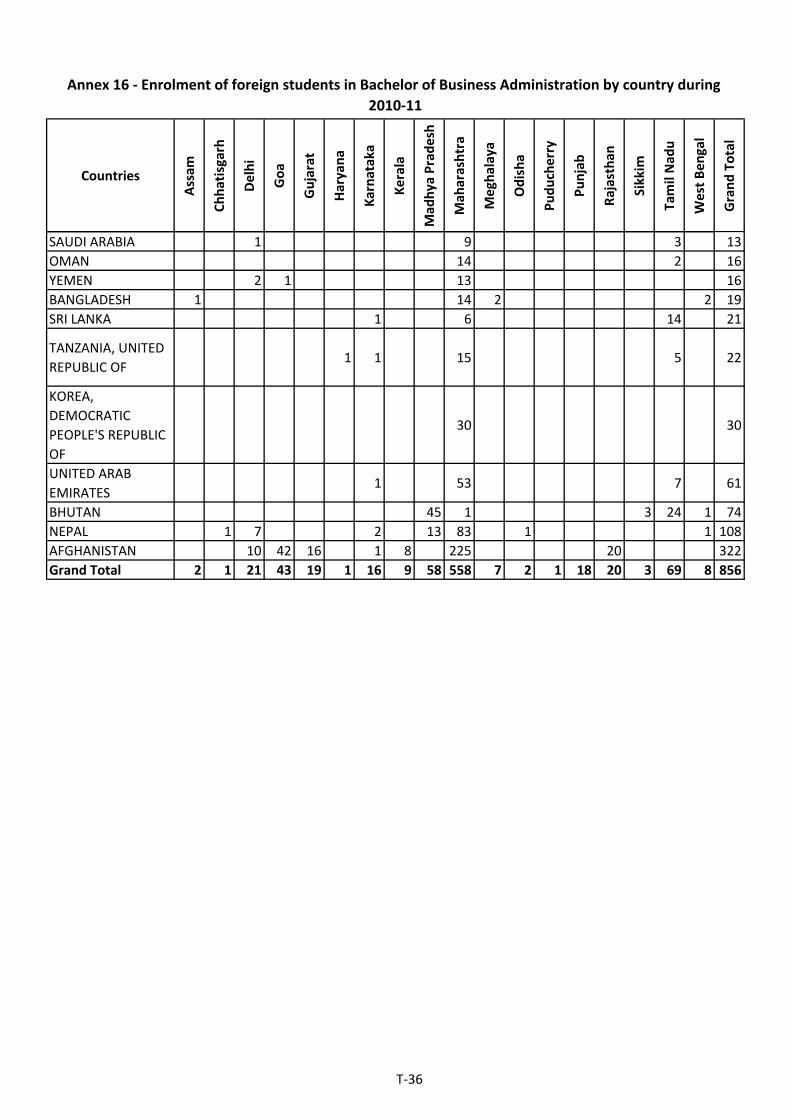
CountriesAssam
Chhatisgarh
Delhi
Goa
Gujarat
Haryana
Karnataka
Kerala
Mad
hya Pradesh
Mah
arashtra
Meghalaya
Odisha
Puducherry
Punjab
Rajasthan
Sikkim
Tamil Nad
u
West Ben
gal
Grand Total
Annex 16 ‐ Enrolment of foreign students in Bachelor of Business Administration by country during
2010‐11
SAUDI ARABIA 1 9 3 13
OMAN 14 2 16
YEMEN 2 1 13 16
BANGLADESH 1 14 2 2 19
SRI LANKA 1 6 14 21
TANZANIA, UNITED
REPUBLIC OF1 1 15 5 22
KOREA,
DEMOCRATIC
PEOPLE'S REPUBLIC
OF
30 30
UNITED ARAB
EMIRATES1 53 7 61
BHUTAN 45 1 3 24 1 74
NEPAL 1 7 2 13 83 1 1 108
AFGHANISTAN 10 42 16 1 8 225 20 322
Grand Total 2 1 21 43 19 1 16 9 58 558 7 2 1 18 20 3 69 8 856
T‐36
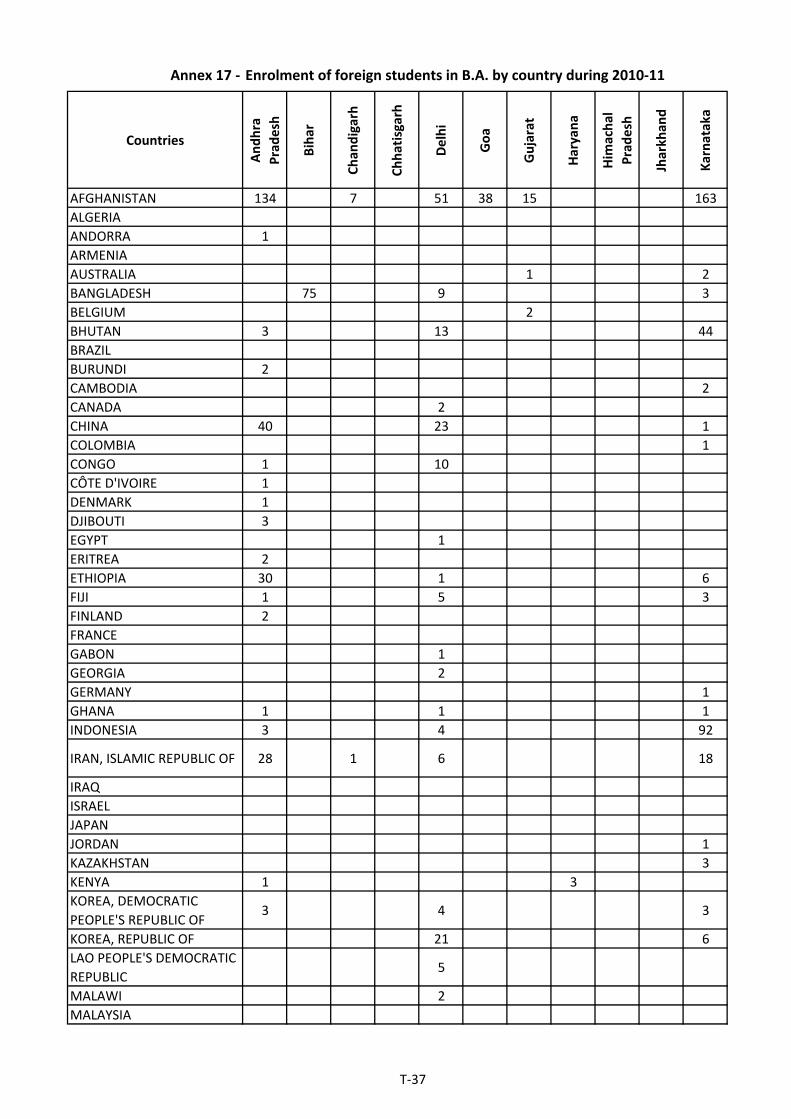
Annex 17 ‐ Enrolment of foreign students in B.A. by country during 2010‐11
Countries
Andhra
Pradesh
Bihar
Chan
digarh
Chhatisgarh
Delhi
Goa
Gujarat
Haryana
Him
achal
Pradesh
Jharkh
and
Karnataka
AFGHANISTAN 134 7 51 38 15 163
ALGERIA
ANDORRA 1
ARMENIA
AUSTRALIA 1 2
BANGLADESH 75 9 3
BELGIUM 2
BHUTAN 3 13 44
BRAZIL
BURUNDI 2
CAMBODIA 2
CANADA 2
CHINA 40 23 1
COLOMBIA 1
CONGO 1 10
CÔTE D'IVOIRE 1
DENMARK 1
DJIBOUTI 3
EGYPT 1
ERITREA 2
ETHIOPIA 30 1 6
FIJI 1 5 3
FINLAND 2
FRANCE
GABON 1
GEORGIA 2
GERMANY 1
GHANA 1 1 1
INDONESIA 3 4 92
IRAN, ISLAMIC REPUBLIC OF 28 1 6 18
IRAQ
ISRAEL
JAPAN
JORDAN 1
KAZAKHSTAN 3
KENYA 1 3
KOREA, DEMOCRATIC
PEOPLE'S REPUBLIC OF3 4 3
KOREA, REPUBLIC OF 21 6
LAO PEOPLE'S DEMOCRATIC
REPUBLIC5
MALAWI 2
MALAYSIA
T‐37

Annex 17 ‐ Enrolment of foreign students in B.A. by country during 2010‐11
Countries
Andhra
Pradesh
Bihar
Chan
digarh
Chhatisgarh
Delhi
Goa
Gujarat
Haryana
Him
achal
Pradesh
Jharkh
and
Karnataka
MALDIVES 4 5 59
MAURITANIA 1
MAURITIUS 11 9 5
MEXICO
MONGOLIA 1 8
MOZAMBIQUE 3
MYANMAR 44
NAMIBIA
NEPAL 1 60 35 1 1 19
NIGERIA 6 2 1
OMAN 14
PAKISTAN 1
PALESTINIAN TERRITORY,
OCCUPIED1
PHILIPPINES 2
POLAND 1
PORTUGAL 1
QATAR
RUSSIAN FEDERATION 1
RWANDA 2
SAUDI ARABIA 2 1
SINGAPORE
SOMALIA 12 3
SOUTH AFRICA 8
SPAIN
SRI LANKA 1 1 3 27
SUDAN 16 1 2 3
SYRIAN ARAB REPUBLIC 1
TAJIKISTAN 1
TANZANIA, UNITED
REPUBLIC OF55 29
THAILAND 1 1 5 10
TIMOR0LESTE 4
TONGA
TURKEY 3 1
TURKMENISTAN 15
UGANDA 2 3 2
UKRAINE 1
UNITED KINGDOM 3 1
UNITED STATES 8 3
UZBEKISTAN 3 4
VIET NAM 1 1
YEMEN 4 1
ZIMBABWE 3
Grand Total 414 182 8 1 264 38 18 3 1 1 525
T‐38

Annex 17 ‐
Countries
AFGHANISTAN
ALGERIA
ANDORRA
ARMENIA
AUSTRALIA
BANGLADESH
BELGIUM
BHUTAN
BRAZIL
BURUNDI
CAMBODIA
CANADA
CHINA
COLOMBIA
CONGO
CÔTE D'IVOIRE
DENMARK
DJIBOUTI
EGYPT
ERITREA
ETHIOPIA
FIJI
FINLAND
FRANCE
GABON
GEORGIA
GERMANY
GHANA
INDONESIA
IRAN, ISLAMIC REPUBLIC OF
IRAQ
ISRAEL
JAPAN
JORDAN
KAZAKHSTAN
KENYA
KOREA, DEMOCRATIC
PEOPLE'S REPUBLIC OF
KOREA, REPUBLIC OF
LAO PEOPLE'S DEMOCRATIC
REPUBLIC
MALAWI
MALAYSIA
Enrolment of foreign students in B.A. by country during 2010‐11
Kerala
Mah
arashtra
Meghalaya
Nagalan
d
Sikkim
Tamil Nad
u
Tripura
Uttar Pradesh
Uttrakh
and
West Bengal
Grand Total
9 243 36 696
2 2
1
2 2
3
3 7 1 2 22 122
2
8 36 7 4 1 116
1 1
2
6 8
3 5
1 65
1
1 12
1
1
3
1
3 5
1 38
9
2
1 1
1
2
1
4 7
2 1 1 103
70 1 4 128
4 1 5
1 1
1 1
7 8
3
1 4 2 2 13
2 12
19 2 1 49
5
2
1 1
T‐39
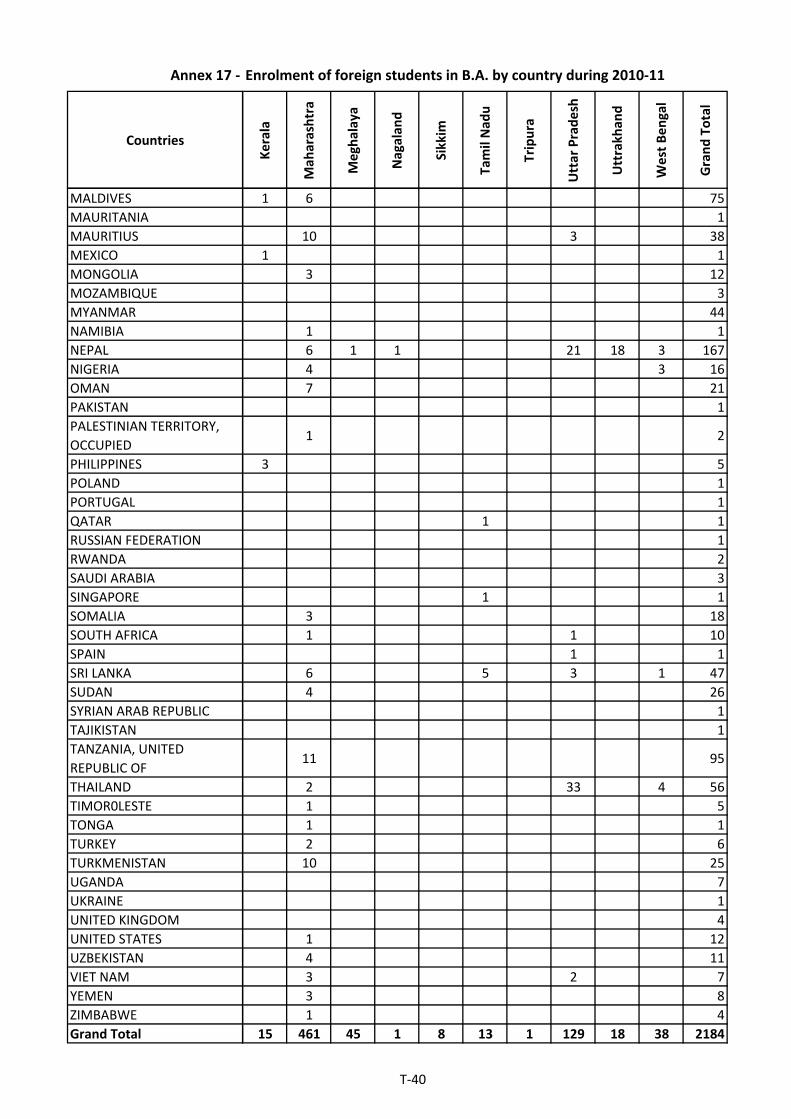
Annex 17 ‐
Countries
MALDIVES
MAURITANIA
MAURITIUS
MEXICO
MONGOLIA
MOZAMBIQUE
MYANMAR
NAMIBIA
NEPAL
NIGERIA
OMAN
PAKISTAN
PALESTINIAN TERRITORY,
OCCUPIED
PHILIPPINES
POLAND
PORTUGAL
QATAR
RUSSIAN FEDERATION
RWANDA
SAUDI ARABIA
SINGAPORE
SOMALIA
SOUTH AFRICA
SPAIN
SRI LANKA
SUDAN
SYRIAN ARAB REPUBLIC
TAJIKISTAN
TANZANIA, UNITED
REPUBLIC OF
THAILAND
TIMOR0LESTE
TONGA
TURKEY
TURKMENISTAN
UGANDA
UKRAINE
UNITED KINGDOM
UNITED STATES
UZBEKISTAN
VIET NAM
YEMEN
ZIMBABWE
Grand Total
Enrolment of foreign students in B.A. by country during 2010‐11
Kerala
Mah
arashtra
Meghalaya
Nagalan
d
Sikkim
Tamil Nad
u
Tripura
Uttar Pradesh
Uttrakh
and
West Bengal
Grand Total
1 6 75
1
10 3 38
1 1
3 12
3
44
1 1
6 1 1 21 18 3 167
4 3 16
7 21
1
1 2
3 5
1
1
1 1
1
2
3
1 1
3 18
1 1 10
1 1
6 5 3 1 47
4 26
1
1
11 95
2 33 4 56
1 5
1 1
2 6
10 25
7
1
4
1 12
4 11
3 2 7
3 8
1 4
15 461 45 1 8 13 1 129 18 38 2184
T‐40
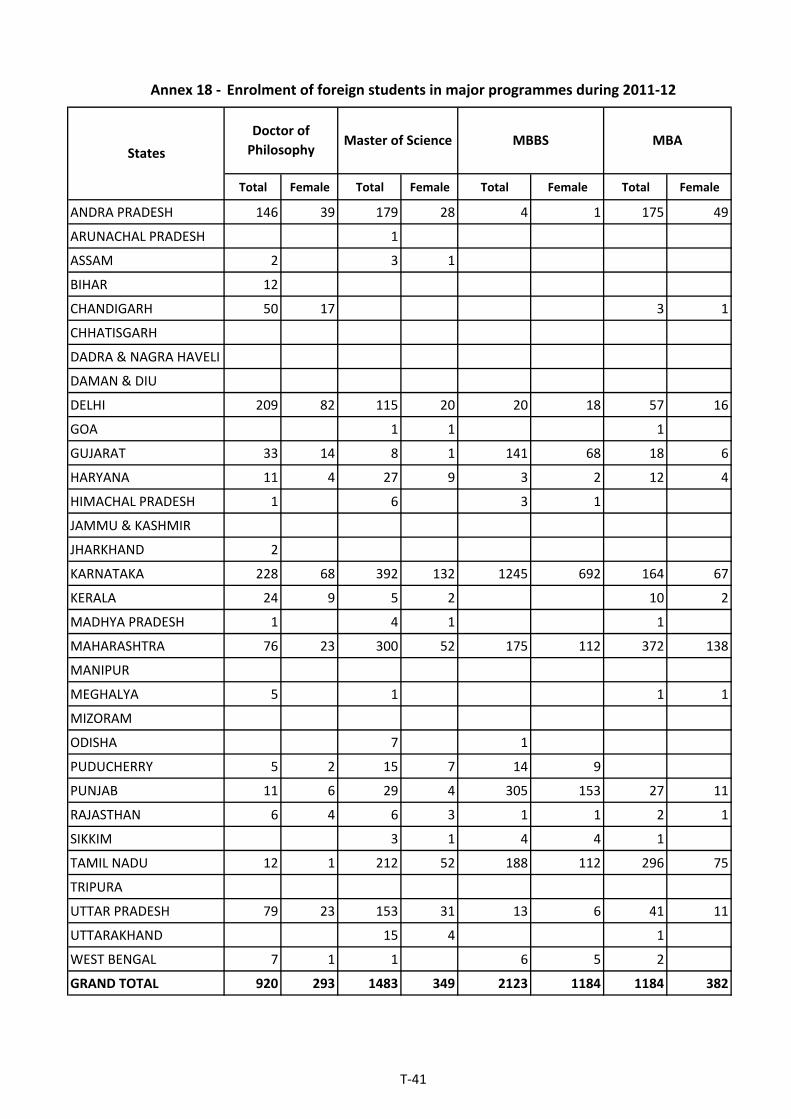
Annex 18 ‐ Enrolment of foreign students in major programmes during 2011‐12
Total Female Total Female Total Female Total Female
ANDRA PRADESH 146 39 179 28 4 1 175 49
ARUNACHAL PRADESH 1
ASSAM 2 3 1
BIHAR 12
CHANDIGARH 50 17 3 1
CHHATISGARH
DADRA & NAGRA HAVELI
DAMAN & DIU
DELHI 209 82 115 20 20 18 57 16
GOA 1 1 1
GUJARAT 33 14 8 1 141 68 18 6
HARYANA 11 4 27 9 3 2 12 4
HIMACHAL PRADESH 1 6 3 1
JAMMU & KASHMIR
JHARKHAND 2
KARNATAKA 228 68 392 132 1245 692 164 67
KERALA 24 9 5 2 10 2
MADHYA PRADESH 1 4 1 1
MAHARASHTRA 76 23 300 52 175 112 372 138
MANIPUR
MEGHALYA 5 1 1 1
MIZORAM
ODISHA 7 1
PUDUCHERRY 5 2 15 7 14 9
PUNJAB 11 6 29 4 305 153 27 11
RAJASTHAN 6 4 6 3 1 1 2 1
SIKKIM 3 1 4 4 1
TAMIL NADU 12 1 212 52 188 112 296 75
TRIPURA
UTTAR PRADESH 79 23 153 31 13 6 41 11
UTTARAKHAND 15 4 1
WEST BENGAL 7 1 1 6 5 2
GRAND TOTAL 920 293 1483 349 2123 1184 1184 382
States
Doctor of
Philosophy Master of Science MBBS MBA
T‐41
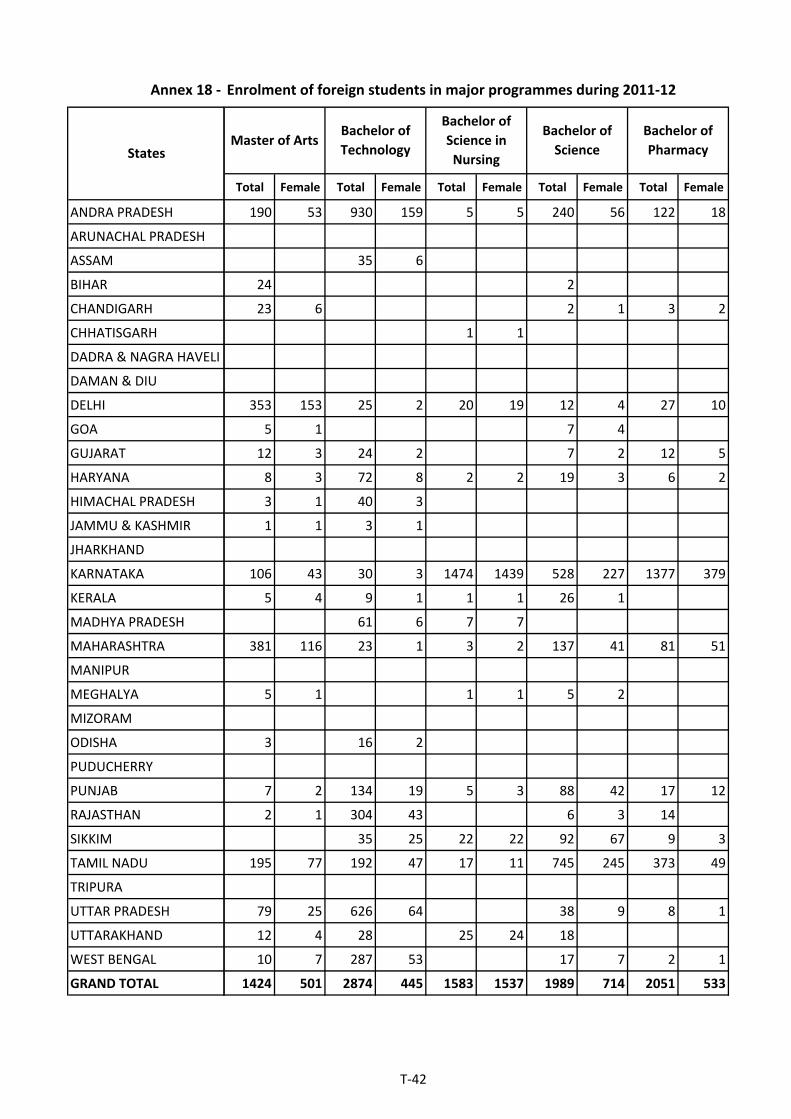
Annex 18 ‐
ANDRA PRADESH
ARUNACHAL PRADESH
ASSAM
BIHAR
CHANDIGARH
CHHATISGARH
DADRA & NAGRA HAVELI
DAMAN & DIU
DELHI
GOA
GUJARAT
HARYANA
HIMACHAL PRADESH
JAMMU & KASHMIR
JHARKHAND
KARNATAKA
KERALA
MADHYA PRADESH
MAHARASHTRA
MANIPUR
MEGHALYA
MIZORAM
ODISHA
PUDUCHERRY
PUNJAB
RAJASTHAN
SIKKIM
TAMIL NADU
TRIPURA
UTTAR PRADESH
UTTARAKHAND
WEST BENGAL
GRAND TOTAL
States
Enrolment of foreign students in major programmes during 2011‐12
Total Female Total Female Total Female Total Female Total Female
190 53 930 159 5 5 240 56 122 18
35 6
24 2
23 6 2 1 3 2
1 1
353 153 25 2 20 19 12 4 27 10
5 1 7 4
12 3 24 2 7 2 12 5
8 3 72 8 2 2 19 3 6 2
3 1 40 3
1 1 3 1
106 43 30 3 1474 1439 528 227 1377 379
5 4 9 1 1 1 26 1
61 6 7 7
381 116 23 1 3 2 137 41 81 51
5 1 1 1 5 2
3 16 2
7 2 134 19 5 3 88 42 17 12
2 1 304 43 6 3 14
35 25 22 22 92 67 9 3
195 77 192 47 17 11 745 245 373 49
79 25 626 64 38 9 8 1
12 4 28 25 24 18
10 7 287 53 17 7 2 1
1424 501 2874 445 1583 1537 1989 714 2051 533
Bachelor of
TechnologyMaster of Arts
Bachelor of
Science in
Nursing
Bachelor of
Science
Bachelor of
Pharmacy
T‐42

Annex 18 ‐
ANDRA PRADESH
ARUNACHAL PRADESH
ASSAM
BIHAR
CHANDIGARH
CHHATISGARH
DADRA & NAGRA HAVELI
DAMAN & DIU
DELHI
GOA
GUJARAT
HARYANA
HIMACHAL PRADESH
JAMMU & KASHMIR
JHARKHAND
KARNATAKA
KERALA
MADHYA PRADESH
MAHARASHTRA
MANIPUR
MEGHALYA
MIZORAM
ODISHA
PUDUCHERRY
PUNJAB
RAJASTHAN
SIKKIM
TAMIL NADU
TRIPURA
UTTAR PRADESH
UTTARAKHAND
WEST BENGAL
GRAND TOTAL
States
Enrolment of foreign students in major programmes during 2011‐12
Total Female Total Female Total Female Total Female Total Female
288 32 6 4 373 102 119
2
15 10 3 2
146 38
1
127 42 37 9
5 3 12 6
1 1 4 4 14 5 8 3
18 4 2 1 14 3
1 1 1
916 120 728 467 606 190 1176 186 1032 398
12 1 5 5
13 5
136 12 42 22 697 143 120 11 4
14 7 2 1
1
15 4 24 18 32 10 81 17
3 1 3 2
47 33 19 5
235 44 248 186 564 242 287 64 65 34
1 1 60 34 3 1
3
9 4 30 14 13 5 5 2
1746 255 1085 712 2582 828 1921 327 1114 437
Bachelor of
Engineering
Bachelor of
Dental Surgery
Bachelor of
Commerce
Bachelor of
Computer
Applications
Bachelor of
Business
Management
T‐43

Annex 18 ‐
ANDRA PRADESH
ARUNACHAL PRADESH
ASSAM
BIHAR
CHANDIGARH
CHHATISGARH
DADRA & NAGRA HAVELI
DAMAN & DIU
DELHI
GOA
GUJARAT
HARYANA
HIMACHAL PRADESH
JAMMU & KASHMIR
JHARKHAND
KARNATAKA
KERALA
MADHYA PRADESH
MAHARASHTRA
MANIPUR
MEGHALYA
MIZORAM
ODISHA
PUDUCHERRY
PUNJAB
RAJASTHAN
SIKKIM
TAMIL NADU
TRIPURA
UTTAR PRADESH
UTTARAKHAND
WEST BENGAL
GRAND TOTAL
States
Enrolment of foreign students in major programmes during 2011‐12
Total Female Total Female Total Female Total Female
4 4 313 100 486 190 3580 840
1
1 1 5 1 46 9
55 16 9 111 9
13 2 47 37 15 9 174 87
1 4 3 2 154 42
158 95 159 95
39 4 680 303 1721 682
68 2 34 3 11 2 144 22
49 12 18 68 29 417 155
13 5 42 19 249 69
1 1 56 7
4 2
1 1 3 1
18 10 314 179 1724 896 12058 5496
31 2 4 2 56 23 188 53
83 39 27 8 197 66
482 132 515 156 698 295 4242 1307
1 1
9 6 25 14 7 1 75 34
1 1
1 2 1 1 1 32 4
2 36 18
84 26 12 4 184 48 1055 379
7 4 58 19 412 82
131 67 47 31 86 44 496 302
367 158 204 133 666 313 4866 1843
2 1 1 3 1
17 3 132 44 475 106 1725 359
21 6 13 4 11 3 147 45
53 20 60 44 305 153 807 316
1494 503 1959 851 5628 2474 33160 12325
Total
Bachelor of
Business
Administration
Bachelor of Arts Other subjects
T‐44
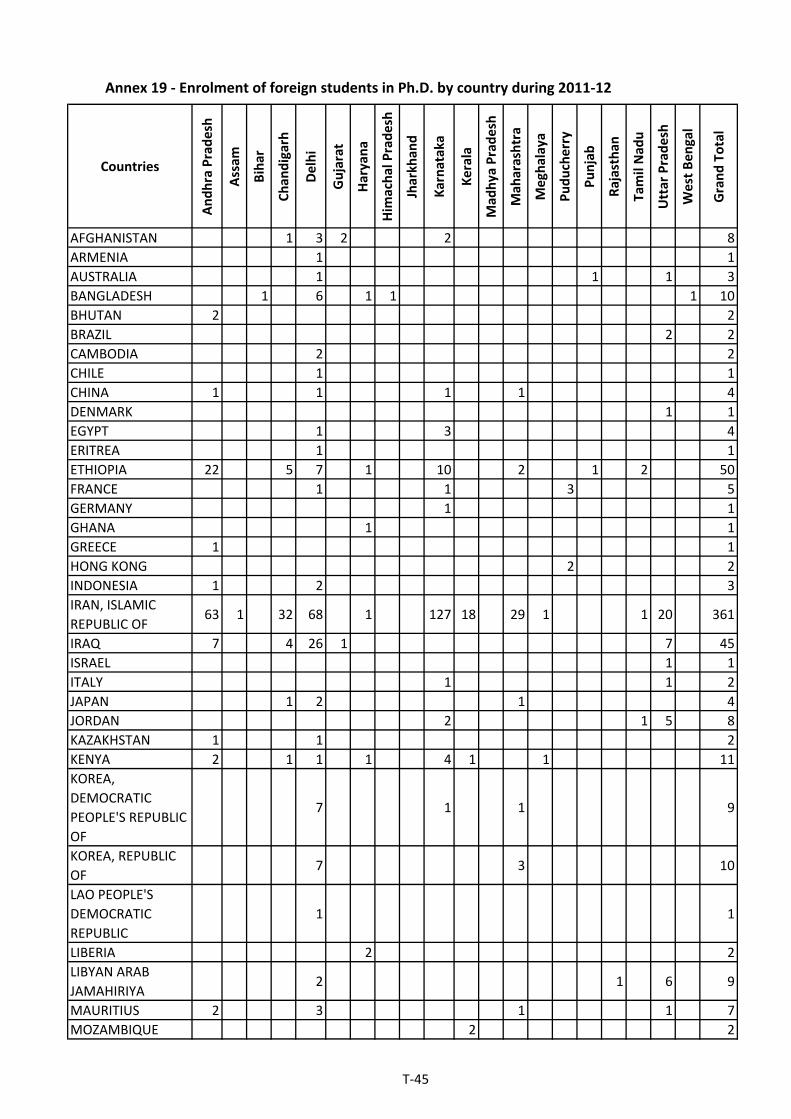
Countries
Andhra Pradesh
Assam
Bihar
Chan
digarh
Delhi
Gujarat
Haryana
Him
achal Pradesh
Jharkhan
d
Karnataka
Kerala
Mad
hya Pradesh
Mah
arashtra
Meghalaya
Puducherry
Punjab
Rajasthan
Tamil Nad
u
Uttar Pradesh
West Ben
gal
Grand Total
AFGHANISTAN 1 3 2 2 8
ARMENIA 1 1
AUSTRALIA 1 1 1 3
BANGLADESH 1 6 1 1 1 10
BHUTAN 2 2
BRAZIL 2 2
CAMBODIA 2 2
CHILE 1 1
CHINA 1 1 1 1 4
DENMARK 1 1
EGYPT 1 3 4
ERITREA 1 1
ETHIOPIA 22 5 7 1 10 2 1 2 50
FRANCE 1 1 3 5
GERMANY 1 1
GHANA 1 1
GREECE 1 1
HONG KONG 2 2
INDONESIA 1 2 3
IRAN, ISLAMIC
REPUBLIC OF63 1 32 68 1 127 18 29 1 1 20 361
IRAQ 7 4 26 1 7 45
ISRAEL 1 1
ITALY 1 1 2
JAPAN 1 2 1 4
JORDAN 2 1 5 8
KAZAKHSTAN 1 1 2
KENYA 2 1 1 1 4 1 1 11
KOREA,
DEMOCRATIC
PEOPLE'S REPUBLIC
OF
7 1 1 9
KOREA, REPUBLIC
OF7 3 10
LAO PEOPLE'S
DEMOCRATIC
REPUBLIC
1 1
LIBERIA 2 2
LIBYAN ARAB
JAMAHIRIYA2 1 6 9
MAURITIUS 2 3 1 1 7
MOZAMBIQUE 2 2
Annex 19 ‐ Enrolment of foreign students in Ph.D. by country during 2011‐12
T‐45

Countries
Andhra Pradesh
Assam
Bihar
Chan
digarh
Delhi
Gujarat
Haryana
Him
achal Pradesh
Jharkhan
d
Karnataka
Kerala
Mad
hya Pradesh
Mah
arashtra
Meghalaya
Puducherry
Punjab
Rajasthan
Tamil Nad
u
Uttar Pradesh
West Ben
gal
Grand Total
Annex 19 ‐ Enrolment of foreign students in Ph.D. by country during 2011‐12
MYANMAR 13 9 1 2 28 1 3 57
NAMIBIA 1 1
NEPAL 3 1 6 4 12 5 31
NIGERIA 2 1 2 2 1 8
PALESTINIAN
TERRITORY,
OCCUPIED
1 1 2 4
PHILIPPINES 1 1 2
RUSSIAN
FEDERATION1 1
RWANDA 1 4 5
SEYCHELLES 1 1
SIERRA LEONE 1 1
SINGAPORE 1 1
SOUTH AFRICA 1 1 2
SRI LANKA 1 6 1 1 4 1 3 4 5 26
SUDAN 3 2 1 1 1 8
SWEDEN 1 1
SYRIAN ARAB
REPUBLIC2 3 2 1 8
TAIWAN, PROVINCE
OF CHINA1 1
TANZANIA, UNITED
REPUBLIC OF1 1 2
THAILAND 3 1 5 7 24 2 3 4 7 56
TURKEY 1 1
UGANDA 1 1 2
UNITED ARAB
EMIRATES1 1
UNITED KINGDOM 1 1
UNITED STATES 1 1 1 1 1 1 6
UZBEKISTAN 4 4
VIET NAM 1 28 1 2 4 5 41
YEMEN 13 1 6 2 21 1 44
ZAMBIA 1 1
ZIMBABWE 25 2 27
Grand Total 146 2 12 50 209 33 11 1 2 228 24 1 76 5 5 11 6 12 79 7 920
T‐46

Annex 20 ‐ Enrolment of foreign students in M.A by country during 2011‐12
Countries
Andhra
Pradesh
Bihar
Chan
digarh
Delhi
Goa
Gujarat
Haryana
Him
achal
Pradesh
Jammu and
Kashmir
Karnataka
Kerala
AFGHANISTAN 14 12 18 3 2 4
AMERICAN SAMOA
ARGENTINA
ARMENIA 1
AUSTRALIA
AUSTRIA 1
BAHRAIN
BANGLADESH 1 21 1
BELARUS 1
BHUTAN 10 1 9
BOSNIA AND HERZEGOVINA
BOTSWANA 1
BRAZIL 1
BRITISH INDIAN OCEAN TERRITORY 1
BURUNDI
CAMBODIA 1 7
CANADA 1
CHINA 1 19 1
COLOMBIA 1
CONGO
CONGO, THE DEMOCRATIC REPUBLIC
OF THE1
CUBA 1
DENMARK
DJIBOUTI 2
DOMINICA 1
ERITREA 1
ESTONIA 1
ETHIOPIA 42 2 1 12
FIJI 1
FRANCE 4 2
GEORGIA 1
GERMANY 1
GHANA 1
INDONESIA 11
IRAN, ISLAMIC REPUBLIC OF 43 2 10 45 1
IRAQ 26 1 23
ITALY 1
JAPAN 6 1
JORDAN 1 2
KAZAKHSTAN 2 7
KENYA 1 5 1
KOREA, DEMOCRATIC PEOPLE'S
REPUBLIC OF3 1
KOREA, REPUBLIC OF 14
KUWAIT
KYRGYZSTAN 4
LAO PEOPLE'S DEMOCRATIC REPUBLIC 7 1
LESOTHO 2
LITHUANIA 1
T‐47

Annex 20 ‐ Enrolment of foreign students in M.A by country during 2011‐12
Countries
Andhra
Pradesh
Bihar
Chan
digarh
Delhi
Goa
Gujarat
Haryana
Him
achal
Pradesh
Jammu and
Kashmir
Karnataka
Kerala
MALAWI 2
MALAYSIA 1
MALDIVES 1
MAURITIUS 2 3
MEXICO 2
MONGOLIA 3
MOROCCO 1
MOZAMBIQUE 1 1
MYANMAR 21 17
NAMIBIA 3 1
NEPAL 1 39
NIGER 1
NIGERIA 1 4 1
OMAN 8
PAKISTAN 2
PALESTINIAN TERRITORY, OCCUPIED 1
POLAND 3
QATAR
RUSSIAN FEDERATION 1 2
RWANDA
SAUDI ARABIA
SINGAPORE 2
SOMALIA 1
SOUTH AFRICA 1
SPAIN
SRI LANKA 6
SUDAN 1 4 2
SWAZILAND 1
SWEDEN
SYRIAN ARAB REPUBLIC 3 2
TAIWAN, PROVINCE OF CHINA 1 3
TAJIKISTAN 10 1 7 3 1
TANZANIA, UNITED REPUBLIC OF 4 3 2
THAILAND 3 5 9 1
TURKEY 4
TURKMENISTAN 2 1 1
UGANDA 4
UKRAINE
UNITED ARAB EMIRATES
UNITED KINGDOM 6
UNITED STATES 3 1 1 1
UZBEKISTAN 1 4
VANUATU 52
VIET NAM 1 5 1 1
YEMEN 2 2 3
ZAMBIA 3 1 1
ZIMBABWE 1
Grand Total 190 24 23 353 5 12 8 3 1 106 5
T‐48

Annex 20 ‐
Countries
AFGHANISTAN
AMERICAN SAMOA
ARGENTINA
ARMENIA
AUSTRALIA
AUSTRIA
BAHRAIN
BANGLADESH
BELARUS
BHUTAN
BOSNIA AND HERZEGOVINA
BOTSWANA
BRAZIL
BRITISH INDIAN OCEAN TERRITORY
BURUNDI
CAMBODIA
CANADA
CHINA
COLOMBIA
CONGO
CONGO, THE DEMOCRATIC REPUBLIC
OF THE
CUBA
DENMARK
DJIBOUTI
DOMINICA
ERITREA
ESTONIA
ETHIOPIA
FIJI
FRANCE
GEORGIA
GERMANY
GHANA
INDONESIA
IRAN, ISLAMIC REPUBLIC OF
IRAQ
ITALY
JAPAN
JORDAN
KAZAKHSTAN
KENYA
KOREA, DEMOCRATIC PEOPLE'S
REPUBLIC OF
KOREA, REPUBLIC OF
KUWAIT
KYRGYZSTAN
LAO PEOPLE'S DEMOCRATIC REPUBLIC
LESOTHO
LITHUANIA
Enrolment of foreign students in M.A by country during 2011‐12
Mah
arashtra
Meghalaya
Odisha
Punjab
Rajasthan
Tamil Nad
u
Uttar
Pradesh
Uttrakh
and
West Bengal
Grand Total
34 1 1 14 1 104
1 1
1 1
1
1 1
1
1 1
1 1 7 32
1
2 1 3 17 43
1 1
1
1
1
1 1
1 3 12
1 1 2 5
1 6 6 34
1
1 1
1
1
2 2
2
1
1
1
2 59
1
9 15
1
2 1 4
3 4
4 15
90 1 3 195
176 1 14 241
1 2
7
3 6
9
3 10
1 2 7
3 2 1 20
1 1
4
1 9
2
1
T‐49

Annex 20 ‐
Countries
MALAWI
MALAYSIA
MALDIVES
MAURITIUS
MEXICO
MONGOLIA
MOROCCO
MOZAMBIQUE
MYANMAR
NAMIBIA
NEPAL
NIGER
NIGERIA
OMAN
PAKISTAN
PALESTINIAN TERRITORY, OCCUPIED
POLAND
QATAR
RUSSIAN FEDERATION
RWANDA
SAUDI ARABIA
SINGAPORE
SOMALIA
SOUTH AFRICA
SPAIN
SRI LANKA
SUDAN
SWAZILAND
SWEDEN
SYRIAN ARAB REPUBLIC
TAIWAN, PROVINCE OF CHINA
TAJIKISTAN
TANZANIA, UNITED REPUBLIC OF
THAILAND
TURKEY
TURKMENISTAN
UGANDA
UKRAINE
UNITED ARAB EMIRATES
UNITED KINGDOM
UNITED STATES
UZBEKISTAN
VANUATU
VIET NAM
YEMEN
ZAMBIA
ZIMBABWE
Grand Total
Enrolment of foreign students in M.A by country during 2011‐12
Mah
arashtra
Meghalaya
Odisha
Punjab
Rajasthan
Tamil Nad
u
Uttar
Pradesh
Uttrakh
and
West Bengal
Grand Total
2
1 2
1
1 6
1 3
3
1
2
3 1 2 44
4
11 2 1 1 10 8 73
1
4 1 1 12
1 9
1 3
1 2
1 4
2 2
3
48 48
1 1
2
1
1
1 1
4 91 101
2 9
1
1 1
5
4
2 24
9
11 1 10 1 41
2 6
4
2 6
1 1
3 3 6
1 7
1 5 3 15
5
52
1 9
7 14
5
1 2
381 5 3 7 2 195 79 12 10 1424
T‐50
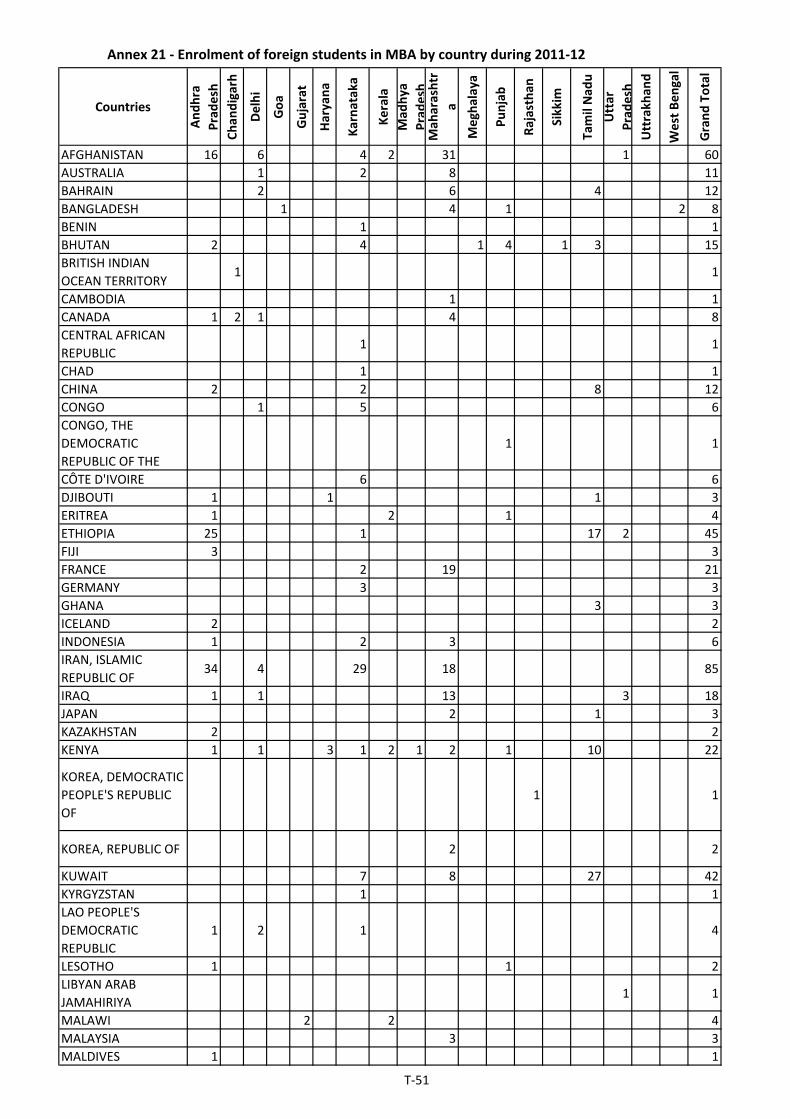
Countries
Andhra
Pradesh
Chan
digarh
Delhi
Goa
Gujarat
Haryana
Karnataka
Kerala
Mad
hya
Pradesh
Mah
arashtr
a
Meghalaya
Punjab
Rajasthan
Sikkim
Tamil Nad
u
Uttar
Pradesh
Uttrakh
and
West Bengal
Grand Total
AFGHANISTAN 16 6 4 2 31 1 60
AUSTRALIA 1 2 8 11
BAHRAIN 2 6 4 12
BANGLADESH 1 4 1 2 8
BENIN 1 1
BHUTAN 2 4 1 4 1 3 15
BRITISH INDIAN
OCEAN TERRITORY1 1
CAMBODIA 1 1
CANADA 1 2 1 4 8
CENTRAL AFRICAN
REPUBLIC1 1
CHAD 1 1
CHINA 2 2 8 12
CONGO 1 5 6
CONGO, THE
DEMOCRATIC
REPUBLIC OF THE
1 1
CÔTE D'IVOIRE 6 6
DJIBOUTI 1 1 1 3
ERITREA 1 2 1 4
ETHIOPIA 25 1 17 2 45
FIJI 3 3
FRANCE 2 19 21
GERMANY 3 3
GHANA 3 3
ICELAND 2 2
INDONESIA 1 2 3 6
IRAN, ISLAMIC
REPUBLIC OF34 4 29 18 85
IRAQ 1 1 13 3 18
JAPAN 2 1 3
KAZAKHSTAN 2 2
KENYA 1 1 3 1 2 1 2 1 10 22
KOREA, DEMOCRATIC
PEOPLE'S REPUBLIC
OF
1 1
KOREA, REPUBLIC OF 2 2
KUWAIT 7 8 27 42
KYRGYZSTAN 1 1
LAO PEOPLE'S
DEMOCRATIC
REPUBLIC
1 2 1 4
LESOTHO 1 1 2
LIBYAN ARAB
JAMAHIRIYA1 1
MALAWI 2 2 4
MALAYSIA 3 3
MALDIVES 1 1
Annex 21 ‐ Enrolment of foreign students in MBA by country during 2011‐12
T‐51
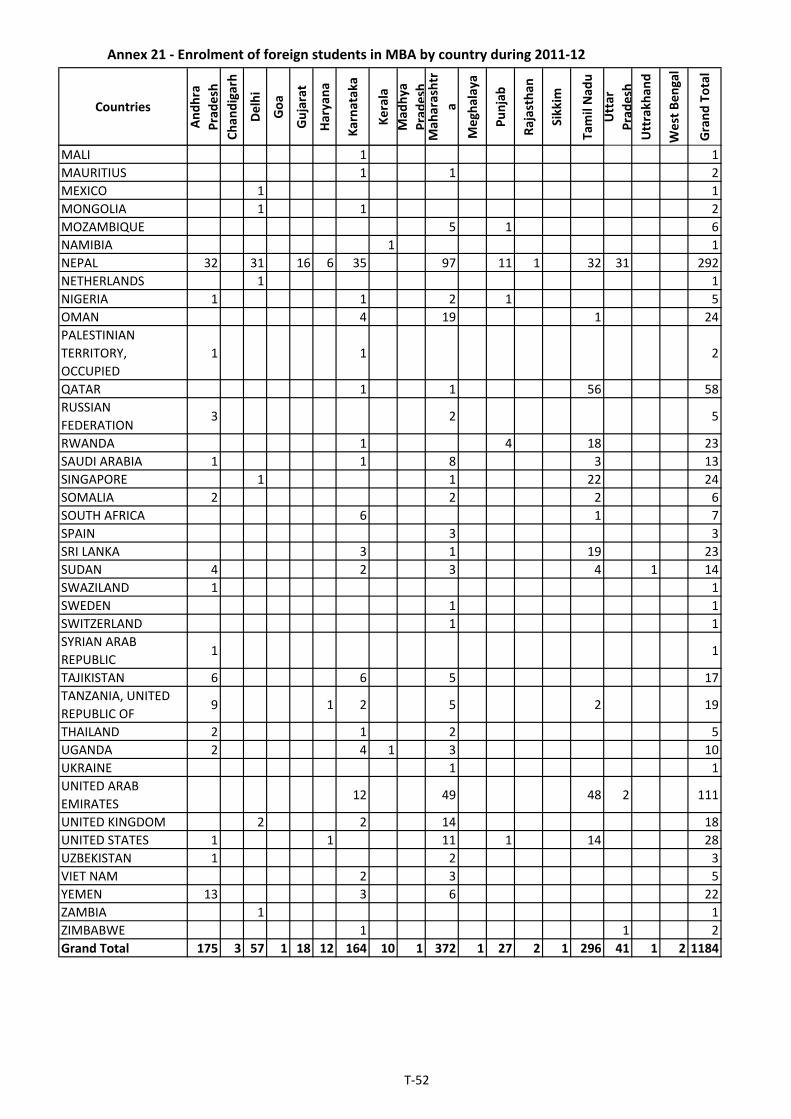
Countries
Andhra
Pradesh
Chan
digarh
Delhi
Goa
Gujarat
Haryana
Karnataka
Kerala
Mad
hya
Pradesh
Mah
arashtr
a
Meghalaya
Punjab
Rajasthan
Sikkim
Tamil Nad
u
Uttar
Pradesh
Uttrakh
and
West Bengal
Grand Total
Annex 21 ‐ Enrolment of foreign students in MBA by country during 2011‐12
MALI 1 1
MAURITIUS 1 1 2
MEXICO 1 1
MONGOLIA 1 1 2
MOZAMBIQUE 5 1 6
NAMIBIA 1 1
NEPAL 32 31 16 6 35 97 11 1 32 31 292
NETHERLANDS 1 1
NIGERIA 1 1 2 1 5
OMAN 4 19 1 24
PALESTINIAN
TERRITORY,
OCCUPIED
1 1 2
QATAR 1 1 56 58
RUSSIAN
FEDERATION3 2 5
RWANDA 1 4 18 23
SAUDI ARABIA 1 1 8 3 13
SINGAPORE 1 1 22 24
SOMALIA 2 2 2 6
SOUTH AFRICA 6 1 7
SPAIN 3 3
SRI LANKA 3 1 19 23
SUDAN 4 2 3 4 1 14
SWAZILAND 1 1
SWEDEN 1 1
SWITZERLAND 1 1
SYRIAN ARAB
REPUBLIC1 1
TAJIKISTAN 6 6 5 17
TANZANIA, UNITED
REPUBLIC OF9 1 2 5 2 19
THAILAND 2 1 2 5
UGANDA 2 4 1 3 10
UKRAINE 1 1
UNITED ARAB
EMIRATES12 49 48 2 111
UNITED KINGDOM 2 2 14 18
UNITED STATES 1 1 11 1 14 28
UZBEKISTAN 1 2 3
VIET NAM 2 3 5
YEMEN 13 3 6 22
ZAMBIA 1 1
ZIMBABWE 1 1 2
Grand Total 175 3 57 1 18 12 164 10 1 372 1 27 2 1 296 41 1 2 1184
T‐52

Annex 22 ‐ Enrolment of foreign students in M.Sc by country during 2011‐12
CountriesAndhra Pradesh
Assam
Chan
digarh
Delhi
Goa
Gujarat
Haryana
Him
achal Pradesh
Karnataka
Kerala
Mad
hya Pradesh
Mah
arashtra
Meghalaya
Odisha
Puducherry
Punjab
Rajasthan
Sikkim
Tamil Nad
u
Uttar Pradesh
Uttrakh
and
West Bengal
Grand Total
AFGHANISTAN 7 23 4 2 4 32 2 9 6 7 19 115
AUSTRALIA 1 1 2
BANGLADESH 13 1 2 1 17
BELGIUM 2 2
BENIN 1 1
BHUTAN 4 1 1 1 15 8 2 7 3 42
BOTSWANA 1 1 2
BURUNDI 2 49 51
CAMBODIA 1 1
CANADA 1 1
CHAD 1 1
CHINA 1 1 89 6 97
CONGO, THE
DEMOCRATIC
REPUBLIC OF
THE
1 1
CÔTE D'IVOIRE 2 2
DENMARK 1 1
DJIBOUTI 1 1
EGYPT 2 2
ERITREA 1 1 2
ETHIOPIA 37 1 7 1 6 52
FIJI 3 3
GHANA 1 1 2
INDONESIA 1 1
IRAN, ISLAMIC
REPUBLIC OF27 2 13 1 107 1 34 1 1 1 1 189
IRAQ 39 23 1 2 33 192 64 354
JAPAN 1 1
JORDAN 1 1
KENYA 4 1 1 2 23 1 32
KOREA,
DEMOCRATIC
PEOPLE'S
REPUBLIC OF
2 2
KUWAIT 1 1 2
LESOTHO 2 2
LIBYAN ARAB
JAMAHIRIYA1 2 2 18 23
MALAYSIA 2 2
MALDIVES 5 5
MAURITIUS 1 1 1 3
MONGOLIA 1 2 3
MOZAMBIQUE 1 1
T‐53
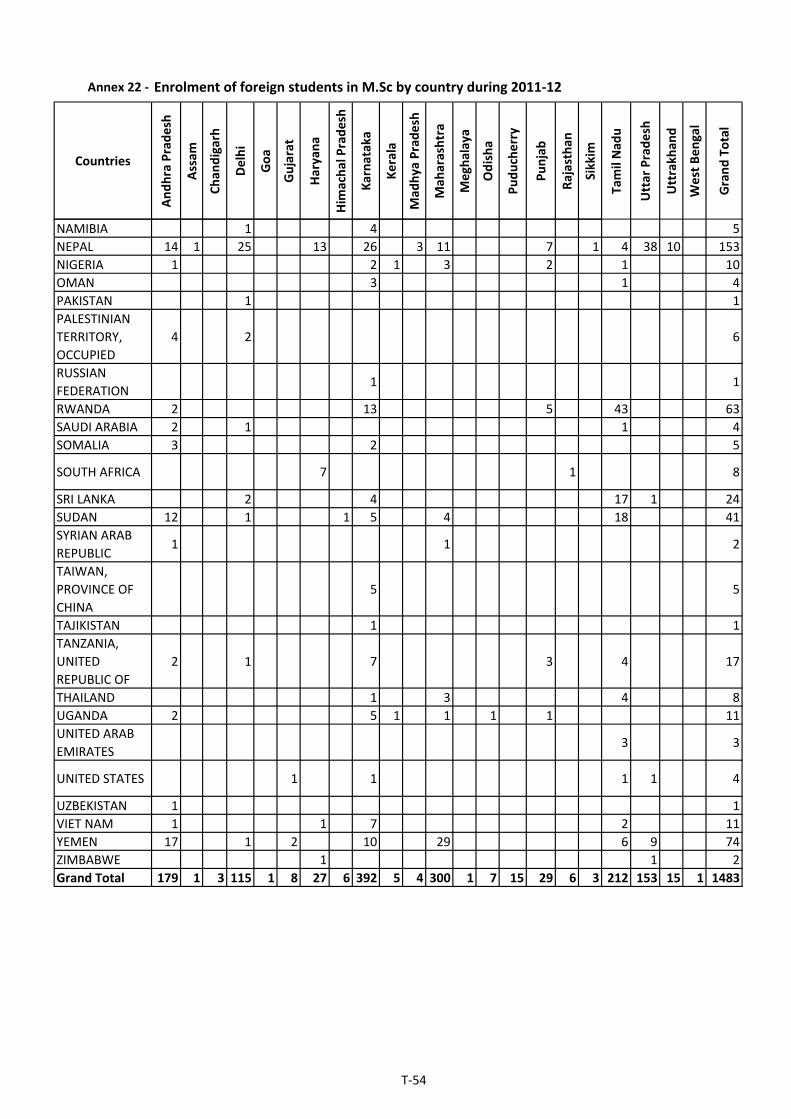
Annex 22 ‐ Enrolment of foreign students in M.Sc by country during 2011‐12
CountriesAndhra Pradesh
Assam
Chan
digarh
Delhi
Goa
Gujarat
Haryana
Him
achal Pradesh
Karnataka
Kerala
Mad
hya Pradesh
Mah
arashtra
Meghalaya
Odisha
Puducherry
Punjab
Rajasthan
Sikkim
Tamil Nad
u
Uttar Pradesh
Uttrakh
and
West Bengal
Grand Total
NAMIBIA 1 4 5
NEPAL 14 1 25 13 26 3 11 7 1 4 38 10 153
NIGERIA 1 2 1 3 2 1 10
OMAN 3 1 4
PAKISTAN 1 1
PALESTINIAN
TERRITORY,
OCCUPIED
4 2 6
RUSSIAN
FEDERATION1 1
RWANDA 2 13 5 43 63
SAUDI ARABIA 2 1 1 4
SOMALIA 3 2 5
SOUTH AFRICA 7 1 8
SRI LANKA 2 4 17 1 24
SUDAN 12 1 1 5 4 18 41
SYRIAN ARAB
REPUBLIC1 1 2
TAIWAN,
PROVINCE OF
CHINA
5 5
TAJIKISTAN 1 1
TANZANIA,
UNITED
REPUBLIC OF
2 1 7 3 4 17
THAILAND 1 3 4 8
UGANDA 2 5 1 1 1 1 11
UNITED ARAB
EMIRATES3 3
UNITED STATES 1 1 1 1 4
UZBEKISTAN 1 1
VIET NAM 1 1 7 2 11
YEMEN 17 1 2 10 29 6 9 74
ZIMBABWE 1 1 2
Grand Total 179 1 3 115 1 8 27 6 392 5 4 300 1 7 15 29 6 3 212 153 15 1 1483
T‐54

Annex 23 ‐ Enrolment of foreign students in MBBS by country during 2011‐12
Countries
Andhra
Pradesh
Delhi
Gujarat
Haryana
Him
achal
Pradesh
Karnataka
Mah
arashtra
Odisha
Puducherry
Punjab
Rajasthan
Sikkim
Tamil Nad
u
Uttar Pradesh
West Ben
gal
Grand Total
AFGHANISTAN 8 23 1 4 36
AMERICAN SAMOA 50 50
AUSTRALIA 6 1 5 12
BAHRAIN 2 1 3
BANGLADESH 1 6 3 2 12
BELGIUM 1 1
BHUTAN 1 1
BRITISH INDIAN OCEAN
TERRITORY1 1
CANADA 2 6 31 7 60 25 131
CHINA 2 2
CONGO 1 1
DJIBOUTI 1 1
FRANCE 1 1
INDONESIA 1 1 2
IRAN, ISLAMIC REPUBLIC
OF6 6
IRAQ 1 1
KENYA 2 2
KUWAIT 1 1
MALAYSIA 988 103 11 4 1106
MALDIVES 3 2 5 1 11
MAURITIUS 4 4
MYANMAR 2 2
NEPAL 4 1 19 1 1 4 2 6 38
NEW ZEALAND 1 3 1 2 4 11
NIGERIA 2 4 1 2 9
OMAN 2 1 1 4
PORTUGAL 1 1
QATAR 1 2 1 4
SAUDI ARABIA 8 8
SEYCHELLES 13 13
SINGAPORE 3 4 7
SOUTH AFRICA 2 3 1 6
SRI LANKA 2 31 1 13 8 55
TANZANIA, UNITED
REPUBLIC OF4 4
THAILAND 1 1 2
UGANDA 1 1
UNITED ARAB EMIRATES 8 14 4 14 2 42
UNITED KINGDOM 23 1 2 2 1 29
UNITED STATES 2 80 3 42 29 2 224 120 502
Grand Total 4 20 141 3 3 1245 175 1 14 305 1 4 188 13 6 2123
T‐55
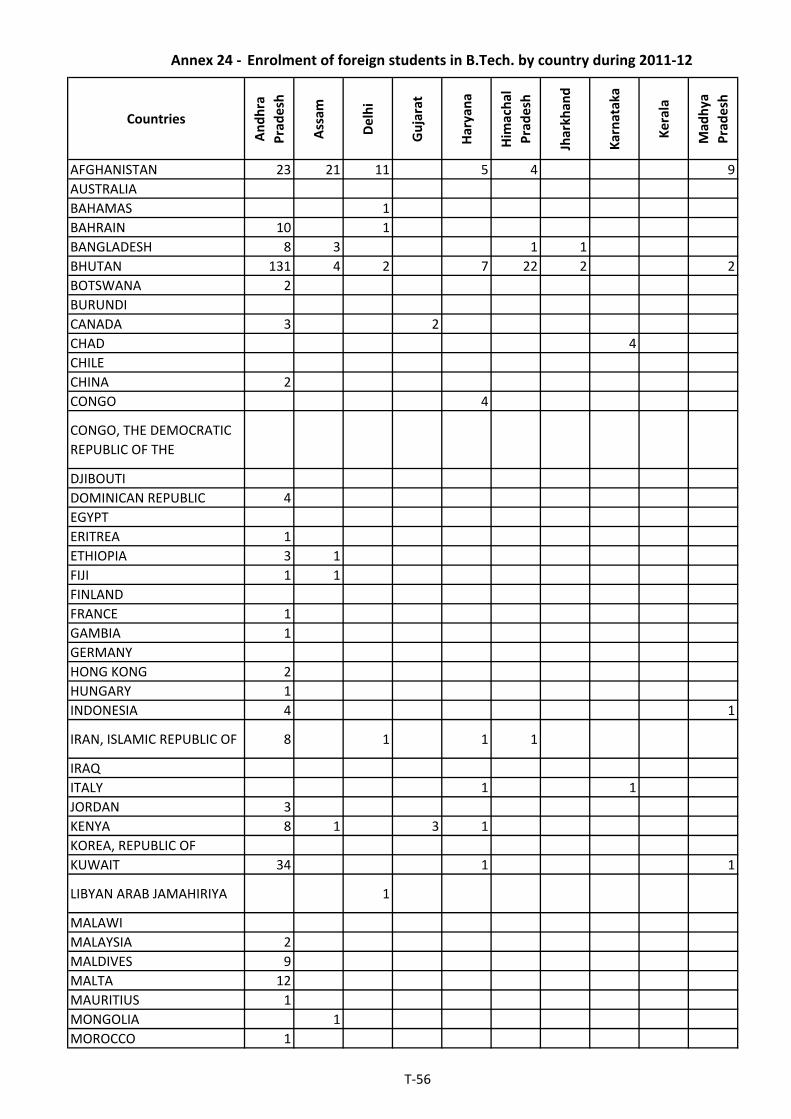
Annex 24 ‐ Enrolment of foreign students in B.Tech. by country during 2011‐12
Countries
Andhra
Pradesh
Assam
Delhi
Gujarat
Haryana
Him
achal
Pradesh
Jharkhan
d
Karnataka
Kerala
Mad
hya
Pradesh
AFGHANISTAN 23 21 11 5 4 9
AUSTRALIA
BAHAMAS 1
BAHRAIN 10 1
BANGLADESH 8 3 1 1
BHUTAN 131 4 2 7 22 2 2
BOTSWANA 2
BURUNDI
CANADA 3 2
CHAD 4
CHILE
CHINA 2
CONGO 4
CONGO, THE DEMOCRATIC
REPUBLIC OF THE
DJIBOUTI
DOMINICAN REPUBLIC 4
EGYPT
ERITREA 1
ETHIOPIA 3 1
FIJI 1 1
FINLAND
FRANCE 1
GAMBIA 1
GERMANY
HONG KONG 2
HUNGARY 1
INDONESIA 4 1
IRAN, ISLAMIC REPUBLIC OF 8 1 1 1
IRAQ
ITALY 1 1
JORDAN 3
KENYA 8 1 3 1
KOREA, REPUBLIC OF
KUWAIT 34 1 1
LIBYAN ARAB JAMAHIRIYA 1
MALAWI
MALAYSIA 2
MALDIVES 9
MALTA 12
MAURITIUS 1
MONGOLIA 1
MOROCCO 1
T‐56
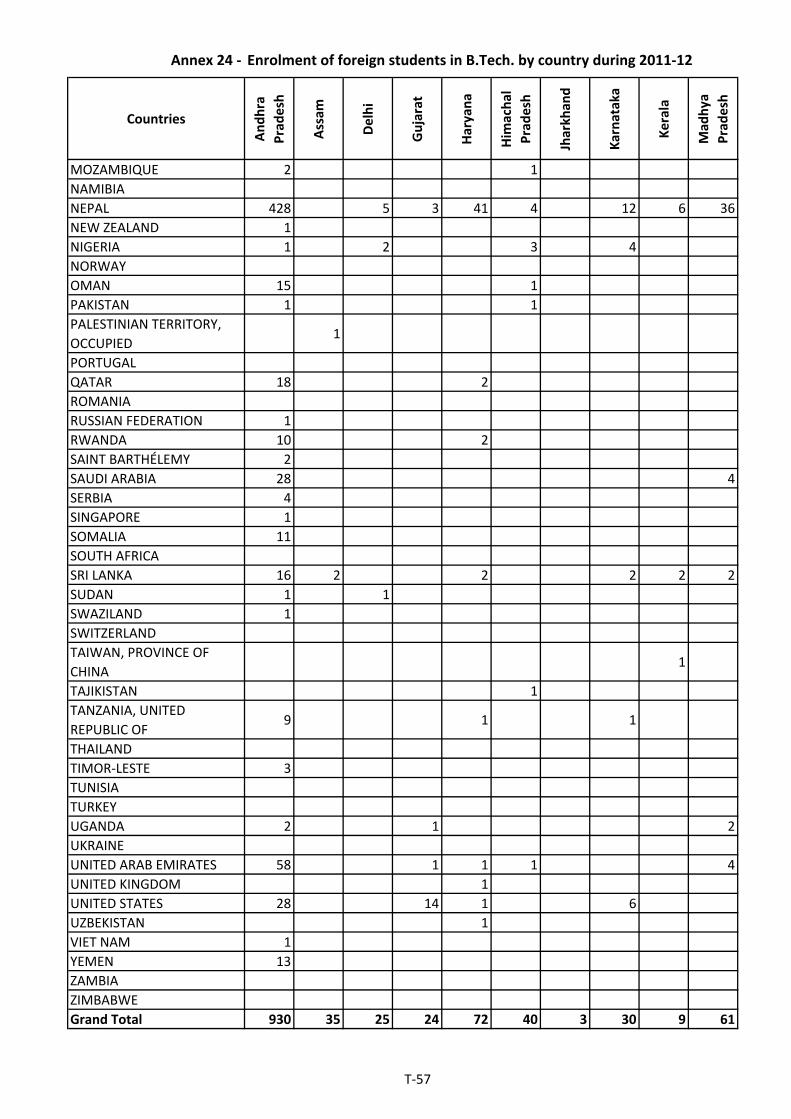
Annex 24 ‐ Enrolment of foreign students in B.Tech. by country during 2011‐12
Countries
Andhra
Pradesh
Assam
Delhi
Gujarat
Haryana
Him
achal
Pradesh
Jharkhan
d
Karnataka
Kerala
Mad
hya
Pradesh
MOZAMBIQUE 2 1
NAMIBIA
NEPAL 428 5 3 41 4 12 6 36
NEW ZEALAND 1
NIGERIA 1 2 3 4
NORWAY
OMAN 15 1
PAKISTAN 1 1
PALESTINIAN TERRITORY,
OCCUPIED1
PORTUGAL
QATAR 18 2
ROMANIA
RUSSIAN FEDERATION 1
RWANDA 10 2
SAINT BARTHÉLEMY 2
SAUDI ARABIA 28 4
SERBIA 4
SINGAPORE 1
SOMALIA 11
SOUTH AFRICA
SRI LANKA 16 2 2 2 2 2
SUDAN 1 1
SWAZILAND 1
SWITZERLAND
TAIWAN, PROVINCE OF
CHINA1
TAJIKISTAN 1
TANZANIA, UNITED
REPUBLIC OF9 1 1
THAILAND
TIMOR‐LESTE 3
TUNISIA
TURKEY
UGANDA 2 1 2
UKRAINE
UNITED ARAB EMIRATES 58 1 1 1 4
UNITED KINGDOM 1
UNITED STATES 28 14 1 6
UZBEKISTAN 1
VIET NAM 1
YEMEN 13
ZAMBIA
ZIMBABWE
Grand Total 930 35 25 24 72 40 3 30 9 61
T‐57
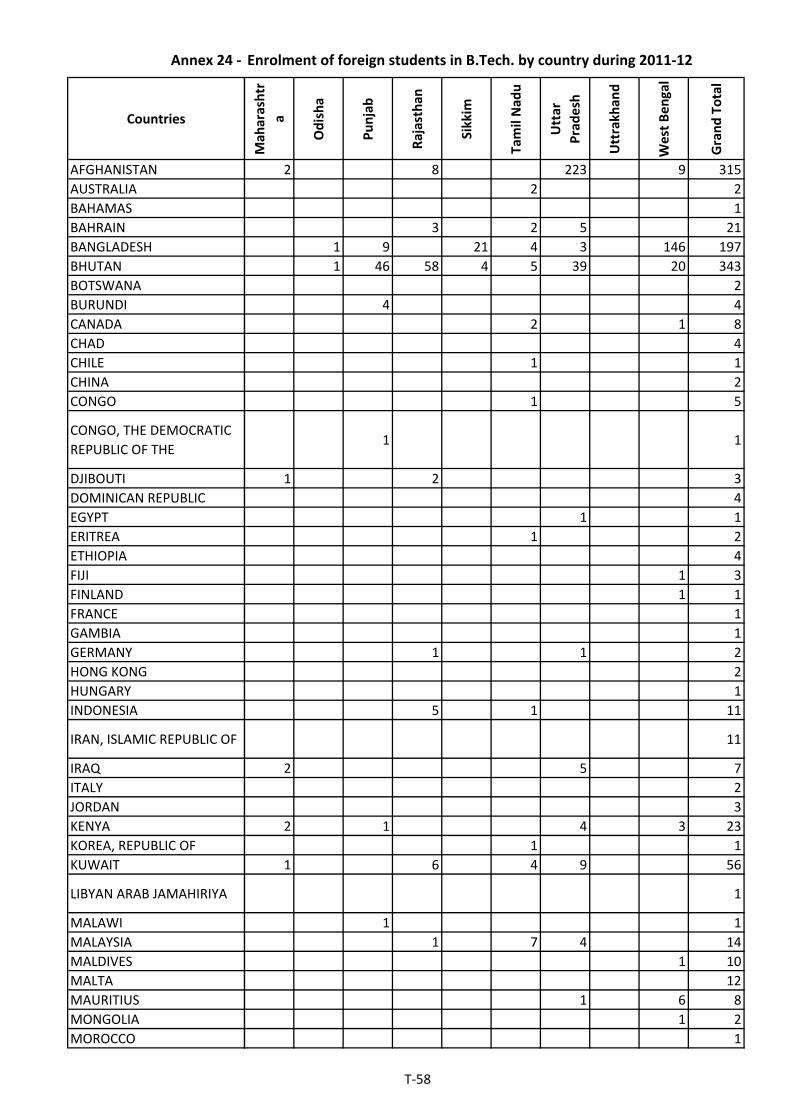
Annex 24 ‐
Countries
AFGHANISTAN
AUSTRALIA
BAHAMAS
BAHRAIN
BANGLADESH
BHUTAN
BOTSWANA
BURUNDI
CANADA
CHAD
CHILE
CHINA
CONGO
CONGO, THE DEMOCRATIC
REPUBLIC OF THE
DJIBOUTI
DOMINICAN REPUBLIC
EGYPT
ERITREA
ETHIOPIA
FIJI
FINLAND
FRANCE
GAMBIA
GERMANY
HONG KONG
HUNGARY
INDONESIA
IRAN, ISLAMIC REPUBLIC OF
IRAQ
ITALY
JORDAN
KENYA
KOREA, REPUBLIC OF
KUWAIT
LIBYAN ARAB JAMAHIRIYA
MALAWI
MALAYSIA
MALDIVES
MALTA
MAURITIUS
MONGOLIA
MOROCCO
Enrolment of foreign students in B.Tech. by country during 2011‐12
Mah
arashtr
a
Odisha
Punjab
Rajasthan
Sikkim
Tamil Nad
u
Uttar
Pradesh
Uttrakhan
d
West Ben
gal
Grand Total
2 8 223 9 315
2 2
1
3 2 5 21
1 9 21 4 3 146 197
1 46 58 4 5 39 20 343
2
4 4
2 1 8
4
1 1
2
1 5
1 1
1 2 3
4
1 1
1 2
4
1 3
1 1
1
1
1 1 2
2
1
5 1 11
11
2 5 7
2
3
2 1 4 3 23
1 1
1 6 4 9 56
1
1 1
1 7 4 14
1 10
12
1 6 8
1 2
1
T‐58

Annex 24 ‐
Countries
MOZAMBIQUE
NAMIBIA
NEPAL
NEW ZEALAND
NIGERIA
NORWAY
OMAN
PAKISTAN
PALESTINIAN TERRITORY,
OCCUPIED
PORTUGAL
QATAR
ROMANIA
RUSSIAN FEDERATION
RWANDA
SAINT BARTHÉLEMY
SAUDI ARABIA
SERBIA
SINGAPORE
SOMALIA
SOUTH AFRICA
SRI LANKA
SUDAN
SWAZILAND
SWITZERLAND
TAIWAN, PROVINCE OF
CHINA
TAJIKISTAN
TANZANIA, UNITED
REPUBLIC OF
THAILAND
TIMOR‐LESTE
TUNISIA
TURKEY
UGANDA
UKRAINE
UNITED ARAB EMIRATES
UNITED KINGDOM
UNITED STATES
UZBEKISTAN
VIET NAM
YEMEN
ZAMBIA
ZIMBABWE
Grand Total
Enrolment of foreign students in B.Tech. by country during 2011‐12
Mah
arashtr
a
Odisha
Punjab
Rajasthan
Sikkim
Tamil Nad
u
Uttar
Pradesh
Uttrakhan
d
West Ben
gal
Grand Total
3
1 1
14 46 141 10 16 272 28 79 1141
1 2
13 2 20 1 46
1 1
7 8 2 2 35
2
1
1 1
11 9 4 2 46
1 1
1 2
4 5 21
2
12 11 9 18 82
4
1 9 2 13
11
2 1 3
3 21 8 2 60
7 10 1 20
1
1 1
1
1
2 1 1 1 1 17
2 1 1 4
3
1 1
1 1
1 6
1 1
1 20 33 12 3 134
1 1 2 5
9 11 4 73
1
1 2
1 2 16
13 13
1 1
23 16 134 304 35 192 626 28 287 2874
T‐59
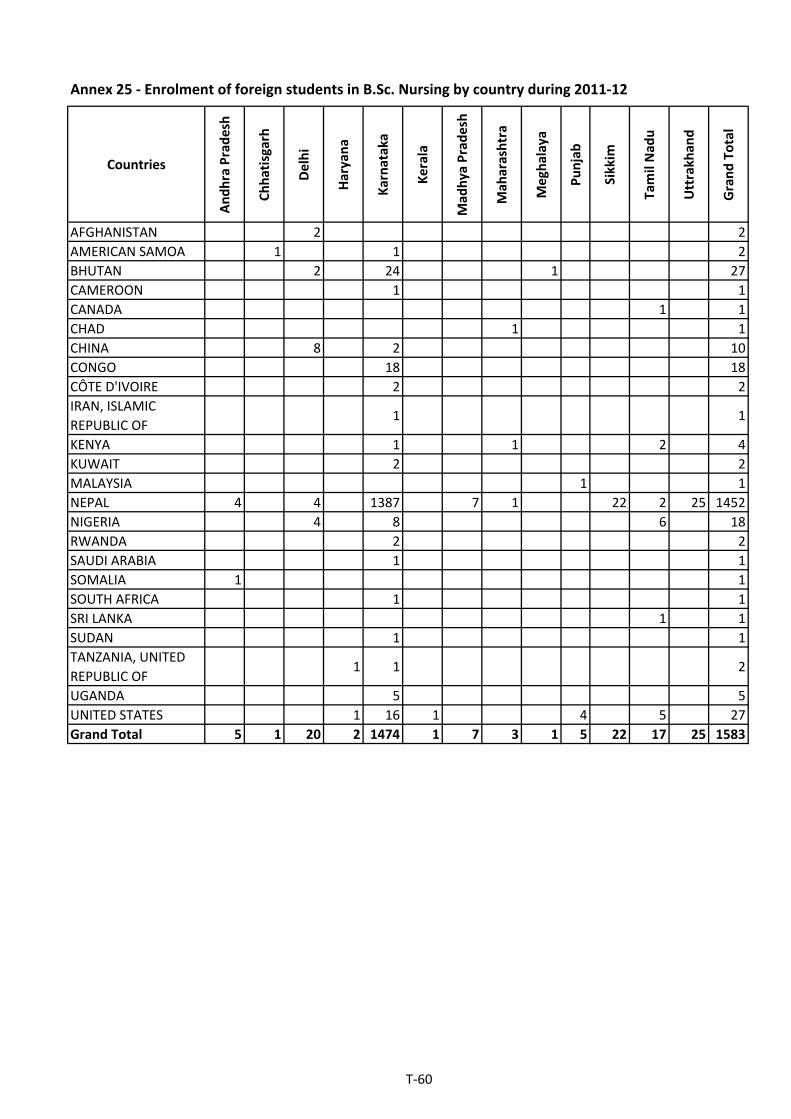
Annex 25 ‐ Enrolment of foreign students in B.Sc. Nursing by country during 2011‐12
Countries
Andhra Pradesh
Chhatisgarh
Delhi
Haryana
Karnataka
Kerala
Mad
hya Pradesh
Mah
arashtra
Meghalaya
Punjab
Sikkim
Tamil Nad
u
Uttrakhan
d
Grand Total
AFGHANISTAN 2 2
AMERICAN SAMOA 1 1 2
BHUTAN 2 24 1 27
CAMEROON 1 1
CANADA 1 1
CHAD 1 1
CHINA 8 2 10
CONGO 18 18
CÔTE D'IVOIRE 2 2
IRAN, ISLAMIC
REPUBLIC OF1 1
KENYA 1 1 2 4
KUWAIT 2 2
MALAYSIA 1 1
NEPAL 4 4 1387 7 1 22 2 25 1452
NIGERIA 4 8 6 18
RWANDA 2 2
SAUDI ARABIA 1 1
SOMALIA 1 1
SOUTH AFRICA 1 1
SRI LANKA 1 1
SUDAN 1 1
TANZANIA, UNITED
REPUBLIC OF1 1 2
UGANDA 5 5
UNITED STATES 1 16 1 4 5 27
Grand Total 5 1 20 2 1474 1 7 3 1 5 22 17 25 1583
T‐60

Annex 26 ‐ Enrolment of foreign students in B.Sc. by country during 2011‐12
Countries
Andhra
Pradesh
Bihar
Chan
digarh
Delhi
Goa
Gujarat
Haryana
Karnataka
Kerala
Mah
arashtra
AFGHANISTAN 9 3 7 3 21 23 23
AMERICAN SAMOA 1
AUSTRALIA
BAHRAIN 1
BANGLADESH 9 3
BENIN
BHUTAN 7 1
BOTSWANA 2
BRITISH INDIAN OCEAN TERRITORY
BRUNEI DARUSSALAM
BULGARIA 124
BURUNDI 1
CAMBODIA 2
CAMEROON 15
CANADA 7
CHAD 1
CHINA 1 2 23
COMOROS
CONGO 14 14 4
CONGO, THE DEMOCRATIC 3
CÔTE D'IVOIRE 1 6
DJIBOUTI
EGYPT 1
ERITREA 1 1
ETHIOPIA 3
FIJI 1 1
GHANA 1
GREECE
INDONESIA 1 1 3
IRAN, ISLAMIC REPUBLIC OF 1 1 33 13
IRAQ 2
JAPAN 2
JORDAN 1
KAZAKHSTAN 1
KENYA 1 7 1 3
KOREA, DEMOCRATIC PEOPLE'S 3 1
KOREA, REPUBLIC OF 1 1
KUWAIT
LESOTHO
LIBYAN ARAB JAMAHIRIYA
MALAWI
MALAYSIA 34
T‐61
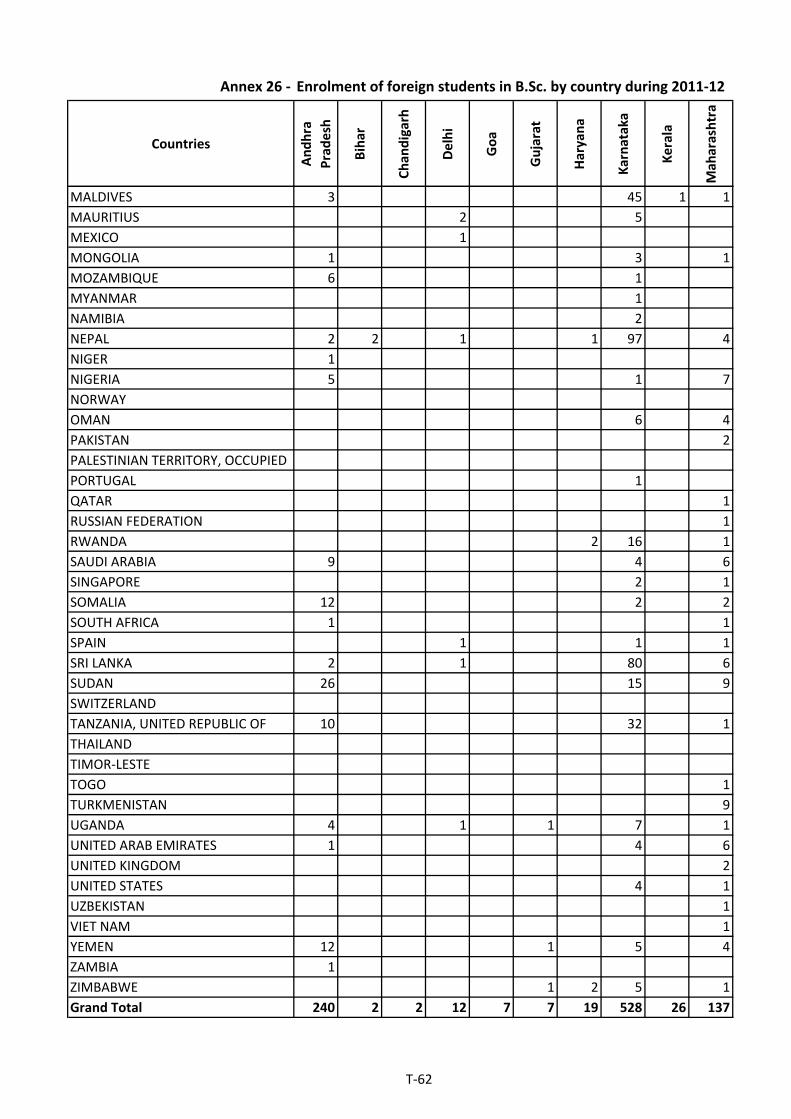
Annex 26 ‐ Enrolment of foreign students in B.Sc. by country during 2011‐12
Countries
Andhra
Pradesh
Bihar
Chan
digarh
Delhi
Goa
Gujarat
Haryana
Karnataka
Kerala
Mah
arashtra
MALDIVES 3 45 1 1
MAURITIUS 2 5
MEXICO 1
MONGOLIA 1 3 1
MOZAMBIQUE 6 1
MYANMAR 1
NAMIBIA 2
NEPAL 2 2 1 1 97 4
NIGER 1
NIGERIA 5 1 7
NORWAY
OMAN 6 4
PAKISTAN 2
PALESTINIAN TERRITORY, OCCUPIED
PORTUGAL 1
QATAR 1
RUSSIAN FEDERATION 1
RWANDA 2 16 1
SAUDI ARABIA 9 4 6
SINGAPORE 2 1
SOMALIA 12 2 2
SOUTH AFRICA 1 1
SPAIN 1 1 1
SRI LANKA 2 1 80 6
SUDAN 26 15 9
SWITZERLAND
TANZANIA, UNITED REPUBLIC OF 10 32 1
THAILAND
TIMOR‐LESTE
TOGO 1
TURKMENISTAN 9
UGANDA 4 1 1 7 1
UNITED ARAB EMIRATES 1 4 6
UNITED KINGDOM 2
UNITED STATES 4 1
UZBEKISTAN 1
VIET NAM 1
YEMEN 12 1 5 4
ZAMBIA 1
ZIMBABWE 1 2 5 1
Grand Total 240 2 2 12 7 7 19 528 26 137
T‐62
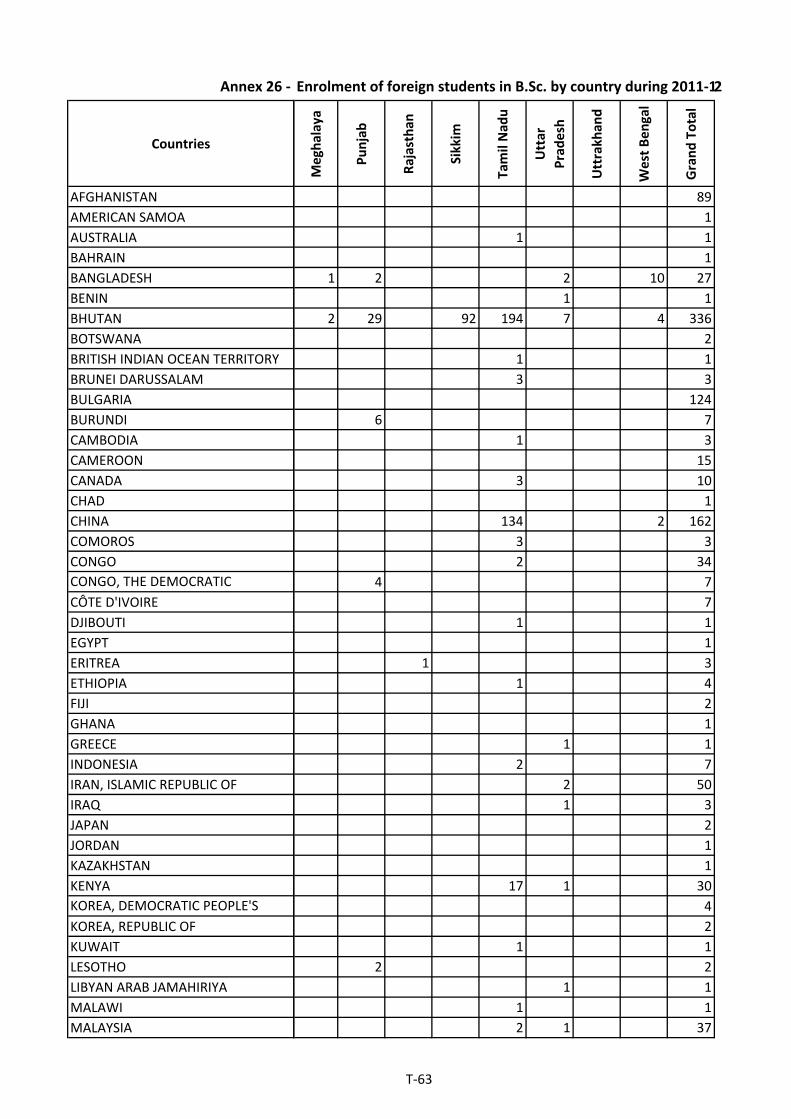
Annex 26 ‐
Countries
AFGHANISTAN
AMERICAN SAMOA
AUSTRALIA
BAHRAIN
BANGLADESH
BENIN
BHUTAN
BOTSWANA
BRITISH INDIAN OCEAN TERRITORY
BRUNEI DARUSSALAM
BULGARIA
BURUNDI
CAMBODIA
CAMEROON
CANADA
CHAD
CHINA
COMOROS
CONGO
CONGO, THE DEMOCRATIC
CÔTE D'IVOIRE
DJIBOUTI
EGYPT
ERITREA
ETHIOPIA
FIJI
GHANA
GREECE
INDONESIA
IRAN, ISLAMIC REPUBLIC OF
IRAQ
JAPAN
JORDAN
KAZAKHSTAN
KENYA
KOREA, DEMOCRATIC PEOPLE'S
KOREA, REPUBLIC OF
KUWAIT
LESOTHO
LIBYAN ARAB JAMAHIRIYA
MALAWI
MALAYSIA
Enrolment of foreign students in B.Sc. by country during 2011‐12
Meghalaya
Punjab
Rajasthan
Sikkim
Tamil Nad
u
Uttar
Pradesh
Uttrakhan
d
West Ben
gal
Grand Total
89
1
1 1
1
1 2 2 10 27
1 1
2 29 92 194 7 4 336
2
1 1
3 3
124
6 7
1 3
15
3 10
1
134 2 162
3 3
2 34
4 7
7
1 1
1
1 3
1 4
2
1
1 1
2 7
2 50
1 3
2
1
1
17 1 30
4
2
1 1
2 2
1 1
1 1
2 1 37
T‐63

Annex 26 ‐
Countries
MALDIVES
MAURITIUS
MEXICO
MONGOLIA
MOZAMBIQUE
MYANMAR
NAMIBIA
NEPAL
NIGER
NIGERIA
NORWAY
OMAN
PAKISTAN
PALESTINIAN TERRITORY, OCCUPIED
PORTUGAL
QATAR
RUSSIAN FEDERATION
RWANDA
SAUDI ARABIA
SINGAPORE
SOMALIA
SOUTH AFRICA
SPAIN
SRI LANKA
SUDAN
SWITZERLAND
TANZANIA, UNITED REPUBLIC OF
THAILAND
TIMOR‐LESTE
TOGO
TURKMENISTAN
UGANDA
UNITED ARAB EMIRATES
UNITED KINGDOM
UNITED STATES
UZBEKISTAN
VIET NAM
YEMEN
ZAMBIA
ZIMBABWE
Grand Total
Enrolment of foreign students in B.Sc. by country during 2011‐12
Meghalaya
Punjab
Rajasthan
Sikkim
Tamil Nad
u
Uttar
Pradesh
Uttrakhan
d
West Ben
gal
Grand Total
1 1 52
2 9
1
1 6
1 8
2 3
1 3
9 2 16 16 17 167
1
3 1 6 1 24
1 1
1 11
2
1 1
1
1
1
24 113 156
3 22
5 8
5 21
7 9
1 4
1 94 1 185
1 89 140
1 1
2 6 51
1 1 2
1 1
1
9
3 2 19
9 20
2 4
4 2 11
1
7 8
1 23
1
1 10
5 88 6 92 745 38 18 17 1989
T‐64

Annex 27 ‐ Enrolment of foreign students in B. Pharm. by country during 2011‐12
Countries
Andhra
Pradesh
Chan
digarh
Delhi
Gujarat
Haryana
Karnataka
Mah
arashtra
Punjab
Rajasthan
Sikkim
Tamil Nad
u
Uttar Pradesh
West Ben
gal
Grand Total
AFGHANISTAN 2 3 5
AMERICAN SAMOA 1 1
BANGLADESH 4 1 1 1 7
BHUTAN 1 20 2 2 1 2 28
BOTSWANA 1 1 2
BURUNDI 2 9 11
CAMEROON 3 3
CANADA 1 3 3 7
CHAD 1 1
CHINA 1 1
CONGO 5 5
CÔTE D'IVOIRE 5 5
ERITREA 1 2 1 4
FIJI 1 1
GHANA 1 1
IRAN, ISLAMIC REPUBLIC
OF4 257 48 1 310
IRAQ 24 11 1 478 13 4 4 535
IRELAND 4 4
KENYA 3 4 31 15 53
KOREA, REPUBLIC OF 1 1
MADAGASCAR 1 1
MALAYSIA 3 3
MALDIVES 1 1
MAURITIUS 12 12
MONGOLIA 1 1
NEPAL 1 275 1 9 6 4 296
NIGERIA 6 2 3 2 1 11 25
OMAN 1 1 2
RWANDA 4 4 4 26 38
SAUDI ARABIA 5 5
SOMALIA 4 4
SRI LANKA 7 1 8
SUDAN 73 1 188 1 1 4 298 566
TANZANIA, UNITED
REPUBLIC OF1 2 28 5 1 37
UGANDA 6 32 1 39
UNITED ARAB EMIRATES 2 2
UNITED KINGDOM 1 1
UNITED STATES 1 3 3 3 10
VIET NAM 1 3 4
YEMEN 2 3 1 4 10
ZAMBIA 1 1
Grand Total 122 3 27 12 6 1377 81 17 14 9 373 8 2 2051
T‐65

Countries
Andhra
Pradesh
Chan
digarh
Gujarat
Karnataka
Mah
arashtra
Punjab
Tamil Nad
u
West Ben
gal
Grand Total
AFGHANISTAN 21 22 37 80
ANGOLA 15 15
AUSTRALIA 2 1 2 5
BAHRAIN 4 8 1 13
BANGLADESH 1 6 1 4 1 13
BELGIUM 1 1
BHUTAN 17 1 50 1 69
BOTSWANA 2 2
BRAZIL 1 1
CAMBODIA 1 1
CAMEROON 8 8
CANADA 3 3 4 1 11
CHAD 2 2
CHINA 7 2 9
COLOMBIA 1 1
CONGO 2 1 7 10
CONGO, THE
DEMOCRATIC
REPUBLIC OF THE
9 9
CÔTE D'IVOIRE 2 2
DJIBOUTI 2 2
EGYPT 3 1 4
ERITREA 6 1 1 8
ESTONIA 2 2
ETHIOPIA 8 8
INDONESIA 2 1 1 4
IRAN, ISLAMIC
REPUBLIC OF13 38 18 1 70
IRAQ 1 4 2 7
JAPAN 1 1 2
JORDAN 2 2
KENYA 2 1 14 1 4 22
KUWAIT 9 1 14 2 3 29
LESOTHO 5 5
MADAGASCAR 1 1
MALAYSIA 1 2 7 10
MALDIVES 3 1 7 11
MALI
MAURITIUS 1 150 2 1 154
MEXICO 1 1
MOZAMBIQUE 2 2
NEPAL 9 54 443 36 2 62 606
Annex 28 ‐ Enrolment of foreign students in Bachelor of Engineering by country
during 2011‐12
T‐66
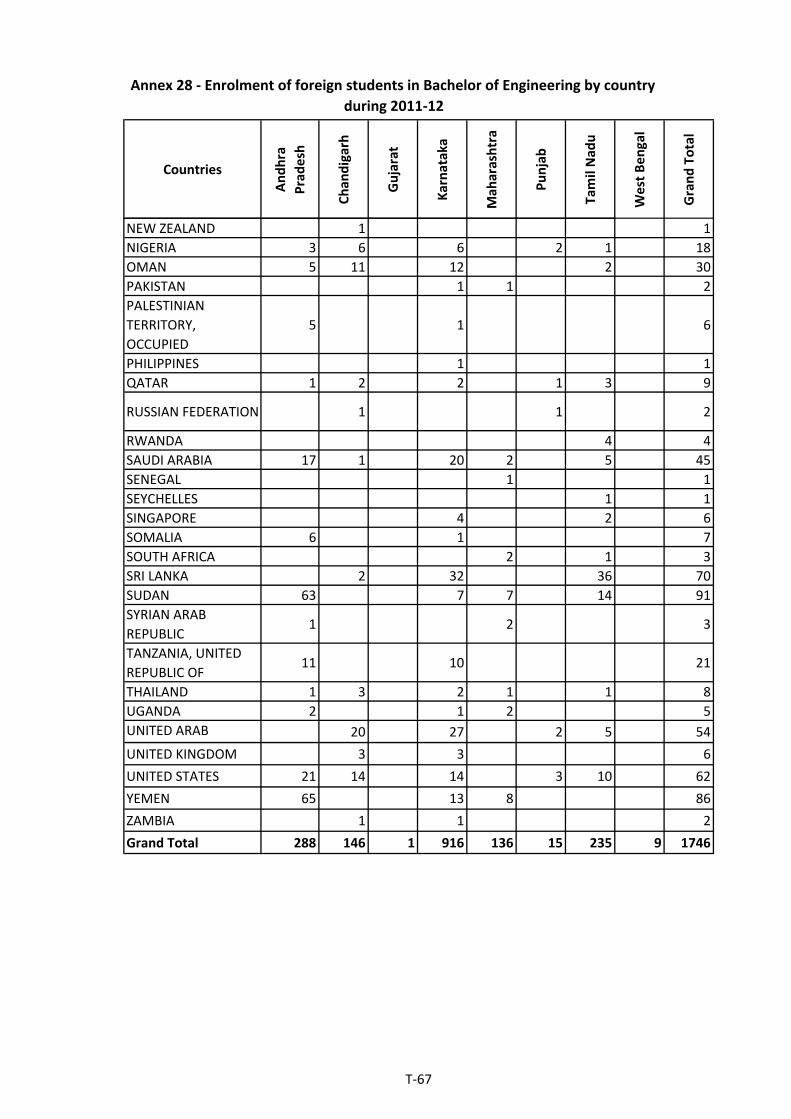
Countries
Andhra
Pradesh
Chan
digarh
Gujarat
Karnataka
Mah
arashtra
Punjab
Tamil Nad
u
West Ben
gal
Grand Total
Annex 28 ‐ Enrolment of foreign students in Bachelor of Engineering by country
during 2011‐12
NEW ZEALAND 1 1
NIGERIA 3 6 6 2 1 18
OMAN 5 11 12 2 30
PAKISTAN 1 1 2
PALESTINIAN
TERRITORY,
OCCUPIED
5 1 6
PHILIPPINES 1 1
QATAR 1 2 2 1 3 9
RUSSIAN FEDERATION 1 1 2
RWANDA 4 4
SAUDI ARABIA 17 1 20 2 5 45
SENEGAL 1 1
SEYCHELLES 1 1
SINGAPORE 4 2 6
SOMALIA 6 1 7
SOUTH AFRICA 2 1 3
SRI LANKA 2 32 36 70
SUDAN 63 7 7 14 91
SYRIAN ARAB
REPUBLIC1 2 3
TANZANIA, UNITED
REPUBLIC OF11 10 21
THAILAND 1 3 2 1 1 8
UGANDA 2 1 2 5
UNITED ARAB 20 27 2 5 54
UNITED KINGDOM 3 3 6
UNITED STATES 21 14 14 3 10 62
YEMEN 65 13 8 86
ZAMBIA 1 1 2
Grand Total 288 146 1 916 136 15 235 9 1746
T‐67

Countries
Andhra
Pradesh
Chan
digarh
Dam
an & Diu
Haryana
Him
achal
Pradesh
Karnataka
Mah
arashtra
Odisha
Punjab
Tamil Nad
u
Uttar Pradesh
Grand Total
AFGHANISTAN 3 2 5
AUSTRALIA 2 2 1 1 3 9
BAHRAIN 2 1 3
BANGLADESH 1 1
BHUTAN 4 2 1 3 10
BRITISH INDIAN OCEAN
TERRITORY1 1
CANADA 2 1 4 20 5 13 2 47
COLOMBIA 1 1
DJIBOUTI 2 2
EGYPT 1 1
GERMANY 1 1
IRAN, ISLAMIC REPUBLIC OF 1 242 21 1 265
IRAQ 5 8 1 14
IRELAND 1 1
KENYA 10 10
KOREA, REPUBLIC OF 1 4 5
KUWAIT 1 1 2
MALAYSIA 377 185 562
MALDIVES 1 1
MAURITIUS 2 2 4
NAMIBIA 2 2
NEPAL 4 11 1 16
NEW ZEALAND 2 2
NIGERIA 1 1
OMAN 2 2
QATAR 1 1 2
SAUDI ARABIA 1 1 2
SEYCHELLES 2 2
SINGAPORE 1 1
SOUTH AFRICA 1 1 2
SRI LANKA 3 29 32
SUDAN 1 1
SWITZERLAND 1 1
THAILAND 1 1
UGANDA 1 1
UNITED ARAB EMIRATES 2 2 5 9
UNITED KINGDOM 5 1 6
UNITED STATES 2 10 1 22 4 9 6 54
YEMEN 2 1 3
Grand Total 6 15 1 18 1 728 42 1 24 248 1 1085
UGANDA 1 1
UNITED ARAB EMIRATES 1 11 5 17
UNITED KINGDOM 4 5 9
UNITED STATES 3 2 1 28 6 15 55
UNITED STATES MINOR OUTLYING
ISLANDS7 7
YEMEN 3 3
Grand Total 16 30 2 43 2 1458 85 49 59 496 22 2262
Annex 29 ‐ Enrolment of foreign students in Bachelor of Dental Surgery by country during 2011‐12
T‐68

Countries
Andhra
Pradesh
Bihar
Delhi
Goa
Gujarat
Haryana
Him
achal
Pradesh
Karnataka
Kerala
Mah
arashtra
Meghalaya
Punjab
Rajasthan
Sikkim
Tamil Nad
u
Uttar Pradesh
Uttrakh
and
West Bengal
Grand Total
AFGHANISTAN 133 9 1 4 5 187 2 341
ÅLAND ISLANDS 1 1
AUSTRALIA 1 1
AUSTRIA 1 1
BAHRAIN 1 10 122 23 156
BANGLADESH 2 4 6 1 2 5 20
BHUTAN 2 58 10 10 20 47 136 5 15 303
BOTSWANA 2 3 5
BURUNDI 5 2 1 8
CAMEROON 1 1
CANADA 1 1
CENTRAL AFRICAN
REPUBLIC1 1
CHINA 13 23 1 4 57 2 3 103
CONGO 1 1
CONGO, THE
DEMOCRATIC
REPUBLIC OF THE
1 1
CÔTE D'IVOIRE 146 146
DJIBOUTI 12 3 1 16
EGYPT 2 2
ERITREA 1 12 13
ETHIOPIA 6 1 7
FIJI 2 2 4
FRANCE 1 3 4
GABON 1 1
GERMANY 1 2 3
GUINEA 1 1
INDONESIA 1 1 3 1 2 8
IRAN, ISLAMIC
REPUBLIC OF9 43 86 138
IRAQ 1 1 2
ITALY 1 1
JORDAN 5 5
KAZAKHSTAN 2 2
KENYA 16 7 4 33 7 3 70
KOREA,
DEMOCRATIC
PEOPLE'S
REPUBLIC OF
1 1 2
KOREA, REPUBLIC
OF5 9 14
KUWAIT 8 8
LAO PEOPLE'S
DEMOCRATIC
REPUBLIC
1 1
Annex 30 ‐ Enrolment of foreign students in B.Com. by country during 2011‐12
T‐69
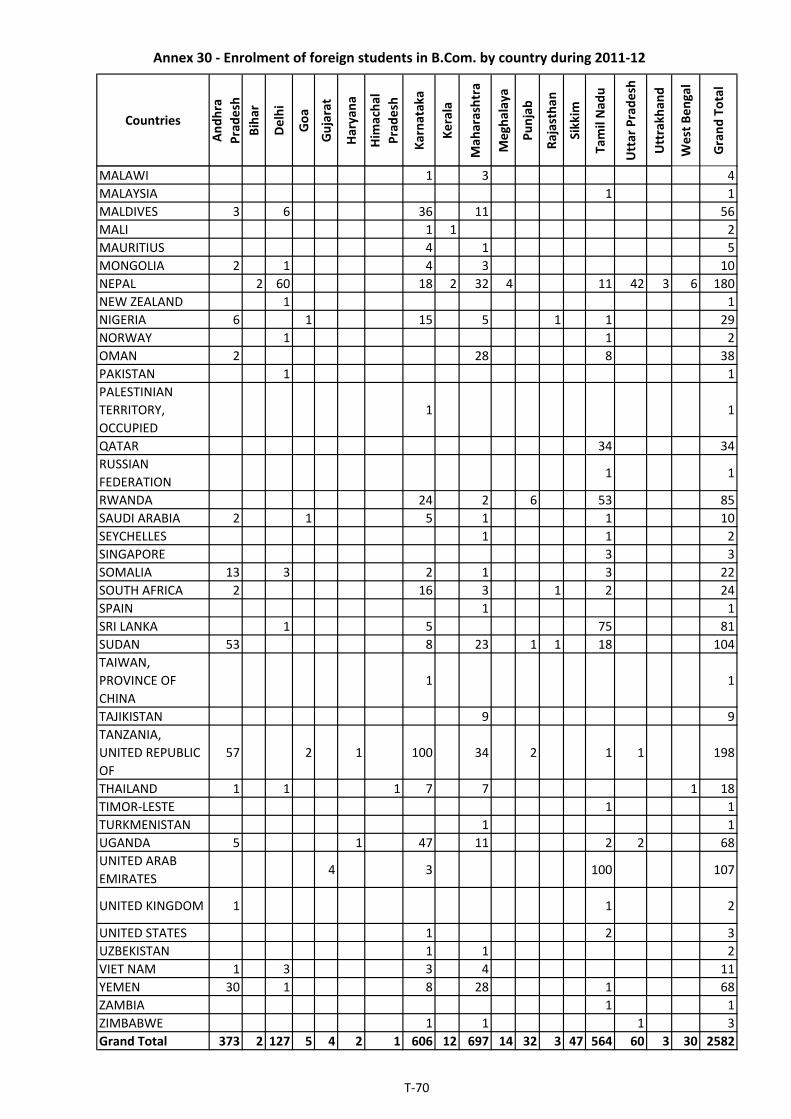
Countries
Andhra
Pradesh
Bihar
Delhi
Goa
Gujarat
Haryana
Him
achal
Pradesh
Karnataka
Kerala
Mah
arashtra
Meghalaya
Punjab
Rajasthan
Sikkim
Tamil Nad
u
Uttar Pradesh
Uttrakh
and
West Bengal
Grand Total
Annex 30 ‐ Enrolment of foreign students in B.Com. by country during 2011‐12
MALAWI 1 3 4
MALAYSIA 1 1
MALDIVES 3 6 36 11 56
MALI 1 1 2
MAURITIUS 4 1 5
MONGOLIA 2 1 4 3 10
NEPAL 2 60 18 2 32 4 11 42 3 6 180
NEW ZEALAND 1 1
NIGERIA 6 1 15 5 1 1 29
NORWAY 1 1 2
OMAN 2 28 8 38
PAKISTAN 1 1
PALESTINIAN
TERRITORY,
OCCUPIED
1 1
QATAR 34 34
RUSSIAN
FEDERATION1 1
RWANDA 24 2 6 53 85
SAUDI ARABIA 2 1 5 1 1 10
SEYCHELLES 1 1 2
SINGAPORE 3 3
SOMALIA 13 3 2 1 3 22
SOUTH AFRICA 2 16 3 1 2 24
SPAIN 1 1
SRI LANKA 1 5 75 81
SUDAN 53 8 23 1 1 18 104
TAIWAN,
PROVINCE OF
CHINA
1 1
TAJIKISTAN 9 9
TANZANIA,
UNITED REPUBLIC
OF
57 2 1 100 34 2 1 1 198
THAILAND 1 1 1 7 7 1 18
TIMOR‐LESTE 1 1
TURKMENISTAN 1 1
UGANDA 5 1 47 11 2 2 68
UNITED ARAB
EMIRATES4 3 100 107
UNITED KINGDOM 1 1 2
UNITED STATES 1 2 3
UZBEKISTAN 1 1 2
VIET NAM 1 3 3 4 11
YEMEN 30 1 8 28 1 68
ZAMBIA 1 1
ZIMBABWE 1 1 1 3
Grand Total 373 2 127 5 4 2 1 606 12 697 14 32 3 47 564 60 3 30 2582
T‐70

Countries
Andhra
Pradesh
Chan
digarh
Delhi
Goa
Gujarat
Haryana
Karnataka
Kerala
Mad
hya
Pradesh
Mah
arashtra
Meghalaya
Punjab
Rajasthan
Sikkim
Tamil Nad
u
Uttar Pradesh
West Ben
gal
Grand Total
AFGHANISTAN 6 1 12 3 7 20 5 27 3 84
ANGOLA 1 1 2
BAHRAIN 2 11 10 23
BANGLADESH 9 2 11
BENIN 2 2
BHUTAN 32 11 2 11 16 104 8 184
BRUNEI
DARUSSALAM1 1
BURUNDI 7 4 3 2 16
CAMBODIA 1 1
CAMEROON 8 2 10
CENTRAL AFRICAN
REPUBLIC1 1
CHAD 3 2 5
CHINA 80 9 89
CONGO 3 7 214 2 2 228
CONGO, THE
DEMOCRATIC
REPUBLIC OF THE
1 2 2 22 27
CÔTE D'IVOIRE 69 2 71
DJIBOUTI 2 2 4
EGYPT 1 1
ERITREA 5 1 6
ETHIOPIA 1 1
FIJI 1 1
GHANA 1 1
INDONESIA 1 1 1 3
IRAN, ISLAMIC
REPUBLIC OF1 1 2 16 9 1 30
IRAQ 1 1
IRELAND 1 1
KENYA 2 1 1 3 14 21
KOREA, DEMOCRATIC
PEOPLE'S REPUBLIC
OF
24 24
KOREA, REPUBLIC OF 1 1
KUWAIT 1 2 3
MALAWI 2 2
MALDIVES 8 8
MALI 2 2
MAURITIUS 5 1 6
Annex 31 ‐ Enrolment of foreign students in Bachelor of Computer Applications by country during 2011‐
12
T‐71

Countries
Andhra
Pradesh
Chan
digarh
Delhi
Goa
Gujarat
Haryana
Karnataka
Kerala
Mad
hya
Pradesh
Mah
arashtra
Meghalaya
Punjab
Rajasthan
Sikkim
Tamil Nad
u
Uttar Pradesh
West Ben
gal
Grand Total
Annex 31 ‐ Enrolment of foreign students in Bachelor of Computer Applications by country during 2011‐
12
MONGOLIA 19 1 20
MOZAMBIQUE 4 1 5
NEPAL 96 2 6 1 2 3 4 1 115
NIGERIA 4 12 3 38 3 15 2 77
OMAN 2 5 11 18
PAKISTAN 1 1
PALESTINIAN
TERRITORY,
OCCUPIED
1 1
QATAR 1 2 3
RWANDA 19 16 20 55
SAUDI ARABIA 3 4 56 8 1 72
SEYCHELLES 2 2
SINGAPORE 9 9
SOMALIA 5 1 6
SOUTH AFRICA 1 2 2 48 1 54
SRI LANKA 11 15 26
SUDAN 66 3 181 11 5 1 52 319
SYRIAN ARAB
REPUBLIC1 2 3
TANZANIA, UNITED
REPUBLIC OF6 1 4 1 41 5 2 60
THAILAND 34 1 35
TIMOR‐LESTE 2 2
TONGA 1 1
UGANDA 2 33 1 1 1 38
UNITED ARAB
EMIRATES24 20 44
UNITED KINGDOM 1 1
UNITED STATES 1 1
VIET NAM 5 2 3 10
YEMEN 9 1 2 46 12 1 71
ZAMBIA 1 1
Grand Total 119 3 37 12 14 14 1176 5 13 120 2 81 3 19 287 3 13 1921
T‐72
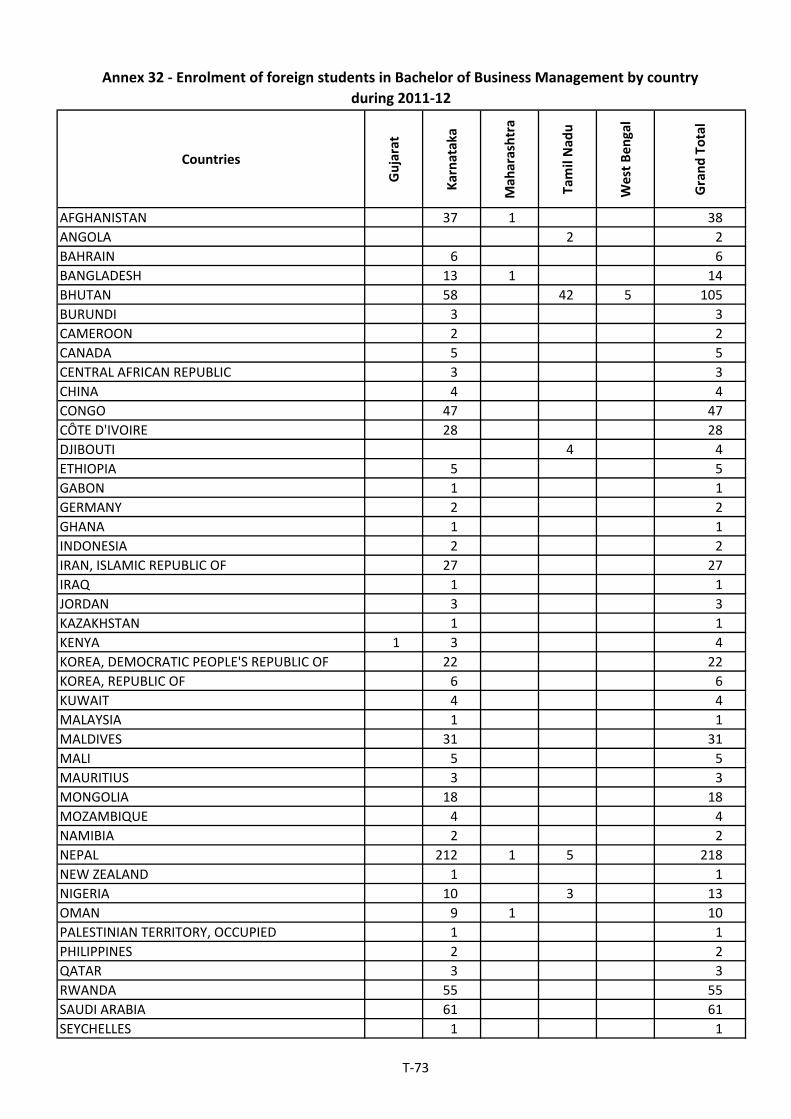
Countries
Gujarat
Karnataka
Mah
arashtra
Tamil Nad
u
West Ben
gal
Grand Total
AFGHANISTAN 37 1 38
ANGOLA 2 2
BAHRAIN 6 6
BANGLADESH 13 1 14
BHUTAN 58 42 5 105
BURUNDI 3 3
CAMEROON 2 2
CANADA 5 5
CENTRAL AFRICAN REPUBLIC 3 3
CHINA 4 4
CONGO 47 47
CÔTE D'IVOIRE 28 28
DJIBOUTI 4 4
ETHIOPIA 5 5
GABON 1 1
GERMANY 2 2
GHANA 1 1
INDONESIA 2 2
IRAN, ISLAMIC REPUBLIC OF 27 27
IRAQ 1 1
JORDAN 3 3
KAZAKHSTAN 1 1
KENYA 1 3 4
KOREA, DEMOCRATIC PEOPLE'S REPUBLIC OF 22 22
KOREA, REPUBLIC OF 6 6
KUWAIT 4 4
MALAYSIA 1 1
MALDIVES 31 31
MALI 5 5
MAURITIUS 3 3
MONGOLIA 18 18
MOZAMBIQUE 4 4
NAMIBIA 2 2
NEPAL 212 1 5 218
NEW ZEALAND 1 1
NIGERIA 10 3 13
OMAN 9 1 10
PALESTINIAN TERRITORY, OCCUPIED 1 1
PHILIPPINES 2 2
QATAR 3 3
RWANDA 55 55
SAUDI ARABIA 61 61
SEYCHELLES 1 1
Annex 32 ‐ Enrolment of foreign students in Bachelor of Business Management by country
during 2011‐12
T‐73

Countries
Gujarat
Karnataka
Mah
arashtra
Tamil Nad
u
West Ben
gal
Grand Total
Annex 32 ‐ Enrolment of foreign students in Bachelor of Business Management by country
during 2011‐12
SINGAPORE 2 2
SOMALIA 5 5
SOUTH AFRICA 52 52
SRI LANKA 39 2 41
SUDAN 15 5 20
TAIWAN, PROVINCE OF CHINA 1 1
TANZANIA, UNITED REPUBLIC OF 1 122 1 124
THAILAND 25 25
UGANDA 1 30 31
UNITED ARAB EMIRATES 2 11 13
UNITED KINGDOM 3 3
UNITED STATES 3 3
VIET NAM 1 1
YEMEN 22 22
ZAMBIA 2 2
Grand Total 8 1032 4 65 5 1114
T‐74
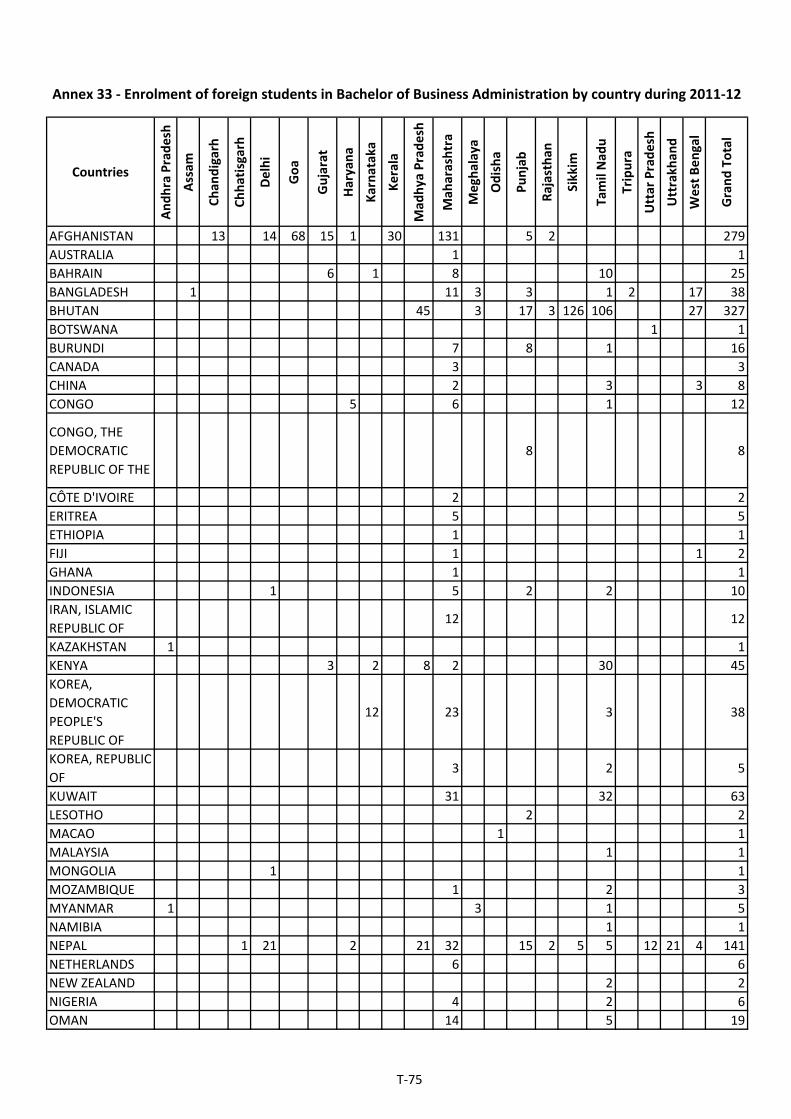
CountriesAndhra Pradesh
Assam
Chan
digarh
Chhatisgarh
Delhi
Goa
Gujarat
Haryana
Karnataka
Kerala
Mad
hya Pradesh
Mah
arashtra
Meghalaya
Odisha
Punjab
Rajasthan
Sikkim
Tamil Nad
u
Tripura
Uttar Pradesh
Uttrakh
and
West Bengal
Grand Total
AFGHANISTAN 13 14 68 15 1 30 131 5 2 279
AUSTRALIA 1 1
BAHRAIN 6 1 8 10 25
BANGLADESH 1 11 3 3 1 2 17 38
BHUTAN 45 3 17 3 126 106 27 327
BOTSWANA 1 1
BURUNDI 7 8 1 16
CANADA 3 3
CHINA 2 3 3 8
CONGO 5 6 1 12
CONGO, THE
DEMOCRATIC
REPUBLIC OF THE
8 8
CÔTE D'IVOIRE 2 2
ERITREA 5 5
ETHIOPIA 1 1
FIJI 1 1 2
GHANA 1 1
INDONESIA 1 5 2 2 10
IRAN, ISLAMIC
REPUBLIC OF12 12
KAZAKHSTAN 1 1
KENYA 3 2 8 2 30 45
KOREA,
DEMOCRATIC
PEOPLE'S
REPUBLIC OF
12 23 3 38
KOREA, REPUBLIC
OF3 2 5
KUWAIT 31 32 63
LESOTHO 2 2
MACAO 1 1
MALAYSIA 1 1
MONGOLIA 1 1
MOZAMBIQUE 1 2 3
MYANMAR 1 3 1 5
NAMIBIA 1 1
NEPAL 1 21 2 21 32 15 2 5 5 12 21 4 141
NETHERLANDS 6 6
NEW ZEALAND 2 2
NIGERIA 4 2 6
OMAN 14 5 19
Annex 33 ‐ Enrolment of foreign students in Bachelor of Business Administration by country during 2011‐12
T‐75

CountriesAndhra Pradesh
Assam
Chan
digarh
Chhatisgarh
Delhi
Goa
Gujarat
Haryana
Karnataka
Kerala
Mad
hya Pradesh
Mah
arashtra
Meghalaya
Odisha
Punjab
Rajasthan
Sikkim
Tamil Nad
u
Tripura
Uttar Pradesh
Uttrakh
and
West Bengal
Grand Total
Annex 33 ‐ Enrolment of foreign students in Bachelor of Business Administration by country during 2011‐12
PORTUGAL 1 1
QATAR 12 10 22
RWANDA 1 11 43 55
SAUDI ARABIA 1 14 6 1 22
SEYCHELLES 1 1
SINGAPORE 1 3 4
SOMALIA 1 1 2
SOUTH AFRICA 1 3 1 5
SPAIN 1 1
SRI LANKA 1 3 49 53
SUDAN 13 1 10 24
TANZANIA,
UNITED REPUBLIC
OF
3 17 10 9 39
THAILAND 1 2 1 2 1 7
TURKMENISTAN 1 1
UGANDA 1 4 9 6 1 21
UKRAINE 1 1
UNITED ARAB
EMIRATES11 68 21 1 101
UNITED
KINGDOM2 2 4
UNITED STATES 5 4 9
UZBEKISTAN 1 1
VIET NAM 1 3 4
YEMEN 3 18 1 22
ZAMBIA 1 1
ZIMBABWE 1 1 2
Grand Total 4 1 13 1 39 68 49 13 18 31 83 482 9 1 84 7 131 367 2 17 21 53 1494
T‐76

Annex 34 ‐ Enrolment of foreign students in B.A. by country during 2011‐12
Countries
Andhra
Pradesh
Bihar
Chan
digarh
Chhatisgarh
Delhi
Goa
Gujarat
Haryana
Him
achal
Pradesh
Karnataka
Kerala
AFGHANISTAN 8 13 55 31 18 48 2
ALGERIA 245 3
AUSTRALIA 9
BANGLADESH 6 2 3
BHUTAN 1 5 10 46
BOTSWANA
BRAZIL 1
CAMBODIA
CANADA 1
CENTRAL AFRICAN REPUBLIC 1
CHINA 6 15 16 1
CONGO 9
CONGO, THE DEMOCRATIC
REPUBLIC OF THE2
DENMARK 1
ECUADOR 1
EGYPT 1
ETHIOPIA 1
FIJI 1
FRANCE
GAMBIA 1
GERMANY 2
GHANA 2 1
ICELAND 1
INDONESIA 1
IRAN, ISLAMIC REPUBLIC OF 3 5 17
IRAQ 2
ISRAEL
ITALY
JAPAN 1
JORDAN 3
KAZAKHSTAN 1
KENYA 2
KOREA, DEMOCRATIC
PEOPLE'S REPUBLIC OF2 2 1
KOREA, REPUBLIC OF 6 7
MACEDONIA, THE FORMER
YUGOSLAV REPUBLIC OF1
MALDIVES 1 3 49
MAURITANIA
T‐77

Annex 34 ‐ Enrolment of foreign students in B.A. by country during 2011‐12
Countries
Andhra
Pradesh
Bihar
Chan
digarh
Chhatisgarh
Delhi
Goa
Gujarat
Haryana
Him
achal
Pradesh
Karnataka
Kerala
MAURITIUS 4 2 1 2
MONGOLIA 2
MOZAMBIQUE 2
MYANMAR 1 40
NAMIBIA 3 4
NEPAL 6 10 1 19
NIGERIA 4 1 1 8
OMAN 1
PAKISTAN 1
PHILIPPINES 2
PORTUGAL 9
QATAR 1
RWANDA 5
SOLOMON ISLANDS 1
SOMALIA 1 3
SOUTH AFRICA 5 5
SRI LANKA 2 1 4 5 24
SUDAN 1
SWEDEN
TAIWAN, PROVINCE OF
CHINA6
TAJIKISTAN 1 1
TANZANIA, UNITED
REPUBLIC OF13 1 27
THAILAND 2 7 2 3
TONGA
TURKMENISTAN 3
UGANDA 3 2 4
UKRAINE 1
UNITED ARAB EMIRATES 1
UNITED KINGDOM
UNITED STATES 4 2
UZBEKISTAN 2
VIET NAM 4
ZIMBABWE 1
Grand Total 313 55 47 4 158 34 18 1 314 4
T‐78
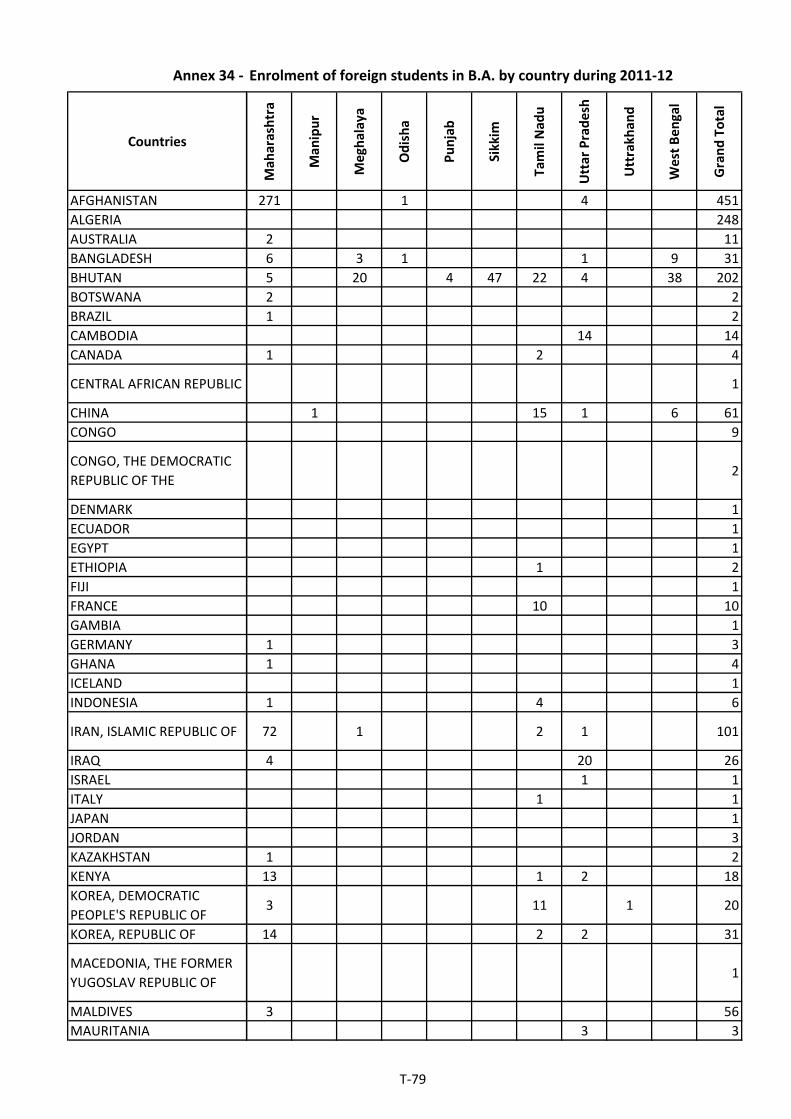
Annex 34 ‐
Countries
AFGHANISTAN
ALGERIA
AUSTRALIA
BANGLADESH
BHUTAN
BOTSWANA
BRAZIL
CAMBODIA
CANADA
CENTRAL AFRICAN REPUBLIC
CHINA
CONGO
CONGO, THE DEMOCRATIC
REPUBLIC OF THE
DENMARK
ECUADOR
EGYPT
ETHIOPIA
FIJI
FRANCE
GAMBIA
GERMANY
GHANA
ICELAND
INDONESIA
IRAN, ISLAMIC REPUBLIC OF
IRAQ
ISRAEL
ITALY
JAPAN
JORDAN
KAZAKHSTAN
KENYA
KOREA, DEMOCRATIC
PEOPLE'S REPUBLIC OF
KOREA, REPUBLIC OF
MACEDONIA, THE FORMER
YUGOSLAV REPUBLIC OF
MALDIVES
MAURITANIA
Enrolment of foreign students in B.A. by country during 2011‐12
Mah
arashtra
Man
ipur
Meghalaya
Odisha
Punjab
Sikkim
Tamil Nad
u
Uttar Pradesh
Uttrakhan
d
West Ben
gal
Grand Total
271 1 4 451
248
2 11
6 3 1 1 9 31
5 20 4 47 22 4 38 202
2 2
1 2
14 14
1 2 4
1
1 15 1 6 61
9
2
1
1
1
1 2
1
10 10
1
1 3
1 4
1
1 4 6
72 1 2 1 101
4 20 26
1 1
1 1
1
3
1 2
13 1 2 18
3 11 1 20
14 2 2 31
1
3 56
3 3
T‐79
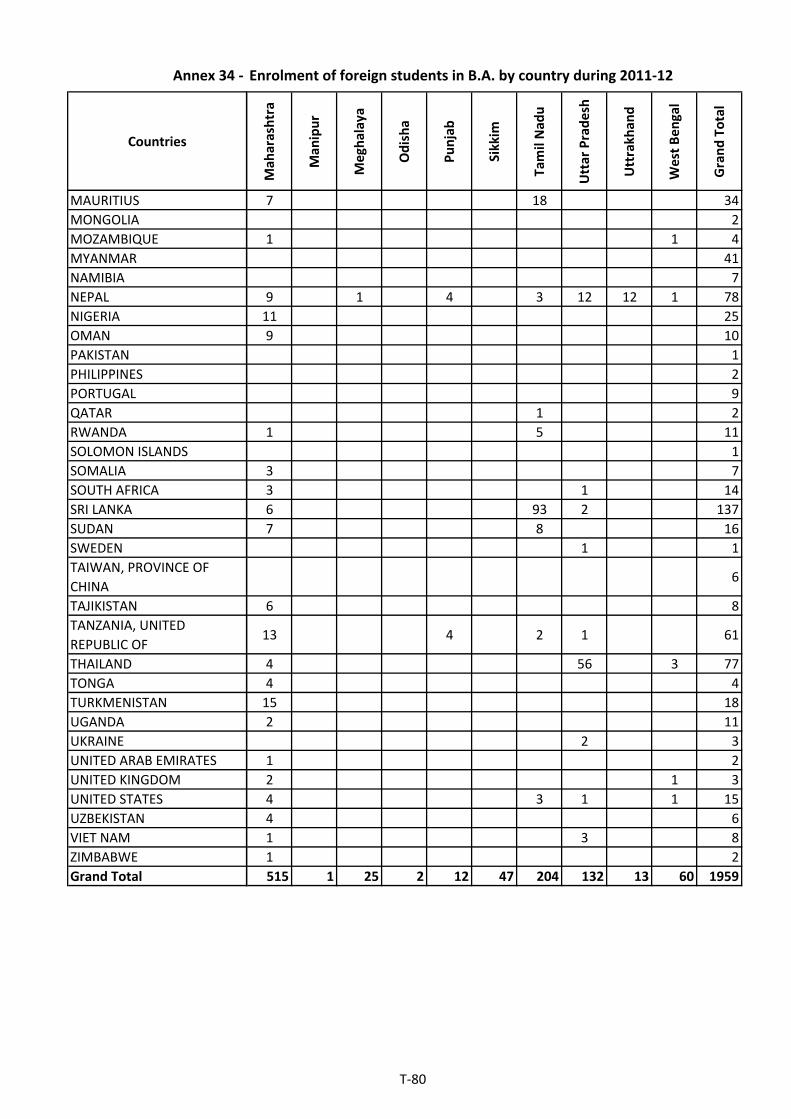
Annex 34 ‐
Countries
MAURITIUS
MONGOLIA
MOZAMBIQUE
MYANMAR
NAMIBIA
NEPAL
NIGERIA
OMAN
PAKISTAN
PHILIPPINES
PORTUGAL
QATAR
RWANDA
SOLOMON ISLANDS
SOMALIA
SOUTH AFRICA
SRI LANKA
SUDAN
SWEDEN
TAIWAN, PROVINCE OF
CHINA
TAJIKISTAN
TANZANIA, UNITED
REPUBLIC OF
THAILAND
TONGA
TURKMENISTAN
UGANDA
UKRAINE
UNITED ARAB EMIRATES
UNITED KINGDOM
UNITED STATES
UZBEKISTAN
VIET NAM
ZIMBABWE
Grand Total
Enrolment of foreign students in B.A. by country during 2011‐12
Mah
arashtra
Man
ipur
Meghalaya
Odisha
Punjab
Sikkim
Tamil Nad
u
Uttar Pradesh
Uttrakhan
d
West Ben
gal
Grand Total
7 18 34
2
1 1 4
41
7
9 1 4 3 12 12 1 78
11 25
9 10
1
2
9
1 2
1 5 11
1
3 7
3 1 14
6 93 2 137
7 8 16
1 1
6
6 8
13 4 2 1 61
4 56 3 77
4 4
15 18
2 11
2 3
1 2
2 1 3
4 3 1 1 15
4 6
1 3 8
1 2
515 1 25 2 12 47 204 132 13 60 1959
T‐80