cowen health care conference - march 10, 2010 - gsk · £4.7bn us growth rate impacted b y losses...
TRANSCRIPT

Julian HeslopChief Financial Officer
Cowen Healthcare Conference10th March 2010
1

2009 Performance summary Before restructuring costs
2009 2008 % Ch2009 2008 % Change£m £m CER £
Turnover 28,368 24,352 3 16
EPS 121.2p 104.7p 2 16
Free Cash Flow 5,254 4,679 12
2
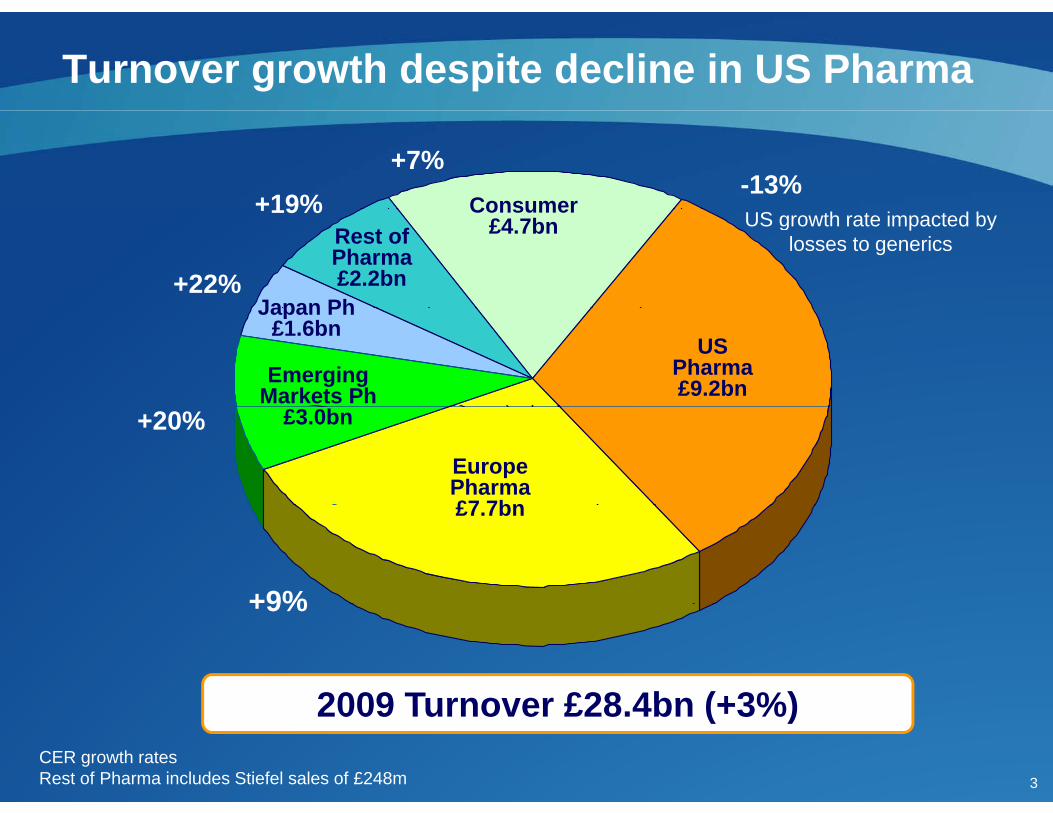
Turnover growth despite decline in US Pharma
Consumer
+7%+19%
-13%
Rest of Pharma £2.2bn
Japan Ph
Consumer £4.7bn US growth rate impacted by
losses to generics
+19%
+22%
US Pharma£9.2bnEmerging
Markets Ph
Japan Ph £1.6bn
EuropePharma£7 7bn
£3.0bn+20%
£7.7bn
+9%
2009 Turnover £28 4bn (+3%)
+9%
3
2009 Turnover £28.4bn (+3%)CER growth ratesRest of Pharma includes Stiefel sales of £248m

GSK Emerging Markets Pharma 2009 turnover
2009 £3.0bn (+20%)
SSA
By region Top markets
(+24
%)
China*MENA
16%
)
6%)
0%)
)
CIS
(+ (+6
(+1
+22%
)
(+28
%)
+56%
)(+6%
(+36
%)£m
MexicoSouthAsia
(+(
Latina
Mexico Asia
4
*China includes HKSource: Turnover and growth is GSK 2009 as reported. Growth rates are CER. Rankings are IMS MAT Dec 09Emerging markets by “industry definitions” incl Consumer and additional markets was £ 5.6bn (+16%)
GSK ranking # 11 5 3 13 7 1 16 1 1
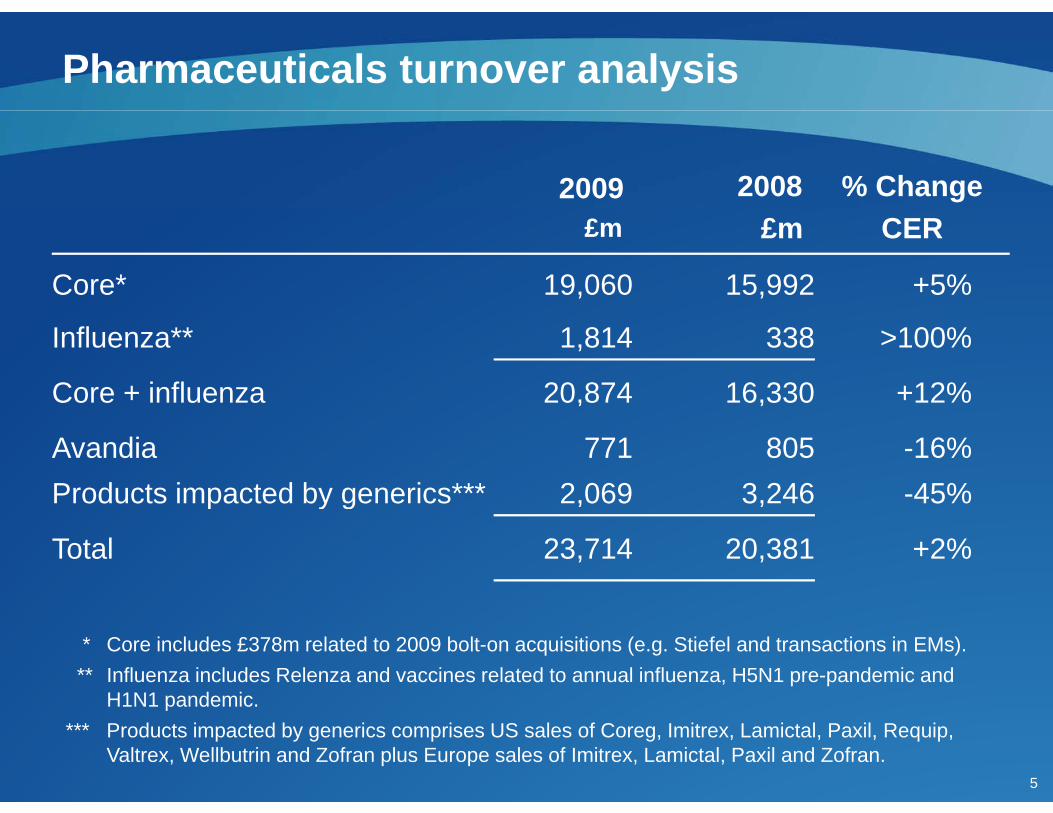
Pharmaceuticals turnover analysis
2009 2008 % Change £m £m CER
Core* 19,060 15,992 +5%
Influenza** 1,814 338 >100%
Core + influenza 20,874 16,330 +12%
Avandia 771 805 -16%Products impacted by generics*** 2,069 3,246 -45%p y g , ,
Total 23,714 20,381 +2%
* Core includes £378m related to 2009 bolt-on acquisitions (e.g. Stiefel and transactions in EMs).** Influenza includes Relenza and vaccines related to annual influenza, H5N1 pre-pandemic and
H1N1 pandemic
5
H1N1 pandemic.*** Products impacted by generics comprises US sales of Coreg, Imitrex, Lamictal, Paxil, Requip,
Valtrex, Wellbutrin and Zofran plus Europe sales of Imitrex, Lamictal, Paxil and Zofran.

2009 Pharmaceuticals key growth drivers
Advair £4,977m +5%V i * £3 706 +30%Vaccines* £3,706m +30%
E i £546 8%Relenza £720m >100%
Avodart £530m +16%V t li £477 26%
Epzicom £546m +8%
Ventolin £477m +26%
A i t £254 29%Lovaza £450m +31%
V t £142 72%
Arixtra £254m +29%Tykerb £169m +45%Veramyst £142m +72%Subtotal £11,971m +23%All th £8 903 1%
6
All others £8,903m +1%Subtotal £20,874m +12%CER growth rates
* Includes H1N1 sales

New products contributed £1.3bn in 2009 (+55%)£2 1bn incl pandemic vaccine£2.1bn incl. pandemic vaccine
Hib iPandemrixHiberix
US US
7
2008 20092007Sales from 2007-09 launches; CER growth rates

Innovative products coming from R&Dp g
Examples of innovative productsExamples of innovative products in late-stage development
Benlysta
darapladib
Benlysta~30 phase III assets
MAGE-3
8

2009 Consumer Healthcare turnover
Horlicks£255m +17%
Nutritional Healthcare
Lucozade£376m -3%
Panadol£393m +10%
OTC Medicines
£0.9bn (+3%)
alli
Aquafresh£496m -1%
£2.3bn (+8%)Oral Healthcare£1.5bn (+7%)
alli£203m >100%
Sensodyne£457m +13%£457m +13% NRT
£339m -1%
9
£4.7bn +7%CER growth rates

2009 Performance summary Before restructuring costs
2009 2008 % Change£m £m CER ££m £m CER £
Turnover 28,368 24,352 3 16
Cost of goods (7,09525.0
)%
(5,77623.7
)%
13 23
SG&A C (8 609) (6 741) 8 28SG&A: Core (8,60930.3
)%
(6,74127.7
)%
8 28
Legal costs (591) (611) (18) (3)g ( ) ( ) ( ) ( )
Total SG&A (9,20032 4
)%
(7,35230 2
)%
6 2532.4% 30.2%
10% in italics are % of turnover

2009 Cost of goods analysis Before restructuring costs
Cost of goods sold as % of turnover
+0.1%+0.6%
+1.2%
-0.6%
25.0%%23.7%
2008 Genericcompetition
Regional / Product mix
OE savings Other 2009
11
pUS and EU

2009 SG&A analysis excl. legal Before restructuring costs
SG&A excluding legal as % of turnover
+0.7%
+1.2%
+0 5%30.3%
+1.6%-1.4%
+0.5%
27.7%
2008 OE Savings Investmentmarkets
Stiefel / HIV ExchangeGains /Losses
Pensions /Other
2009
12
Losses

2009 Performance summary Before restructuring costs
2009 2008 % Change£m £m CER ££m £m CER £
Turnover 28,368 24,352 3 16
Cost of goods (7,09525.0
)%
(5,77623.7
)%
13 23
SG&A (9 200) (7 352) 6 25SG&A (9,20032.4
)%
(7,35230.2
)%
6 25
R&D (3,951) (3,506) 2 13& (3,95113.9
)%
(3,50614.4
)%
3
Other oper. income 1,135 541p
Operating profit 9,25732.6%
8,25933.9%
(1) 12
13% in italics are % of turnover

Other operating income
£1,135m
Formation of ViiV
£541m
Equity disposals & other
£541mProduct &IP divestments
Royalties &milestones
Impairments
milestones
142009 2008
p
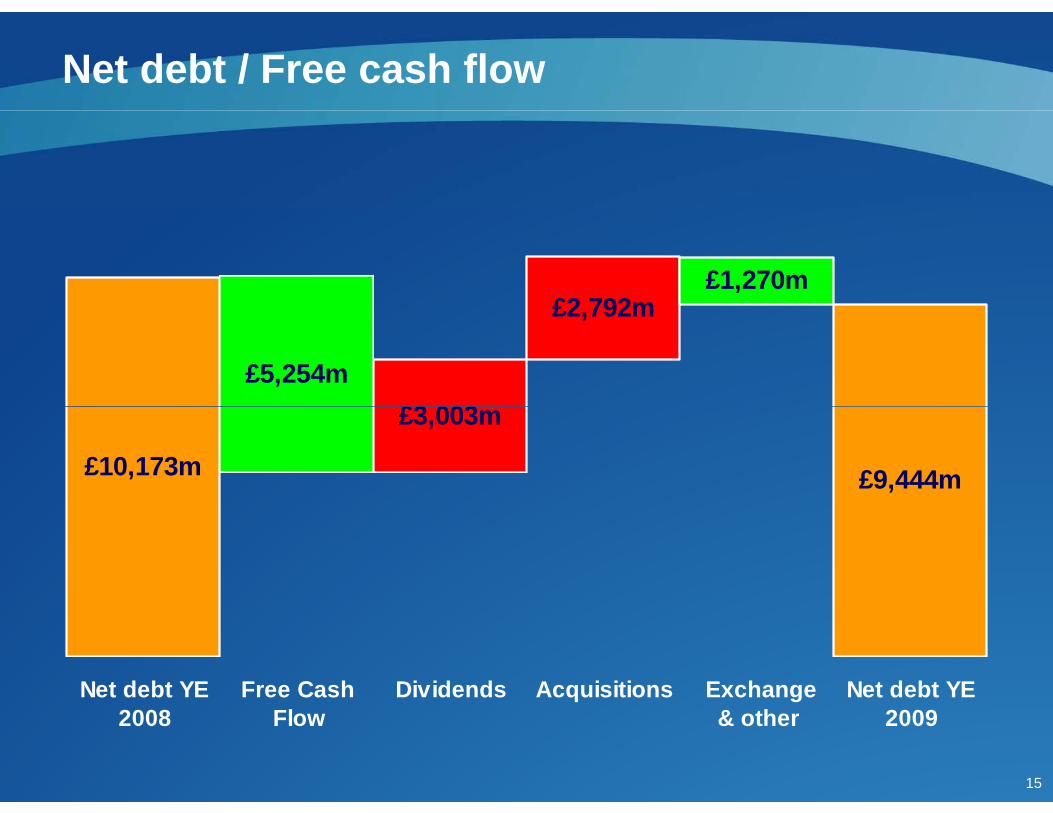
Net debt / Free cash flow
£2 792m£1,270m
£2,792m
£3 003£5,254m
£9,444m£10,173m
£3,003m
Net debt YE Free Cash Dividends Acquisitions Exchange Net debt YE
15
2008 Flow & other 2009

Committed to improving returns in R&Dp g
R&D returns over the last decade have been disappointing1
Our estimates for GSK’s late-stage portfolio2
Our goal is to improve this return by 25% via our R&D strategy
15% 15%15%
10% 10%10%
IRR
5% 5%5%
0% 0%0%
16
1. McKinsey, Nature Reviews, Drug Discovery (Aug 09) for small molecules. 13% for biopharms. 2. We have estimated the projected rate of return based on the investment made to create our late stage pipeline and our expectations on future long term
sales performance. Our current late-stage portfolio includes pharma assets (eg small molecules and biopharms) and vaccines launched from 2007 onwards plus current phase IIb & III pipeline.

Highlights
• GSK returned to growth in 2009: +3% CERGSK returned to growth in 2009: +3% CER
• Diversification is progressing well: Stiefel, HIV
R t t i i h b i t d i th k t• Restructuring saving has been reinvested in growth markets
• Additional restructuring will deliver significant savings (£500 b 2012 70% t th b tt li )(£500m by 2012; ~70% to the bottom line)
• R&D model is working and new product flow is improving
• Actions ongoing to improve returns in R&D
• Strong cash generation continued in ’09: FCF of £5.3bn (+12%)g g ( )
• Dividend growth continues (+7% to 61 pence)
• Disclosure of operating profit components within each segment
17
• Disclosure of operating profit components within each segment begins 1Q10

18