cruise report vers2 - geomar · le gall jerome seaman 18. treguier michel seaman 19. flocʹh...
TRANSCRIPT

Cruise Report HYDROMAR V (04.12.07 – 02.01.08) l’Atalante
page ‐ 1 ‐
Cruise Report
Atalante Cruise Leg – 1 HYDROMAR V
(replacement of cruise MSM06/2)
04.12.07 Toulon to 02.01.08 Recife

Cruise Report HYDROMAR V (04.12.07 – 02.01.08) l’Atalante
page ‐ 2 ‐
SUMMARY 1
1.1 Participants Atalante cruise Hydromar V ................................................................5
1.2 Research Program ........................................................................................................8
1.3 Daily Narrative ...........................................................................................................14
1.4 Preliminary Results ....................................................................................................19
1.4.1 Oceanography.....................................................................................................19
1.4.2 Plume mapping with MAPR ............................................................................24
1.4.3 Gas Chemistry.....................................................................................................28
1.4.4 Logatchev Longterm Environmental Monitoring – LOLEM.......................33
1.4.5 Description of rocks and hydrothermal precipitates ....................................40
1.4.6 Fluid chemistry ...................................................................................................42
1.4.6.1 Sampling and analytical methods................................................................42
1.4.6.2 Analytical procedures on‐board ..................................................................46
1.4.6.3 First results ......................................................................................................47
1.4.6.4 Sulfur Chemistry ............................................................................................52
1.4.6.5 Isotope ratios of oxygen, hydrogen, and carbon .......................................54
1.4.7 Microbiology from diffuse and hot hydrothermal fluids.............................55
1.4.8 Hydrothermal Symbioses..................................................................................62
1.4.9 Metagenomics .....................................................................................................67
1.4.10 ROV deployments during HYDROMAR V........................................................68
1.5 Achnowledgements ...................................................................................................76
1.6 References....................................................................................................................76
1.7 Appendix .....................................................................................................................78
1.7.1 Extended list of operations ...............................................................................79
1.7.2 Fluid chemistry results and subsamples.........................................................91

Cruise Report HYDROMAR V (04.12.07 – 02.01.08) l’Atalante
page ‐ 3 ‐
Summary The overall goal of this leg – conducted under the auspices of the DFG SPP 1144 – is the investigation of causes for temporal and spatial compositional differences of hydrothermal fluids and their effect on the vent communities in the Logatchev hydrothermal field. To achieve this goal, the Logatchev field located at the Mid‐Atlantic Ridge at ~15°N and ~45°W has been, and will be, visited annually since 2004 during the HYDROMAR I‐IV expeditions in the last years and during this cruise in December 2007. The original scientific program was scheduled for 18 working days. The problems with the research vessel MARIA S. MERIAN resulted in a shortening of the working time for the 4 proposals that were rescheduled onto the French research vessel ATALANTE. We therefore anticipated 12 working days for our program. However, due to a heart attack of a crewmember at Christmas Eve the scientific program had to be stopped early after only 9 working days considerably affecting the scientific program. Taking the unexpected short time of 9 days of station work cruise HYDROMAR V with RV “L’Atalante” and ROV “Kiel 6000” was still successful. We had no downtime of the ROV due to repairs and were able to achieve 8 dives during 8 consecutive days totalling 53 hours of bottom time. Weather conditions (up to seastate 6‐7) precluded recovery of the instrument at night for the first couple of days limiting the time available at the seafloor for those first days. Problems with the Posidonia subpositioning systems on board the Atalante or between Atalante and the ROV Kiel 6000 prevented accurate positioning during most dives. However, localization was possible because of our precise knowledge of the hydrothermal field based on the excellent subpositioning during cruise MSM04/3 in January 2007 using the ROV Jason 2.
Due to the overall time limitations of the cruise several geophysical monitoring instruments, previously deployed during MSM04/3 could not be recovered due to time limitations. Also instruments and an additional mooring that should have been installed during this cruise could not be deployed. A major drawback to the scientific program was our inability to deploy the 720 m profiling mooring because of the emergency transit to French‐Guayana.
At specific sites around the hydrothermal field we deployed 4 seismometers to monitor local seismicity. These seismoneters will be collected on a later cruise of the SPP1144. Additionally, an ocean bottom tiltmeter (OBT) and an ocean bottom accelerometer (OBA) were deployed at Logatchev itself and will allow the correlation of regional and local seismicity to seafloor movements at the black smoker vents. Two high‐temperature monitoring recorders are now deployed at two different vent sites and will monitor changes at two different sampling rates (1s for 1 month and 15s for a longer period), it will now be possible to relate changes in hydrothermal activity and vent exit temperature to tectonic processes. The hydrothermal plume as well as low‐ and high‐temperature hydrothermal fluids have been sampled successfully, as have been the vertical temperature gradients in low‐temperature diffuse discharge areas. Temperature measurements at individual sites show a pronounced increase in vent fluid

Cruise Report HYDROMAR V (04.12.07 – 02.01.08) l’Atalante
page ‐ 4 ‐
temperatures (353°C to 375°C) when compared to earlier years and even to the last SPP1144 cruise that took place in January 2007. We have to wait for the on‐shore geochemical analyses of the vent fluids in order to see if there are major chemical changes of the vent fluids associated with this increase. On‐board analyses of the Cl‐concentration (Clmin=540mM Cl) reveal no changes to previous measurements indicating that no significant change in the chlorinity has taken place. Another major focus was the sampling of the vent biota, which, due to the limited time on site, recovered less material than originally anticipated. Preliminary data suggest that two different populations are present at the two major working sites Irina 2 and Quest. The gills, foot and gonads of most of the specimens collected vary distinclty between the two sites. Plume surveys were repeatedly performed at the same sites to investigate plume behavior over time and with changing tides. One of the major outcomes of this study was the variability of the plume height above ground. Within 8 hours the plume maximum was recorded at water depths of 2700m and 3000m respectively, a difference of 300 m. This indicates the strong influence of bottom currents and tides on the plume dispersal at Logatchev. During this cruise we deploy an ADCP on a tripod in the immediate vicinity of a black smoker site, measuring local bottom currents and recording plume behavior for 7 days. Preliminary analyses of this unique data set show the strong tidal variations of the bottom currents affecting plume dispersal.

Cruise Report HYDROMAR V (04.12.07 – 02.01.08) l’Atalante
page ‐ 5 ‐
1.1 Participants Atalante cruise Hydromar V
1. Dr. Sven Petersen Chief Scientist IFM‐GEOMAR
2. Nico Augustin Geology IFM‐GEOMAR
3. Uwe Koy Physic. Oceanography IFM‐GEOMAR
4. Martin Vogt Physic. Oceanography IFM‐GEOMAR
5. Claudia Denker Physic. Oceanography IFM‐GEOMAR
6. Dr. Robin Keir Gas chemistry IFM‐GEOMAR
7. Peggy Wefers Gas chemistry IFM‐GEOMAR
8. Kerstin Claudia Buller Gas chemistry IFM‐GEOMAR
9. Ulrike Westernstroer Fluid chemistry Uni Kiel
10. Dr. Marcus Fabian Geophysics Uni Bremen
11. Bernd Heesemann Geophysics Uni Bremen
12. Cristiane Jost Fluid chemistry JU Bremen
13. Dr. Herwig Marbler Fluid chemistry JU Bremen
14. Dr. Christian Borowski Microbiology/Symbionts MPI Bremen
15. Dennis Fink Microbiology/Symbionts MPI Bremen
16. Martha Schattenhofer Metagenomics MPI Bremen
17. Dr. Mirjam Perner Microbiology Uni Hamburg
18. Thomas Meier Microbiology Uni Hamburg
19. Marc Peters Chemist/Sulfur cycle Uni Münster
20. Anne Westhues Geology Uni Münster
21. Dr. Thomas Kuhn ROV‐crew IFM‐GEOMAR
22. Martin Pieper ROV‐crew IFM‐GEOMAR
23. Karsten Witkiewicz ROV‐crew IFM‐GEOMAR
24. Claus Hinz ROV‐crew IFM‐GEOMAR
25. Arne Meier ROV‐crew IFM‐GEOMAR
26. Inken Suck ROV‐crew Fielax
27. Dan Cormany ROV‐crew High Sierra Technologies
28. Andy Foster ROV‐crew Shilling Robotics

Cruise Report HYDROMAR V (04.12.07 – 02.01.08) l’Atalante
page ‐ 6 ‐
Beteiligte Institutionen / Participating Institutions IFM‐GEOMAR Leibniz Institute for Marine Sciences Wischhofstr. 1‐3 24148 Kiel, Germany JU Bremen Jacobs University Bremen PO box 750561 28725 Bremen MPI Bremen Institute for Marine Microbiology Celsiusstr. 1 28359 Bremen Uni Bremen Department of Geosciences, University of Bremen PO box 330440 28334 Bremen Uni Hamburg Department of Biology, Biozentrum Klein Flottbek Ohnhorststr. 18 22609 Hamburg Uni Kiel Institute for Geosciences Christian‐Albrechts Universität Kiel Olshausenstr. 40 24118 Kiel Uni Münster Geologisch‐Paläontologisches Institut, Universität Münster Corrensstraße 24 D‐48149 Münster Shilling Robotics North Sea Regional Office 51 York Street Aberdeen, AB11 5DP United Kingdom High Sierra Technologies 40940 Baptist Church Drive Lebanon, Oregon, 97355 U.S.A. FIELAX GmbH Schifferstraße 10‐14 27568 Bremerhaven

Cruise Report HYDROMAR V (04.12.07 – 02.01.08) l’Atalante
page ‐ 7 ‐
Ships Crew Atalante cruise Hydromar V
1. Guillemet Philippe Master
2. Groisard Thibault Chief Mate
3. Hamon Briac Mate
4. False Tristan Mate
5. Pichard Serge Chief Engineer
6. Rousselot Vincent SD Engineer
7. Tison Guillaume Third Engineer
8. Treluyer Loic Electro. Engineer
9. Rouault Denis Ass Electro Engineer
10. Tagatamanogi Visesio Boatswain
11. Raguenes Christian Able Seaman
12. Le Troadec Regis Able Seaman
13. Guillerme Alain Carpenter
14. Rigaux Daniel Seaman
15. Le Henaff Jean Pierre Seaman
16. Delarue Jean‐Charles Seaman
17. Le Gall Jerome Seaman
18. Treguier Michel Seaman
19. Flocʹh Laurent Chief Greaser
20. Le Reun David Electrician
21. Paugam Patrick Greaser
22. Loaec Maxime Cleaner
23. Seite Jean‐Jacques Chief Cook
24. Allancon Marcel Chief Cook
25. Appriou Thomas Second Cook
26. Jacoby Claude 2nd Stewart
27. Ferron Fabrice Third Cook
28. Saminadin Julien Steward
29. Morvan Sybille Steward

Cruise Report HYDROMAR V (04.12.07 – 02.01.08) l’Atalante
page ‐ 8 ‐
1.2 Research Program The Logatchev hydrothermal field is situated on a small plateau within the rift valley of the slow‐spreading Mid‐Atlantic Ridge (MAR) at 14°45’N (Fig. 1.2.1). This part of the MAR is dominated by ultramafics (mantle rocks) with subordinate basaltic material – largely in the rift valley. Logatchev is one of only a few ultramafic‐hosted hydrothermal systems known worldwide.
Extensive bathymetric and video mapping during the HYDROMAR I (2004), II (2005), and IV (2006) cruises revealed three factors that appear to control the location of the Logatchev hydrother‐mal fields: (1) cross‐cutting faults, (2) young basaltic magmatism, and (3) slump structures.
Fig. 1.2.1: W‐E profile along 14°45’N without vertical exaggeration with water depths of 4000m in the rift valley and 1600m on the rift mountains. The geology of the ocean floor is interpreted from video mapping and TV‐grab and ROV sampling of the seafloor.
Our investigations indicate that hydrothermal circulation takes place through ultramafic and basaltic talus material and is most likely related to the large slumps (Fig. 1.2.1; Augustin et al., 2005; Kuhn et al., 2005). The heat driving hydrothermal convection is probably supplied from magmatic pools associated with intrusive mafic melts localized underneath the adjacent rift valley and/or off‐axis volcanic structures and from localized intrusion of melts into the peridotite. The petrology of gabbroic and dolerite fragments embedded in the serpentinized ultramafics suggests late intrusion of magma post dating the emplacement of the serpentinized ultramafics (Fig. 1.2.1; Franz et al., 2005).
On a local scale the Logatchev‐1 hydrothermal field is characterized by two different styles of high‐temperature hydrothermal activity:
(i) so called „smoking craters“ (Quest, Anna‐Louise, IRINA 1, Candelaber, and Site „B“) and (ii) mounds with black smoker chimneys at its top (Irina II and site “A”).

Cruise Report HYDROMAR V (04.12.07 – 02.01.08) l’Atalante
page ‐ 9 ‐
The main characteristics of these sites indicating interaction between magmatic, tectonic, hydrothermal and biological processes are as follows:
• All vents occur along a line striking NW‐SE (Fig. 1.2.2). We interpret this alignment as an indication of structural control of the positions of the hydrothermal sites suggesting a connection between hydrothermal activity and seafloor deformation. Therefore geophysical long‐term measurements have been set up during cruise HYDROMAR II in May 2005, and HYDROMAR III in January 2007 across this suggested deformation structure.
• The young pillow volcano and the abundance of mafic intrusive rocks in the Logatchev area indicate robust magmatic activity. This is not a magma‐starved ridge segment as often stated in the literature. The magmatic activity likely also acts as a possible heat source driving the hydrothermal system.
• Preliminary age dating suggests that hydrothermal activity in the Logatchev‐1 field has been occurring for at least 100 000 years.
• Hydrothermal fluids emanate with temperatures up to 350°C in all of these central structures. Isotopic analyses of the hydrothermal fluids (δ18OH2O, δ18Oactivity), their dissolved (δ13CDIC) and particulate (δ34Ssulfide) components indicate high‐T water‐rock reactions at depth. In contrast, exothermic serpentinization of mantle rocks can only account for a small fraction of the heat required for the observed vent temperatures.
• The vent fluids have high dissolved methane and hydrogen contents when compared to basaltic systems and these differences may have a major influence on the vent biota and metabolic turnover rates.
• In accordance with high hydrogen contents measured in the fluids diverse bacteria and archaea were identified which are using hydrogen for energy generation. In contrast, no known methane oxidizing species have been detected so far, although methane is a major component in the gas chemistry at Logatchev.
• Hydrothermal fluids also show distinct differences of outflow temperatures (up to 350°C at smoking craters, up to 300°C at the Irina II mound). Spatial and temporal microbial and metabolic variability on species level has been identified for hot as well as diffuse fluids exiting at different sites within the Logatchev hydrothermal vent field. So far no clear correlations between fluid chemistry and the variations of the microbial communities and metabolisms could be identified.
• Differences in the morphology of the vent structures and their geochemical and mineralogical composition are related to the different outflow temperatures as a

Cruise Report HYDROMAR V (04.12.07 – 02.01.08) l’Atalante
page ‐ 10 ‐
consequence of sub‐seafloor mixing and cooling processes and subsequent mineral precipitation.
Quest Irina II
“F”
Irina
“ ”B
Candelabra
Anna‐Louise“ ”A
scarp
hydrothermal crusts /talus of hydrothermal precipitates
pelagic sediment
mound structure
smoking crater
active / inactive smoker
diverse biological activity
bacterial mats
0 25 50 m
diffuse venting outside of the mainvent sites
ultramafic or mafic talus /occasionally bigger blocks
Legend
hydrothermal sediment /sediment with strong hydrothermal input
W 44°58.90’ W 44°58.85’ W 44°58.80’ W 44°58.75’ W 44°58.70’ W 44°58.60’W 44°58.65’
N 14°45.30’
N 14°45.35’
N 14°45.25’
N 14°45.20’
N 14°45.15’
N 14°45.10’
N 14°45.05’
N 14°45.00’ Fig. 1.2.2: Generalized geological map of the Logatchev‐1 hydrothermal field based on ROV operations.
Bathymetric and geological data from cruises M60/3, M64/2, MSM03/2, and MSM04/3. The high‐ and low‐temperature vent sites are situated in a narrow NW‐SE striking zone which might mark a fault zone. However, site “QUEST” is offset to the west probably along a cross‐cutting fault which is indicated by cracks with diffuse venting (Kuhn et al submitted).
The unique character of our studies at the Mid‐Atlantic Ridge since 2004 (under the auspices of DFG‐SPP 1144) stems from the fact, that at least three different hydrothermal field areas – Logatchev at 14°45’N, Turtle Pits, Red Lion, and Wideawake Mussel Field at 5°S, and Lilliput at 9°30’S – have been visited annually. This allows, as

Cruise Report HYDROMAR V (04.12.07 – 02.01.08) l’Atalante
page ‐ 11 ‐
the overall goal of our studies, the evaluation of a multitude of possible causes for the observed compositional differences and temporal variations of the emanating vent fluids and their effect on the vent communities. To approach this general goal, the following scientific questions for investigating the processes at the Logatchev vent sites have been defined for the cruise HYDROMAR V:
1. Are changes in hydrothermal activity related to the local tectonic and magmatic activity?
Local tectonic and magmatic processes and their evolution at 15°N on the MAR may influence the hydrothermal activity and also the vent ecosystem. Fluid pathways in the Logatchev hydrothermal system may be controlled by active faulting. A change of fault geometry due to local earthquakes may either close or open fluid pathways. This may have profound implications for fluid venting and the associated vent community. Such changes will be monitored by short‐ and long‐baseline tilt measurements with the help of high resolution pressure and tilt measuring stations (OBTP), developed in the second phase of LOLEM. They were deployed in 2006 and 2007 across a suspected fault within the Logatchev field which allows us to quantify uplift or subsidence.
In addition an improved seismicity monitoring station (OBA) serves as a proxy for temporal variations in magmatic activity. Enhanced magmatic activity and/or processes in the reaction and upflow zone (like ingress of seawater) can have a profound and rapid effect on phase separation, fluid chemistry and hydrothermal fluxes thereby influencing the vent ecosystems. Therefore, monitoring the local tectonic and magmatic activity and long‐term monitoring of environmental parameters such as temperature and pressure are needed to interpret changes in vent fluid chemistry.
The hydrothermal plume represents the output of the hydrothermal fields integrating the individual sources. Changes in the spatial distribution of the plume as well as changes in its physico‐chemistry are related to variations of the local hydrography and hydrothermal activity. Three dimensional mapping of the plume thus allows us to establish an inventory of the total hydrothermal flux to the water column which in turn may be related to tectonic and magmatic activity.
2. What are the causes of site‐specific variations of high‐temperature vent fluid chemistry and how do they affect biological communities?
The venting sites in the Logatchev hydrothermal field (smoking craters versus mounds) are characterized by differences in pH, Eh, temperature, in the abundances of dissolved major and trace metals and gases, and in varying macrobial and microbial communities. We hypothesize that these variations are related to the underlying fluid pathways, to differences in water/rock‐ratio during hydrothermal alteration, to phase separation, and to variable mixing ratios of seawater and upwelling hydrothermal fluid. Changes in the sub‐seafloor are believed to occur with time. As a consequence, the vent communities will also be affected in their composition and life cycles.

Cruise Report HYDROMAR V (04.12.07 – 02.01.08) l’Atalante
page ‐ 12 ‐
We want to document the imprint on fluid composition caused by the local tectonic and magmatic activity (see point 1.) by repeated visits and sampling of individual vent sites. Expected is original information that allow for deciphering sub seafloor processes from fluid characteristics.
3. What are the small‐scale, vertical physico‐chemical variations of diffuse, low‐temperature fluids and how do they affect zoology and microbiology?
The vent biota is fuelled by diffuse outflows of hydrothermal fluids at low to moderate temperatures. While the focus of previous cruises has been on the investigation of horizontal gradients in vent fluids, this cruise will, for the first time, examine small‐scale vertical gradients in vent fluids and their influence on the vent organisms. At sites with diffuse venting, organisms closest to the venting source experience higher concentrations of reduced compounds such as methane and sulphide than those further away from the outflow source. Sites where vertical gradients are assumed to play an important role are sediment‐bearing areas covered by bacterial mats and mussel beds. At these sites, we plan to examine the vertical gradients in vent fluids using established ex‐situ analyses of chemical and isotopic composition. These sampling techniques have improved with each HYDROMAR cruise and will ensure that the composition of the vent fluids can be investigated at a scale relevant to the microorganisms and animals that occur at Logatchev.
A combined approach of i) genetic analyses based on 16S rRNA gene and functional gene diversity, ii) metagenome analysis as well as iii) in‐situ and iv) ex‐situ cultivation experiments will provide details to fully characterize the site‐specific differences in diversity and function of chemosynthetic microbial communities. Furthermore, metabolic capabilities of those organisms that are numerically and functionally important with respect to the coupling of microbiology and geochemistry will be studied. More specific investigations will center on those organisms involved in methane, hydrogen and sulphide turnover. Applying geochemical, microbiological and molecular approaches, we plan to identify and quantify respective processes in free‐living and symbiotic microorganisms.
4. What are the compositional differences in fluid chemistry and vent biota between the Logatchev hydrothermal field and the hydrothermal vent sites at the southern MAR in relation to different host rocks, water depth, and presence of phase separation?
In addition to temporal and site‐specific variations in fluid and gas chemistry as well as vent community structures observed on different scales at Logatchev, equally distinct differences in these parameters exist between the Logatchev hydrothermal field and the hydrothermal vent sites at the southern MAR at ~5° to ~10°S (MARSÜD). Marked differences in the overall geological and environmental framework characterize these two areas, such as pertinent host rocks (ultramafic at Logatchev versus basaltic at 5°S) and prevailing water depths (3000 m at Logatchev and 5°S versus 1500 m at 9°33’S).

Cruise Report HYDROMAR V (04.12.07 – 02.01.08) l’Atalante
page ‐ 13 ‐
Repeated visits to the Logatchev field over four years and the examination of its variability in different scales will give a profound understanding of this system. As a similar detailed investigation will be performed at the hydrothermal fields on the southern MAR (cruises M64/1, M68/1 and Atalante Leg‐1), this will allow a better comparison of the two major target areas of the SPP 1144. A final comparative interpretation of environmental, geological, fluid chemical and biological data will undoubtedly result in a comprehensive understanding of respective processes at these MAR sites and a quantification of the energy, material and life cycles at mid‐ocean ridges in more general terms.

Cruise Report HYDROMAR V (04.12.07 – 02.01.08) l’Atalante
page ‐ 14 ‐
1.3 Daily Narrative
Tuesday, Nov 27th
The majority of the ROV team (Pieper, Meier, Hinz, Witkiewicz, Foster, and Suck) and the chief scientist (Petersen) arrived in Toulon.
Wedenesday, Nov 28th
The ROV team and the chief scientist embarked onto the Atalante (IFREMER at La Seyne Sur Mer) at 08:00 in the morning in order to oversee the arrival of the nine containers with equipment. The trucks all arrived in time and were unloaded until 14:00 in the afternoon. The first containers were unpacked and/or loaded onto the ship. The ROV‐team immediately began mobilisation of the ROV. Custom clearence for the containers was given at 16:00. A group of 4 scientists (Buller, Koy, Perner, Westernstroer) arrived in the evening for the mobilisation taking place the following days.
Thursday, Nov 29th
Begin mobilisation of the science labs. The 4 containers with scientific equipment were unloaded on the pier or on the deck and the boxes distributed to the various labs. In the afternoon Dan Cormany, one of the ROV pilots arrived. One truck with OBS‐instruments from Kiel arrived and and was assembled by Martin Hansen from KUM.
Friday, Nov 30th
Continue mobilisation of the science labs and the ROV. Eight containers (5 ROV and 3 science) went on board the vessel, one container was returned to Bremen empty. The last container spot available was filled with the french „isotope container“ which was transferred from the vessel Purqui Pas together with the new lift line for the ROV. In the afternoon, all equipment was transferred onto the vessel.
Saturday, Dec 01st
Continue mobilisation of the science labs and the ROV. The ROV mobilisation is finalized and the ROV prepared for the harbour test. Five people from Genavir and IFREMER are on board as observers and will also be on board for the sea trials. Harbour test was performed between 16:00 and 19:00 and the system was OK. The coordinator of the ROV‐team (Thomas Kuhn) arrived in the early evening.
Sunday, Dec 02nd

Cruise Report HYDROMAR V (04.12.07 – 02.01.08) l’Atalante
page ‐ 15 ‐
The 4 releaser for the OBS are tested in the morning in a water depth of 2000m and worked fine. Due to an increase in wind speed to 4 bft and increasing wind speeds throughout the day we decided to move the vessel closer to the shore line. The seatrial for the ROV took place in water depths of ~ 700m. During the seatrial the ROV descended to 727m and reached bottom. Handling was trained with all floats and proved to be no problem at the conditions encountered. In the evening the wind picked up again. Observers from IFREMER and Genavir were braught ashore using the ships zodiac.
Monday, Dec 03rd
Seatrials were continued with several deployments and recoveries of the ROV. The wind picked up to 7 bft, but 2 deployments were possible because of the shelter of the coast. Around 11:30 the Atalante set sail and returned to La Seyne Sur Mer. The majority of the scientists arrived in the evening.
Tuesday, Dec 04th to Dec 15th
In Transit to the Logatchev site. Time is used to finalize the lab setup. Several talks provide background information on the work done during previous cruises to the Logatchev field.
Sunday, Dec 16th
In the morning we arrive at our first target position to take a background CTD in water depths of 5300 m. Three attempts to lower the CTD fail because of communication failures (ATA01CTD, ‐02CTD, ‐03CTD). The station is abandoned and, since the repair will take several hours, we proceed to the Logatchev site, where 4 ocean bottom seismometers are deployed in a diamond shape (ATA04OBS, ‐05OBS, ‐06OBS, ‐07OBS). The following night is used for a tow‐yo (ATA08MAPR) using the gravity corer weight and 5 MAPR units to identify the extent of the hydrothermal plume.
Monday, Dec 17th
The first scientific ROV dive (station ATA09ROV) is deployed despite winds up to 28 knots and seas of 3m. During the dive an ocean bottom pressure sensor and an ADCP are deployed and one OBT recovered. Due to weather conditions recovery is in daylight. Night program consists of three CTD stations (ATA10CTD, ‐11CTD, ‐12CTD). One taking a profile at the proposed location of the long (720m) profiling mooring. Station ATA12CTD is used to collect a large volume of water for metagenomic studies.
Tuesday, Dec 18th

Cruise Report HYDROMAR V (04.12.07 – 02.01.08) l’Atalante
page ‐ 16 ‐
The second ROV deployment is again delayed because of the difficult wind and sea state conditions. This dive (ATA13ROV) is intended to sample hot fluids from the smoking craters to the south. Two sites are sampled: site “A” and “Anna Louise”. Maximum temperatures at the sites are 317°C for site “A” and 353°C at Anna Louise. Again the recovery is in daylight due to weather conditions. The night is used for a long tow‐yo (ATA14CTD) passing just north of the Logatchev hydrothermal field.
Wednesday, Dec 19th
The next day is again used for a ROV‐dive (ATA15ROV), this time devoted to sampling of diffuse fluids at Quest. The OBA is deployed west of the Quest crater in an area of intense sediment cover. The second tow‐yo station (ATA16CTD), targeted to the south of Logatchev, is perfomed during the night.
Thursday, Dec 20th
The tow‐yo ended at 07:00. The fourth ROV dive (station ATA17ROV) was used to sample hot fluids at site “B” and Irina 1. At site “B” the KIPS system showed temperatures of 363°C at smoker B4. Even higher temperatures were measured at the same smoker by using the 8‐channel temperature sensor. The lowermost sensor measured temperatures of 446°C ± 5°C which needs to be confirmed. Site „B was chosen as the site to deploy a temperature sensor (Smoni) for one year in order to monitor temperature changes over time. The second site visited during this dive was site “Irina 1”. Here the KIPS systems measured an exit temperature of 375°C at smoker I3, much higher tha any previous temperature measurement at the Logatchev hydrothermal field. The 8‐channel T‐sensor was deployed vertically in the bottom of the pit at Irina 1 and measured temperatures well above 400°C by inserting the probe the probe between cpy‐lined small (1 cm) outlets. During the night 3 CTD stations (ATA18CTD, ‐19CTD, and ‐20CTD) were deployed around the Logatchev field, one of these to sample ambient seawater for metagenomic studies.
Friday, Dec 21st
The ROV station ATA21ROV is used to sample diffuse fluids and mussels from the area of T‐loggers in the musselbed near Irina 2. The temperature loggers are also collected and aided by vertical temperature profiles with the 8‐channel T‐sensor. Additionally, push cores were taken at “Anyas Garden” for metagenomic studies. Since the work program for this dive was extensive we have a late recovery without any problems. The reminder of the night is used for 2 CTD‐stations (ATA22CTD, ‐23CTD) adding to the profile lines for plume studies.
Saturay, Dec 22nd

Cruise Report HYDROMAR V (04.12.07 – 02.01.08) l’Atalante
page ‐ 17 ‐
The next ROV dive (ATA24ROV) is used to deploy an Ocean Bottom Tiltmeter and to recover another one of these instruments. Sampling of hot fluids at „Irina 2“ and „Quest“ ist the second major task during this dive. Another Smoni is deployed, this time at site „Irina 2“, with a sampling rate of 1 sec in order to monitor the vent temperature for the reminder of the cruise. The Smoni is to be collected on one of the last dives (due to the early end of the station work, see below, this T‐logger is still at the seafloor). Again two CTD stations (ATA25CTD, ‐26CTD) are used to extend the proposed N/S profile across the Logatchev hydrothermal field.
Sunday, Dec 23rd
Station ATA27ROV is devoted to work on diffuse hydrothermal sites in the vicinity of the Quest smoking crater. Extensive temperature measurements using the 8‐channel T‐sensor accompanied by mussels sampling is undertaken. Fluid sampling with the KIPS system is another part of the work program during this dive. At the end of the dive an Ocean Bottom Pressuremeter is recovered. One CTD station (ATA28CTD) is used for an LADCP‐profile, while the last station of the night (ATA29CTD) is again for filtering microbial material for metagenomic studies of the bottom water.
Monday, Dec 24th (Joyeux Noel, Merry Christmas, Fröhliche Weihnachten)
The following day sees another ROV dive (ATA30ROV) aimed at taking hot fluid samples. This time we sample site „B“ and Candelaber where exit temperatures of up to 364°C might again indicate an increase in vent temperatures. During this dive all three temperature probes are used at the same edifice. After the dive, intense testing of the t‐logger instruments (KIPS; Smoni, 8‐channel sensor) was performed, and it seems, that the 8‐channel sensor is not suitable for measuring the gradients within black smokers. See chapter on geophysics (chapter 1.4.5). While taking fluid samples at the seafloor, the seaman Laurent F’loch suffers a heart attack. The captain is on the telephone line with doctors in Toulouse and it is decided that he needs to be braught ashore immediately. The stationwork ends at 16:36 with the recovery of the ROV. The Atalante is starting her transit towards Cayenne in French Guayana, the closest port from Logatchev.
Tuesday, Dec 25th to Thursday, Dec 27th
In Transit to Cayenne. At 06:30 in the morning of Dec. 27th Laurent is picked up by a pilot‐boat and transferred to Cayenne. We wish him all the best! The Atalante is beginning its journey towards Recife, which, because of the strong counter currents will take us into Recife on January 2nd, 2008, actually as planned.
Friday, Dec 28th to Tuesday, Jan 01st
Scientists are preparing the cruise report. The labs are cleaned for the next scientific party, also belonging to the SPP 1144. Most working groups only interchange personel,

Cruise Report HYDROMAR V (04.12.07 – 02.01.08) l’Atalante
page ‐ 18 ‐
however, a few instruments have to be uninstalled in preparation for their arrival. A baptizing ceremony is held on December 31st for crew and scientists alike.
Wednesday Jan 02nd
The vessel arrives in Recife around 14:00 LT and the pilot is getting us into port at 15:00. The majority of the scientists and several ROC crew members disembark the next day, whith the new research team arriving on January 5th for the second cruise in the framework of the SPP1144.

Cruise Report HYDROMAR V (04.12.07 – 02.01.08) l’Atalante
page ‐ 19 ‐
1.4 Preliminary Results
1.4.1 Oceanography (by Martin Vogt, Claudia Denker, and Uwe Koy)
During this cruise a total of 15 CTD‐casts and 2 TOW‐YO’s were done between December 16th and 24th, 2007. During the first CTD‐ communication failures happened and we had to change the entire CTD. The first complete profile was made December 17th, 2007. The first TOW‐YO took place over the night from 18th to the 19th of December. During this transect the second conductivity sensor broke down. It was changed for the next profile. For this cruise our CTD was packed with two temperature, two conductivity and two oxygen sensors. Additionally, a transmission sensor, to detect the plume, was deployed. Next to this we measured the current velocities with two 300kHz lADCP’s. To correct the position of the CTD itself we fasten a releaser, who is able to work with Posidonia, at the CTD frame. With its help we expect more precise measurements of the lADCP’s.
Fig. 1.4.1.1: Map of CTD‐ and tow‐yo stations (blue; green symbols indicate stations performed on earlier cruises; magenta symbols indicate stations that were planned, but could not be done during this cruise).

Cruise Report HYDROMAR V (04.12.07 – 02.01.08) l’Atalante
page ‐ 20 ‐
CTD‐casts
The CTD‐casts showed only little lateral variation in salinity and potential temperature. Of main interest were the water samples and the data from the LADCP. The most important observation during this cruise is enormous variability of the location of the plume with time. At two sites we deployed the CTD 3 times in order to document tidal variability. Figure 1.4.1.2 shows the position, potential temperature, salinity and transmission data for the stations ATA‐10 CTD and ATA‐12 CTD taken at the same position as the planned MMP‐Mooring, but with 10 hours in between. The plume is clearly visible in both cases in the transmission sensor. Salinity and potential temperature also show variations in the area of the plume, the water seems to be colder and less saline than that above and below. It is remarkable to see a depth difference of ~300m in the maximum plume extent between the two stations. The LADCP data also showed variations between the two casts. In other stations, where a Plume was measurable, salinity and potential temperature stayed constant throughout the plume, and started to change again after the CTD was below the plume.
Fig. 1.4.1.2: position and profiles of potential temperature, salinity and transmission of station ATA10CTD (left) and ATA12CTD (right) below 2200m. Note the depth change of the plume maximum.
Cruise Report HYDROMAR V (04.12.07 – 02.01.08) l’Atalante
page ‐ 21 ‐
The LADCPʹs worked quite good, however, postprocessing of the data is required before interpretation is possible. It seems evident, that the tides are really strong in the area. The shift in the direction of the near‐bottom flow of nearly 180° between station ATA‐10 CTD and ATA‐12 CTD can be used as an example. At last there were some trys to compare the track of the CTD calculated by the LADCP‐processing routines with the Posidonia data from the CTD. But the data we got from Posidonia had too much spikes so that this maybe has to be done at home.
Tow‐yo’s
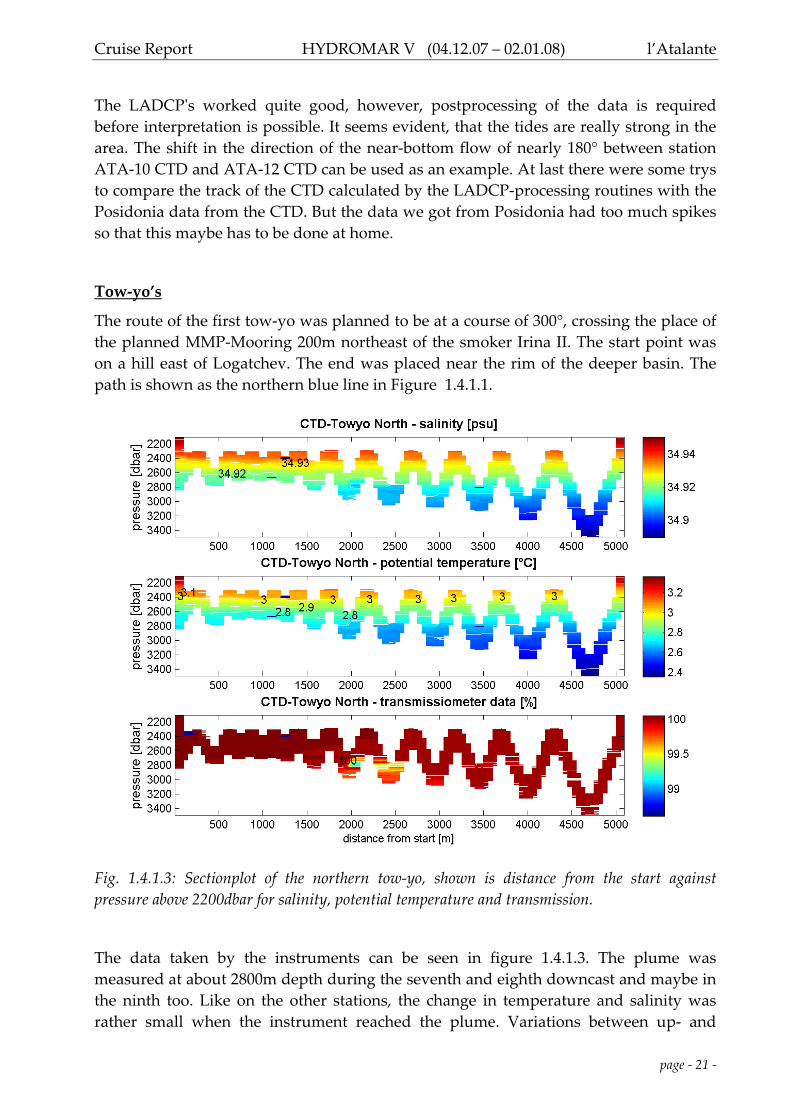
The route of the first tow‐yo was planned to be at a course of 300°, crossing the place of the planned MMP‐Mooring 200m northeast of the smoker Irina II. The start point was on a hill east of Logatchev. The end was placed near the rim of the deeper basin. The path is shown as the northern blue line in Figure 1.4.1.1.
Fig. 1.4.1.3: Sectionplot of the northern tow‐yo, shown is distance from the start against pressure above 2200dbar for salinity, potential temperature and transmission.
The data taken by the instruments can be seen in figure 1.4.1.3. The plume was measured at about 2800m depth during the seventh and eighth downcast and maybe in the ninth too. Like on the other stations, the change in temperature and salinity was rather small when the instrument reached the plume. Variations between up‐ and

Cruise Report HYDROMAR V (04.12.07 – 02.01.08) l’Atalante
page ‐ 22 ‐
downcasts are also visible. They are believed to be due to the fact that the instruments are on the bottom of the rosette. No significant variations in the depth of the isolines of salinity and temperature are visible.
The second tow‐yo was along 14° 44.88ʹ N, heading from east to west in the south of Logatchev (the southernmost blue line in Fig 1.4.1.1). In the transmissiometerdata in figure 1.4.1.4 it can be seen, that the plume was measured again in the middle of the tow‐yo. It seems to be stronger and wider but deeper than the northern plume. In the deep area where the plume was measured variations in salinity and potential temperature are apparent, which can again be the result of the CTD sitting in the bottom of the rosette.
Fig. 1.4.1.4: Sectionplot of the southern tow‐yo, shown is distance from the start against pressure above 2200dbar for salinity, potential temperature and transmission.
Oxygen concentrations O2 concentrations [ml/L] were determined for 5 depths of ATA‐10 CTD and 2 depths of ATA‐11 CTD as well as 4 low‐temperature diffuse and 1 hot hydrothermal fluid. Oxygen concentrations were determined by M. Perner and T. Meier. Methods used for determination of dissolved oxygen are described in the fluid chemistry section (chapter 1.4.6).

Cruise Report HYDROMAR V (04.12.07 – 02.01.08) l’Atalante
page ‐ 23 ‐
0500
100015002000250030003500
0 1 2 3 4 5 6 7O2 concentration [ml/L]
dept
h [m
]
ATA-CTD10ATA-CTD11
Fig. 1.4.1.5: Concentra‐tions of dissolved oxygen (ml/L) at different depths for CTD10 and CTD11.
This data has not been compared with the data from the CTDʹs two oxygen sensors in detail. This calibration has to be done back in Kiel.
During the first dive we deployed an ADCP (IFM‐GEOMAR, Kiel) on a tripod next to the small black smoker at Irina 2 and measured the current profile and the acoustic backscatter for a duration of 7 days. This record documents the variability of the bottom currents and clearly shows the changes in plume direction at Logatchev (see Fig. 1.4.1.6). This data needs to be further processed in the home institute
Fig. 1.4.1.6: Selected ADCP data record near the Irina 2 site on December 22nd showing evidence for tidal changes affecting plume direction. The upper panel shows the acoustic backscatter, while the lower panels show the vertical velocity and temperature measured by a sensor on the ADCP.

Cruise Report HYDROMAR V (04.12.07 – 02.01.08) l’Atalante
page ‐ 24 ‐
1.4.2 Plume mapping with MAPR (by Herwig Marbler and Nico Augustin)
Hydrothermal plumes above mid‐ocean ridges integrate the thermal and chemical output from hydrothermal vent systems, which are very important for the marine geochemical budget (e.g. Lilley et. al., 1995). In order to determine the horizontal expansion and vertical structure as well as the temporal variation of the generated hydrothermal plume above the Logatchev vent field a plume mapping was carried out. Measurements of the hydrothermal signatures in the water column include temperature, turbidity density as well as the redox potential (Eh) in the water column. The extension and structure of the hydrothermal plume is a function of the temperature and the amount of the emanated fluid and particles, the strength and direction of the deep‐sea current and the morphology of the seafloor.
Methods and measurements
Miniature Autonomous Plume Recorder (MAPR) are self‐contained instruments, which record data at pre‐set time intervals from temperature (resolution 0.001°C), pressure (0 ‐ 6000 psi gauge sensor), and nephelometer sensors (Sea Tech Light Backscatter Sensor, LBSS; Baker and Milburn, 1997; Baker et al., 2001). One of the five MAPR’s includes also an Eh (redox potential) sensor provided by Dr. Nakamura (Tsukuba, Japan; Fig. 1.4.2.1). The instruments were attached to the hydrographic wire around 20 m above the CTD or at the frame of the CTD rosette.
Fig. 1.4.2.1: MAPR mounted on a hydrograph wire (left) with sensors (right): nephelometer LBSS (A), temperature (B), Eh (C), and density (D), instrument from Dr. Edward Baker at NOAA Institution, Seattle USA. Eh‐sensor from Dr. Nakamura, Tsukuba, Japan.
All together 13 stations with MAPR deployment in the water column were carried out during the cruise (Table 1): 10 hydrocast stations were conducted as one‐point measurements with CTD probe (see chapter 4.1) combined with 1 or 2 MAPR’s. Three so‐called “tow‐yo’s” were performed in defined tracks over the vent field (see figure 4.1.2.1): one S‐N track with fife MAPR’s nominally arrayed between 20 and 250 m above a dummy, and two E‐W tracks with one MAPR on the CTD frame.

Cruise Report HYDROMAR V (04.12.07 – 02.01.08) l’Atalante
page ‐ 25 ‐
Fig. 1.4.2.2: Bathymetric map of the Logatchev area with the LHF1, LHF2, LHF3 and LHF4 fields and with the tracks of the tow‐yo deployments.
At 7 CTD stations water samples were taken from different levels of the water column with a CTD rosette of 22 10L‐Niskin bottles for further chemical analyses of dissolved Fe and Mn in the home laboratory of the Jacobs University Bremen. For the production of the profile plots of turbidity and Eh (Figs. 1.4.2.3 and 4) an interpolation of the water column measurements with the Golden Software product Surfer was carried out. Kriging was chosen as the gridding method for high‐density measurement points (turbidity and Eh).
Table 1: MAPR Stations (mostly attached on the CTD – apart of 08 MAPR), with samples taken with CTD rosette from different water depths (different levels of the hyrothermal plume).
Station description Long/Lat (start) / (end) CTD MAPR’s Samples
08 MAPR Tow‐yo 14°42.0ʹN/44°58.07ʹW / ‐ 5 ‐ 14°47,72ʹN/44°59,07ʹW 10 CTD station 14°45.26ʹN/44°58.71ʹW 1 2 13 14 CTD Tow‐yo 14°44.69ʹN/44°57.65ʹW / 1 1 10 14°46.07ʹN/45°00.12ʹW 16 CTD Tow‐yo 14°44.88ʹN/44°57.65ʹW / 1 1 10 14°44.88N/45°00.25ʹW 18 CTD station 14°50.97ʹN/44°58.80ʹW 1 1 6 19 CTD station 14°45.27ʹN/44°58.74ʹW 1 1 4 20 CTD station 14°38.96ʹN/44°58.81ʹW 1 1 ‐ 22 CTD station 14°48.00ʹN/44°58.80ʹW 1 1 ‐ 23 CTD station 14°43.01ʹN/44°58.76ʹW 1 1 ‐ 25 CTD station 14°46.00ʹN/44°58.81ʹW 1 1 8 26 CTD station 14°47.00ʹN/44°58.81ʹW 1 1 ‐ 28 CTD station 14°46.00ʹN/44°58.80ʹW 1 1 10 29 CTD station 14°45.97ʹN/44°58.80ʹW 1 1 ‐

Cruise Report HYDROMAR V (04.12.07 – 02.01.08) l’Atalante
page ‐ 26 ‐
Results
Above and in the vicinity of the Logatchev Hydrothermal Field turbidity plumes in two depths were observed by MAPR measurements. One intrudes the water column between 2620 m to 2800 m water depth and a second one was found between 2850 m and 2980 m (Fig. 5). The latter is only observed in the close vicinity of LHF. In the LHF the hydrothermal plume is elongated in a NNW‐SSE direction (Figs. 1.4.2.3 and 1.4.2.4), following the orientation of the vent sites (Kuhn et al., 2004) and of the ridge axis. The turbidity plume was observed in water depths between 2550 and 3000 m by MAPR measurements. The strongest plume signals (turbidity and Eh) from the lower and intermediate plume layer occur in the close vicinity of LHF. The horizontal and vertical extent of the plumes in the water column could be detected by the observation of turbidity and redox potential (Eh). The along‐valley tow‐jo track (08 MAPR) crossed the latitudes of LHF3 and LHF1 (Figs. 1.4.2.3 and 1.4.2.4), and shows clearly the turbidity anomaly in the effluent layers and the Eh anomaly in the “core” of the plume above the Logtachev hydrothermal field.
Fig. 1.4.2.3: Anomalies of turbidity and Eh along a south‐north orientated tow‐yo track (08 MAPR) across the LHF3 and LHF1 and the recorded Eh measurements over the distance of the track.

Cruise Report HYDROMAR V (04.12.07 – 02.01.08) l’Atalante
page ‐ 27 ‐
Fig. 1.4.2.4: Anomalies of turbidity and Eh along an east‐west orientated tow‐yo track with the recorded Eh measurements.
The profile plot of figure 1.4.2.4 shows a clear elongation in S‐W direction of the turbidity plume in the area of the LHF. Especially an extension to the south, in the area of LHF3 could be observed. This might be the effect of a north‐south directed deep‐sea current and/or an influence from LHF3. However, no Eh anomaly, which would be a clear evidence of a further active vent field, could be detected in the area of LHF3. At a distance of about 4 km south from the vent source at LHF 1 almost no turbidity plume could be detected in the water column. The east‐west cross‐section in figure 5 reveal only a small drift of the hydrothermal plume in the water column with a clear Eh anomaly.
Data from the profile plots (Fig. 1.4.2.5) shows, that the Plume is stratified in up to three layers were the strongest turbidity signal from the intermediate layer appear between 2680 m to 2850 m water depth and from the lower plume layer the highest turbidity were found between 2800 m and 3000 m. The strongest Eh anomaly in the area of the Logatchev vent field is in the intermediate plume level in water depths between 2650 and 2850 m. In this level also the largest time variations were observed. Measurements after three hours at the same coordinates show that the intermediate plume level becomes blurred and pushed in deeper waters cause by deep‐sea currents and uncontinuous fluid emanation from the vent field. The turbidity and especially Eh anomaly getting smaller with increasing distance to the source, due to continued mixing and diffusion processes.

Cruise Report HYDROMAR V (04.12.07 – 02.01.08) l’Atalante
page ‐ 28 ‐
Fig. 1.4.2.5: Profiles of the water column 200 m NE the LHF1 at the same station from CTD 28 (a), and 29 CTD (b) recorded at 03:00 UTC and at 06:00 UTC at the same night.
Caused by the high temperature (up to 375°C) of the hydrothermal fluid (see chapter 1.4.6), the hydrothermal fluid and the blend seawater have an elevated temperature and a reduced density, which rises the plume to an altitude of maximal 400 m above the LHF before attaining a level of neutral buoyancy. The dominant process leading to the increased turbidity within the plume is the rapid Fe(II) oxidation to Fe‐oxides and Fe‐oxihydroxides and the continuous formation of colloids and particles. The highest concentrations of particulate phases were found in the core of the plume between 2700 and 2800 m water depth. This is related to the high iron concentrations in the hydrothermal fluid at the vent site with up to 246 ppm Fe. With increasing distance from the hydrothermal vent, larger particles will be lost from the plume by gravitational settling and the precipitation of iron‐rich sediments on the seafloor. Thus the vanishing of the turbidity plume in the distance of 3‐4 km from the vent site could be explained by the increasing dilution with ambient seawater and by sinking of Fe‐oxides, Fe‐oxihydroxides as well as Mn‐oxides together with associated “scavenged” elements (e.g. German, 1990).
1.4.3 Gas Chemistry (by Robin Keir, Peggy Wefers, and Saskia Buller)
During the L’Atalante cruise, methane and hydrogen were measured on board using gas chromatography. These gases are produced by several processes in hydrothermal systems. In the Logatchev field, it appears that serpentization of ultramafic rocks plays an important role in their production. Primoidal 3He, which is extracted into circulating hydrothermal fluid from cooling basalt, will be measured in the shore‐based isotope laboratory at the University of Bremen. In addition, the stable carbon isotope ratio of methane from the fluid samples will be measured in an isotope laboratory at IFM‐GEOMAR. The water samples for these analyses were collected from 9 CTD stations

Cruise Report HYDROMAR V (04.12.07 – 02.01.08) l’Atalante
page ‐ 29 ‐
and 7 ROV dives. The latter collections were mostly done using the KIPS device described in chapter 1.4.6. In addition, our group contributed to incubation experiments on bacteria‐innoculated fluids conducted by M. Perner by monitoring the hydrogen concentration of the head space gas.
Methods
In order to analyze dissolved CH4 and H2, the fluid samples were degassed with a modified version of the method described by Lammers and Suess (1994) and Rehder et al. (1999). The separation of the gas and liquid phases is accomplished by drawing the water sample directly into a pre‐evacuated flask, which is then only filled to about one to two thirds of the total flask volume. In the case of seawater collected by the CTD‐rosette, about 1600 ml was drawn into pre‐evacuated 2200 ml glass bottles. During this sampling, most of the dissolved gas (over 90%) exsolves into the remaining headspace. The amount of water taken was measured with a flow meter (Engolit Flow Control 100S/Typ DMK). The extracted gas phase is subsequently recompressed to atmospheric pressure and transferred to a gas burette. The mole fraction of CH4 and H2 are determined by gas chromatography on two aliquots of this gas. For the determination of dissolved CH4 a Shimadzu GC14A gas chromatograph equipped with a flame ionization detector was used in connection with a Shimadzu CR6A Integrator. Nitrogen was used as carrier gas, and separation was performed using a 4m Porapack column run isothermally at 50 °C. In addition to the vacuum‐extracted gases, methane was also determined on about 30 seawater samples using a headspace method. In this case, about 1 ml helium gas was added to a 20 ml water sample in a closed vial, which was then allowed to equilibrate for a few hours. 100 μl of the headspace gas was then injected into the gas chromatograph.
The H2‐concentration of the extracted gas was determined using a TRACE Ultra gas chromatograph (Thermo Electron) equipped with HaySep Q, and Molecular Sieve 5 A columns. Helium was used as carrier gas. The run was performed isothermally at 50 °C. The eluted gas was detected via a PDD (pulsed discharge detector). The remainder of the gas is then transferred to an evacuated 20 ml vial, and the septum is sealed on the outside with silicone and on the inside with about 4 ml of degassed saturated salt solution. CTD samples are listed in Table 1.
The sampling of the KIPS from the ROV was conducted in a fashion similar to that of sampling the Niskin bottles on the CTD‐Rosette. In this case, either about 350 ml of fluid was drawn into an evaculated 500 ml bottle, or about 100 ml was drawn into a 250 ml bottle in the case of black smoker fluid. The results we obtained with the KIPS sampler are generally lower than those at the same sites using the titanium (MAJOR) samplers on Merian cruise 04/3. One fluid sample was obtained on the L’Atalante cruise with a MAJOR. However; during the sampling the Luerlok tubing did not remain tight. ROV samples are listed in Table 2.

Cruise Report HYDROMAR V (04.12.07 – 02.01.08) l’Atalante
page ‐ 30 ‐
He isotope measurements will be performed at the IUP, section of Oceanography, at the University of Bremen with a fully automated UHV mass spectrometric system (for details see Sültenfuß et al. 2004).
Preliminary Results
CTD stations taken near the vent field exhibited hydrogen concentrations up to about 2000 nmol/L and methane concentrations up to about 450 nmol/L. In contrast, on the far side of the rift valley, about 10 kilometers to the west of Logatchev, only a trace of the methane plume with a maximum concentration of about 2 nmol/L remains. The hydrogen and methane concentrations are reasonably well correlated at about a 5 to 1 mole ratio (Figure 1.4.3.1). This ratio is the same as that observed on Merian cruise 04/3 to the Logatchev area in February 2007. The highest concentrations were observed during the tow‐yo casts and just to the north of the vents at Station 28‐CTD. Profiles of methane and hydrogen at this station exhibited three maxima between about 2700 and 3000 meters depth (Figure 1.4.3.2 and 1.4.3.3).
Table 1.4.3.1: Sample list for CTD‐stations
Station Long. W / Lat. N. CH4 �13CH4 H2 He
10‐CTD 44° 58.7 / 14°45.3 19 19 19 19 11‐CTD 45° 05 / 14° 45 20 20 20 5 12‐CTD 44° 58.7 / 14° 58.7 3 3 3 ‐ 14‐CTD Tow‐yo 20 20 20 ‐ 16‐CTD Tow‐yo 20 20 20 20 18‐CTD 44° 58.8 / 14° 51.0 18 18 18 21 20‐CTD 44° 58.8 / 14° 45.3 19 19 19 21 22‐CTD 44° 58.8 / 14° 48.0 17 17 17 21 25‐CTD 44°58.8 / 14° 46.0 17 17 17 14 28‐CTD 44°58.8 / 14° 46.0 19 19 19 ‐
Table 1.4.3.2: Sample list for ROV‐stations
Station CH4 �13CH4 H2 He 13ROV 3 3 3 15ROV 1 1 1 17ROV 5 5 5 2 21ROV 3 3 3 24ROV 5 5 5 1 27ROV 1 1 1 30ROV 2 2 2

Cruise Report HYDROMAR V (04.12.07 – 02.01.08) l’Atalante
page ‐ 31 ‐
Fig. 1.4.3.1. Hydrogen versus methane concentration in water column samples collected by the CTD‐rosette.
Fig. 1.4.3.2. Dissolved methane versus depth at station ATA28CTD.
Methane and hydrogen values measured on the fluid vent samples from the KIPS were generally lower than those collected at the same sites with the titanium MAJOR sampler on Merian 04/3. We also did not observe a correlation between methane and hydrogen in these samples as we did on the previous Merian cruise (Figure 1.4.3.4). We believe

Cruise Report HYDROMAR V (04.12.07 – 02.01.08) l’Atalante
page ‐ 32 ‐
that this may be because the KIPS sampler, which is designed to sample for trace metals without contamination, is not gas tight, even at atmospheric pressure. Thus some of the dissolved gas may be lost after collection of the fluid sample, during ascension of the ROV. In addition, gas exchange with the air takes place once the KIPS sampler is brought on board.
Fig. 1.4.3.3. Dissolved hydrogen versus depth at station ATA28CTD.
0,00
500,00
1000,00
1500,00
2000,00
2500,00
0,00 50,00 100,00 150,00 200,00 250,00 300,00 350,00 400,00 450,00
CH4, µmol/L
H2, µ
mol
/L
Fig. 1.4.3.4: Hydrogen versus methane concentration in μmol/L of fluid samples taken during the ROV dives.

Cruise Report HYDROMAR V (04.12.07 – 02.01.08) l’Atalante
page ‐ 33 ‐
1.4.4 Logatchev Longterm Environmental Monitoring – LOLEM (by Marcus Fabian and Bernd Heesemann)
Overview
Main part of project LOLEM is monitoring of environmental parameters, which are sea floor tilt, sea floor acceleration, absolute sea floor water pressure, the vertical bottom water temperature profile, Black Smoker outflow temperature and temperatures in mussel fields at the Logatchev Hydrothermal Vent Field (LHF).
The long‐term data is essential for assessing local changes in environmental conditions, which might bias the development of biological communities and also the flow patterns in the fluid regime, but are, moreover, important to study local sea floor deformations and mass movements at the sea floor, tectonics, strong sea floor motions and hydrothermally forced flux in the upper subsurface and through vents to the ocean. The data therefore provides boundary values for biology, fluid chemistry, geology and hydrology.
Long‐term observation instruments, which were adapted for deployment at the LHF are two Ocean Bottom Tiltmeters (OBT; Fabian & Villinger, 2007, Fabian & Villinger, submitted), an Ocean Bottom Accelerometer (OBA), two Ocean Bottom Pressure meters (OBP), two 25m‐Moorings for monitoring of the vertical bottom water temperature profile, high temperature Smoker Monitoring Devices (Smoni), and 20 miniaturized single channel temperature loggers (MTL, Pfender & Villinger, 2002), which are individual sensors embedded in a T‐handle housing, and four 8‐channel temperature loggers for short‐line temperature profile measurements in mussel fields at vent sites “Irina 2” and “Quest”. Additionally, a ROV‐based 8‐channel temperature probe for in‐situ measurements with real‐time data transfer to the ship was brought in.
Cruise Hydromar V with RV “L’Atalante” and ROV “Kiel 6000”
Continuation of long‐term monitoring was one main objective for project LOLEM. Another important aim for the SPP was the installation of one SMoni and two 25m‐Moorings at an active smoker at site “B“ to assess, in combination with a 700 m Mooring of IFM‐GEOMAR, energy flux through vents. Recovery, upgrade/repair and re‐deployment of the installed ocean bottom instruments OBT 1, OBT 2, OBP 2, Mooring 2 and the MTL in mussel fields, which were deployed during cruise MSM04/3 of RV “Maria S. Merian”, was necessary. The repaired instruments Mooring 1 and 8‐channel temperature loggers, which recorded data during the first deployment after cruise M64/2 of RV “Meteor” (Lackschewitz et al. 2005) should be re‐deployed and the new OBA had to find its place at the LHF.
Most of the recovered instruments successfully recorded data as expected. However, various MTL were damaged by hot fluids or had hairline cracks in their housings of unknown origin and lost their data. The old OBT 1 had a leakage in its deep sea cable, so that data is available but mostly corrupted. Figure 1.4.4.1 provides an overview of the available data and of the schedule until the last cruise in 2009.

Cruise Report HYDROMAR V (04.12.07 – 02.01.08) l’Atalante
page ‐ 34 ‐
Fig. 1.4.4.1: Overview of long‐term data of project LOLEM. Grey blocks mark available data, crosses good data and a minus sign marks corrupted data. Brackets with a cross mark expected data from recently active measurements and brackets with a question mark uncertain data of still running instruments. Due to a delay in the delivery of the RV “MARIA S. MERIAN”, a data gap of about one year is in 2006. During MSM04/3 instruments were re‐installed or replaced for the first time. As cruise MSM06/2 with RV L’Atalante had only a few working days, a couple of instruments could not be recovered, re‐installed or deployed. For older data and station work refer to cruise reports of M64/2 and MSM04/3.
The OBT 2 was re‐deployed, and the OBA and the OBP 1 were deployed. OBT 1 and OBP 2 were recovered, had data and were repaired and upgraded, but could not be re‐deployed. The Mooring 1, was not deployed. The Mooring 2 could not be recovered and re‐deployed. One new SMoni was successfully deployed for long‐term monitoring in a black smoker of site “B”, whereas another SMoni was deployed for short‐term measurements during the cruise at site “Irina 2“. 20 new/repaired MTL and 8‐channel temperature loggers could not be deployed and some old instruments at site “Irina 2” were not collected, so that those instruments continue their recording. The map in Fig. 1.4.4.2 provides an overview of currently installed instruments without the distributed temperature sensing system.
The ROV‐based 8‐channel temperature probe was successfully used to check temperature profiles in sediments and diffuse fluids, but temperature values from very hot black smoker outflow are uncertain. The fluids possibly have became slightly hotter since the last cruise MSM04/3 (350‐375°C instead of 340‐350°C) and are now so hot that the temperature probe had to operate at the boundary of its range. Re‐calibration of the instrument is necessary to evaluate the high temperature readings of the 8‐channel T‐sensor.

Cruise Report HYDROMAR V (04.12.07 – 02.01.08) l’Atalante
page ‐ 35 ‐
Fig. 1.4.4.2: Map of the LHF with current instrument positions of OBT 2, OBP 1 and a Sonardyne Beacon with identity 15 at the “OBT‐site”, the OBA near site “Quest”, the SMoni‐1 in a black smoker at site “B”, the SMoni‐2 at site “Irina 2” and the Mooring 2, which was deployed during cruise MSM04/3 of RV “MARIA S. MERIAN”.
OBT instruments
The OBT 1 and the OBT 2 measure sea floor tilt in two perpendicular horizontal directions with 1 μrad resolution in a range of ±10°. Both instruments have a MEMS‐accelerometer to record low frequency vertical acceleration from DC/0 Hz to 0.5 Hz. A thermistor measures the sensor temperature and an MTL lashed to the instrument frame records sea water temperatures (Fabian & Villinger, 2007). Sampling of tilt and sensor temperature is 5.7 s, of acceleration is 0.71 s and of sea water temperature is 8 min. The OBT are equipped with a deep sea level (M. Fabian and B. Heesemann, 2006) to facilitate levelling. The first deployment of the OBT 1 was rather successful and provided nearly 400 days of data (Fabian & Villinger, submitted). The new data of the OBT 2, recorded since cruise MSM04/3, is shown in Fig. 1.4.4.3 and is of similar length of 330 days.
After recovery, the OBT 2 could be repaired, upgraded with new electronics, equipped with fresh batteries and re‐installed at its old position at the “OBT‐site”, which has the coordinates 14°45.194 N / 44°58.773 W in 3035 m depth. A marker with two white floats and an anchored buoy with a Sonardyne Beacon (ID 15) mark the site. However, due to the short time between the approval of the recent project‐part (beginning of august 2007) and the original schedule of the cruise MSM06/2 (mid of October 2007), as well as the long delivery time of special lithium batteries for the OBT, only alkaline batteries could be bought limiting operation time to a couple of months.

Cruise Report HYDROMAR V (04.12.07 – 02.01.08) l’Atalante
page ‐ 36 ‐
a)
b)
Fig. 1.4.4.3: Long‐term data collected by OBT 2 at the “OBT‐site”. (a) shows tilt in two perpendicular horizontal directions, X‐tilt and Y‐tilt in mrad, as well as sensor and sea water temperature in °C. Tilt data shows an exponentially decaying long‐term trend that is superposed by a small oscillation of about 0.1 mrad and in x‐tilt by an additional fluctuation of about 0.5 mrad amplitude. Spike like excursions in the beginning of the record are caused by the installation, whereas the excursions in the third week of February are recently of unknown origin. (b) shows the record of vertical acceleration, which also shows an exponential long‐term trend. In the end of august, the batteries of this sensor are empty. Strong excursions during the third week of March might be caused by local seismic activity and correlate in time with some spikes in the record of Y‐tilt in (a). Sensor and sea water temperature show nearly the same record. Some stronger fluctuations in the end of September and a trend to lower temperatures thereafter is obvious.
Fig. 1.4.4.4: Long‐term data collected by OBT 1. Due to a leakage in the deep sea cable between sensors and data logger since the installation the data is corrupted. Vertical acceleration, tilt and sensor temperature are therefore shown in volts and have erratic curves. However, the sea water temperature record is of high quality and is remarkably different from the same record of the OBT 2.
OBA‐instrument
The Ocean Bottom Accelerometer (OBA) has six micro‐electro‐mechanical‐systems, MEMS‐accelerometers of the same type as the OBT (Fabian & Villinger, 2007). The sensors arrange pair wise to record sea floor acceleration in three directions of space. Resolution of acceleration is about 10‐5 m/s2 with a range of ± 30 m/s2, so that the

Cruise Report HYDROMAR V (04.12.07 – 02.01.08) l’Atalante
page ‐ 37 ‐
sensitivity is high enough to detect small vibrations above micro seismic noise at the sea floor, and the range is broad enough to record strong events. The sensors operate in a frequency range from DC/0 Hz to 300 Hz. Absolute acceleration is measurable and the sensors can work as tiltmeters. A newly developed low‐power digitizer inside the OBA has eight input channels with anti‐alias filters and can sample the acce¬lero¬meters output signals with frequencies of up to 20 Hz and 21 effective bits. The two remaining channels of the digitizer sample an additional tilt sensor of type Applied Geomechanics Inc. 756 with 1 μrad resolution and a range of ±10°, so that the OBA can also work like an OBT. Two miniaturized temperature loggers are attached to the instrument frame to record sea water temperature with two different sampling rates of 3 min and 13 min. The size of the OBA is 1.36 m for the long edge, 0.68 m for the perpendicular bisector of the base plate and 0.96 m for the short edges, with a total height of the instrument of 0.78 m. Weight in water is 600 N and in air of 1700 N. Site “Quest” was selected for the OBA installation as it was thought from earlier cruises to have stable ground and is a good place for sea floor deformation measurements in contrast to the OBT‐site, where two tiltmeters record data. However, site “Quest” turned out have unfavourable ground with steep slopes and friable hydrothermal crust. As the ROV‐time was limited, the OBA was finally installed nearby site Quest and could not be levelled, so that only the accelerometers, but not the tiltmeter are expected to provide data. The position of the OBA is 14°45ʹ9.6ʺ N, 44°58ʹ 51.4ʺ W in about 3032 m depth and is drawn in the map in Fig. 1.4.4.2.
OBP‐instruments
Both OBP measure absolute water pressure and have a resolution of about 1 mm in its installation depth of 3035m. In contrast to the OBP 1 the OBP 2 is a completely new instrument that is used for the first time and is equipped with so called Bennest™ technology to sample a Paroscientific pressure sensor at a high rate. Resolution of the OBP 2 should be better than 1 mm. OBP data will be used to assess vertical sea floor displacements with respect to the mean sea level and therefore complement the OBT data. The data also shows a highly resolved tidal signal of the loading of the water column on the sea floor (see Borowski et al., in preparation). The OBP 1 was deployed next to the position of OBP 2 and the OBP 2 was recovered. The OBP 2 recorded since deployment, but the data has to be processed separately for representation. The instrument was checked and repaired, but could not be re‐deployed due to the unexpected end of the cruise.
25m‐Mooring – Bottom Water Vertical Temperature Profiler
Two 25m‐Moorings were supposed to be installed north and south of the highly active site “B” to record variations in the bottom water temperature profile related to nearby black smoker outflow. The aim was to assess flux rates of hot fluids through black smokers. The same type of mooring recorded those temperature variations during its first deployment (see Borowski et al., in preparation), so that the measurements should

Cruise Report HYDROMAR V (04.12.07 – 02.01.08) l’Atalante
page ‐ 38 ‐
be repeated with two instruments and a smoker monitoring device SMoni (see next section) should directly record the temperature variations in a chimney at site “B”. Additionally, a larger 700 m long mooring, brought in by IFM‐GEOMAR, should record regional plume temperatures and chemistry. This experiment was one main objective of the cruise. However, the old mooring near site “F” could not be recovered and the new mooring could not be deployed. The old mooring is still at 14°45.149 N/44°58.714 W in 3000m depth and has a Sonardyne Beacon with ID 14 at its rope.
Smoker Monitoring Device SMoni
The SMoni are newly designed instruments to monitor the fluid temperature of smoker outflow directly inside the chimney. The system consists a long and bended sensor housing, the tip of which can be placed directly inside the chimney, and a data logger that is attached through a longer cable to be placed at a cooler place. Fig. 1.4.4.5 shows a photo of one SMoni installed at a black smoker and the associated data record, which displays temperature of about 341°C. One SMoni was installed at site “B” for long‐term monitoring until the next cruise using a sampling rate of 15 sec. Another SMoni, set‐up for short‐term recording (1 sec) , was left at the microsmoker at site “Irina 2”.
Fig. 1.4.4.5: (a) SMoni with sensor housing with its tip inside the black smoker and the data logger in foreground. (b) Data record from a short term deplyment of the Smoni at smoker B1 of site „B“.
Distributed temperature sensing system, MTL & 8‐channel logger
The distributed temperature sensing system measures long‐term point temperature variations on the meter to centimetre scale within and across single mussel fields, mussel patches and along cracks and fissures at the sea floor. The system consists of 20 single channel MTL, which reside within T‐handle housings with markers (Fig. 1.4.4.6) and four 8‐channel temperature probes. During the cruise 13 MTL were recovered, but new instruments could not be installed. Seven of the 13 MTL (4 from „Quest“ and 3 from „Irina 2“) had data, however, hot fluids or hairline cracks in the housing damaged 6 instruments. Six MTL could not be recovered and remain at“Irina 2” Figures 1.4.4.6

Cruise Report HYDROMAR V (04.12.07 – 02.01.08) l’Atalante
page ‐ 39 ‐
and 1.4.4.7 show the data and provide sketches of the MTLs arrangement at“Irina 2” and “Quest”. The data is of high quality and provides detailed information on absolute temperatures and temperature changes in and around the mussel patches.
Fig. 1.4.4.6: Long‐term tem‐perature measurements at the mussel field at “Irina 2”. Three of four MTL provided excellent data of point temperature variations inside and outside the mussel field. The three diagrams at the left show the data from the MTL’s #3, #9 and #7 (blue circles). The data logger #5 was damaged by a hairline crack and is marked by a red cross. Green rectangles indicate MTL, which have to be recovered on the next cruise.
Fig. 1.4.4.7: Long‐term temperature measurements at the mussel field at site Quest since the last cruise. Three of four MTL provided excellent data of point temperature variation inside and outside the mussel patches. The fourth data logger (#16) was put on a hot place, so that its range of 52°C was exceeded and the battery was empty after a shorter time. Unfortunately five instruments were damaged and are marked by red crosses. MTL’s #11 and #12 had hairline cracks, where it is unclear why the MTL #12 provided data that is disturbed until the mid of Aril, but of high quality thereafter. Other MTL were damaged by hot temperatures. The data of MTL’s #10, #12 and #18 show temperatures mostly below 10°C, significantly lower than at site Irina 2, but during the beginning of November a temporary temperature peak appears.

Cruise Report HYDROMAR V (04.12.07 – 02.01.08) l’Atalante
page ‐ 40 ‐
ROV‐based 8‐channel temperature probe
The ROV‐based temperature probe was designed to measure in‐situ temperatures and temperature profiles in sediments, in black smokers and in the black smoker outflow. The probe has 8 NTC‐sensors, which equidistantly arrange along the probes shaft.
During the cruise several measure¬ments at prominent black smoker sites, in sediments and diffuse fluids were done and the data was provided to the SPP‐colleagues, who use the temperature values for their analyses. The ROV‐based temperature probe displayed some rather high temperatures in some black smokers, which were not observed during cruise MSM04/3 with the same probe. However, these values are uncertain as they are at the border of the measuring range of the probe, so that the probe has to be re‐examined for those temperatures. The two diagrams in Fig. 1.4.4.8 show examples of the data collected during the ROV‐dives.
Fig. 1.4.4.8: Data examples of the ROV‐based temperature probe. In the diagrams, the black line shows the temperature time series of the sensor in the top of the probe. The other sensors are equidistantly arranged along the probe shaft in 4 cm distance to each other. The sketch in the right part of the figures shows the sensor arrangement. Note that the second sensor from the top of the probe (red line) has lost its calibration. (a) Temperature profiles measured during dive ATA21ROV of ROV Kiel 6000. (b) Rather high temperatures in a black smoker outflow cause the data records to reach the probes range boundary. The data in the grey part of the diagram is uncertain and has to be examined separately.
1.4.5 Description of rocks and hydrothermal precipitates (by N. Augustin, S. Petersen)
During cruise HYDROMAR V the recovery of geological samples from the seafloor had no priority and geological samples were only recovered as a byproduct (Fig. 1.4.5.1).
Station ATA15ROV recovered hydrothermal precipitates from the bottom of a mussel‐bed in a water depth of 3045m at T‐logger #13 within the musselbed at the QUEST site (14°45.174’N / 44°58.833’W). 15ROV‐7a is a piece of massive sulfide, primary containing marcasite and pyrite. Diamond‐shaped anhydrite crystals and some copper‐sulphides are minor components. 15ROV‐7b containing well crystallized anhydrite and pyrrhotite as the main minerals (Fig. 1.4.5.2). The presence of anhydrite in these samples indicates

Cruise Report HYDROMAR V (04.12.07 – 02.01.08) l’Atalante
page ‐ 41 ‐
high fluid temperatures at this site, since anhydrite, as a heating product of seawater, only forms at temperatures above 130‐150°C in this environment.
Station ATA17ROV recovered strongly altered serpentinite breccias in a water depth of 2979m on the southern crater rim of Site „B“ (14°45.100’N / 44°58.684’W). The reddish color of the subsamples 17ROV‐1a, b, and c is the result of finely dispersed hematite. 17ROV‐1c contains more relics of the former serpentinite than samples 17ROV‐1a and b. All samples show veins filled by amorphous silica. Anhydrite and talc are minor components. All samples from station 17ROV show small amounts of hematite grains as well as sulphides growing in the matrix and in veins. In addition, 17ROV‐1a reveals traces of hematite grains covered by an orange “fur” made of fine needles of goethite (Fig. 1.4.5.2).
Station ATA27ROV recovered 2 pieces (27ROV‐20 and ‐21) of an inactive chimney from the QUEST site (14°45.175’N / 44°58.836’W; depth 3040m) composed of chalcopyrite with Fe±Zn‐sulfide rich outer layers and a thin (<1mm) orange Fe‐oxide coating (Fig. 1.4.5.2).
Fig. 1.4.5.1: Geological samples recovered during ROV stations: 15 ROV‐7a: pyrite and markasite rich massive‐sulphide with traces of anhydrite; 15 ROV‐7b: massive anhydrite and pyrrhotite; 17 ROV‐1a,b,c: strongly altered serpentinites, hematite impregnated; 27 ROV‐21: chimney piece, collected at QUEST site, composed of chalcopyrite with Fe±Zn‐sulfide rich outer layers.

Cruise Report HYDROMAR V (04.12.07 – 02.01.08) l’Atalante
page ‐ 42 ‐
Fig. 1.4.5.2: Binocular pictures of samples recovered during HYDROMAR V: (A) anhydrite grain in pyritic matrix (15ROV‐7a); (B) marcasite and hematite‐stained clay (?) (15ROV‐7a); (C) euhedral pyrrhotite crystals (15ROV‐7b); (D) anhydrite crystals (15ROV‐7b); (E) hematite impregnated altered matrix of a serpentinite with dark grey fragments of the precursor rocks (17ROV‐1c); (F) small spheres of hematite with “fur” of orange goethite in intensly altered serpentinite (17ROV‐1a); (G) hematite impregnated serpentinite, relicts of former silicates are still present as grayish wall‐like structures (17ROV‐1c); (H) close up of the inner fluid‐channel of an inactive black smoker chimney mainly composed of chalcopyrite (27ROV‐21; site “Quest”).
1.4.6 Fluid chemistry (by Cristiane Jost, Herwig Marbler, Marc Peters, Ulrike Westernströer, Anne Westhues, and Nico Augustin)
1.4.6.1 Sampling and analytical methods Hydrothermal fluids are characterized by their unique chemical and isotopic composition, which is significantly different from ambient seawater (e.g., von Damm, 2004). Scientific objectives for fluid chemical analyses, both on‐board and subsequently in the home laboratories, include the detection of hydrothermal plumes in the water column, and a quantification of the chemical and isotopic composition of hydrothermal fluids discharging from the ocean crust via distinct vent sites ‐ either through black smokers or diffuse venting.

Cruise Report HYDROMAR V (04.12.07 – 02.01.08) l’Atalante
page ‐ 43 ‐
Buoyant hydrothermal plumes were sampled by means of the CTD/Rosette, equipped with 24 bottles à 10 l volume and operated as tow‐yos (see section oceanography for details). Hydrothermal fluids, both from vent orifices and diffuse flow musselfields were collected with the Kiel Pumping System (KIPS) by inserting a titanium sampling nozzle into the orifice of smoker structures. In addition, 2 hot vents were sampled by titanium syringe samplers (“Majors” after von Damm, manufactured by IFREMER, France).
Sampling with the KIPS fluid sampling system
The pre‐requisite for an accurate estimate of the composition of hydrothermal fluids venting at high‐temperature Black Smokers or from diffuse mussel‐field sites is sampling of the hydrothermal fluids without entrainment of ambient seawater which would cause immediate precipitation of sulphides and barite and, hence, loss of these compounds from solution. One important measure of the purity of the sampled hydrothermal fluid is temperature. Consequently, real‐time in‐situ measurement of the temperature helps to guide the tip of the sampling nozzle to the hottest region within the vent orifice where the purity of the venting fluid is highest and least diluted with seawater. Another pre‐requisite is that all materials coming into contact with the sampled fluid are inert and have lowest adsorption coefficients preventing systematic errors introduced by either contamination or losses due to adsorption. Precipitation during cooling of the sampled fluid, however, cannot completely be avoided.
A fully remotely controlled flow‐through system – the Kiel Pumping System (KIPS‐3) ‐ mounted on the ROV’s starboard tool sled was used for this purpose (Garbe‐Schönberg et al., 2006). The parts of the system getting into contact with the sample are entirely made of inert materials: polyetheretherketon (PEEK), perfluoralkoxy (PFA) and polytetrafluorethylene (PTFE, Teflon®), and a short tube of high‐purity titanium (99.9 % Ti, 40 cm length, 6 mm I.D.). Fluid enters via this titanium tube ‐ the nozzle – mounted to a T‐handle which is guided by the ROV’s ORION manipulator arm. Parallel to the titanium nozzle is a high‐temperature sensor (see below) delivering real‐time temperature data for the tip of the nozzle. Coiled PFA tubing (3/8” O.D., 3 m length) connects the nozzle to a remotely controlled multi‐port valve (PEEK, PTFE) delivering the fluid to the respective sampling flask. The valve is driven by a stepper motor (electric actuator, Schilling Robotics, U.S.A.) with software fully integrated into the ROV control system (Figure 1.4.6.1; ROV Node 6, port # 09, Software FluidCtrl Version. 0.3.0.0, by Marum Soft, Bremen).
The multiport valve has 9 ports connected to 9 single PFA flasks with 675 ml volume each (Nalgene, USA). Each bottle is equipped with a check valve at the outlet. The flasks are mounted in three racks A‐C, with every rack containing three horizontally positioned bottles, allowing an easy transfer of the racks to the laboratory where sub‐sampling was done. Flasks were pre‐filled with ambient bottom seawater (North Atlantic Deep Water, NADW) obtained from CTD hydrocasts. A 24 V deep sea

Cruise Report HYDROMAR V (04.12.07 – 02.01.08) l’Atalante
page ‐ 44 ‐
mechanical gear pump is mounted downstream to the sample flasks, thus avoiding contamination of the samples. The pump is integrated into the pressure compensation system of the ROV and electrically controlled with the ROV’s port (Node 6, port # 14). The pumping rate was approx. 1250 ml/min. The standard pumping time per sample was set to 3 min making sure that the flask volume was exchanged at least 4 times. The outlet of the KIPS system is located on the porch at the front‐side of the ROV, where video control allows the observation of warm fluids leaving the system. In addition, a flow mobile was attached to the outlet tube (Fig. 1.4.6.2).
Fig. 1.4.6.1: Schematic configu‐ration of the inert KIPS fluid sampling system (only tubing connections to flasks # 5 ‐ # 9 are shown for clarity). Fluid entering the nozzle is distributed by a motorized multiport‐valve to 9 PFA sample flasks á 675 ml, each with check valves and stopcocks. The pump is positioned down‐stream. Racks A, B, C with 3 flasks each can be quickly removed and sub‐sampled in the lab.
A high‐precision thermistor temperature sensor (manufactured by H.‐H. Gennerich, Bremen) inside a stainless steel pressure housing was attached parallel to the nozzle. Real‐time temperature readings were transferred through a serial port (Node 6, port # 16) to the control van. In addition, the sensor was connected via a Y‐splice cable to a data logger (RBR # 12644, Brancker, Canada). The 90% time constant of the sensor in water is better than 10 s. Two individual sensors were used during this cruise: sensor #1 during dive ATA‐07_ROV and sensor #5 for all subsequent dives. Calibration coefficients were obtained through a 25‐points high‐precision calibration up to 450 °C (Table 1.4.6.1).
Table 1.4.6.1: Calibration coefficients used for calculation of temperatures for sensor #1 and # 5.
Calibration coefficients Range (°C) A0 A1 A2 A3
Sensor #1 Hi‐T01 (NTC # 160176)
0 – 450 3,5306E‐03 ‐2,5298E‐04 3,0338E‐06 ‐1,0276E‐07
Sensor #5 Hi‐T05 (NTC #193729)
0 – 450 3,5161E‐03 ‐2,5616E‐04 2,7319E‐06 ‐8,1982E‐08

Cruise Report HYDROMAR V (04.12.07 – 02.01.08) l’Atalante
page ‐ 45 ‐
Sub‐sampling and sample preparation
Immediately after recovery of the ROV on deck KIPS sample racks were transferred to the laboratory. Usually, 3‐5 flasks were filled at each site. 150 ml original hydrothermal fluid were taken from every flask. For subsequent analyses of dissolved ions the complete volume of one flask was transferred to a FEP bottle, homogenised, and then sub‐sampled for the different analytes. Another flask was dedicated for the analysis of dissolved gases and isotopic composition, the sampling technique is described elsewhere in the respective gas chemistry chapter. An overview scheme of sub‐samples taken gives Table 1.4.6.2. Titanium syringes were sampled in the same way.
Table 1.4.6.2: Overview of sub‐samples taken and analytical parameters determined on‐board and, later, to be determined in the home laboratories.
Group
Per
ner
JUB
IFG
Kie
l
JUB
JUB
JUB
JUB
Kei
r
Stra
uss
Stra
uss
Per
ner
Analysis on-board
diss
. Oxy
gen
(Win
kler
)
pH, s
ulfid
e, C
l, Fe
, S
b, S
e
pH
, Cl,
Mg,
(aus
S
pülls
g)
CH
4 un
d H
2 K
onz.
pH, C
l
Fixi
erun
g K
ultiv
ieru
ng
Analysis on-shore
P
GE
s,
maj
or e
lem
ents
fil
tere
d / n
ot
filte
red
acid
ified
/ no
t id
ifid Ani
ons
Org
anic
com
plex
atio
n
Trac
e m
etal
s, m
ajor
an
d m
inor
ele
men
ts
(Si,
Fe, M
n, Z
n, C
u)
Am
ino
acid
s
C u
nd H
Isot
ope
S is
otop
es in
di
ssol
ved
sulfi
de
O a
nd H
isot
opes
of
wat
er D
IC-C
isot
opes
, H
2S-K
onz
Sub-sample volume
mL
12
50
2 *
50
+
250
(für
PG
Es)
50
100
2 *
100
2 *
40
300
+
75
( zum
S
püle
n)
250
30
400
Bottle 1 Bottle 2 Bottle 3
Sample preparation for on‐shore determination of major, minor, and trace elements, anions, and amino acid complexation
Hot hydrothermal fluids emerging from black smokers containing some precipitates formed during cooling were not filtered but acidified with 1‐5 ml subb. HNO3 per 100 ml fluid and stored in PFA bottles until analysis. Warm diffuse fluids emerging in mussel fields were pressure filtrated (99.9990 nitrogen) through 0.2 μm Nuclepore PC membrane filters in Sartorius filtration units and acidified with 0.2 ml subboiled concentrated nitric acid per 100 ml. Acidified samples are stored in 100 ml PFA bottles

Cruise Report HYDROMAR V (04.12.07 – 02.01.08) l’Atalante
page ‐ 46 ‐
until analysis. Procedural blanks were processed in regular intervals. All work was done in a class 100 clean bench (Slee, Germany) using all‐plastic labware (HDPE; PC, FEP, PFA). Rinse water was ultrapure (>18.2 MOhm) dispensed from a Millipore Milli‐Q system. After return to the home labs in Kiel samples will be analysed for major and minor element composition (Na, K, Ca, Mg, Sr, Ba, B, Fe, Mn, Cu, Zn) by means of ICP‐optical emission spectrometry (Ciros SOP; Spectro), and trace elements (e.g., I, Br, B, Li, Al, Ti, Cs, Ba, Sr, Y‐REE, Fe, Mn, Cr, V, Cu, Co, Ni, Pb, U, Mo, As, Sb, W) by ICP‐mass spectrometry using both collision‐cell quadrupole (7500 cs, Agilent), and high resolution sector‐field instrumentation (PlasmaTrace 2, Micromass). At JUB in Bremen, complementary analyses on major, minor and trace elements will be carried out: A large number of cations (e.g. Zn, Cd, Pb, Cu, Ni, Co, Mn, Mo) will be determined by using voltammetry, as well as major and minor element composition (Na, K, Ca, Mg, Sr, Ba, B, Fe, Mn, Cu, Zn) by means of ICP‐Optical Emission Spectrometry (ICP‐OES, Spectro), and trace elements (e.g., I, Br, B, Li, Al, Ti, Cs, Sr, Y‐REE, Fe, Mn, Cr, Cu, Co, Ni, Pb, U, Mo) by ICP‐Mass Spectrometry (ICP‐MS, Elan DRC‐e, Perkin Elmer) at Jacobs University Bremen (Bremen, Germany). For anions analyses (e.g. Cl‐, Br‐, I‐, SO42‐), aliquots of hot hydrothermal fluids with precipitate were pressure‐filtrated through 0.2 μm PC membrane filters (Nuclepore). Warm diffuse fluids were taken as original sample without further treatment and stored in PE‐LD bottles until analysis. For amino acids and other organic compounds, the measurements will be carried out in the organic geochemistry lab at Bundesanstalt für Geowissenschaften und Rohstoffe (BGR, Hannover, Germany). Onboard, sub‐samples for organic analyses, non‐filtered, were immediately frozen (‐20°C) as 50 ml aliquots in acid‐cleaned PE bottles. Particles from fluid samples will be analyzed by means of later inorganic analysis in addition to organic analyses of the fluids. Filters from filtration of the KIPS fluid samples of the ROV were kept in plastic dishes Samples for the detection of dissolved inorganic silica were diluted 1:50 from the concentrated fluid with DI water and acidified.
1.4.6.2 Analytical procedures on-board Winkler titration of dissolved oxygen.
Immediately after sample recovery dissolved oxygen was determined in hydrothermal fluids from diffuse vent sites only. The procedure followed the standard procedure as outlined in Grasshoff (1999) with the exception that 10 ml volumetric flasks were used. The detection limit is approx. 0.5 ml/l O2, precision is in the range of ± 0.1 ml/l O2. The samples were analysed by Mirjam Perner and Thomas Meier.
pH measurements and chloride titration
Especially the anoxic fluids from the hot vents were analyzed and stored immediately after system recovery. Aliquots of non‐filtered samples were subjected to immediate pH measurements (Ag/AgCl reference electrode) as well as voltammetric determination of sulfide concentrations. Parallel to that, iron speciation analysis was carried out by using

Cruise Report HYDROMAR V (04.12.07 – 02.01.08) l’Atalante
page ‐ 47 ‐
spectrophotometry. To identify a possible influence of phase separation, the hot fluids were analyzed for chloride by titration with AgNO3 0.1M standard solution, after the method of Fajans, by using fluoresceine‐sodium as indicator. For further analysis, some samples were acidified with 65% (w/v) HNO3 in a ratio of 1:1000.
Voltammetric analysis of trace metal concentrations and spectrophotometric determination of iron speciation
For onboard trace metal concentration analyses of sulfide, antimony and selenium, the voltammetry was chosen as electroanalytical technique. Immediately after recovery, the fluid samples were prepared for analyses onboard. The unfiltered aliquots were used for determination of the total content of the metals. As no pre‐treatment step of the samples was performed, e.g. UV irradiation, only the labile/free fraction of each metal was determined. All measurements were performed by using a 757 VA Computrace with a standard PC (Metrohm, Herisau, Switzerland). The three‐electrode configuration consisted of the static mercury drop electrode (SMDE) and of the hanging mercury electrode (HMDE) as the working electrode (respectively for sulfide and antimony/selenium analysis), an Ag/AgCl reference electrode (3M KCl) and a platinum wire as the auxiliary electrode. Sulfide concentrations were determined by using a NaOH 0.1M oxygen‐free solution (Application Bulletin No. 199/3, Metrohm, Herisau, Switzerland).
The antimony concentration was determined in a 5M HCl solution (adapted from Wagner et al., 1996; Fresenius J. Anal. Chem. 354 (1996) 11, for highly saline fluids by JOST et al. – unpublished results) by using anodic stripping voltammetry (ASV). Selenium was analyzed by using a previous co‐electrolysis step with Cu(II) ions and cathodic stripping voltammetry (CSV) in a 0.1M HCl medium (Ferri et al., 1998 P. Anal. Chim. Acta 361 (1998) 113.).
The iron speciation analysis was performed by using spectrophotometry. The determination of the orange‐red ferroin complex is the principle of the method. Ferrous ions are complexed by adding an amount of 1% (w/v) 1,10‐phenantroline solution to the samples in a pH range of 3‐5. The total Fe is measured by reducing all Fe content with a 1% (w/v) ascorbic acid solution. Then, the Fe(III) concentration is determined as the difference between the total Fe and Fe(II) content. A Biochrom Libra S12 spectrophotometer was used for absorbance measurements at a wavelength of 511 nm with 1cm pathlength quartz spectrophotometric cells. Samples with concentrations above 100 mg Fe L‐1 were measured in diluted samples.
1.4.6.3 First results In situ‐temperatures and chemistry of black smoker hydrothermal fluids
A dedicated high‐precision thermistor‐based temperature sensor integrated within the KIPS fluid sampling system and mounted parallel to the sampling nozzle was used for our temperature measurements of hydrothermal fluids. It has to be kept in mind that

Cruise Report HYDROMAR V (04.12.07 – 02.01.08) l’Atalante
page ‐ 48 ‐
fluids emerging at the top of a chimney may have already cooled or mixed with seawater inside the chimney structure. Moreover, vigorous venting involves turbulent mixing of hydrothermal fluids with seawater leading to a highly chaotic temperature distribution within the orifice. It becomes evident that temperature measurements under these conditions and with a ROV difficult to hold in position within a few millimetre for some time are only a rough estimate of the real temperature of the hydrothermal fluid. The following figures show temperature/time plots and sampling positions during fluid sampling of hot vents. (Compare these plots with sampling intervals compiled in Table A1 in the Appendix). The highest temperatures during this cruise were recorded at site Irina 1 (Tmax ~ 375°C), however, the data was visualized on screen but not logged. Overall temperatures were higher in almost all black smoker chimneys when compared to published analyses and to values obtained during earlier SPP cruises. It is not clear yet, if this indicates an increase in temperatures of the field or if it is related to the sampling, since we were able to access deeper parts of the chimneys when compared to earlier cruises.
Fig. 1.4.6.2: ATA13ROV hot fluid sampling at Barad‐Dûr (site „A“) with Tmax= 317°C and Anna‐Louise (smoker AL1) with Tplateau= 352.3 ± 0.5 °C.

Cruise Report HYDROMAR V (04.12.07 – 02.01.08) l’Atalante
page ‐ 49 ‐
Fig. 1.4.6.3: ATA24ROV hot fluid sampling at Irina II microsmoker with Tplateau = 361.7±0.6 °C and Quest with its irregular temperature distribution probably caused by venting through talus material. Fluid sampling periods are indicated by brackets. Tmax = 370.9°C.
Fig. 1.4.6.4: ATA30ROV hot fluid sampling at Site B (smoker B1) with Tplateau = 352.2±0.4°C and Candelabra with Tplateau = 360.8±1.1°C.
Measured temperatures of the diffuse hydrothermal fluids are tabulated in Table A1 in the Appendix.

Cruise Report HYDROMAR V (04.12.07 – 02.01.08) l’Atalante
page ‐ 50 ‐
Chemistry of vent fluid samples
First of all, it must be noted that all hydrothermal fluid samples were diluted by seawater and the results presented here are not yet calculated for endmember compositions. The LHF hydrothermal endmember is characterized by a pH of approx. 3.5 and slightly lower chloride of 540 mM than seawater (550 mM Cl).
The pH of samples taken directly from the vent orifices clearly reflects variable admixture of seawater to the hot reducing hydrothermal endmember fluid. As shown in Fig. 1.4.6.6 where chloride of all samples is plotted against their pH, higher chloride concentrations correlate with higher pH values. Since Fe is highly enriched in hydrothermal fluids a plot of dissolved Fe against pH gives an even stronger correlation (Fig. 1.4.6.7).
535
540
545
550
555
560
565
570
575
580
3 3.5 4 4.5 5 5.5 6 6.5 7 7.5 8pH
Cl (
mM
)
Fig. 1.4.6.5: Chloride concen‐trations plotted against pH values.
535
540
545
550
555
560
565
570
575
580
0 2000 4000 6000 8000 10000 12000 14000Fe (µM)
Cl (
mM
)
Fig. 1.4.6.6: Variability of chloride concentrations com‐pared to total Fe concentrations.
Hence, pH can be taken as a first estimate for the purity of the sampled hydrothermal fluid. A slight tendency towards decreased salinities is presented in Fig. 1.4.6.8 where chloride was plotted against Fe as hydrothermal element. The higher the chloride concentration, the lower the total Fe amount.
The iron data provided the most interesting results, as speciation analyses were performed. Iron was the dominating heavy metal in all hot fluid samples, with a certain contribution in the form of iron sulfides. The speciation distribution graph (Fig. 1.4.6.7)
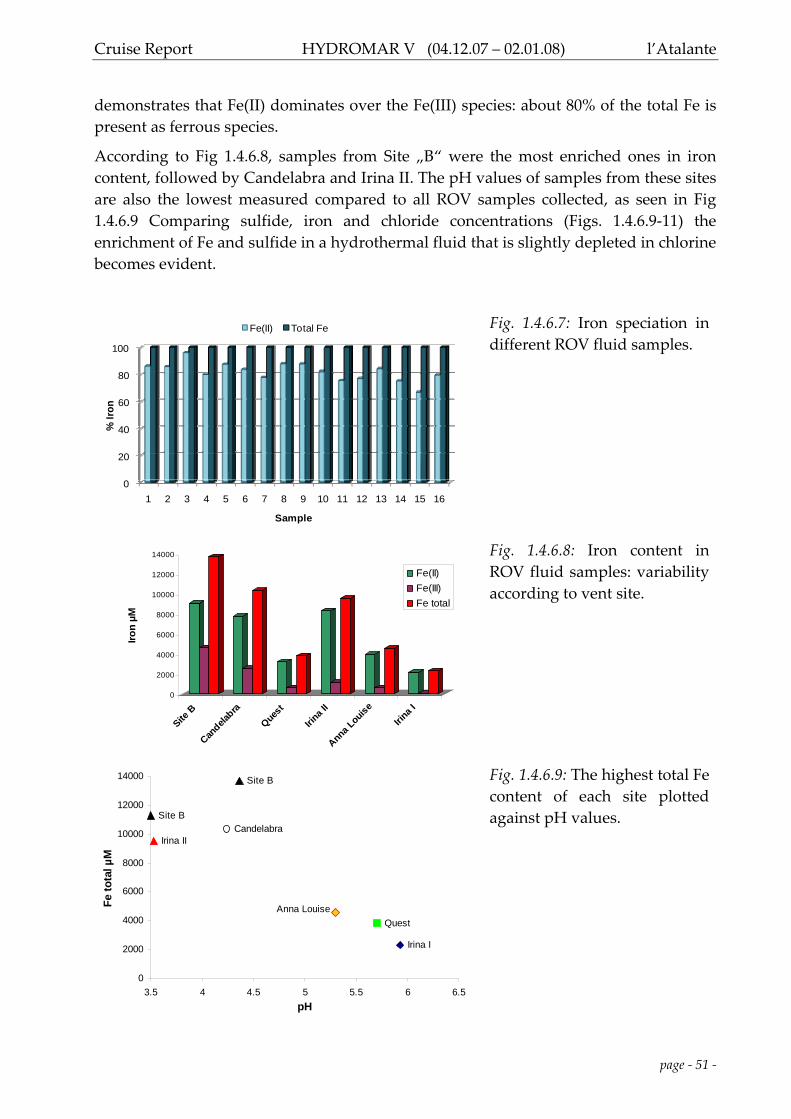
Cruise Report HYDROMAR V (04.12.07 – 02.01.08) l’Atalante
page ‐ 51 ‐
demonstrates that Fe(II) dominates over the Fe(III) species: about 80% of the total Fe is present as ferrous species.
According to Fig 1.4.6.8, samples from Site „B“ were the most enriched ones in iron content, followed by Candelabra and Irina II. The pH values of samples from these sites are also the lowest measured compared to all ROV samples collected, as seen in Fig 1.4.6.9 Comparing sulfide, iron and chloride concentrations (Figs. 1.4.6.9‐11) the enrichment of Fe and sulfide in a hydrothermal fluid that is slightly depleted in chlorine becomes evident.
0
20
40
60
80
100
1 2 3 4 5 6 7 8 9 10 11 12 13 14 15 16
% Ir
on
Sample
Fe(II) Total Fe
Fig. 1.4.6.7: Iron speciation in different ROV fluid samples.
0
2000
4000
6000
8000
10000
12000
14000
Iron
µM
Site B
Candela
bra
Quest
Irina II
Anna Lo
uiseIrin
a I
Fe(II)Fe(III)Fe total
Fig. 1.4.6.8: Iron content in ROV fluid samples: variability according to vent site.
Site B
Site B
Irina II
Irina I
Candelabra
QuestAnna Louise
0
2000
4000
6000
8000
10000
12000
14000
3.5 4 4.5 5 5.5 6 6.5pH
Fe to
tal µ
M
Fig. 1.4.6.9: The highest total Fe content of each site plotted against pH values.
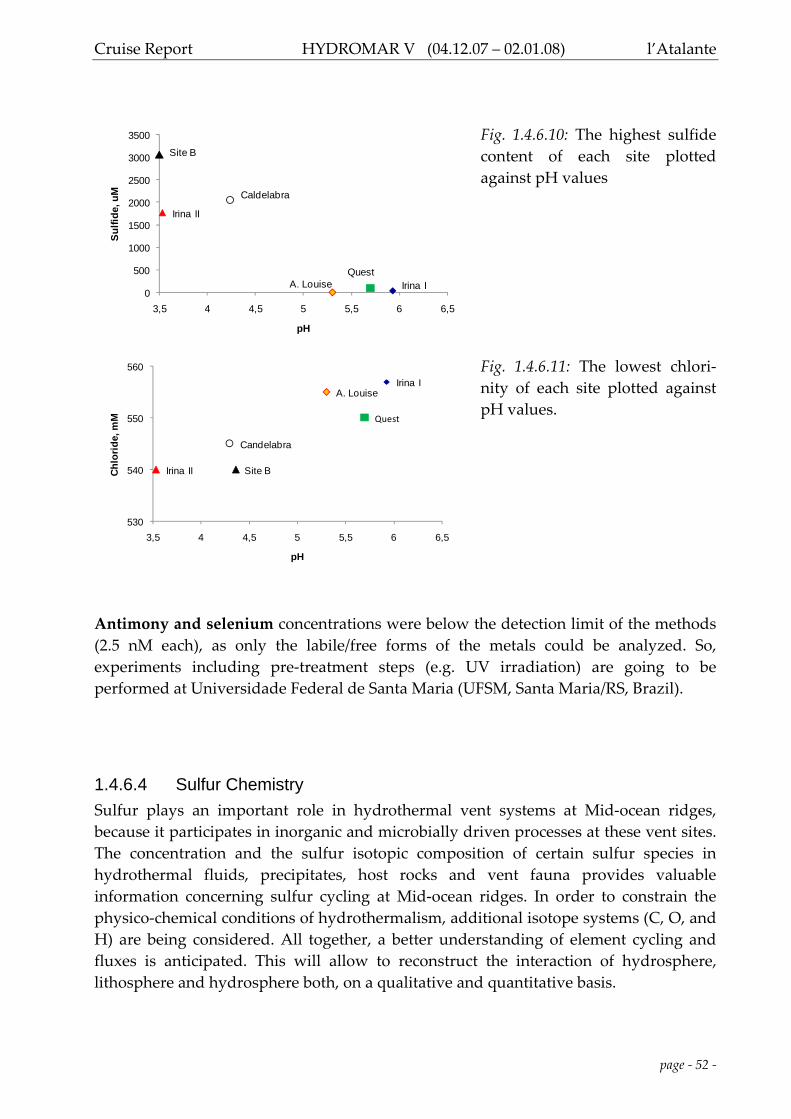
Cruise Report HYDROMAR V (04.12.07 – 02.01.08) l’Atalante
page ‐ 52 ‐
A. Louise Irina IQuest
Irina II
Caldelabra
Site B
0
500
1000
1500
2000
2500
3000
3500
3,5 4 4,5 5 5,5 6 6,5
Sulfi
de, u
M
pH
Fig. 1.4.6.10: The highest sulfide content of each site plotted against pH values
A. LouiseIrina I
Quest
Irina II
Candelabra
Site B
530
540
550
560
3,5 4 4,5 5 5,5 6 6,5
Chl
orid
e, m
M
pH
Fig. 1.4.6.11: The lowest chlori‐nity of each site plotted against pH values.
Antimony and selenium concentrations were below the detection limit of the methods (2.5 nM each), as only the labile/free forms of the metals could be analyzed. So, experiments including pre‐treatment steps (e.g. UV irradiation) are going to be performed at Universidade Federal de Santa Maria (UFSM, Santa Maria/RS, Brazil).
1.4.6.4 Sulfur Chemistry Sulfur plays an important role in hydrothermal vent systems at Mid‐ocean ridges, because it participates in inorganic and microbially driven processes at these vent sites. The concentration and the sulfur isotopic composition of certain sulfur species in hydrothermal fluids, precipitates, host rocks and vent fauna provides valuable information concerning sulfur cycling at Mid‐ocean ridges. In order to constrain the physico‐chemical conditions of hydrothermalism, additional isotope systems (C, O, and H) are being considered. All together, a better understanding of element cycling and fluxes is anticipated. This will allow to reconstruct the interaction of hydrosphere, lithosphere and hydrosphere both, on a qualitative and quantitative basis.

Cruise Report HYDROMAR V (04.12.07 – 02.01.08) l’Atalante
page ‐ 53 ‐
Concentration of dissolved H2S
One ml from each fluid samples were taken for dissolved sulfide concentration measurements. 100μl of a zinc acetate gelatine solution was used to fix the sulfide of the fluid. This solution keeps the precipitated zinc sulfide in a colloidal state. The homogeneous distributed sulfide reacts with N,N‐dimethyl‐1,4‐phenylene‐diamine‐dihydrochloride to colourless leucomethylene. This component is oxidized by Fe3+ ions of an iron chloride solution to methylene blue. Methylene blue absorbs light with a wavelength of 660nm. One hour after the reagents have been added the solution is measured photometrically. Before the photometric determination a calibration curve is constructed by the measurement of different calibration solutions each with a certain sulfide concentration. For the production of the calibration solutions a fresh stock solution with a sulfide concentration of 5,8mmol/L is used. The exact sulfide concentration of the stock solution is determined by titration with a 0,02N thiosulfate solution.
SAMPLE SITE H2S concentration. (mg/L)
H2S concentration. (μM/L)
ATA 13 ROV‐3 Site A b.d.l. b.d.l. ATA 13 ROV‐8 Anna Louise 14.3 446 ATA 15 ROV‐5 Quest b.d.l. b.d.l. ATA 17 ROV‐4 Site B 5.23 164 ATA 17 ROV‐8 Irina I b.d.l. b.d.l. ATA 17 ROV‐11 Irina I 0.12 3.69 ATA 21 ROV‐7 Irina II b.d.l. b.d.l. ATA 21 ROV‐13 Irina II b.d.l. b.d.l. ATA 24 ROV‐4 Irina II 7.62 238 ATA 24 ROV‐7 Irina II 0.20 6.14 ATA 24 ROV‐13 Quest 4.27 133 ATA 27 ROV‐8 Quest b.d.l. b.d.l. ATA 30 ROV‐3 Site B 17.1 535 ATA 30 ROV‐4 Site B 14.6 456 ATA 30 ROV‐10 Candelaber 15.6 488 ATA 30 ROV‐A1 Candelaber 1.35 42.3 b.d.l. = below detection limit (1μmol/L)
Concentration of other dissolved S species
In addition to the photometrical determination of the sulfide concentration, the monobromobimane method (Fahey & Newton, 1987) was used to stabilize not only the dissolved sulfide, but also other thiols, i.e. intermediate sulfur species like sulfite or thiosulfate. This analytical approach has several advantages: different sulfur‐bearing compounds dissolved in the hydrothermal fluids can be quantified, including

Cruise Report HYDROMAR V (04.12.07 – 02.01.08) l’Atalante
page ‐ 54 ‐
metastable phases which are attractive to certain microorganisms; these different sulfur compounds can be separated (and collected) for sulfur isotopic measurements (development of methodology currently in progress); and finally, measurements can be performed on smaller sample volumes. Initial fixation with monobromobimane is done on‐board, subsequent measurements are performed in cooperation with Dr. Christian Ostertag‐Henning, Bundesanstalt für Geowissenschaften und Rohstoffe, Hannover.
A 50μl volume of the sample was added to 110μl of previously prepared derivatization mixture, composed as follows: 50μl of HEPES buffer, 50μl acetonitrile and 10μl monobromobimane (48mmol/L). Derivatization was performed in the dark and was stopped after 30 min by adding 100μl of methanesulfonic acid (Rethmeier et al., 1997).
Isotopic composition of H2S
250ml of each sample were added to a zinc acetate solution (3%) to precipitate the dissolved H2S. The precipitated sulfide was filtrated and dried. The sulfide sulfur of the samples will be extracted and isotopically analysed (δ34S) at the Geologisch‐Paläontologisches Institut, Westfälische Wilhelms‐Universität, Münster.
New insights into the sulfur cycling at the MAR are anticipated from measurements of the rare isotopes of the sulfur system, i.e. 33S or 36S for dissolved and precipitated sulfides. It has been shown that multiple sulfur isotope systematics can distinguish and, hence, quantify isotope exchange reactions induced by hydrothermal processes from isotope mixing as well as the contribution of sulfur from biological processes (Ono et al., 2006). Newly developed analytical protocols allow the detection of small differences even in the rare sulfur isotopes. These measurements will be carried out in cooperation with Professor James Farquhar at the University of Maryland, College Park, USA.
1.4.6.5 Isotope ratios of oxygen, hydrogen, and carbon
Hydrogen and oxygen in hydrothermal fluids characterize the intensity of water‐rock interaction between fluid and host rock. This results in a shift for both, oxygen and hydrogen isotopes, towards more positive values (Shanks, 2001). The magnitude of this shift is determined by the water‐rock ratio and the duration of interaction. Low water‐rock ratios or prolonged interaction between fluid and host rock (i.e. long residence of fluid in the reaction zone) will result in oxygen and hydrogen values substantially deviating from ambient seawater with 0‰ for both. Four ml of each sample were filled in 2 crimp glasses for determination of the oxygen and hydrogen isotopic composition. Isotopic measurements will be carried out at the University of Münster.

Cruise Report HYDROMAR V (04.12.07 – 02.01.08) l’Atalante
page ‐ 55 ‐
The carbon isotopic composition of hydrothermal fluids potentially reflects contributions from various sources, including mantle CO2, entrained seawater or oxidized organics and methane (Shanks, 2001). 20 ml of a fluid sample were taken and poisened with two drops of HgCl2 to determine the isotopic composition of the dissolved inorganic carbon fraction (DIC) at the University of Münster.
1.4.7 Microbiology from diffuse and hot hydrothermal fluids (by Mirjam Perner and Thomas Meier)
The main objective of the microbiology group during this cruise was to collect low‐temperature, diffuse and hot hydrothermal fluids from the Logatchev hydrothermal field to investigate:
1. the intra‐field microbial variability and to continue the time‐series
2. the functioning of the microbial community, specifically focusing on microbial H2‐ and H2S‐oxidation and CO2 fixation.
Intra‐field microbial variability and time‐series
To investigate the intra‐field microbial variability and to continue the time‐series the following fluids were collected (see table 2):
• hot hydrothermal fluids (Site A, Anna‐Louise, Site B, Irina I, Irina II)
• 1 low‐temperature diffuse fluid (Quest, mussel patch)
• low‐temperature fluids (Irina II, mussel patch)
To identify and quantify the local microorganisms in the fluids of different sites material was collected to construct clone libraries using the 16S rRNA gene and perform fluorescence in situ hybridization in the home laboratory.
Functioning of the microbial community
The functioning of the vent microbial community is studied by two approaches. The first includes cultivation of selected groups of bacteria and archaea. The second involves analysis of functional genes and parallel‐performed 14C‐ and 13C‐incubation experiments with the decrease of potential electron‐donors and acceptors being monitored.
Cultivation experiments
To characterize, at least parts, of the microbial community cultivations have been started on board (and will be continued in the home laboratory) specifically selecting

Cruise Report HYDROMAR V (04.12.07 – 02.01.08) l’Atalante
page ‐ 56 ‐
for H2‐oxidizing and CO2 fixing microorganisms (e.g. Epsilonproteobacteria, Aquificales, and Methanococcales). For this purpose, selective media for autotrophic microorganisms was supplemented with various electron donors (H2, H2S, S°, S2O3) as well as suitable electron acceptors (O2, NO3, S°, S2O3) in the presence of CO2. Additionally, media for aerobic and anaerobic heterotrophic microorganisms was used. Cultivations were conducted along a temperature gradient of 25‐75°C.
For the cultivation experiments, material was gathered from:
• hot hydrothermal fluids (Site A, Anna‐Louise, Irina II)
• 1 low‐temperature diffuse fluid (Quest, mussel patch)
• 1 low‐temperature fluid (Irina II, mussel patch)
14C and 13C‐incorporation experiments
The second approach investigates the functioning of the vent microbial community by using functional genes encoding for key enzymes of H2‐oxidation, oxidation of reduced sulfur compounds and CO2 fixation. However, the presence of functional genes encoding key enzymes of specific metabolisms is no proof of the actual functioning of this metabolism. Therefore, additionally, 14C‐incorporation experiments (at 25°C) were performed with hydrothermal fluids, which were supplemented with H2 (under oxic and anoxic conditions) or H2S as electron donor. The decrease of the supplied electron donors (H2 or H2S) and electron acceptors (O2) was monitored during the 30 hours of incubation. For this experiment hydrothermal fluids were collected from 1 diffuse fluid at Quest Three parallels of each 15 ml of the hydrothermal fluids were supplemented with
• H2‐gas under anoxic conditions
• H2‐gas under oxic conditions
• H2S
• nothing (control)
and injected with 14CO3‐. Three parallel controls with microorganism‐free and non‐active microorganisms (fixed with formaldehyde) liquids were conducted to determine the non‐biological loss of H2 and O2 in the incubation bottles. These values were taken into consideration when evaluating the decrease of H2 and O2 in the incubation experiment. H2 and O2 contents were monitored at t = 0 hrs and t = 30 hrs. The amount of 14C, which has been incorporated into the cells, will be determined in the home laboratory.

Cruise Report HYDROMAR V (04.12.07 – 02.01.08) l’Atalante
page ‐ 57 ‐
usage of H2 and O2 during 14C-incorporation
experiment from diffuse fluids at Quest
H2 oxic O2 H2 anoxic
H2
conc
entra
tion
[µM
]
0
50
100
150
200
O2
conc
entra
tion
[ml/L
]
0
1
2
3
4
5
6
Fig. 1.4.7.1: The decrease of H2 under anoxic conditions as well as the usage of H2 under oxic conditions and the corresponding reduction of O2 is shown for a 30 hours time‐period in the incubation experiments at 25°C. H2 data by P. Wefers
From the data available (Fig. 1.4.7.1) it seems that microorganisms in the oxic H2‐incubation utilized slightly more H2 (decrease of 35μM) (with an O2 decrease of 1,81 mL/L) than in the anoxic H2 incubation (decrease of 32μM). The determination of the amount of 14C incorporated into the cells, dependent on the electron donor (H2 and H2S) and the oxic vs. anoxic condition, will be conducted in the home laboratory.
A similar experiment was conducted for hot hydrothermal fluids from Site B for which 14C‐incorporation experiments are not available. Nevertheless, 13C‐incorporation data is available allowing a semi‐quantitative analysis of whether more 13C‐was incorporated into the cells with H2 or H2S as electron donors at 25°C. Three parallels of each 1 ml of the hydrothermal fluids were added to media (selecting for autotrophic organisms) and were supplemented with:
• H2‐gas under anoxic conditions + NaNO3 + S°
• H2‐gas under oxic conditions
• H2S + NaNO3
• nothing (control)
and injected with 13C. Three parallel controls with microorganism‐free liquids were conducted to determine the non‐biological loss of H2, H2S and O2 in the incubation bottles. These values were taken into consideration when evaluating the decrease of H2, H2S and O2 in the incubation experiment. H2 , H2S and O2 contents were monitored at t = 0 and t = 30. The semi‐quantitative analysis of 13C, which has been incorporated into the cells, will be determined in the home laboratory.

Cruise Report HYDROMAR V (04.12.07 – 02.01.08) l’Atalante
page ‐ 58 ‐
Microorganisms in the H2S incubation oxidized 150μM of H2S while in the H2 incubations ~50μM of H2 was used. Microorganisms in the oxic H2‐incubation utilized slightly more H2 than in the anoxic incubation. Approximately 3mL/L of O2 was used in the oxic H2‐incubation.
usage of electron donors & acceptorsduring 13C-incorporation experiment
from hot fluids at Site B
H2 oxic O2 H2 anoxic H2S
H2
conc
entra
tion
[µM
]
0
50
100
150
200
O2
conc
entra
tion
[ml/L
]
0
1
2
3
4
5
6
H2S
con
cent
ratio
n [µ
M]
0
50
100
150
200
Fig. 1.4.7.2: The decrease of H2 under anoxic conditions and of H2S as well as the usage of H2 under oxic conditions and the corresponding reduction of O2 is shown for a 30 hours time‐period in the incubation experiments at 25°C. H2 data by P. Wefers and H2S data by M. Peters.
Table 1.4.7.1: Samples list of CTDs
station depth [m]
niskin bottle number
DNA (‐70°C)
FISH (fixed in formaldehyde)
ATA‐10CTD 3000 1 filter 4 (500 ml) filter 16 (10 ml) filter 9 (500ml) filter 17 (90ml) 2700 7 filter 1 (100ml) filter 24 (10 ml) filter 2 (150ml) filter 25 (90 ml) filter 3 (750ml) 2600 9 filter 12 (500 ml) filter 18 (10 ml) filter 13 (500 ml) filter 19 (90 ml) 2200 17 filter 10 (500 ml) filter 20 (10 ml) filter 11 (500 ml) filter 21 (90ml) 1800 20 filter 5 (500ml) filter 22 (10 ml) 1800 20 filter 6 (100ml)* filter 23 (90ml) 1800 20 filter 7 (125ml) 1800 20 filter 8 (275 ml) ATA‐11CTD 3000 7 filter 14 (500 ml) filter 26 (10 ml) filter 15 (500 ml) filter 27 (90 ml) 100 21 ‐ ‐

Cruise Report HYDROMAR V (04.12.07 – 02.01.08) l’Atalante
page ‐ 59 ‐
Table 1.4.7.2: Sample list of hydrothermal fluids taken with the KIPS system

Cruise Report HYDROMAR V (04.12.07 – 02.01.08) l’Atalante
page ‐ 60 ‐

Cruise Report HYDROMAR V (04.12.07 – 02.01.08) l’Atalante
page ‐ 61 ‐

Cruise Report HYDROMAR V (04.12.07 – 02.01.08) l’Atalante
page ‐ 62 ‐
1.4.8 Hydrothermal Symbioses (by C. Borowski, and D. Fink)
The main goal for this cruise was to continue the investigations on the transfer of energy from vent fluids to symbiotic invertebrates started during earlier visits of the Logatchev hydrothermal vent field. As no slurp sampler was available in this cruise leg, we concentrated on symbiotic invertebrates that can be sampled with manipulator arm‐operated scoop nets, i.e., the dominant mussels Bathymodiolus puteoserpentis which are the major faunal biomass producers at the Logatchev vent sites Irina II and Quest. B. puteoserpentis is known from the Mid‐Atlantic Ridge (MAR) vent fields Snake Pit and Logatchev, and the mussels collected in the recently discovered hydrothermal vent fields Lilliput, Wideawake and Golden Valley on the southern MAR likely also belong to this species. B. puteoserpentis harbors two coexisting types of symbionts in its gill tissues: thiotrophic bacteria that use reduced sulfur compounds such as sulfide as an energy source and fix CO2 as a carbon source, and methanotrophic bacteria that use methane as both an energy and a carbon source. Our investigations during earlier cruises indicated that one or even both symbionts of B. puteoserpentis are also able to utilize H2 as an electron donor for CO2‐fixation ‐ a result that represents a milestone in symbiosis research because oxidation of H2 has never been shown for any other symbiont associated with hydrothermal vent invertebrates. The energy‐rich electron donors H2S, CH4 and H2 are available in the diffuse hydrothermal fluids emerging around the smoker structures of Irina II and Quest as a result of subsurface dilution of the hot endmember fluids with seawater. Their concentrations vary over time and space and play a major role in determining the biomass, activity and productivity of the vent community. We have defined these interactions between hydrothermal and biological processes as the geobiological coupling between vent fluids and symbiotic primary producers.
Recent investigations showed that the two symbiotic phylotypes associated with B. puteserpentis are identical to those found in the closely related species B. azoricus that lives in the northern MAR hydrothermal vent fields Rainbow, Lucky Strike and Menez Gwen (Duperron et al., 2006). Research on the energy transfer and the activity of the symbionts in B. puteoserpentis in Logatchev therefore gains more than only local importance.
Our work during this cruise leg concentrated to a large extent on sampling, dissecting, preparation and preservation of material for analyses that will be performed in the home laboratory. Our onboard work included also incubation experiments for the determination of carbon fixation rates. Subsequent measurements of 14C‐turnover by scintillation counting will follow in the home laboratories. The collection of animal material was strictly coordinated with the sampling of diffuse fluids for concentration analyses of CH4, H2S, H2 and with 8‐channel T‐Lance temperature measurements at the same spots in order to ensure the correlation of biological and environmental data (Tab. 1.4.8.1).

Cruise Report HYDROMAR V (04.12.07 – 02.01.08) l’Atalante
page ‐ 63 ‐
Table 1.4.8.1: Station list for hydrothermal symbiosis research

Cruise Report HYDROMAR V (04.12.07 – 02.01.08) l’Atalante
page ‐ 64 ‐
Goals and methods
1. Identification of the B. puteoserpentis symbiont that oxidizes H2 for carbon fixation, and identification of other potential energy sources for carbon fixation
Classic microbiological approaches for empirical assessment of physiological pathways of B. puteoserpentis symbionts are not applicable because cultivation of endosymbiotic bacteria outside of the host is not possible to this date and the mussels do not survive in aquaria. An alternative way for receiving information on the potential for physiological pathways of microorganisms can be genome sequencing. As the genome includes the entire physiological potential of an organism, the occurrence of a gene coding for a key enzyme can serve as an indication for a certain physiological pathway. This requires the availability of purified genotypes, which is not the case to this date for symbionts. We approached this problem by separating the different symbiont morphotypes with density gradient centrifugation. We dissected and homogenized the gills of freshly collected mussels, filtered the cell debris/symbiont mixture on micropore filters and centrifuged the homogenates in a Nycodenz density gradient. The consecutive density fractions were removed with pipettes, aliquots were in‐situ hybridized with specific oligonucleotide probes (Fluorescence In‐Situ Hybridization = FISH) and the separation of the different cell types was pre‐controlled on board under a fluorescent microscope. Further control of cell separation and preparation for genome sequencing will follow in the home laboratories.
2. Comparison of the rates at which different energy sources are used by the symbionts.
The uptake of H2 by symbiont containing gill tissue versus non‐symbiont containing foot tissue has been demonstrated earlier in incubation experiments by measuring H2 depletion with time in the medium. In order to determine carbon fixation rates, we incubated during this cruise fresh gill material with NaH14CO2 and added alternatively H2S or H2 as electron donors. Incubations without added electron donors were used as controls. The incubations were stopped after 30, 60, and 120 min, respectively, and the amount of incorporated 14C carbon will be measured by scintillation counting in the home laboratory. Additional incubations with NaH13CO2 will be analyzed by nanoscale secondary ion mass spectrometry (nanoSIMS). With this high‐resolution imaging technique, stable isotopic composition of biological material can be determined down to the sub‐micron level. NanoSIMS will visualize metabolically active cells, and will allow to calculate their uptake rates and to determine nutrient fluxes.
3. Quantification of symbionts in gill tissues
The activity of a symbiotic population in a host is not only determined by turnover rates of individual symbiont cells, but also by the number of active cells. Earlier in‐situ experiments showed that the symbiont abundance in mussel gill tissue can decrease dramatically only a few days after experimental displacement of the animals from

Cruise Report HYDROMAR V (04.12.07 – 02.01.08) l’Atalante
page ‐ 65 ‐
diffuse hydrothermal flux to sites without hydrothermal activity. In order to estimate the potential activity of a symbiont population on the basis of cell abundance, we currently develop at MPI‐Bremen methods for reliable determination of quantitative cell distribution in the three dimensional space of the host bacteriocytes and, on a larger scale, in the entire gill. We use 3D analyses with confocal laser scanning microscopy (LSM) and subsequent computer image analyses with specialized software. Our detailed dissection and fixation program of symbiont containing tissue which we performed with respect to later LSM analyses will allow quantification of symbionts throughout the entire gill lengths and separately for inner and outer demibranches. While standard FISH methods targeting ribosomal RNA will be used for the quantification, we will be able to localize activity patterns throughout the gills with special FISH methods targeting the messenger RNA products of functional genes that express key role enzymes in the various pathways of C‐fixation such as APR‐Reductase for CO2 fixation by H2S‐oxidation, Ni/Fe‐Hydrogenase for CO2‐fixation by H2‐oxidation and the large subunit of the Particulate Monooxigenase for the utilization of methane as an energy and carbon source. We will compare mussels collected at Irina II and Quest for potential differences between these sites.
4. Analyses of population genetics
One key question within the SPP 1144 concerns the biogeographic distribution of invertebrates on the equatorial Mid Atlantic ridge, and we investigate biogeographical patterns on the basis of genetic analyses by comparing eukaryote marker gene sequences such as for the genes COI, ND4, and 18S among populations collected in Logatchev, on the southern MAR, in the Gulf of Mexico and in the Gabon Fan. During this cruise leg we realized that B. puteoserpentis specimens collected at Irina II and Quest show morphological differences (Fig. 1.4.8.1): The gills of the Quest animals are generally far more developed and darker colored than those of Irina II specimens; the foot is much larger in Quest animals and the gonads of all Quest animals appeared to be ripe in contrast to those of Irina II. These differences may either represent different nutritional conditions or may point to the presence of two different (sub‐)populations separated by only 120 m distance between Quest and Irina II. Nutritional conditions as a factor will be investigated by cell quantification and determination of activity patterns (s. above). The question if genetic differentiation occurs at the two sites will be addressed with genetic analyses of ITS sequences from freshly collected specimens and from material collected during earlier cruises.
5. Growth rates of mussels
Mollusks record variations in the ambient water conditions as changes of shell structure and growth rate and by this act as bioarchives for environmental change. This is known from shallow water species (Mutvei et al. 1996, Richardson 2001, Gaspar et al. 2004) and has recently been shown also for the hydrothermal vent mussel Bathymodiolus brevior

Cruise Report HYDROMAR V (04.12.07 – 02.01.08) l’Atalante
page ‐ 66 ‐
from the western Pacific North Fiji Basin (Schöne & Giere 2005). Hydrothermal vent mussels deposit the isotope δ18O in their shells in isotopic equilibrium with ambient sea water (Roux et al. 1985), and the δ18O ratio in seawater is linked to water temperature (Anderson & Arthur 1983).
Fig. 1.4.8.1: B. puteoserpentis specimens collected at the base of the Irina II structure (left) and from the T‐logger field near the Quest smoking crater (right). Note the different appearances of the gills, foot and gonads.
The shells of the mussels collected during this cruise will serve us for analyses of shell growth patterns in Logatchev and will show if differences exist between Quest and Irina II. This information can help the interpretation of above investigations (see 3. and 4.). Comparison with shells collected during earlier expeditions will enable us to align growth patterns among animals sampled at different times. By this we anticipate to extend the range of observation time beyond the life span of individual mussels. The results will be correlated with the geophysical long‐term measurements on temperature and microseismicity in Logatchev which give information on hydrothermal activity patterns. These measurements were started in 2005 and have been continued with this cruise. A very important task is also the comparison with growth patterns of mussels from the recently discovered hydrothermal vent fields on the southern MAR, which in contrast to Logatchev are regarded to be highly influenced by young volcanism and frequent hydrothermal events. By analyses of δ18O‐ratio micro‐profiles along the major growth lines of the shells, we hope to be able to detect major hydrothermal events that happened in the southern MAR sites in the recent past. Complementary information from Logatchev specimens will significantly help the interpretation of such signals.

Cruise Report HYDROMAR V (04.12.07 – 02.01.08) l’Atalante
page ‐ 67 ‐
1.4.9 Metagenomics (by M. Schattenhofer)
Introduction
Metagenomics is defined as the genomic analysis of the collective genomes of an assemblage of organisms in a certain habitat (Handelsman et al., 2002). The metagenome analysis has proved to be a useful tool to get deeper insights into the biochemical potential of microorganisms, e.g. of microbial communities at hydrothermal vents. For the construction of metagenomic libraries, usually, large genomic DNA fragments (>35 kbp) are directly extracted from an environmental sample, cloned into high capacity vectors and stably maintained in E. coli. The libraries can be randomly sequenced or subsequently be screened for phylogenetic marker genes and functional genes. The genetic context of these genes can be analysed in order to get new and interesting insights into the genetic potential of microbial communities (Riesenfeld et al., 2004).
Objective
The aim of the participation in cruise HYDROMAR V to the Logatchev hydrothermal field was the sampling of free living microbial communities at few characteristic hydrothermally influenced sites with high biomass for metagenome analyses. Preferred samples were sediments and microbial mats as several grams of a microbial mat or several hundred grams of sediment contain generally sufficient cells for a metagenome study. The samples should be taken in a targeted way, e.g. by the ROV, at well characterised sites.
Methods
Sediment core was sectioned into 1 cm slices prior to further treatment. Sediment samples were fixed with 50% ethanol in phosphate buffered saline (PBS) and 4% formaldehyde (FA)/PBS, respectively, for cell count determination, and community structure analysis. The major part of the sample was deep frozen for DNA extraction (‐80°C) in the home laboratory.
High amount of deep‐water and plume samples (180 l) of the CTD‐rosette were pumped with a peristaltic pump and filtered on 142 mm cellulaseacetat membranes (0.22 μm), which can be used for metagenomic analysis. Additionally, 1 l was concentrated on polycarbonate membrane filters (0.22 μm) for DNA‐extraction. Plume samples were fixed with 1% FA for 2 h for CARD‐FISH experiments.
Samples and Preliminary Results
Samples were taken at different characteristic sites by the ROV and the CTD‐rosette sampler and included the following material:

Cruise Report HYDROMAR V (04.12.07 – 02.01.08) l’Atalante
page ‐ 68 ‐
1) One sediment core was taken in an area close to the marker 20 during Station 27ROV (Site Quest, Fig. 1.4.9.1).
2) Hydrothermal plume (3 stations) was collected using the CTD‐rosette sampler. About 170 l of hydrothermal plume from ATA12CTD (water depth 3000 m) and about 180 l of plume sampled during ATA19CTD (water depth 2817 m) and ATA29CTD (water depth 2895 m) were filtered for DNA extraction.
Fig 1.4.9.1: Sampling of sediment cores with a push corer and temperature measurement at the site Quest.
Summary and Outlook
The analysis of the samples with respect to cell counts, community structure, as well as DNA content will be carried out in the home laboratory in order to determine the best target for a metagenome study. Subsequently few metagenomic libraries will be constructed and analysed.
1.4.10 ROV deployments during HYDROMAR V (by T. Kuhn, M. Pieper, D. Cormany, A. Foster, C. Hinz, A. Meier, I. Suck, K. Wietkewicz)
Description of ROV KIEL 6000
ROV KIEL 6000 is an electric, work‐class ROV with a depth rating of 6000m. It was built by SCHILLING ROBOTICS LLC within their Quest production line and is equipped with 7 brushless thrusters each with 210 kgf peak thrust, 1x 7‐function, spatially‐controlled and 1x 5‐function, rate‐controlled manipulator, a sonar system as well as 1 HDTV video camera, 2 high‐resolution color zoom cameras, 4 b/w observation cameras and 1 digital still camera. All color cameras are mounted on pan and tilt units. Scientific tool packages include a laser video measurement system and CTD as well as a tool sled mounted underneath the ROV frame with 2 hydraulically driven trays, a sample basket and up to 130 kg of scientific payload.

Cruise Report HYDROMAR V (04.12.07 – 02.01.08) l’Atalante
page ‐ 69 ‐
The heart of the ROV is a digital telemetry system (DTS) with its basic unit, the communication node, a small, lightweight, 16‐port module that can be used alone or daisy‐chained for additional functionality. The node features a Gigabit Ethernet backbone, and each port can be individually configured for serial, video, or Ethernet. The DTS™ node routes power and telemetry between the system and all instruments on the WROV and tool skids. Four nodes with 64 ports are supplied with the ROV Kiel 6000 system to operate all standard on board equipment, 24 ports are available for additional scientific instruments. The manipulators are hydraulically driven, 2 valve packs with 12 hydraulic valves each (including 4 proportional valves) provide additional access for scientific instruments to the hydraulic system.
ROV Kiel 6000 is run in life boating mode, i.e., the ROV is directly linked to the surface vessel via a steel‐armoured, fiber‐optical umbilical. No tether management is used. The ROV control system allows station keeping (±0.1 m) and automatic flight control such as automatic displacement, cruise and trim. Navigation is realized by the USBL‐based POSIDONIA™ system supported by the SONARDYNE ROV‐Homer™ system. The ROV system works with a 19mm, 6500m fiber‐optical umbilical wound up in 20 layers on an electrically‐driven winch. Two fibers are used simultaneously during a dive and a third backup fiber is also connected.
The ROV system weights approximately 65 t. It comes with 5 20’ containers: 1 control van, 1 power/workshop van, 1 winch container (20’ high cube), 1 ROV transport container (20’ high cube), and 1 additional transport container.
In August 2007 the ROV was successfully tested during cruise ROVARK with RV SONNE in the Kermadec Volcanic Arc in 1800 m water depth.
Technical preparation
ROV KIEL 6000 is a mobile system and is, therefore, meant to be used on ships‐of‐opportunity. The system has already proven this flexibility since it was used on the German R/V Sonne and (now) the French N/O l’Atalante. In spite of this general flexibility, a number of technical preparations and adaptations were necessary to allow the use of ROV KIEL 6000 onboard l’Atalante. The following section will shortly describe this work.
The winch of ROV KIEL 6000 is permanently installed in a 20’ High Cube ISO container. 6500 m of a 19 mm umbilical is wound in 20 layers onto the winch drum. The whole winch weights 28 t. In order to safely install the winch on the working deck of l’Atalante, eight base plates were welded to the metal deck. Each plate contained a twist lock to fix the winch container on it. Each plate was made to hold 10 t of loading (Fig. 1.4.10.2).
The winch could not be installed 90° to the long axis of the working deck but had to be slightly twisted (approx. 10°) in order to fit with the deck layout, the other ROV containers and the fact that the ROV sheave was not installed in the center of the A‐frame but to the site of it (Fig. 1.4.10.2).

Cruise Report HYDROMAR V (04.12.07 – 02.01.08) l’Atalante
page ‐ 70 ‐
To launch and recover the vehicle the deployment frame of ROV KIEL 6000 (red part in Fig. 1.4.10.3) was used. This frame normally consists of 3 moduls. However, the upper module was removed and the “structure intermediaire” of R/V l’Atalante was used instead (white part above red deployment frame in Fig. 1.4.10.3). Two adapters were necessary to connect the deployment frame and the “structure intermediaire”. They were manufactured by FHF GmbH in Bremen, the company that also built the deployment frame.
Lifting of the ROV was carried out using a flexible lift line provided by the vessel and an overshot tool provided by the ROV team. After launching the vehicle into the water, the overshot tool (latch) was mechanically released. Upon recovery it was necessary to fly the ROV underneath the deployment frame (the A‐frame was then completely tilted out). The overshot tool slit down the ROV umbilical until it latches into the ROV lift point. This procedure worked well until a swell of approximately 3.5 m thanks to the excellent co‐operation between deck’s crew and ROV team.
ROV dives
In total 8 dives were carried out on 8 working days in the Logatchev hydrothermal field. Given the fact that this cruise was the first scientific deployment of ROV KIEL 6000 this result is a great success for the ROV team and the crew of R/V l’Atalante. Further statistics of the ROV dives are summarized in Tab. 1.4.10.1.
ROV stations usually started at 6:30 am LT with the pre‐dive, launch starts at 8:00 am. Launch of the vehicle was postponed during the first two dives because of unstable weather and rather high swell. Some discussion was necessary ahead of these first dives as to whether launch the vehicle or not. In the end we decided to dive even if the weather was unsafe and the swell rather high (up to 3.5 m during sea state 5‐6). Therefore, 10 persons were necessary to launch the system including the ROV winch and lift line winch drivers. The launch procedure was as follows:
Lifting the ROV underneath the plate of the deployment frame, move the A‐frame to its out‐tilted position, launch the ROV into the water, switch on high power, release the overshot tool, move ROV some meters away from stern of vessel, attach 3 floats to umbilical, payout 50‐60 m of umbilical, attach 9 floats to umbilical, start descend.

Cruise Report HYDROMAR V (04.12.07 – 02.01.08) l’Atalante
page ‐ 71 ‐
Fig. 1.4.10.1: ROV KIEL 6000 onboard R/V l’Atalante (Foto: N. Augustin).
Fig. 1.4.10.2: Installation of the 28t winch with 6500 m of 19 mm umbilical for ROV KIEL 6000. Eight especially made base plates are used to fix the winch on deck (Foto: A. Massol, Ifremer).

Cruise Report HYDROMAR V (04.12.07 – 02.01.08) l’Atalante
page ‐ 72 ‐
Fig. 1.4.10.3: Launch of ROV KIEL 6000 from R/V l’Atalante during the seatrials. The red deployment frame (belongs to the ROV system) was fixed to the vessel’s “structure intermediaire” (white structure above red frame) with 2 adapters. The ROV was lifted with the white, flexible lift line (Foto: A. Massol, Ifremer).

Cruise Report HYDROMAR V (04.12.07 – 02.01.08) l’Atalante
page ‐ 73 ‐
Fig. 1.4.10.4: Position of the ROV winch container, the control van, the ROV and its deployment frame at the rear of l’Atalante’s working deck. The winch to the left hand side of the ROV winch was used to pay in/out of the lift line to lift the ROV (Foto: A. Massol, Ifremer).
Table 1.4.10.1: Summary of ROV dives during HYDRMAR V
Station # Date (UTC) Dive # Station duration1 (hrs:min)
ROV bottom time (hrs:min)
% bottom time
ATA09ROV 17.12.2007 6 09:08 03:51 42
ATA13ROV 18.12.2007 7 09:28 03:16 35
ATA15ROV 19.12.2007 8 10:13 06:29 63
ATA17ROV 20.12.2007 9 10:20 07:18 71
ATA21ROV 21.12.2007 10 12:11 08:15 68
ATA24ROV 22.12.2007 11 12:20 09:02 73
ATA27ROV 23.12.2007 12 13:29 09:12 68
ATA30ROV 24.12.2007 13 08:33 05:31 65
Total = 8 Dives 84:42 52:54 62 1 includes launch from and recovery onto vessel
Cruise Report HYDROMAR V (04.12.07 – 02.01.08) l’Atalante
page ‐ 74 ‐
Recovery of the vehicle was the upper procedure backwards. Since the swell was always rather high it was essential to quickly latch the overshot tool once the floats had been removed. In order to prevent heavy and sudden loads on the umbilical we always tried to latch the tool when the ROV was in 1‐2 m water depth. This worked out smoothly and guaranteed a safe return of the vehicle even in rather heavy sea. Descend and ascend velocities were between 0.6 and 1.0 m/s depending on the buoyancy of the vehicle (i.e. what scientific devices were carried).
First dives were scheduled to recover during daylight, i.e. approximately 6:30 pm LT, later dives lasted until up to 21:00 pm LT for recovery of the ROV back to deck. During the dives, the following scientific tools were mounted on the ROV either to transport and place them on the seafloor, recover and carry them back to the vessel, or use them as sampling tools:
• Ocean Bottom Tiltmeter (OBT)
• Ocean Bottom Accelerometer (OBA)
• Ocean Bottom Pressuremeter (OBP)
• KIPS fluid sampling system
• Major fluid samplers
• 1‐channel temperature sensor (mounted on the noozle of KIPS)
• 8‐channel temperature lance
• SMONI (1‐channel, long‐term high‐temperature logger)
• Push cores
• Nets for biological sampling
• He sampler
Apart from these mobile scientific tools, there are a number of other permanently installed tools producing scientific data such as:
• CTD
• Sonar system (400 m range @ ± 1 m resolution)
• Laser Camera (for the video‐controlled measuring of distances at objects on the seafloor)
Three colour video cameras (1 HDTV and 2 Standard PAL cameras) produce a large amount of video data. Videos from the standard cameras are permanently and synchronously recorded as mpeg2 files to a video server. HDTV videos are recorded only at scientific request. They are stored in DVCPRO‐HD format on a MacintoshPro

Cruise Report HYDROMAR V (04.12.07 – 02.01.08) l’Atalante
page ‐ 75 ‐
and as mpeg2 files on the same video server as the standard videos. Approximately one hour of HDTV video can be stored per dive.
The video data stored on the video server is available to all scientists via the vessel’s intranet using a web browser. The so‐called Proxsys™ software on the server enables video previews (as mpeg4), cut and download of selected video sequences (as mpeg2) as well as incorporation of metadata using the scientist’s browser from their cabin.
Any other data produced during a dive (such as navigation, depth, CTD data) are time‐referenced (UTC) and stored in a data base (Davis‐ROV™ by Werum GmbH). This data base is also available from the intranet using a standard web browser. D‐ROV is very similar in terms of its structure and application as the D‐Ship system that is installed on all large German research vessels.
ROV KIEL 6000 performed very well during all dives. There was no general or critical fault of most subsystems or components. Navigating the ROV, positioning it on requested spots at the seafloor, station keep, manipulator work, handling of the umbilical, and co‐operation with the vessel all worked out smoothly.
There was still some electronic noise on the colour cameras which is caused by an unclean power supply. The software controlling the Laser camera showed some instabilities and the digital still camera did not work due to the wrong firmware settings in one of the controller boards. The Laser camera software could be stabilized during the cruise. The ROV manufacturer will provide an additional tool to provide clean power supply for the colour cameras as well as a new board for the digi cam. Both parts will be delivered to Recife. Therefore, all three technical problems should not occur during the second leg of this l’Atalante cruise.
However, the Posidonia USBL navigation did not work during most of the dives as soon as the ROV was in reach of the seafloor (i.e., either at or roughly up to 30 m above it). This could be caused by vibrations that change the frequency of the Posidonia transducer at the ROV or acoustic noise that changes signals under water or interferes with them. The following components could cause this problem:
DVL: unlikely since it uses a different frequency and the head is orientated vertically down Sonar: unlikely since it uses a different frequency and the head is orientated horizontally forward
Vessel’s noise: unlikely since with other tools (like the CTD) Posidonia works fine
The following tests were performed:
• switch off thrusters: no result
• switch off DVL: no result
• cover transducer head with rubber mat to better shield it from vibration and/or acoustic noise: better results
• cleaning all plugs: better results

Cruise Report HYDROMAR V (04.12.07 – 02.01.08) l’Atalante
page ‐ 76 ‐
During the last dive Posidonia worked well. We are not sure if the last two tests/measures really were the cause of the problem. The next cruise will have to prove this.
Furthermore, there was a difference in the depth readings between the ROV depth sensor and the CTD depth. This difference was not constant but changed with depth. Its depth profile is similar but not equal to the sound velocity – depth profile (Fig. 1.4.10.5), but not to the temperature vs. depth or salinity vs. depth profiles. Comparison of depth readings from other cruises (Hydromar I with ROV Quest 5 and Hydromar III with ROV Jason 2) at the same locations revealed that all readings of the depth sensors of ROV KIEL 6000 and Quest 5 are similar whereas those of Jason 2 are different from both the depth sensor and the CTD. The reason for this difference, especially for its change over depth is unclear, since both sensors use strain gauge sensors. Both sensors should be checked under carefully set laboratory conditions to find out which sensor is correct. Afterwards, the other sensor can be re‐calibrated.
Fig 1.4.10.5: left: ROV depth versus difference between ROV depth sensor and ROV CTD depth; right: ROV depth vs. sound velocity. Note that there is no constant offset between the two depth sensors at the ROV and that there is a general similarity between the two graphs.
1.5 Achnowledgements The scientists of Atalante Leg 1 would like to thank Capt. Philippe and his crew for superb support at sea and thekind atmosphere provided during the entire cruise. We also thank the Senatskommission für Ozeanographie, the Deutsche Forschungsgemeinschaft and the Leitstelle Meteor/Merian for making this cruises possible.
1.6 References Andersson TF, Arthur MA (1983) Stable isotopes of oxygen and carbon in their application to
sedimentologic and paleoenvironment problems. In: Arthur MA, Anderson TF, Veizer J, Land LS (eds) Stable Isotopes in Sedimentary Geology. Society of Economic Paleontologists and Ecologists, Dallas, p 1‐151.

Cruise Report HYDROMAR V (04.12.07 – 02.01.08) l’Atalante
page ‐ 77 ‐
Baker, E.T., Tennant, D.A., Feely, R.A., Lebon, G.T. and Walker, S.L. (2001) Field and laboratory studies on the effect of particle size and composition on optical backscattering measurements in hydrothermal plumes. Deep‐Sea Research. Part I: Oceanographic Research Papers 48, 593‐604.
Borowski, C. and cruise participants (in preparation) Cruise Report HYDROMAR III, RV Maria S. Merian MSM04/3, January/February 2007.
Duperron S, Bergin C, Zielinski F, Blazejak A, Pernthaler A, McKinness ZP, Cavenaugh CM, Dubilier N (2006) A dual symbiois shared by two mussel species, Bathymodiolus azoricus and Bathymodiolus puteoserpentis (Bivalvia: Mytilidae), from hydrothermal vents along the northern Mid‐Atlantic Ridge. Environmental Microbiology 8: 1441‐1447.
Fabian, M. and Villinger, H. (submitted) Long‐term tilt and acceleration data from the Logatchev Hydrothermal Vent Field, Mid‐Atlantic Ridge, measured by the Bremen Ocean Bottom Tiltmeter (OBT). submitted to Geochemistry Geophysics Geosystems.
Fabian, M. and Villinger, H. (2007) The Bremen Ocean Bottom Tiltmeter (OBT) ‐ A Technical Article on a New Instrument to Monitor Deep Sea Floor Deformation and Seismicity Level. Marine Geophysical Researches, 28, 13‐26.
Fabian, M. and Heesemann, B. (2006) Neigungswaage für Unterwasser‐ und Hochdruckanwendungen (deep sea level), Deutsches Patent‐ und Markenamt, Gebrauchsmuster (registered design) DE202006013066U1 14.12.2006, Universtät Bremen.
Fahey, R.C. and Newton, G.L. (1987) Determination of low‐molecular‐weight thiols using monobromobimane fluorescent labeling and high‐performance liquid chromatography. Methods Enzymol., 143, 85 – 96.
Gaspar MB, Pereira AM, Vasconcelos P, Monteiro CC (2004) Age and growth of Chamelea gallina from the Algarve coast (southern Portugal): influence of seawater temperature and gametogenic cycle on growth rate. Journal of Mollusk Studies 70:371‐377.
German, C.R., Klinkhammer, G.P., Edmond, J.M., Mitra A., and Elderfield H. (1990) Hydrothermal scavenging of rare‐earth elements in the ocean. Nature 345, 516‐518.
Handelsman, J., Liles, M., Mann, D., Riesenfeld, C., and Goodman, R.M. (2002) Cloning the metagenome: Culture‐independent access to the diversity and functions of the uncultivated microbial world. In Functional Microbial Genomics. San Diego: ACADEMIC PRESS INC, pp. 241‐255.
Kuhn, T., Ratmeyer, V., Petersen, S., Hekinian, R., Koschisky‐Fritsche, A., Seifert, R., Borowski, C., Imhoff, J., Türkay, M., Herzig, P., Alexander, B., Augustin, N., Birgel, D., de Carvalho, L. M., Engemann, G., Ertl, S., Franz, L., Grech, C., Jellinek, T., Klar, S., Küver, J., Kulescha, F., Lackschewitz, K., Renken, J., Ruhland, G., Scholten, J., Schreiber, K., Süling, J., Westernstöer, U., and Zielinski, F. (2004) The Logtachev hydrothermal field ‐ revisited: new findings of the R/V Meteor cruise Hydromar (M60/3): InterRidge News 13, 1‐4
Lackschewitz, K.S., M. Armini, N. Augustin, N. Dubilier, D. Edge, G. Engemann, M. Fabian, J. Felden, P. Franke, A. Gärtner, D. Garbe‐Schönberg, H.‐H. Gennerich, D. Hüttig, H. Marbler, A. Meyerdierks, T. Pape, M. Perner, M. Reuter, G. Ruhland, K. Schmidt, T. Schott, M.
Cruise Report HYDROMAR V (04.12.07 – 02.01.08) l’Atalante
page ‐ 78 ‐
Schroeder, G. Schroll, C. Seiter, J. Stecher, H. Strauss, M. Viehweger, S. Weber, F. Wenzhöfer, F. Zielinski (2005) Longterm study of hydrothermalism and biology at the Logatchev field, Mid‐Atlantic Ridge at 15°N (revisit 2005) (HYDROMAR II). Meteor Berichte 05, Mid‐Atlantic Expedition 2005, Cruise No. 64, Leg 2.
Lilley, M.D., Feeley, R.A., and Trefry, J.H. (1995) Chemical and biochemical transformations in hydrothermal plumes. In: Seafloor Hydrothermal Systems: Physical, Chemical, Biological, and Geological Interactions. S.E. Humphris, R.A. Zierenberg, L.S. Mullinaux, R. Thompson (Editors). American Geophysical Union, Washington D.C., pp: 369‐391.
Mutvei H, Dunca E, Timm H, Slepukhina T (1996) Structure and growth razes of bivalve shells as indicators of environmental changes and pollution. Bulletin de lʹInstitut océanographique, Monaco 14:65‐72.
Ono, S. Wing, B., Johnston, D. Farquhar, J., and Rumble, D. (2006) Mass‐dependent fractionation of quadruple stable sulfur isotope system as a new tracer of sulfur biogeochemical cycles. Geochimica et Cosmochimica Acta, 70, 2238 – 2252.
Pfender, M. and Villinger, H. (2002) Miniaturized data loggers for deep sea sediment temperature gradient measurements. Marine Geology, 186, 557 – 570.Baker, E.T., and Milburn, H.B., 1997. MAPR: a new instrument for hydrothermal plume mapping. RIDGE Events 8, 23‐25.
Rethmeier, J., Rabenstein, A., Langer, M., and Fischer, U. (1997) Detection of traces of oxidized and reduced sulfur compounds in small samples by combination of different high‐performance liquid chromatography methods Journal of Chromatography A, 760, 295 – 302.
Richardson CA (2001) Molluscs as archives of environmental change. Oceanography and Marine Biology: an Annual Review 39:103‐164.
Riesenfeld, C.S., Goodman, R.M., and Handelsman, J. (2004) Uncultured soil bacteria are a reservoir of new antibiotic resistance genes. Environ Microbiol 6: 981‐989.
Roux M, Rio M, Fatton E (1985) Clam growth and thermal spring activity recorded by shells at 21°N. Biological Society of Washington Bulletin 6:211‐221.
Schöne BR, Giere O (2005) Growth increments and stable isotope variation in shells of the deep‐sea hydrothermal vent bivalve mollusk Bathymodiolus brevior from the North Fiji Basin, Pacific Ocean. Deep‐Sea Research I 52:1896‐1910.
Shanks, W. C. I. (2001) Stable isotopes in seafloor hydrothermal systems. In Valley, J. W., and Cole, D. R., eds., Stable Isotope Geochemistry, Mineralogical Society of American v. 43, p. 469‐526.
1.7 Appendix
see next pages

Cruise Report HYDROMAR V (04.12.07 – 02.01.08) l’Atalante
page ‐ 79 ‐
1.7.1 Extended list of operations extended list of operations (** denotes positions based on Jason 2 dives in January 2007)
station (date/time UTC)
instruments used / samples / comments
Location
16.12.07
ATA‐01CTD 09:29 – 10:55
LADCP, water sampling, CTD background station @ ~ 5100m; 21 bottles; no MAPR’s attached (station aborted due to communication failure @ 1484m)
15°09.40’N / 44°50.50’W
ATA‐02CTD 11:31 – 12:28
LADCP, water sampling, CTD (station aborted due to communication failure @ 590m)
15°09.40’N / 44°50.50’W
ATA‐03CTD 14:06 – 14:30
LADCP, water sampling, CTD (station aborted due to communication failure @ 122m)
15°09.40’N / 44°50.50’W
transit to first OBS site
ATA‐04OBS 17:12
deployment of OBS #2 No. 0906‐043, radio: 159.480 MHz (flag broke off during deployment)
14°46.886’N/44°59.150’W @ 3459 m
ATA‐05OBS 18:14
deployment of OBS #4 No. 0906‐052, radio: 154.585 MHz
14°46.886’N/45°03.581’W @ 4063 m
ATA‐06OBS 19:01
deployment of OBS #3 No. 0906‐044, radio: 159.480 MHz
14°43.630’N/45°02.107’W @ 4083 m
ATA‐07OBS 19:50
deployment of OBS #1 No. 0906‐045, radio: 160.785 MHz
14°43.649’N/44°57.923’W @ 3058 m
OBS sites

Cruise Report HYDROMAR V (04.12.07 – 02.01.08) l’Atalante
page ‐ 80 ‐
extended list of operations (** denotes positions based on Jason 2 dives in January 2007)
station (date/time UTC)
instruments used / samples / comments
Location
ATA‐08MAPR 00:57 – 09:09
Tow‐Yo along axis 5 MAPR @ 20m, 40m, 75m, 125m, 250m above bottom weight + Posidonia + Pinger
14°42.00’N / 44°58.10’W to
14°48.80’N / 44°59.25’W
17.12.07
ATA‐09ROV deployment:10:34 on bottom: 13:48 15:01
Tools: OBP‐1, ADCP, 3x push cores; 3 small bionets, spare IFM beacon on ROV, 2 marker deployment: OBP‐1 @ OBT‐site
ship at 14°45.18’N/44°58.77’W
14°45.196’N/44°58.783’W**
15:10 16:07
move to Irina 2 (~80m) deploy: ADCP tripod next to small black smoker @ „Irina 2“
14°45.165’N/44°58.744’W**
16:32
sampling: mussels @ „Irina 2“ at diffuse outlet (for incubation experiments)
14°45.167’N/44°58.749’W**
16:58 17:20 off bottom: 17:40 recovery on deck: 19:42
move back to OBT site (~80m) recovery: OBT‐2 @ OBT‐site
14°45.194’N/44°58.784’W**

Cruise Report HYDROMAR V (04.12.07 – 02.01.08) l’Atalante
page ‐ 81 ‐
extended list of operations (** denotes positions based on Jason 2 dives in January 2007)
station (date/time UTC)
instruments used / samples / comments
Location
ATA‐10CTD 20:39 – 00:18
rosette with CTD, LADCP, 1x MAPR, 21 bottles at site of MMP mooring; bottles 3 and 18 not closed
14°45.272’N/44°58.735’W
18.12.07
ATA‐11CTD 02:06 – 05:16
rosette with CTD, LADCP, 1x MAPR, 21 bottles; bottle 3 not closed
14°44.996’N/45°05.000’W
ATA‐12CTD 07:03 – 09:11
rosette with CTD, LADCP, 21 bottles at site of MMP mooring, sampling for metagenomics group; bottle 9 not closed
14°45.271’N/44°58.709’W
ATA‐13ROV deployment:10:56 on bottom: 13:24
Tools: Smoni, 1x Ti‐major sampler, 2x He‐sampler, 3x push core; 2 small bionets, 1 net with lid, 2 marker move to site “A”
ship at 14°45.070’N/44°58.575’W
14°45.046’N/44°58.607’W**
14:29 14:35 14:40 15:06 15:23
KIPS hot fluid sampling at small cpy‐lined orifice @ site „A“ (3 bottles) in 2928m water depth bottle A1 = 13ROV‐1; TKIPS = 240‐260°C pH=7.6 Cl=n.d. bottle A2 = 13ROV‐2; TKIPS = 260‐295°C pH=7.8 Cl=n.d. bottle A3 = 13ROV‐3; TKIPS = 250‐306°C pH=n.d. Cl=n.d. T=very variable; Tmax 317°C 8‐channel T‐probe; Tmax 180°C at same vent (sample 13ROV‐4). Orifice is too small for the probe. sampling of shrimp with net (13ROV‐5); net empty upon recovery
15:27 move to Anna Louise 1 (~60m) 14°45.057’N/44°58.641’W**
17:40 18:18 18:22 18:25 18:28 18:30 off bottom: 18:40 recovery on deck: 20:24
arrived at Anna Louise sampling: KIPS hot fluid sampling of black smoker AL1 @ „Anna Louise“ in 2938m water depth bottle B4 = 13ROV‐6; TKIPS = 353°C pH=6.6 Cl=n.d. bottle B5 = 13ROV‐7; TKIPS = 352°C pH=5.3 Cl=n.d. bottle B6 = 13ROV‐8; TKIPS = 351°C pH=n.d. Cl=n.d. bottle C7 = 13ROV‐9; TKIPS = 352°C pH=8.3 Cl=n.d. bottle C8 = 13ROV‐10; TKIPS = 352°C pH=5.4 Cl=555mMT=352.3±0.5°C; Tmax 353°C
ATA‐14CTD 21:37 – 09:00
Tow‐Yo with rosette, CTD, LADCP, 1x MAPR, 21 bottles; bottle 3 not closed
14°44.687’N/44°57.656’W to
14°46.070’N/45°00.115’W

Cruise Report HYDROMAR V (04.12.07 – 02.01.08) l’Atalante
page ‐ 82 ‐
extended list of operations (** denotes positions based on Jason 2 dives in January 2007)
station (date/time UTC)
instruments used / samples / comments
Location
19.12.07
ATA‐15ROV deployment:10:00 on bottom: 12:32
Tools: OBA, Smoni, 3x push cores; 3 small bionets, 2 marker deployment: OBA west of Quest crater
ship at 14°45.195’N/44°58.815’W
14°45.160’N/44°58.855’W
17:37
at Quest musselbed in a water depth of 3045m
14°45.174’N/44°58.833’W**
17:50 17:59 18:04 18:08 18:13 18:28 19:01 off bottom: 19:07 recovery on deck: 20:19
8‐channel T‐probe (15ROV‐1; Tmax at lowermost sensor 192°C underneath musselbed at T‐logger #13) KIPS diffuse fluid sampling at base of T‐logger #13 bottle C9 = 15ROV‐2; TKIPS = 10.8°C bottle C8 = 15ROV‐3; TKIPS = 2.9°C bottle C7 = 15ROV‐4; TKIPS = 4.9°C bottle B6 = 15ROV‐5; TKIPS = 4.8°C sampling T‐logger #13 with attached mussels (15ROV‐6) sampling mussels at T‐logger #13 with net (15ROV‐7). Co‐sampling of two sulfide pieces (anhydrite‐pyrite‐pyrrhotite) in the base of the net.
ATA‐16CTD 21:02 – 08:30
Tow‐Yo with rosette, CTD, LADCP, 1x MAPR, 21 bottles;
14°44.88’N/44°57.65’W to
14°44.88’N/45°01.00’W
20.12.07
ATA‐17ROV deployment:10:01 on bottom: 11:42
Tools: Smoni, 1x Ti‐major sampler, 2x He‐sampler, 3x push cores; 3 small bionets, 2 marker
ship at 14°45.095’N/44°58.66’W
12:05
move to site “B” rock sampling (hematite‐stained and silicified talus) on southern rim of crater (17ROV‐1) in a water depth of 2979m
14°45.100’N/44°58.684’W**

Cruise Report HYDROMAR V (04.12.07 – 02.01.08) l’Atalante
page ‐ 83 ‐
extended list of operations (** denotes positions based on Jason 2 dives in January 2007)
station (date/time UTC)
instruments used / samples / comments
Location
13:08
sampling of small cpy‐lined chimney piece (17ROV‐2; piece lost)
13:36 13:40 13:44 14:02 14:28 15:03
sampling: KIPS hot fluid sampling of black smoker chimney B4 @ site „B“ in a water depth of 2978m bottle C9 = 17ROV‐3; TKIPS = 363°C pH=3.8 Cl=545mMbottle C8 = 17ROV‐4; TKIPS = 357°C pH=5.8 Cl=570mMbottle C7 = 17ROV‐5; TKIPS = 358°C pH=5.9 Cl=570mMT‐data not logged; Tmax 363°C 8‐channel logger deployment (17ROV‐6) at tip of smoker B4 (T1 = 446 ± 5°C, T2 = ‐ , T3 = 270°C, T4 = 230°C, T5 = 180°C, T6 = 135°C, T7 = 95°C, T8 = 70°C; record seems unreliable) He‐Sample at smoker B4 (17ROV‐7) deployment: Smoni deployment @ smoker B4 of site „B“ for one year (sampling rate = 15 sec).
16:10
move to site “Irina 1” (~45m) sampling: KIPS hot fluid sampling of black smoker I3 @ site „Irina 1“ in a water depth of 2960m
14°45.076’N/44°58.668’W**
16:10 16:14 16:18 16:22 16:25 16:29 17:12 18:04 off bottom: 19:00 recovery on deck:
bottle B6 = 17ROV‐8; TKIPS = 301‐363°C pH=7.1 Cl=565mMbottle B5 = 17ROV‐9; TKIPS = ~360°C pH=6.9 Cl=565mMbottle B4 = 17ROV‐10; TKIPS = 360‐366°C pH=6.8 Cl=560mMbottle A3 = 17ROV‐11; TKIPS = 350‐369°C pH=6.9 Cl=565mMbottle A2 = 17ROV‐12; TKIPS = 334‐369°C pH=6.8 Cl=561mMbottle A1 = 17ROV‐13; TKIPS = 370‐375°C pH=5.9 Cl=557mM(T‐data not logged; Tmax 375°C He‐Sample at smoker I3 (17ROV‐14) 8‐channel T‐probe deployment in the pit ofthe crater (17ROV‐15) (Tmax for the individual sensors: T= >400°C)

Cruise Report HYDROMAR V (04.12.07 – 02.01.08) l’Atalante
page ‐ 84 ‐
extended list of operations (** denotes positions based on Jason 2 dives in January 2007)
station (date/time UTC)
instruments used / samples / comments
Location
20:20
ATA‐18CTD 21:42 – 00:29
CTD, LADCP, 1x MAPR, 21 bottles
14°50.996’N/44°58.802’W (at 3513 m water depth)
ATA‐19CTD 02:07 – 04:22
CTD, LADCP, 1x MAPR, 21 bottles sampling for metagenomics group
14°45.273’N/44°58.734’W (at 3059 m water depth)
ATA‐20CTD 06:03 – 08:51
CTD, LADCP, 1x MAPR, 21 bottles
14°50.996’N/44°58.802’W (at 3810 m water depth)
21.12.07
ATA‐21ROV deployment:11:01 on bottom: 13:21
Tools: 3x push cores; 4 small bionets, 2 marker, ROV beacon
ship at 14°45.095’N/44°58.66’W
at Anyas Garden 14°45.171’N/44°58.771’W**
14:44 14:54 15:22
8‐channel T‐probe deployment (21ROV‐1) (T1=86°C,T2= ‐ ,T3=86°C,T4=79°C,T5=69°C,T6=62°C,T7=55°C,T8=44°C) 8‐channel T‐probe deployment (21ROV‐2) (T1=48°C,T2= ‐ ,T3=39°C,T4=34°C,T5=29°C,T6=23°C,T7=18°C,T8=13°C) push core at Anyas Garden in a water depth of 3053m (21ROV‐3; failed)
move to Irina 2 (~40m) 14°45.167’N/44°58.749’W**
16:32 16:54 16:59 17:02 17:08 17:13 17:33 18:20
8‐channel T‐probe at T‐logger #3 (21ROV‐4) (T1=12°C,T2=broken,T3=4°C,T4=3°C,T5=2°C,T6=2°C,T7=2°C,T8=2°C) sampling: KIPS diffuse fluid sampling of musselbeds @ „Irina 2“ (4 bottles) near T‐logger #3 in a water depth of 3036m bottle C9 = 21ROV‐5; TKIPS = 3.7°C pH=7.8 bottle C8 = 21ROV‐6; TKIPS = 3.6°C pH=7.8 bottle C7 = 21ROV‐7; TKIPS = 3.5°C pH=7.9 bottle B6 = 21ROV‐8; TKIPS = 3.7°C pH=7.9 Tmax 3.7°C collecting T‐logger #3, collecting T‐logger #5 (which is entangled in the porch and later recovered) collecting mussels at T‐logger #3 (21ROV‐9) 8‐channel T‐probe (21ROV‐10) (T1=29°C,T2= ‐ ,T3=8.4°C,T4=4.8°C,T5=3.9°C,T6=3.2°C,T7=2.7°C,T8=2.4°C)

Cruise Report HYDROMAR V (04.12.07 – 02.01.08) l’Atalante
page ‐ 85 ‐
extended list of operations (** denotes positions based on Jason 2 dives in January 2007)
station (date/time UTC)
instruments used / samples / comments
Location
18:46 18:52 18:56 19:16 19:20 19:49 20:03 20:39 21:03 21:14 off bottom: 21:36 recovery on deck: 23:09
sampling: KIPS diffuse fluid sampling of musselbeds @ „Irina 2“ (3 bottles) at T‐logger # 7 in a water depth of 3038 m bottle B5 = 21ROV‐11; TKIPS = 2.9°C pH=7.6 bottle B4 = 21ROV‐12; TKIPS = 3.1°C pH=7.8 bottle A3 = 21ROV‐13; TKIPS = 2.9°C pH=7.9 Tmax 3.1°C collecting T‐logger #7 collecting mussels with net at T‐logger #7 (21ROV‐14) finally collecting T‐logger #5 8‐channel T‐probe at T‐logger # 9 (21ROV‐15) depth 3038m (T1=45°C,T2= ‐ ,T3=18°C,T4=8°C,T5=3.8°C,T6=2.7°C,T7=2.6°C,T8=2.4°C) sampling: KIPS diffuse fluid sampling at T‐logger #9 (1 bottle) bottle A2 = 21ROV‐16; pump fails!, no sample collecting T‐logger #9 collecting mussels with net at former logger #9 site (21ROV‐17)
22.12.07
ATA‐22CTD 00:02 – 03:06
CTD, LADCP, 1x MAPR, 21 bottles
14°48.00’N/44°58.804’W (at 3352 m cable out)
ATA‐23CTD 04:44 – 06:54
CTD, LADCP, 1x MAPR, 21 bottles; bottle 18 not closed
14°43.00’N/44°58.76’W (at 3236 m cable out)
ATA‐24ROV deployment:10:52 on bottom: 12:25
Tools: OBT‐2; SMoni, 2 small bionets, 2 marker, ROV beacon
ship at 14°45.21’N/44°58.77’W
13:02
deployment: OBT‐2 @ OBT‐site
14°45.190’N/44°58.777’W**

Cruise Report HYDROMAR V (04.12.07 – 02.01.08) l’Atalante
page ‐ 86 ‐
extended list of operations (** denotes positions based on Jason 2 dives in January 2007)
station (date/time UTC)
instruments used / samples / comments
Location
move to site “Irina 2” (~80m) 14°45.166’N/44°58.745’W**
14:55 15:13 15:17 15:25 15:33 15:38 15:41 16:35 17:00 17:16
8‐channel T‐probe at microsmoker (24ROV‐1) (Tmax > 500°C) sampling: KIPS hot fluid sampling of microsmoker @ „Irina 2“ (6 bottles) water depth 3034m bottle C9 = 24ROV‐2; TKIPS = 362°C pH=3.5 Cl=540mMbottle C8 = 24ROV‐3; TKIPS = 362°C pH=3.7 Cl=550mMbottle C7 = 24ROV‐4; TKIPS = 362°C pH=5.7 Cl=560mM second set of bottles at lower orifice bottle B6 = 24ROV‐5; TKIPS = 364°C pH=6.6 Cl=570mMbottle B5 = 24ROV‐6; TKIPS = 362°C pH=7.0 Cl=575mMbottle B4 = 24ROV‐7; TKIPS = 363°C pH=6.5 Cl=570mMT=361.7±0.6°C; Tmax=367°C Ti‐major bottle D2 (24ROV‐8) pH=5.0 Cl=545mM He‐sample (24ROV‐9) @ microsmoker of „Irina 2“ deployment: SMoni deployment @ „Irina 2“ microsmoker (sampling rate 1 sec.) [note: instrument was not recovered during this cruise!]
move to site “Quest” (~80 m) 14°45.175’N/44°58.836’W**
19:13 19:43 19:52 20:01
8‐channel T‐probe at smoker (24ROV‐10) (Tmax > 400°C) KIPS hot fluid sampling of black smoke exiting directly between talus material (no chimney) @ „Quest“ (3 bottles) water depth 3041m bottle A3 = 24ROV‐11; TKIPS = 310‐364°C pH=5.7 Cl=550mMbottle A2 = 24ROV‐12; TKIPS = 330‐340°C pH=6.7 Cl=555mMbottle A1 = 24ROV‐13; TKIPS = 330‐358°C pH=5.9 T=very variable; Tmax=371°C
find OBT‐site (~80m) 14°45.190’N/44°58.777’W**

Cruise Report HYDROMAR V (04.12.07 – 02.01.08) l’Atalante
page ‐ 87 ‐
extended list of operations (** denotes positions based on Jason 2 dives in January 2007)
station (date/time UTC)
instruments used / samples / comments
Location
21:02 off bottom: 21:02 recovery on deck: 21:15
recover: OBT‐1b @ OBT‐site
23.12.07
ATA‐25CTD 23:55 – 02:40
CTD, LADCP, 1x MAPR, 21 bottles
14°46.00’N/44°58.80’W (at 3201 m water depth)
ATA‐26CTD 03:52 – 06:22
CTD, LADCP, 1x MAPR, 21 bottles
14°47.00’N/44°58.80’W (at 3352 m water depth)
ATA‐27ROV deployment:10:28 on bottom: 12:06
Tools: 3x push cores; 4 small bionets, 2 marker, ROV beacon
ship at 14°45.20’N/44°58.81’W
12:19
in musselbed at “Quest”
14°45.171’N/44°58.771’W**
12:51 12:59 13:08 13:27 13:45 13:55 14:01 14:21
8‐channel T‐probe at T‐logger #14 (27ROV‐1) (T1=125°C,T2= ‐ T3=132°C,T4=135°C,T5=134°C,T6=132°C,T7=125°C, T8=110°C) 8‐channel T‐probe at T‐logger #16 (27ROV‐2) (T1=98°C,T2= ‐ ,T3=79°C,T4=69°C,T5=60°C,T6=49°C,T7=38°C,T8=25°C) 8‐channel T‐probe outside of the musselbed (27ROV‐3) (T1=53°C,T2= ‐ ,T3=43°C,T4=39°C,T5=34°C,T6=27°C,T7=20°C,T8=14°C) 8‐channel T‐probe at T‐logger #19 (27ROV‐4) (T1=120°C,T2=‐,T3=119°C,T4=118°C,T5=115°C,T6=106°C,T7=88°C, T8=30°C) 8‐channel T‐probe at T‐logger #17 (27ROV‐5) (T1=115°C,T2= ‐ ,T3=106°C,T4=47°C,T5=38°C,T6=16°C,T7=11°C,T8=6°C) sampling: KIPS diffuse fluid sampling of musselbeds at T‐logger #19 @ „Quest“ (3 bottles) bottle C9 = 27ROV‐6; TKIPS = 4.7‐7.0°C pH=7.6 bottle C8 = 27ROV‐7; TKIPS = 6.9‐11.8°C pH=7.5 bottle C7 = 27ROV‐8; TKIPS = 5.1‐18.6°C pH=7.6

Cruise Report HYDROMAR V (04.12.07 – 02.01.08) l’Atalante
page ‐ 88 ‐
extended list of operations (** denotes positions based on Jason 2 dives in January 2007)
station (date/time UTC)
instruments used / samples / comments
Location
14:55 15:00 15:12 15:23 16:45 16:58 17:01 17:21 17:31 17:54 19:20 19:36 19:56 20:39
Tmax 18.6°C collecting T‐logger #19 with mussels attached (sample 27ROV‐9) collecting T‐logger #14 collecting T‐logger #16 collecting T‐logger #17 with mussels attached (sample 27ROV‐10) 8‐channel T‐probe at T‐logger #11 (27ROV‐11) (T1=58°C,T2= ‐ , T3=46°C,T4=40°C,T5=34°C,T6=28°C,T7=23°C,T8=16°C) 8‐channel T‐probe (27ROV‐12) (Tmax < 6°C) 8‐channel T‐probe (27ROV‐13) (near ambient) 8‐channel T‐probe at T‐logger #12 (27ROV‐14) (T1=10°C,T2= ‐ ,T3=9°C,T4=7°C,T5=6°C,T6=6°C,T7=5°C,T8=4°C) 8‐channel T‐probe at T‐logger #18 (27ROV‐15) (T1=8°C,T2= ‐ ,T3=6°C,T4=5°C,T5=4°C,T6=4°C,T7=3°C,T8=2°C) 8‐channel T‐probe at T‐logger #10 (27ROV‐16) (T1=9°C,T2= ‐ ,T3=6°C,T4=4°C,T5=2°C,T6=2°C,T7=2°C,T8=2°C) 8‐channel T‐probe in brown sediment next to Quest T‐logger field (27ROV‐17) in a water depth of 3046m (T1=20°C,T2= ‐ ,T3=16°C,T4=13°C,T5=10°C,T6=8°C,T7=6°C,T8=5°C) push core (sample 27ROV‐18) in a water depth of 3046m push core (sample 27ROV‐19) in a water depth of 3046m recovered two pieces of an inactive sulfide chimney from southeastern rim of Quest crater in a water depth of 3040m (27ROV‐20, 21)
21:12 off bottom: 21:19 recovery on deck: 23:57
move to OBT‐site (~80m) recover: OBP‐2 @ OBT‐site
14°45.190’N/44°58.777’W**

Cruise Report HYDROMAR V (04.12.07 – 02.01.08) l’Atalante
page ‐ 89 ‐
extended list of operations (** denotes positions based on Jason 2 dives in January 2007)
station (date/time UTC)
instruments used / samples / comments
Location
24.12.2007
ATA‐28CTD 00:30 – 03:19
CTD, LADCP, 1x MAPR, no water samples taken
14°46.003’N/44°58.802’W (at 3211 m water depth)
ATA‐29CTD 04:37– 07:01
CTD, LADCP, 1x MAPR, 21 bottles; samples for metagenomics group
14°47.974’N/44°58.791’W (at 3219 m water depth)
ATA‐30ROV deployment:10:02 on bottom: 11:45
Tools: 2x Ti‐major sampler; 1x SMoni, 2 small bionets, 3 push cores
ship at 14°45.07’N/44°58.70’W
11:54 found site “B” 14°45.100’N/44°58.684’W**
12:00 12:12 12:15 12:18 13:23 14:03 14:15 14:51
sampling: KIPS hot fluid sampling of smoker B1 @ „B“ (6 bottles) water depth 3034m bottle C9 = 30ROV‐1; TKIPS = 352°C pH=4.9 Cl=545mMbottle C8 = 30ROV‐2; TKIPS = 352°C pH=4.2 Cl=545mMbottle C7 = 30ROV‐3; TKIPS = 352°C pH=3.9 Cl=545mMT=352.2±0.4°C; Tmax=353°C Ti‐major sample at smoker B1 bottle D1 = 30ROV‐4; pH=4.4 Cl=540mM Ti‐major sample at smoker B1 bottle D2 = 30ROV‐5; pH=3.5 Cl=545mM SMoni measurement at smoker B1 (Tmax=341°C) = 30ROV‐6 8‐channel T‐probe at smoker B1 = 30ROV‐7 (Tmax=>450°C; not reliable!)
15:26
at site”Candelaber” (~80m) 14°45.067’N/44°58.656’W**
15:45 15:49 15:58
sampling: KIPS hot fluid sampling @ black smoker C1 of site „Candelaber“ (3 bottles) in a water depth of 2948 m; clear fluids and abundant gas bubbles visible bottle B6 = 30ROV‐8; TKIPS = 362‐364°C pH=4.2 Cl=545mMbottle B5 = 30ROV‐9; TKIPS = 360‐362°C pH=4.3 Cl=545mMbottle B4 = 30ROV‐10; TKIPS = 357‐359°C pH=4.3 Cl=545mMT=360.8±1.1°C; Tmax=364°C ROV moved after bottle B5; the ROV had to be repositioned and bottle B4 is from an orifice few cm away!

Cruise Report HYDROMAR V (04.12.07 – 02.01.08) l’Atalante
page ‐ 90 ‐
extended list of operations (** denotes positions based on Jason 2 dives in January 2007)
station (date/time UTC)
instruments used / samples / comments
Location
Emergency call from the bridge! One sailor has suffered a heart attack and needs to get into a hospital as soon as possible. We ask for one hour to recover instruments while the ship is waiting for a response on the emergency signal sent out to ships in the vicinity.
17:00 17:10 off bottom: 17:16 recovery on deck: 18:36
found site”Irina 2” (~250m) recovery of ADCP at Irina 2
14°45.165’N/44°58.744’W
start transit to Cayenne in French Guayana 18:45

Cruise Report HYDROMAR V (04.12.07 – 02.01.08) l’Atalante
page ‐ 91 ‐
1.7.2 Fluid chemistry results and subsamples
Table A1: Hydrothermal fluid samples and results from on-board analysis
Station No. KIPS and major Bottle
No.
sample No. site, vent description
pump start / pump end (UTC)
max. T in-situ
(°C)
water depth
(m)
pH diss O2
ml/l
chloride (mM)
total S2-
(µM)
Fe (II)
(µM)
total Fe
(µM)
Fe (III)
(µM)
Se (mM)
Sb (mM)
A1 ATA13ROV-1 14:29:17 / 14:31:23 240-260 2928 7.60 b.d.l. 14 52.5 38.5
A2 ATA13ROV-2 14:35:06 / 14:37:39 260-295 2928 7.80 b.d.l. n.d. n.d. n.d.
A3 ATA13ROV-3
Site A, Barad
Dur; hot vent
14:38:04 / 14:40:36 250-306 2928 b.d.l. n.d. n.d. n.d.
B4 ATA13ROV-6 18:18:57 / 18:21:40 353 2928 6.63 14.12 704 762 58.03
B5 ATA13ROV-7 18:22:14 / 18:24:47 352 2928 5.30 n.d. 3918 4572 654
B6 ATA13ROV-8 18:25:21 / 18:27:50 351 2928 457.1 n.d. n.d. n.d.
C7 ATA13ROV-9 18:28:18 / 18:30:47 352 2928 8.30 n.d. n.d. n.d. n.d.
ATA-13-
ROV
C8 ATA13ROV-10
Anna Louise;
Smoker AL1;
hot vent
not pumped 352 5.43 555 2.985 3667 4302 635
B6 ATA15ROV-5 18:12:34 / 18:15:34 4.8 3045 7.7 b.d.l. b.d.l. b.d.l. b.d.l.
C7 ATA15ROV-4 18:08:39 / 18:11:39 4.9 3045 n.d. b.d.l. b.d.l. b.d.l.
C8 ATA15ROV-3 18:04:44 / 18:07:44 2.9 3045 7.48 560 0.385 b.d.l. b.d.l. b.d.l.
ATA-15-
ROV
C9 ATA15ROV-2
Quest; T-
Logger 13;
diffuse vent
17:59:45 / 18:03:45 10.8 3045 7.63 6.00 565 0.931 b.d.l. b.d.l. b.d.l.
A1 ATA17ROV-13 16:29:18 / 16:32:18 370-375 2960 5.93 557 41.41 2213 2307 93.74
A2 ATA17ROV-12 16:25:40 / 16:28:43 334-369 2960 6.80 561 n.d. n.d. n.d. n.d.
A3 ATA17ROV-11 16:22:00 / 16:25:08 350-369 2960 6.90 565 3.852 n.d. n.d. n.d.
B4 ATA17ROV-10 16:18:32 / 16:21:23 360-366 2960 6.79 560 23.11 98.2 214 115.5
B5 ATA17ROV-9 16:14:34 / 16:17:36 360 2960 6.87 565 n.d. n.d. n.d. n.d.
B6 ATA17ROV-8
Irina I; Smoker
I3; hot vent
16:10:56 / 16:13:59 301-363 2960 7.10 565 b.d.l. 0.56 169 168.5
C7 ATA17ROV-5 13:44:04 / 13:47:09 358 2978 5.93 570 39.16 1839 2307 468.2
C8 ATA17ROV-4 13:40:09 / 13:43:09 357 2978 5.75 570 179.4 2663 3187 524
ATA-17-
ROV
C9 ATA17ROV-3
Site B;
Smoker B4;
hot vent 13:36:16 / 13:39:16 363 2978 3.79 545 230.8 7981 9160 1180 b.d.l. b.d.l.
A3 ATA21ROV-13 18:56:00 / 18:59:00 2.9 3038 7.85 b.d.l. b.d.l. b.d.l. b.d.l.
B4 ATA21ROV-12 18:52:10 / 18:55:18 3.1 3038 7.77 b.d.l. b.d.l. b.d.l. b.d.l.
B5 ATA21ROV-11
Irina II; T-
Logger 7;
diffuse vent 18:48:25 / 18:51:25 2.9 3038 7.56 5.36 0.482 30.7 30.69
B6 ATA21ROV-8 17:05:47 / 17:08:50 3.7 3036 7.87 b.d.l. b.d.l. b.d.l. b.d.l.
ATA-21-
ROV
C7 ATA21ROV-7
Irina II; T-
Logger 3; 17:02:08 / 17:05:09 3.5 3036 7.87 b.d.l. b.d.l. b.d.l. b.d.l.

Cruise Report HYDROMAR V (04.12.07 – 02.01.08) l’Atalante
page ‐ 92 ‐
Station No. KIPS and major Bottle
No.
sample No. site, vent description
pump start / pump end (UTC)
max. T in-situ
(°C)
water depth
(m)
pH diss O2
ml/l
chloride (mM)
total S2-
(µM)
Fe (II)
(µM)
total Fe
(µM)
Fe (III)
(µM)
Se (mM)
Sb (mM)
C8 ATA21ROV-6 16:58:27 / 17:01:27 3.6 3036 7.82 b.d.l. b.d.l. b.d.l. b.d.l.
C9 ATA21ROV-5
diffuse vent
16:54:39 / 16:57:39 3.7 3036 7.79 5.50 0.42 17.86 17.86
A1 ATA24ROV-13 19:58:00 / 20:01:30 330-358 3045 5.85 137.07 n.d. n.d. n.d.
A2 ATA24ROV-12 19:49:28 / 19:52:30 330-340 3045 6.71 555 n.d. 385 2118 1734
A3 ATA24ROV-11
Quest;
Smoker; hot
vent 19:43:18 / 19:46:18 310-364 3045 5.70 550 89.88 3175 3812 637.7 b.d.l. b.d.l.
B4 ATA24ROV-7 15:41:46 / 15:44:46 363 3034 6.54 570 1.798 782 934 151.8
B5 ATA24ROV-6 15:38:00 / 15:41:00 362 3034 6.96 575 n.d. 420 667 247.2
B6 ATA24ROV-5
Irina II,
Microsmoker;
higher
orrifice; hot
vent 15:33:37 / 15:37:18
364 3034 6.60 570 13.58 711 870 159
C7 ATA24ROV-4 15:25:39 / 15:28:39 362 3034 5.69 560 75.18 3553 4590 1036
C8 ATA24ROV-3 15:17:37 / 15:20:47 362 3034 3.70 550 783.6 7997 9153 1156 b.d.l. b.d.l.
C9 ATA24ROV-2 15:13:47 / 15:16:51 362 3034 3.53 540 1823 8316 9532 1216 b.d.l. b.d.l.
ATA-24-
ROV
D2 ATA24ROV-8
Irina II,
Microsmoker;
lower orrifice;
hot vent 16:35:25 3034 5 545 n.d. n.d. n.d. n.d.
C7 ATA27ROV-8 14:21:30 / 14:24:30 5.1-18.6 3045 7.57 5.07 b.d.l. 36.2 36.15
C8 ATA27ROV-7 14:06:58 / 14:09:30 6.9-11.8 3045 7.54 b.d.l. b.d.l. b.d.l. b.d.l. ATA-27-
ROV
C9 ATA27ROV-6
Quest; T-
Logger 19
diffuse vent 13:55:40 / 13:58:52 4.7-7.0 3045 7.64 b.d.l. 40.1 40.08
A1 - not pumped 6.20 575 57.14 1165 1909 744.1
A2 - not pumped 7.00 575 n.d. 210 545 334.8
A3 -
Mischprobe ?
not pumped 8.10 575 n.d. 3.72 3.72
B4 ATA30ROV-10 15:55:36 / 15:58:36 357-359 2948 4.30 545 501.7 8306 10125 1819 b.d.l. b.d.l.
B5 ATA30ROV-9 15:46:17 / 15:49:17 360-362 2948 4.24 545 n.d. b.d.l. b.d.l.
B6 ATA30ROV-8
Candelabra;
hot vent
15:42:18 / 15:45:18 362-364 2948 4.24 545 2114 7769 10331 2563 b.d.l. b.d.l.
C7 ATA30ROV-3 12:18:43 / 12:21:46 352 2978 3.90 545 470.6 7686 10021 2335 b.d.l. b.d.l.
C8 ATA30ROV-2 12:15:03 / 12:18:03 352 2978 4.20 545 1870 8161 9732 1571 b.d.l. b.d.l.
C9 ATA30ROV-1 12:10:39 / 12:14:13 352 2978 4.90 b.d.l 545 2196 7831 10455 2625 b.d.l. b.d.l.
D1 ATA30ROV-4 13:23:35 2978 4.36 540 468.3 9071 13700 4629 b.d.l. b.d.l.
ATA-30-
ROV
D2 ATA30ROV-5
Site B; smoker
B1
14:03:26 2978 3.50 545 3152 8926 11261 2335 b.d.l. b.d.l.
empty space = not analysed; n.d. = not detectable (problems with method); b.d.l.= below detection limit; KIPS: A1 - C9; titanium major bottles: D1 and D2

Cruise Report HYDROMAR V (04.12.07 – 02.01.08) l’Atalante
page ‐ 93 ‐
Table A2: Hydrothermal fluid samples for trace metal analysis at home Working Group Garbe-Schönberg, CAU-Kiel
Station No. KIPS and
major Bottle
No.
sample No. site, vent description
60 ml nf/na
100 ml nf/a
100 ml f/a
250 ml f/a for PGE`s
A1 ATA13ROV-1 X X
A2 ATA13ROV-2
A3 ATA13ROV-3
Site A, Barad Dur;hot vent
B4 ATA13ROV-6 X X
B5 ATA13ROV-7
B6 ATA13ROV-8
C7 ATA13ROV-9 X X
ATA13ROV
C8 ATA13ROV-10
Anna Louise; Smoker AL1;
hot vent
X X
B6 ATA15ROV-5
C7 ATA15ROV-4
C8 ATA15ROV-3
ATA15ROV
C9 ATA15ROV-2
Quest; T-Logger 13; diffuse vent
X X
A1 ATA17ROV-13 X X
A2 ATA17ROV-12
A3 ATA17ROV-11
B4 ATA17ROV-10 X X
B5 ATA17ROV-9
B6 ATA17ROV-8
Irina I; Smoker I3; hot vent
X
C7 ATA17ROV-5
C8 ATA17ROV-4
ATA17ROV
C9 ATA17ROV-3
Site B; Smoker B4; hot vent
X X X
A3 ATA21ROV-13
B4 ATA21ROV-12
B5 ATA21ROV-11
Irina II; T-Logger 7;
diffuse vent X X
B6 ATA21ROV-8
C7 ATA21ROV-7
C8 ATA21ROV-6
ATA21ROV
C9 ATA21ROV-5
Irina II; T-Logger 3;
diffuse vent
X X
A1 ATA24ROV-13 ATA24ROV
A2 ATA24ROV-12
Quest; Smoker; hot

Cruise Report HYDROMAR V (04.12.07 – 02.01.08) l’Atalante
page ‐ 94 ‐
Station No. KIPS and
major Bottle
No.
sample No. site, vent description
60 ml nf/na
100 ml nf/a
100 ml f/a
250 ml f/a for PGE`s
A3 ATA24ROV-11 vent X X
B4 ATA24ROV-7
B5 ATA24ROV-6
B6 ATA24ROV-5
Irina II, Microsmoker; higher orrifice;
hot vent X X
C7 ATA24ROV-4
C8 ATA24ROV-3
C9 ATA24ROV-2 X X
D2 ATA24ROV-8
Irina II, Microsmoker; lower orrifice;
hot vent
C7 ATA27ROV-8
C8 ATA27ROV-7
ATA27ROV
C9 ATA27ROV-6
Quest; T-Logger 19
diffuse vent X X
A1 - X X
A2 -
A3 -
Mischprobe ?
B4 ATA30ROV-10
B5 ATA30ROV-9 X
B6 ATA30ROV-8
Candelabra; hot vent
X X
C7 ATA30ROV-3 X X
C8 ATA30ROV-2
C9 ATA30ROV-1
D1 ATA30ROV-4
ATA30ROV
D2 ATA30ROV-5
Site B; smoker B1
X X
a = acidified; f = filtrated; na = not acidified; nf = not filtrated

Cruise Report HYDROMAR V (04.12.07 – 02.01.08) l’Atalante
page ‐ 95 ‐
Table A3: Hydrothermal fluid samples for trace metal, anion and amino acid analysis at home Working Group Andrea Koschinsky, Jacobs University Bremen pos Stat. No. description bottle volume filtered acified freeze use, methods
1 A1 50 ml anions
2 50 ml x amino acids
3 60 ml x anions
4 100 ml x cations
5 100 ml x x cations
6
Site A; Barad Dur; hot vent
A2 50 ml (1:50) x Si-measurements
7 B4 50 ml anions
8 60 ml x on board meas.
9 100 ml x x cations
10 100 ml x cations
11 C7 80 ml x x cations
12 60 ml x amino acids
13 60 ml x cations
14 C8 30 ml x x cations
15 70 ml x cations
16 50 ml x amino acids
17
13ROV
Anna Louise; hot vent
50 ml (1:50) x Si-measurements
18 B6 5 ml on board meas.
19 C8 50 ml x amino acids
20 50 ml anions
21 C9 50 ml anions
22 100 ml x cations
23 8 ml on board meas.
24
15ROV Quest; diffuse vent
50 ml x amino acids
25 A1 50 ml on board meas.
26 50 ml x anions
27 100 ml x cations
28 100 ml x x cations
29 50 ml x amino acids
30 A2 50 ml on board meas.
31 A3 10 ml on board meas.
32 B4 50 ml on board meas.
33 40 ml x anions
34 100 ml x cations
35 80 ml x x cations
36 B5 60 ml x amino acids
37 C7 50 ml on board meas.
38
17ROV Irina 1; hot vent
50 ml amino acids
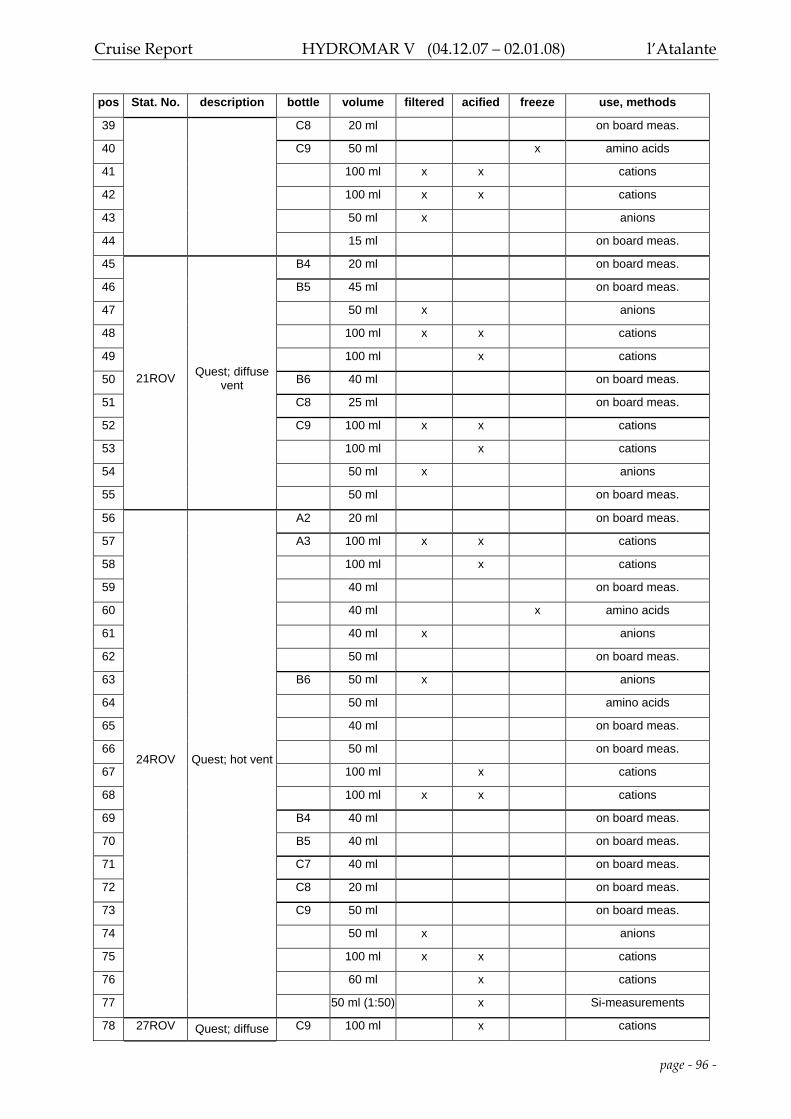
Cruise Report HYDROMAR V (04.12.07 – 02.01.08) l’Atalante
page ‐ 96 ‐
pos Stat. No. description bottle volume filtered acified freeze use, methods
39 C8 20 ml on board meas.
40 C9 50 ml x amino acids
41 100 ml x x cations
42 100 ml x x cations
43 50 ml x anions
44 15 ml on board meas.
45 B4 20 ml on board meas.
46 B5 45 ml on board meas.
47 50 ml x anions
48 100 ml x x cations
49 100 ml x cations
50 B6 40 ml on board meas.
51 C8 25 ml on board meas.
52 C9 100 ml x x cations
53 100 ml x cations
54 50 ml x anions
55
21ROV Quest; diffuse vent
50 ml on board meas.
56 A2 20 ml on board meas.
57 A3 100 ml x x cations
58 100 ml x cations
59 40 ml on board meas.
60 40 ml x amino acids
61 40 ml x anions
62 50 ml on board meas.
63 B6 50 ml x anions
64 50 ml amino acids
65 40 ml on board meas.
66 50 ml on board meas.
67 100 ml x cations
68 100 ml x x cations
69 B4 40 ml on board meas.
70 B5 40 ml on board meas.
71 C7 40 ml on board meas.
72 C8 20 ml on board meas.
73 C9 50 ml on board meas.
74 50 ml x anions
75 100 ml x x cations
76 60 ml x cations
77
24ROV Quest; hot vent
50 ml (1:50) x Si-measurements
78 27ROV Quest; diffuse C9 100 ml x cations

Cruise Report HYDROMAR V (04.12.07 – 02.01.08) l’Atalante
page ‐ 97 ‐
pos Stat. No. description bottle volume filtered acified freeze use, methods
79 50 ml anions
80 50 ml on board meas.
81
vent
50 ml x amino acids
82 A1 50 ml x anions
83 100 ml x cations
84 30 ml on board meas.
85 50 ml x x cations
86 A2 30 ml on board meas.
87
mixed sample of Candelabra
and Site B
A3 30 ml on board meas.
88 B6 50 ml x x cations
89 60 ml x cations
90 40 ml x amino acids
91 50 ml x anions
92 B5 50 ml x cations
93
Candelabra
B4 5 ml on board meas.
94 C7 50 ml x x cations
95 40 ml x anions
96 5 ml on board meas.
97 100 ml x cations
98 C8 70 ml x cations
99 30 ml anions
100 50 ml (1:50) x Si-measurements
101 C9 40 ml x anions
102 50 m on board meas.
103 100 ml x x cations
104 D1 5 ml on board meas.
105 D2 100 ml x cations
106 150 ml x* HFSE
107 125 ml x anions
108
30ROV
Site B, Smoker B1
125 ml x x cations
on board meas.: rest of fluid from on board determinations of pH, S2‐, Fe, Ca, Mg, Se, Sb; x* acidified with HCl (for HFSE analysis);