design and evaluation of a cloud native data analysis...
TRANSCRIPT
Producción Académica
Ferrer Daub, Facundo Javier
Design and evaluation of a cloud native data analysis pipeline for cyber physical
production systems
Tesis para la obtención del título de posgrado de Magister en Dirección de Empresas
Director: Srur, Leandro
Documento disponible para su consulta y descarga en Biblioteca Digital - Producción Académica, repositorio institucional de la Universidad Católica de Córdoba, gestionado por el Sistema de Bibliotecas de la UCC.
Esta obra está bajo licencia 2.5 de Creative Commons Argentina.
Atribución-No comercial-Sin obras derivadas 2.5C C |®@©I
ÉICDAU'IVnSIDAD CATOLICA .'i c Okcxjüa
UNIVERSIDAD CATOLICA DE CORDOBA
INSTITUO DE CIENCIAS DE LA ADMINISTRACIÓN
TRABAJO FINAL DE MAESTRÍA EN DIRECCIÓN DE EMPRESAS
DESIGN AND EVALUATION OF A CLOUD NATIVE DATA ANALYSIS PIPELINE FOR CYBER PHYSICAL
PRODUCTION SYSTEMS
AUTOR: FACUNDO JAVIER FER R ER DAUB EMAIL: [email protected] DIRECTOR: Leandro Srur
CÓRDOBA 2017
ABSTRACT
Since 1991 with the birth of the World Wide Web the rate of data growth has
been growing with a record level in the last couple of years. Big companies
tackled down this data growth with expensive and enormous data centres to
process and get value of this data. From social media, Internet of Things
(IoT), new business process, monitoring and multimedia, the capacities of
those data centres started to be a problem and required continuos and
expensive expansion. Thus, Big Data was something that only a few were
able to access. This changed fast when Amazon launched Amazon Web
Services (AWS) around 15 years ago and gave the origins to the public cloud.
At that time, the capabilities were still very new and reduced but 10 years
later the cloud was a whole new business that changed for ever the Big Data
business. This not only commoditised computer power but it was
accompanied by a price model that let medium and small players the
possibility to access it. In consequence, new problems arised regarding the
nature of these distributed systems and the software architectures required
for proper data processing. The present job analyse the type of typical Big
Data workloads and propose an architecture for a cloud native data analysis
pipeline. Lastly, it provides a chapter for tools and services that can be used
in the architecture taking advantage of their open source nature and the cloud
price models.


UNIVERSIDAD CATOLICA DE CORDOBA
INSTITUTO DE CIENCIAS DE LA ADMINISTRACION
TRABAJO FINAL DE MAESTRÍA EN DIRECCIÓN DE EMPRESAS
DESIGN AND EVALUATION OF A CLOUD NATIVE DATA ANALYSIS PIPELINE FOR CYBER PHYSICAL
PRODUCTION SYSTEMS
AUTOR: FACUNDO JAVIER FERRER DAUB DIRECTOR: LEANDRO SRUR
CORDOBA 2017
CONTENTS
I Introduction 41.1 Organization ..................................................................................... 41.2 Problem statement............................................................................. 41.3 State of the art and open problems.................................................. 6
II Data Types and Sources 82.1 Data types ........................................................................................ 8
2.1.1 Nondependency-oriented data ............................................ 92.1.2 Dependency-oriented d a t a .................................................. 11
2.2 Data properties ................................................................................... 122.3 Data sources ..................................................................................... 14
2.3.1 Information Technology (IT) .................................................. 142.3.2 Physical W o r ld ....................................................................... 16
2.4 Metadata ........................................................................................... 172.4.1 What means metadata........................................................... 172.4.2 Importance of m etadata........................................................ 18
III Workloads 193.1 Streams and Batch ............................................................................. 19
IV Architecture Building Blocks 244.1 Introduction ........................................................................................ 244.2 Building Blocks ................................................................................... 25
4.2.1 Acquisition and Recording..................................................... 254.2.2 Extraction, Cleaning and Annotation................................... 274.2.3 Integration, Aggregation and Representation..................... 274.2.4 Modeling and Analysis........................................................... 284.2.5 Interpretation.......................................................................... 29
V Architecture Allocation to Tools and Services 305.1 Tools.................................................................................................... 30
5.1.1 Apache F lu m e ....................................................................... 305.1.2 Apache Sqoop ....................................................................... 315.1.3 Apache Kafka ....................................................................... 325.1.4 Apache Storm ....................................................................... 335.1.5 Apache H a d o o p .................................................................... 335.1.6 Apache Spark ....................................................................... 35
1

5.1.7 Apache F lin k ..............................................................................365.1.8 Apache Hive ..............................................................................375.1.9 Apache Imapala ........................................................................375.1.10 Apache P ig .................................................................................38
5.2 Cloud Providers and Services........................................................... ....395.2.1 A W S S 3 .......................................................................................415.2.2 AWS Kinesis F a m ily ..................................................................415.2.3 AWS Lambda..............................................................................415.2.4 AWS Elastic M apR educe..................................................... ....425.2.5 AWS Q u icks igh t........................................................................425.2.6 DataTorrent.................................................................................43
VI Summary and Outlook 446.1 Conclusions ........................................................................................ ....446.2 Limitations ........................................................................................ ....456.3 Outlook .............................................................................................. ....45
2

3
I. INTRODUCTION
1.1 OrganizationThis dissertation shows how a cloud native architecture, can help system
designers to implement analytic data pipelines. This thesis is organized as fol- lows. Chapter 1 explains the statement of problem, basic principles of data ana- lytics are outlined in order to better define specifics aspects of the data pipeline modeling addressed in this work. In addition, the current state of the art and the open problems are explained here too.
Chapter 2, introduces the different data types that are described in the thesis. Among them, the related data sources reviewed are explaining here. Finally, a mention to the importance of the metadata, the data about the data, is included.
Handling of the different data types can be done in two main ways, stream and batch processing. The characterization of these workloads, with its related data pedigree is discussed in Chapter 3. Furthermore, the privacy of data col- lected and processed is an important area explained as well in this chapter.
In Chapter 4 describes, the architecture building blocks, not only from a technical point of view but in regards of the business value of the presented architecture; and the importance of a cost-efficient pipeline by a proper selection of the building blocks.
Chapter 5 and 6, try to give a short overview of different tools and services that can be used in each of the different phases of the data pipeline. Besides, an experimental setup of the data pipeline is done with the analysis of real-world data-sets and its corresponding results.
Chapter 7 discusses the results of the whole work as well as presents directions for future work. Last but not the least, other topics like, data backup, replication and normalization are contained within the Appendices.
1.2 Problem statementIn 1991 computer scientist Tim Berners-Lee announced the birth of what
would become the World Wide Web as we know it today, interconnected web of data, accessible to anyone from anywhere. Since then, an explosion of informa- tion took place in the digital world (Berners-Lee, 1991, p. 3).
Almost ten years later, Doug Laney, was defining data growth challenges and opportunities as the three of what will come to be the commonly-accepted characteristics of Big Data, volume, velocity and variety (Laney, 2001, p. 70).
4
And later, some scholars added veracity and value as a 5 Vs model (Assuncao, Calheiros, Bianchi, Netto, & Buyya, 2015). IDC started a research in 2005 on how big is the digital world and in the partial results published in the 2007 report, the size by 2006 was 161 exabytes and forecasted to be 988 exabytes in 2010 (J. F. Gantz & Reinsel, 2007, p. 2). On a later report from the same research in2012, the forecast was revised and the actual growth was 1.227 exabytes. And the research forecast 40.000 exabytes by 2020 (J. Gantz & Reinsel, 2012, p. 1).
We are in a new era in which the data captured by organization has being continuously increasing in volume and detail. This increase came by the hand of the rise of social media, Internet of Things (IoT), business process, sensors, mon- itoring and multimedia, in either structured or unstructured format. Furthermore, the rate of data creation is occurring at a record levels. The variety, volume, and velocity of this data is such that is exceeding the ability of researchers to design appropriate cloud computing platforms for its analysis (Hashem et al., 2015, p. 99).
Cloud computing is the next generation of IT industry and is growing at a fast pace (Hashem et al., 2015, p. 101) Cloud computing, as defined by the National Institute of Standards and Technology (NIST), is ”a model for enabling ubiquitous, convenient, on-demand network access to a shared pool of config- urable computing resources (e.g., networks, servers, storage, applications, and services) that can be rapidly provisioned and released with minimal management effort or service provider interaction” (Mell & Grance, 2011, p. 6).
Cloud computing is being used by many organizations but still there are many issues without a proper solution. Big data in the cloud is still in its young stages as new challenges continue to arrive from applications by organizations in many aspects such as scalability, data integrity, privacy, and regulatory gover- nance (Hashem et al., 2015, p. 109).
In the industrial side, these changes has come along with a big revolution. Back then in the late 18th century, the advent of the steam engine brought us the first industrial revolution (Arvind, 2016, p. 1). Decades later, the second industrial revolution took place with introduction of manufacturing lines, electricity, inter- nal combustion engine, and mass production systems (Atkeson & Kehoe, 2001). Lastly, in the 20th century, the technological advances in computer hardware and the creation of the Internet have changed the traditional business practices, and companies have been forced to adapt themselves one more time to these new changes (Smith, 2001).
The fourth industrial revolution is starting. Countries like Germany, started to talk about Industrie 4.0 as the underlying concept that support this current industrial revolution. It is based on the evolution of embedded systems to Cyber-
5
Physical Systems (CPS) or Cyber-Physical Production Systems (CPPS) 1, the so mentioned Smart Factories, and semantic machine-to-machine communication. These changes represent a paradigm shift from current centralized manufacturing process to a decentralized, autonomous real-time production (MacDougall, 2014, p. 6). Smart factories will enable manufacturing units to have higher flexibility in terms of manufacturing processes, the customization of the products and the scale and scope of output (Arvind, 2016, p. 2).
To enable Smart Factories in a real decentralized way, the CPPS must interchange enormous amounts of data. Thus, is a key competitive advantage being able to understand and explore this data and to gain insights from these type of systems. Analytics involve techniques of data mining, text mining, statis- tical analysis, explanatory and predictive models, and advanced visualisations to let decision makers take informed decisions (Assuncao, Calheiros, Bianchi, Netto, & Buyya, 2013, p. 3).
However, implementing a system capable to use analytics still requires a hard effort, expensive software and hours, or even days, to develop a solution that fit specific business needs (Assuncao et al., 2013, p. 4). Furthermore, many of these solutions are tradeoff between current solutions and native cloud designs. This work pretends to highlight the issues of developing a cloud based architecture for analytics of CPPS and provide the building blocks for a cloud native data analysis pipeline.
1.3 State of the art and open problemsGiven the broad surface of big data, there are many different architectures
out there. The presented state of the art architectures are based on a literature review and present an overview of emerging data analysis platforms. For data analysis different architectural concepts are defined. For example, traditional re- lational data warehouse systems are the oldest but most established architecture. With the upcoming of the years and the growth of data, these systems have evolved into massively parallel processing systems (MPP) (Begoli, 2012).
Complex and computationally intensive problems require specialized platforms. High Performance Computing (HPC) is the discipline that study those problems. HPC Platforms usually scales to thousands of cores and can be mixed with Graphic Processing Units (GPUs) for extra intensive computation. They require low-latency and high bandwidth networks because most of the problems needs massive parallelism and data transfers (Begoli, 2012).
1 Despite CPS and CPPS have not exactly the same meaning, they will be used interchange-
ably during this work. When the term s may introduce some m isunderstanding they will be clarified properly.
6

Another technology used is the NoSQL databases. They offer a highly scalable and flexible data store and a decent querying system. In this category we can find three main database models, key/value stores, document stores, and graph databases.
Originally pioneered by Google, MapReduce is a distributed computing model that provides primitives for massively scalability and fault-tolerant batch computation (Marz & Warren, 2015). It is today one of the most trending archi- tectures. Apache Hadoop (hadoop2016apache, 2016) is a distributed data store that allows for the distributed processing of large data sets. Hadoop achieves this through a set of modules/libraries, one of those is the Apache MapReduce that allows the execution of MapReduce jobs(Grover, Malaska, Seidman, & Shapira, 2015).
Most of the previous solutions have one factor in common, they process data in batch mode. Nowadays, with the upcoming of the Industrie 4.0 and CPSs, the platforms should be prepared for streaming type of computation. Thus, some authors have developed new architecture based on traditional MapReduce and extending it to support this streaming nature of the data like the Lambda architecture. In a simplistic explanation, the architecture splits the processing of the information, and one part precomputes batch views of the complete data set, when the other part only computes real-time views of the data that arrived af- ter the batch computation process started, as one of the parts computes only a minimal part of the data set in comparison to the other the near real-time effect is achieved. Finally, when a query is received it is fulfilled as a function of both views, the real-time and the batch one (Marz & Warren, 2015).
Even all these different solutions are not enough for the fast growing of information. Current data pipelines have problems, or they are too specific and expensive to being used by majority, like HPC systems, or others ”cloud” available and cheaper do not support all application’s domains like Hadoop and MapRe- duce’s based technologies. Or even improvements like Lambda architecture to cover most application domains have its own set of pitfalls, for example, have to keep two source code bases (Chen, Alspaugh, & Katz, 2012) Even new problems arise when these solutions are deployed in the cloud, like privacy and security of the data (Assuncao et al., 2013).
While there is no architecture to rule them all, it is common to get over- whelmed when trying to design a data pipeline. This even get worse when the data come from Cyber Physical Systems and when the requirements are based on a cloud native solution. The proposed pipeline provides a guide for helping architects and data scientists to design and improve their own solutions.
7
II. DATA TYPES AND SOURCESThe presented data pipeline makes sense in the context of the modern
age, where most of CPSs generate some form of data either for analysis or diag- nostic purposes. This caused a deluge of data, which has been rising to reach petabytes or exabytes orders of magnitude (Aggarwal, 2015, p. 1).
The advancements in technology and the ”technologization” of every as- pect of human modern life with the advent of CPSs bring as a consequence a deluge of data. Therefore, makes sense to review whether one can extract valuable insights from the data to accomplish application specific objectives(Aggarwal, 2015, p. 2).
The quality of this raw data can be structured, semi-structured, unstruc- tured, or even in a format that is not suitable for being processed by automated computer program. For example, data collected manually might be ingested from heterogeneous sources in multiple formats and yet somehow requires to be processed by computers systems to gain useful insights (Aggarwal, 2015, p. 2).
To address this issue a processing pipeline is commonly used to collect, clean, and transform data before being processed for insights. Collecting, clean- ing, and preparing the data are not trivial tasks, thus, some considerations will be mentioned in Chapter III.
The data may be conformed by different formats or types. The type may be quantitative representation (e.g. age), categorical (e.g. blood type, HTTP request, etc.), text, spatiotemporal, or graph. Even though the form of data most common founded is multidimensional, every time the proportion of more complex types of data is increasing (Aggarwal, 2015, p. 2).
The importance of these data types regards in the algorithms used to pro- cess them. The portability of algorithms between different data types is merely conceptual, and is not the same from a practical perspective point of view. The truth is that the behavior of algorithms might be considerably affected by a specific data type (Aggarwal, 2015, p. 3).
2.1 Data typesIn the previous chapter we presented the Vs model of the data. One of
those Vs is Variety. In regards to it, we can classify the data types in three main categories:
• Structured: data models and formal schema given (e.g. RDBMS, etc.).
8

• Semi-structured: there is no rigid data model structure (e.g. JSON, XML, etc.).
• Unstructured: no data model is predefined (e.g. books, video, etc.).
Large part of the data produced by CPS it is argued to be either semi- structured or unstructured (Assuncao et al., 2015, p. 9).
This classification does not come alone. We can make a further classifi- cation regarding the complexity of the data involved. Generally speaking, we can define two types of data:
1. Nondependency-oriented data: it refers to the most commonly and simple data type found. This includes text or multidimensional data. For this type of data, each record does not have any named dependencies between either the data items or the dimensions. An example can be a demographic set of records about individuals containing their name, state, age, and gender (Aggarwal, 2015, p. 6).
2. Dependency-oriented data: in the other hand, this data type may have im- plicit or explicit relationships between the records. An example of explicit relationship can be found in a social network where the data items are con- nected together between given relationships (also called edges). On the other side, an implicit example are time series in which successive records coming from a sensor are related implicitly by the time attribute (Aggarwal, 2015, p. 6).
It is key to understand the different types of data because of the considerable impact that has in the architecture. For example, it is not the same in terms of size to store a number represented as a string than store it represented as an integer, thus, storage of data can be substantially impacted if there is no proper understanding of data types.
2.1.1 Nondependency-oriented data
Also referred to as multidimensional data, this is the most common and ele- mentary form of data. This data typically contains a set of data points. Depending on the application a data point can also be named as a record, transaction, entity, tuple, or object. Each tuple enclose set of attributes, which are also referred to as dimensions, features orfields. Since we found these terms all around the bib- liography we will follow the same approach and they will be used interchangeably overall this work (Aggarwal, 2015, p. 7),
In Table II.1 the dimensions (or attributes) of the records are of two different data types. Age attribute is considered numerical because its values have a
9
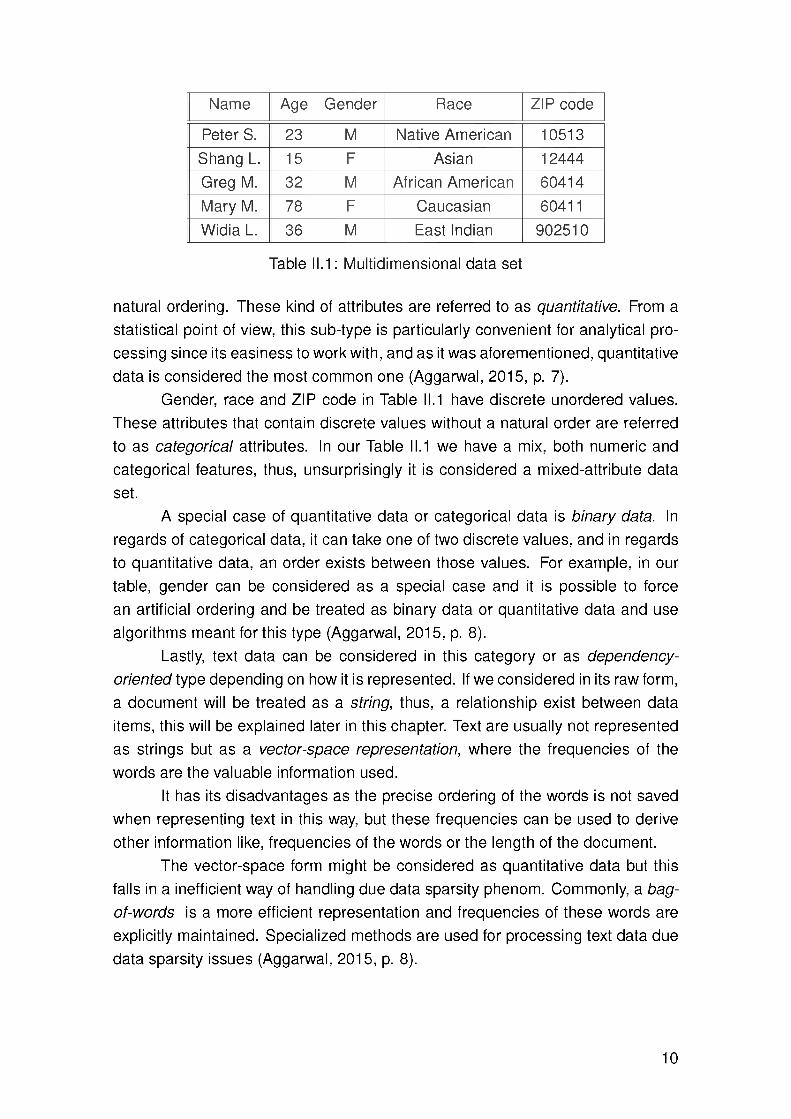
Name Age Gender Race ZIP code
Peter S. 23 M Native American 10513Shang L. 15 F Asian 12444Greg M. 32 M African American 60414Mary M. 78 F Caucasian 60411Widia L. 36 M East Indian 902510
Table II.1: Multidimensional data set
natural ordering. These kind of attributes are referred to as quantitative. From a statistical point of view, this sub-type is particularly convenient for analytical processing since its easiness to work with, and as it was aforementioned, quantitative data is considered the most common one (Aggarwal, 2015, p. 7).
Gender, race and ZIP code in Table II.1 have discrete unordered values. These attributes that contain discrete values without a natural order are referred to as categorical attributes. In our Table II.1 we have a mix, both numeric and categorical features, thus, unsurprisingly it is considered a mixed-attribute data set.
A special case of quantitative data or categorical data is binary data. In regards of categorical data, it can take one of two discrete values, and in regards to quantitative data, an order exists between those values. For example, in our table, gender can be considered as a special case and it is possible to force an artificial ordering and be treated as binary data or quantitative data and use algorithms meant for this type (Aggarwal, 2015, p. 8).
Lastly, text data can be considered in this category or as dependency- oriented type depending on how it is represented. If we considered in its raw form, a document will be treated as a string, thus, a relationship exist between data items, this will be explained later in this chapter. Text are usually not represented as strings but as a vector-space representation, where the frequencies of the words are the valuable information used.
It has its disadvantages as the precise ordering of the words is not saved when representing text in this way, but these frequencies can be used to derive other information like, frequencies of the words or the length of the document.
The vector-space form might be considered as quantitative data but this falls in a inefficient way of handling due data sparsity phenom. Commonly, a bag- of-words is a more efficient representation and frequencies of these words are explicitly maintained. Specialized methods are used for processing text data due data sparsity issues (Aggarwal, 2015, p. 8).
10
2.1.2 Dependency-oriented data
The discussion in the aforementioned chapter is most about the non-dependency scenario in which each data point can be treated independently. In practice, relationships links like temporal, spatial or explicit network connections may occur (implicitly or explicitly) between data points. The knowledge of those relationships change the insights gained from the data.
Aggarwal categorize these type of relationships as:
1. Implicit dependencies: the relationships between data points are known to ”normally” exist in the domain, but are not explicitly stated. An example in CPS field can be temperature sensor values, in which successive readings are likely to be similar and considerably different values are interesting to be analyzed (Aggarwal, 2015, p. 9).
2. Explicit dependencies: in this case, specific relationships or ”edges” are given between data points in graph data types. Social network relationships are a common example in this field (Aggarwal, 2015, p. 9).
Like in the previous section, here the most common sub type of data en- countered is time-series data. Time-series contains values that are measured in a continuous way over time. Environmental sensors will measure humidity, temperature, etc while electrocardiogram devices will do the same for heart rhythm of a patient. The data points here have an implicit dependency in regards of the time variable.
This temporal dependency may give useful insights in regards to other attributes of the data. Without entering in deeper explanation of contextual and behavioral attributes, we may have for example two sensors, one that measures temperature and other humidity at a given time base. The relation between the variation between the attributes for a given record, and within successive readings may give us valuable insights that could not be gained in a non-dependency data set in which those values would have been treated independently. This data set is then referred to as a multidimensional time series (Aggarwal, 2015, p. 10).
Therefore, and in a analog way to categorical data types, if the data points received over time are of a discrete nature, we get a discrete sequence data type.For example, consider web server sending log events, each log line may contain IP address of the request, and the resource requested, and of course the time stamp for each data point (Aggarwal, 2015, p. 10).
If we consider changing the time attribute as the implicit relationship between data items for a spatial attribute we get a spatial data set. In this type of data, the dependencies between attributes and records are related to a spatial
11
location. An example can be the measure of environmental attributes like tem- perature in the sea surface.
There is a particular form in which time-series and spatial data are mixed, given spatiotemporal data, which the relationship between attributes is given by both, spatial and temporal attributes. For the previous example, we can measure the sea-surface temperatures over time (Aggarwal, 2015, p. 12)
Lastly, graph data type is given by a set of nodes (data items) and the relationships between them are explicitly defined by edges. This kind of repre- sentation is useful for solving similarity-based data mining applications on other data types (Aggarwal, 2015, p. 14).
2.2 Data propertiesIn the previous section we discussed about data types, or one of the big
data Vs, variety. In this section, we try to give some hints of others properties of the data. When we refer to ”big” data is not only for the volume (as we men- tioned in the introduction in orders of terabytes, petabytes or even exabytes) but data can be ”big” in other ways. For example, one can measure how big data is in regards of lasting significance of an observation of a unique event. Further, the descriptive challenges required can also give some criteria to call it big, like a complex experimental setup. Thus, the value of the data can be given by how big it is. To keep this value, a proper handling and conservation of the data is required. Data loss effects can be in some cases only economics and the exper- iments can be run again, but in other cases, the data loss can be an opportunity lost permanently (Lynch, 2008, p. 28).
At the heart of the data analysis pipeline is the master dataset. This master dataset is the base source of data on which all the other data will be derived from. Thus, it is vital to protect it from inevitable risks like technological issues as power outages or hard disk failing, or human errors. To accomplish this, a fault tolerant system is required and becomes essential understand how the data set is stored, not only the physically store but the data model used for it (Marz & Warren, 2015, p. 27-28).
We have being used information, data, master data, interchangeably until now, but a proper definitions of terms is necessary here because they will become indispensable later (Marz & Warren, 2015, p. 29):
• Information: the colloquial use of the word data can be confused with information, but the last one implies a general collection of knowledge that is relevant to your system
12
• Data: is the base of the data pipeline. It can also be referred as master data, and it is the information that can not be derived from anything else.
• Queries: are the questions you ask to your data.
• Views: are partial information that was derived from the data to help answer the queries.
Marz et. al. argued the benefits of using a factual based model for data analytic processing and we decided to use the same as it seems to have key properties that suit best cloud specific requirements. In the factual model every piece of information is considerd a fact. These facts are the fundamental pieces of the pipeline and have key properties: rawness, immutability, and perpetuity.
RawnessThis property refers to the ability of the data to answer queries. Thus, the
”rawer” the data, the more queries can be answered. As an example, in a social network application, we can decide to store for each users the ids of her friends, then we can answer a query on how many friends she has but our system can not answer question on when the user A became friend of other user B , or if the user A had previously as a friend user C. If the system would have stored more information like dates and each friend (or unfriend) event those queries could have been solved (Marz & Warren, 2015, p. 30).
Naturally, if the system is capable to store rawer data then more questions can be answered in the future, even those questions that where not known in advance. However this comes with a trade-off, the rawer data, typically the more storage is required. Nevertheless, storage is cheaper than processing or data movement, therefore the data pipeline should be designed with this consideration in mind (Marz & Warren, 2015, p. 31).
ImmutabilityData is immutable. There is no update nor delete of data, only new data is
added. This give us two advantages (Marz & Warren, 2015, p. 34):
• Human-fault tolerance: human errors happens, thus, human-fault tolerance is a must in the data pipeline. With an immutable model, the impact of human mistakes is limited. There is no option of update a good data item with bad data (or completely delete it), and if new bad data is added, it can be later removed and the queries reprocessed.
• Simplicity: in an immutable model, as the only operation is to add data items there is no need to index the data which is a big simplification.
Perpetuity
13

This property is a consequence of the previous one and implies that each data item is eternally true. This is possible due the immutability characteristic of the data, as we add new data we can tag it with a time-stamp given then a context in which the data is true. New data can arrive later and it will still be true in the new context. We can think this as learning history facts, they happened some time in the past in which they were true and the record will be eternally true as long as it is tight with the time-stamp. There are some corner cases, in which data deletion may be required. For example data retention policies, where low value data items are removed; also legal regulations may impose compulsory data deletion under given conditions. In both cases, removing data is a statement about the value of the data, either you must delete it or it does not provide enough value in regards the storage cost (Marz & Warren, 2015, p. 36).
2.3 Data sources
2.3.1 Information Technology (IT)
Until here we have defined in a more or less complete way the most impor- tant characteristics about data types and properties. In this section we will focus on the data sources used in the presented work.
As it was mentioned early, the 4th industrial revolution brings new chal- lenges to the companies on how they should handle their IT systems. Traditional IT systems where separately managed from production systems. Thus, the in- teraction between both worlds were handled by humans. Industrie 4.0 changes this approach with the inclusion of the aforementioned Cyber-Physical Systems (CPS).
These systems are the fusion of the physical and virtual world. Lee describes CPS as: ”integrations of computation and physical processes. Embedded computers and networks monitor and control the physical processes, usually with feedback loops where physical processes affect computations and vice versa” (E. A. Lee, 2008).
This integration means that current IT systems should interact with the physical world in some way. Hermann identified some design principles for Industrie 4.0; these 6 design principles include, interoperability, virtualization, de- centralization, real-time capability, service orientation, and modularity. In some way these principles support companies in identifying possible pilots that later could be implemented later (Hermann, Pentek, & Otto, 2016, p. 11).
The implications of the above are used to identify IT data sources. Enterprise resource planning software (ERP), like SAP ERP, allows organizations to manage business operations. This kind of software is present in most of medium-
14

big size manufacturing companies (K. E. Kurbel, 2013, p. 127). The SAP ERP solution map can be seen on Figure 11.1.
End-user Service delivery
Analytics Financial analytics Operations analytics Workforce analytics
FinanciáisFinancial
supply Chain management
Treasury Financialaccounting
Managementaccounting
Corporategovernance
Humancapitalmanagement
Talent management Workforce process management Workforce deployment
cozra>CDC L<D<D18CL<D<CD
Procurement and logistics execution
ProcurementInventory and
warehouse management
Inbound and outbound logistics
Transportationmanagement
co>-o<D
IICD
Productdevelopmentandmanufacturing
Productionplanning
Manufacturingexecution
Productdevelopment
Life-cycle data management
Sales and service
Sales order management
Aftermarket sales and service
Professional-servicedelivery
Corporateservices
Realestáte
management
Enterprisepccpt
Project Environment,and T ravel health, Qualityaoov i
management
portfolio manage and safety managemanage ment compliance ment
ment management
Globaltrade
services
Figure II.1: SAP ERP solution map (SAP 2012e)
As it can be seen, SAP ERP, covers vastly most of the resource planning functions of a company. Thus, its an excellent source of data from the IT world. It is worth mentioned that traditional paradigms in which ERP systems were based like ”centralized planning and scheduling” are inefficient and against the Industrie 4.0 design principles (Spath, Gerlach, Hammerle, Schlund, & Strolin, 2013, p. 22).
This paradigm shift to a decentralized coordination of self-controlled and autonomous processes implies some kind of lost in relevance in systems like SAP ERP that will must delegate process like inventory management, workforce and plan capacity allocation among others (Spath et al., 2013, p. 23).
Nevertheless, the inclusion of CPS and the SmartFactory vision is not likely to happen in a short period of time. Bauernhansl refers to three generations of CPS devices, and only the last one is capable of analyze data and being network compatible to interact with IT world (Bauernhansl, 2014, p. 16-17). Still the devices will have some autonomy but ERP systems will still have some importance role. For example, in a manufacturing company, engineers can use computer systems to design a new product and then ERP system to create the corresponding
15
parts required for production, and the Bill Of Materials (BOMs).This is a valid source of information in CPS environments and it will be
required also in our data pipeline to solve further workloads defined in ChapterIII. Some characteristics that makes this data source likely to be used is not only the valuable insights that can be obtained but the easiness of ingestion of the data in the pipeline. Lets think that systems like SAP ERP properly handles ingestion of data in their RDBMS that by its nature will store the data in a structured format. Furthermore, some data conversions are automatically handled by the system, like strings to integer conversions, or veracity of information that is validated at data input time.
2.3.2 Physical World
The Cyber Physical Systems will connect the cyber world with the physical world. We have previously identified one data source from the cyber world as the integration of IT Systems like SAP ERP. From the physical world perspective, three generations of CPS devices are identified by Bauernhansl. In the first gen- eration, CPS devices uses technologies like RFID for unique identification tasks but analytics and storage are handled in a centralized way. The next generation adds sensors for measure the physical world and actuators to interact with it. Fi- nally, the third generation, includes storage, processing and network connection capabilities (Bauernhansl, 2014, p. 16-17).
This last generation is capable to capture data from the real world with their equipped sensors, process them, interact with other system to take decisions, and finally interact with the real world again through the actuators (Spath et al.,2013, p. 23). For example, an intelligent bin (iBin) that has an infrared camera incorporated that allows it to determine the amount of C-parts in it. When the amount of parts cross some security stock limit the bin can automatically order via RFID new parts in real-time (Gunthner & Klenk, 2014, p. 307).
Another example can be a CPS in a production line, the CPS measures the rate in which raw materials or products part are being delivered into the machine and the rate of the final products at the end of the machine among the serial num- ber of each product, because of its processing capabilities it can calculates the production time for each product and also it has the knowledge of the BOMs and the estimated production times included in the order. All this information is sent into the pipeline and meaningful insights can be obtained, like anomaly detection on real-time basis for unusual production times, or if other CPS with temperature sensors built-in also provides information, correlations of how temperature affect the production rate can be determined.
There are some considerations with these data sources. CPSs are from
16

different kinds, and have different capabilities. Moreover, due its nature to measure or capture different aspects of the real world the data provided is not easily processed as is. This type of data source, unlike the previous one coming from the cyber world, is mostly semi-structured or unstructured. Further clean up, error cleaning, and preprocessing must be done in order to be ready for analysis.
2.4 MetadataIn the previous sections we have discussed many aspects of the data,
as its types, properties, and sources, but in data management systems it exists other type of ”data” usually as important as the data itself, and this is the metadata related to the data. In the presented environment it becomes critical to understand and take decisions related to metadata (Grover et al., 2015, p. 31).
2.4.1 What means metadata
Generally speaking, metadata refers to data about the data. There are many things that can be stored in regards to master data, to list a few:
• Logical data sets metadata We have not given too many details about data storage yet, but in a distributed file system one can have multiple logical data sets. Related metadata to them includes location of the data set, schema information, partitioning and sorting properties, and/or format of the data set. Usually this metadata can be stored in a metadata repository.
• HDFS files metadata
Once more, in a distributed file system, information like location in the data nodes of the blocks of a file, permissions and ownership are part of meta- data. In Hadoop installations this is stored and managed by the NameNode.
• Data ingestion and transformations metadata
Information like which users created a given data set, or the pedigree of the data, how long it took the transformation layer to create it, or the size of the data ingest are included within this type.
• Data set statistics
Lastly, statistical information like, total number of rows in the data set, data distribution histograms and boundaries values are included here. This information can be used for optimization purposes in execution plans for exam- ple.
17

2.4.2 Importance of metadata
There are three main reasons to give such importance to the metadata (Grover et al., 2015, p. 32)
• In distributed file systems the handling of files is not as the same as a normal operating system file system. To let the users interact with the data without worrying about where or how the data is stored, the role of metadata is key.
• To handle scalability and fault-tolerance data sets might be partitioned and sorted, information about how these task were performed can later be lever- aged by various tools while ingesting and querying data.
• It allows you to perform data discovery and lineage analysis.
This section has been just a mention about metadata, but it is a big and interesting topic that deserves its own study. Dismally it is out of the scope in the present work.
18

III. WORKLOADSAfter we have defined the data sources and the data types of our pipeline,
then we need to define which are the questions (queries) that we will ask to this data. Thus, we need to define the workloads of the architecture. CPSs have intro- duced new type of workloads, or the need to mix different workloads for a single query of the data. Therefore, a categorization of the workloads is necessary.
Depending on which is the criteria used for the categorization we can divide workloads by application domains, periodicity of data processing, microar- chitectural behaviors, etc (Jia et al., 2014). We selected periodicity of data processing as criteria for categorization because it seems to fit very well the nature of data in CPS and Smart Factories. From this criteria, workloads can be separated in two main categories, streams and batch processing.
3.1 Streams and BatchPeriodicity of data, also called timeliness ofdata, may refer to the period of
time from when data is available for ingestion to when it is accessible for processing. This is a very important factor because the ingestion layer in the architecture will have a big impact on how this data is stored and how it be ingested.
Although, we should differentiate this periodicity of data, with the periodicity of data processing. When we refer to batch or streaming processing, we refer on how fast our events are processed but may differ on how fast the data is available. Just to give a small example to clarify this point. Think on a web server application hosted on hundreds of web servers generating gigabytes of logs per day. Thousands of entries per seconds are available and thus pushed to the data pipeline. From this point of view, it is valid to consider this as an stream of data (we could have the same information pushed in batches once per hour). However, we can have two different types of workloads, a batch workload, that run every hour to do a clickstream analysis, and a stream workload, that run continuously, to perform a fraud detection analysis(Grover et al., 2015).
Thus, even though we have a stream as a data input and we need to properly handle the ingestion of data, we can have a batch or a stream or both types of workloads. This point will get more clarified in the following chapter when we present the layers of the data pipeline and we will define the scope of the batch and streaming workloads.
After this clarification, it is common to have further categorizations of the batch and streaming workloads. Hence, we can subsequently classify the work-
19
loads in:
• Macro batch: or commonly batch is when data is processed in ”batches”, usually from 15 minutes to hours. As we mentioned early, clickstream analysis can fall into this category.
• Microbatch: another category is the events fired off every 2 minutes but not more than the Macro batch. These workloads require different implications in the design of the pipeline thus are separated of common batch but are not fast enough to be considered streaming.
• Near-Real-Time or Real-Time: commonly known as streaming, in this category we will have data delivered under 2 minutes to even less than 100 milliseconds for real-time cases. Our previous fraud detection analysis is a good example that falls in this category.
An important clarification is that when we move from macro-batch towards real-time, the complexity of the architecture, and the implementation costs in- crease substantially (Grover et al., 2015).
The importance on understanding the workloads relays on several design factors. In the previous chapter, we have talk of some considerations of data storage regarding the data type. Workloads affect also data storage, as the require- ments move towards real-time category we should start discarding permanent storage as the first option, and think more about in-memory-first solutions and permanent storage as second (Marz & Warren, 2015).
Furthermore, in cloud based architectures, bandwidth is a critical factor, not only for the performance and velocity of data delivery but for its associated costs. For example, depending on how fast the data is delivered and its size, may be better to compress it before being sent over the wire. In the other hand, streaming workloads, may need a more real-time processing and compression times may introduce latency in the pipeline.
In CPSs we have multiple data sources, like aforementioned in Chapter II, the data pipeline should be able to ingest data from sensors, machines, databases, external web services, etc. Regarding the nature of the problem, and taking into account that most of these data come in either a semi-structured or unstructured format (Assuncao et al., 2013, p. 8), a layer for filtering and cleaning the data it is required (Agrawal et al., 2011, p. 7). This will be presented in the next chapter, but it is worth to mention it here, thus, the workloads of the system are not able to work with these type of data.
It is vital to understand this requirement because, in the end, the workloads are the real job on the data that will give us valuable information. If we have wrong data as an input we will get non useful information at the output of the system.
20
For example, one can think in a system that handle and process the information of many health centers, the records and indications of the patients are written by the health professional but they may contain errors. If our system is not able to detect and clean these errors, it may indicate a wrong amount of a medicine to be delivered to the patient (Agrawal et al., 2011, p. 8).
Thus, the whole architecture should be designed to be able to ingest all of the sources and prepare the data for the workloads. Although, there are many other considerations that should be taking into account for different types of workloads like, privacy of the data (Do we really need to identify users in the data to perform the analysis? Are there any legal regulation that force us to remove some PII?), security (What are the security requirements of the data we are processing?), data pedigree (How trustworthy is the data? Do we know where this data come from or how it was derived?), etc. The amount of considerations for design this kind of architectures is enormous, thus, we can not cover all of these considerations in the present work.
At this point, we have some useful data to work on it. The question now is, what type of workloads are common in CPS systems? Are batch or streaming workloads? and here we arrive to a complex point. There are many different type of workloads out there. Zhen Jia et al have made a characterization of more than 15 workloads (Jia et al., 2014) whereas Gao Wanling et al. reviewed 40 workloads to derive 8 dwarfs (Gao et al., 2015, p. 8) 1 to do a similar task and finally, Lei Wang et al. have clustered 77 workloads using K-means into 17 representative clusters (Wang, Zhan, Jia, & Han, 2015). This can give us an idea of the size of the problem related to workloads definition.
Given the amount of research (Gao et al., 2015) (Wang, Zhan, et al., 2015) (Jia et al., 2014) (Ferdman et al., 2012) (Chen et al., 2012) in the characterization of workloads regarding the algorithms used, or application domains we will focus only the identification of the types of workloads in CPS in regards to the type of processing, batch or streaming.
In CPS is common to find both types of workloads, batch and streaming, but also, there are workloads of both types at the same time. We can think for a moment in our previous fraud detection example, in a very simple description, we have an input (credit card approval) and the system will valídate this transaction against a userprofile and decide if accept or decline it. We can consider this user profile as the expected behavior of the user purchasing activities, for example, if the user lives or has his card registered in a country A, and the transaction is happening in a country B that is not registered as a travel destination in the user profile, then the transaction will be declined.
Until this point the workload is only one of the streaming type. Another
1 Dwarfs are highly abstractions of frequently appearing operations
21
streaming analysis is to check the last ”n” transactions of the credit card and verify whether these transactions happened in the same time window (a user can not make purchases in different locations at the nearly same time with the same card). This is called a ”windowing analysis” and it is a common workload for stream processing (Marz & Warren, 2015).
Although, we now will refer to the generation of the user profile. This should be something that knows the user purchasing behavior and thus it should evolve as the this behavior change over time. To accomplish this, the systems are de- signed to ingest and store every user transaction, and later a batch job using machine learning algorithms updates the model (or as we referred early the user profile) of each given user. In this way the system is capable to ”learn” the user behaviors and further transactions approval or rejection will be more accurate.
Therefore, the original workload type is now ”split” in two parts, a streaming near-real-time processing side, in charge of validate the transaction at ”card swipe time” using a given profile and performing some windowing analysis, and a second side, in which machine learning algorithms, or humans using different tools can perform analysis in a batch processing way updating the user profile.
The ”fraud detection” example can be generalized as a ”system capable to take a decision based on a known behavior of an actor”, in other words, having the ability to differentiate normal and abnormal events. This is a complete area in data analytics called anomaly detection or even more general outlier detection. This type of analysis can be applied to different use cases than the fraud detection; in the CPS, Industrie 4.0 and SmartFactory world, the technique can be used, for example, in an early detection of failures in the machines of a production line (E. A. Lee, 2008, p. 365) .
At this juncture, we have described the importance of data preparation and cleaning, and the different types of workloads. It is also valid to note, that we are introducing ”layers” in our architecture in a non formal way yet (that will be done in the following chapter). The first layer is the ingestion of data, then the cleaning of errors, and preparation of the data (including the mentioned privacy, veracity, and security considerations not analyzed in this thesis) to be able to execute the workloads, and finally the workload execution layer (Agrawal et al., 2011, p. 7).
This last execution layer is not well defined until here. In the aforemen- tioned example, the query to the data happens at ”card swipe time”. This means that in that exactly moment, when the user is in the cashier trying to pay, the system execute the workload and validates the transaction. But what would happened if we did not have the batch side of the system? The whole workload would have to be run to generate a user profile and then validate the transaction. This implies reviewing the whole history of transactions, and some machine learning algorithms, in the end it would take more than a couple of seconds. It could be 5
22
min or half an hour, either way it is not viable a system for this kind of workload to take this much amount of time.
Consequently, the system perform a batch analysis and stores a profile for fast access during purchase time. This is possible for the nature of the workload (batch and streaming) and because the user is not likely to perform hundred of purchases per hour. Nonetheless, we can think in a different scenario, in which we have a batch workload but we still need fast responses at query time. Here, two ”time frames” associated with layers are given. The first one, is the processing of data at ingestion time, and in second place, we have the processing at query time. We have now a new question, what we process (regarding the workload) and when process it?
This is not a trivial question, thus the performance and response time of the whole system is affected by the answer. In this new scenario, we can instruct the system to execute some ”part” of the workload at the ingestion time, and the other ”part” at query time. Ergo, we can do some processing and pre-calculate part of the queries in one time, and at query time, we can complete that processing and show the results in a faster way. A deep understanding of the nature of the workloads is critical to design a pipeline.
23
IV. ARCHITECTURE BUILDING BLOCKS
4.1 IntroductionAs we stated earlier, we have defined the inputs and outputs of our data
pipeline; now we must define the architecture for ingest, process, and return the results of the specified workloads. After reviewing the literature, we found many different architectures that seems to be suitable for the described sources. In this chapter we will describe the chosen architecture and each of its building blocks.
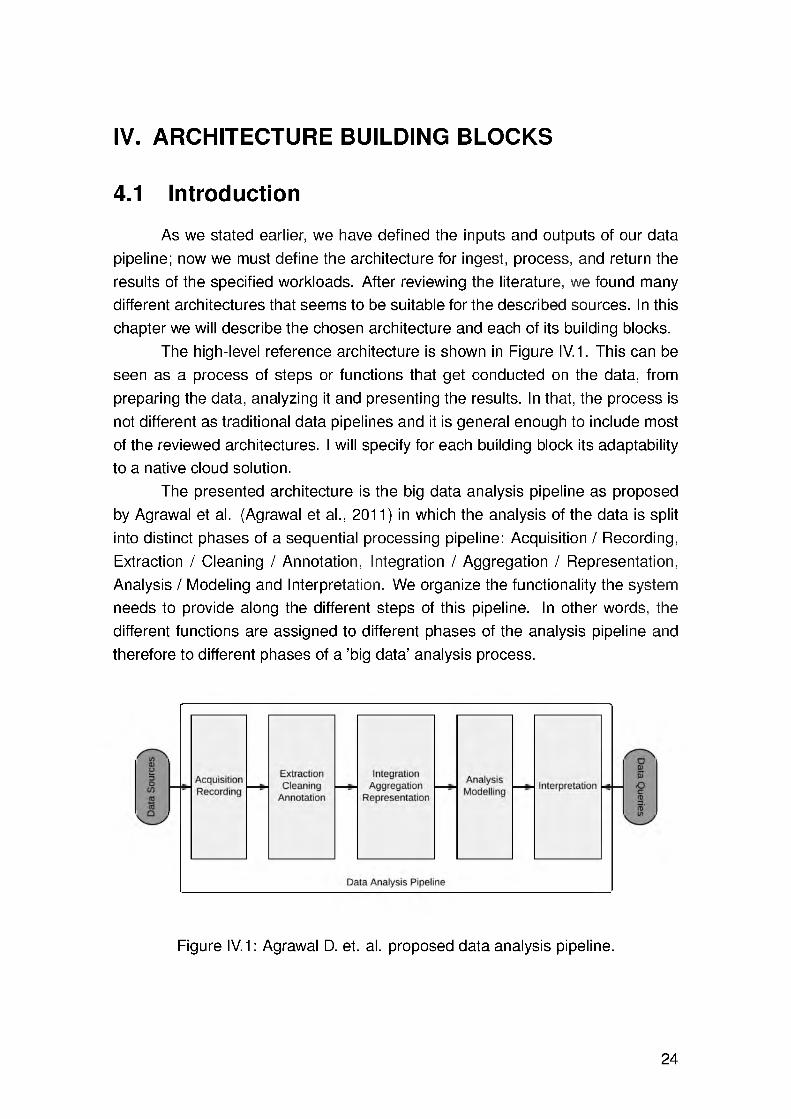
The high-level reference architecture is shown in Figure IV.1. This can be seen as a process of steps or functions that get conducted on the data, from preparing the data, analyzing it and presenting the results. In that, the process is not different as traditional data pipelines and it is general enough to include most of the reviewed architectures. I will specify for each building block its adaptability to a native cloud solution.
The presented architecture is the big data analysis pipeline as proposed by Agrawal et al. (Agrawal et al., 2011) in which the analysis of the data is split into distinct phases of a sequential processing pipeline: Acquisition / Recording, Extraction / Cleaning / Annotation, Integration / Aggregation / Representation, Analysis / Modeling and Interpretation. We organize the functionality the system needs to provide along the different steps of this pipeline. In other words, the different functions are assigned to different phases of the analysis pipeline and therefore to different phases of a ’big data’ analysis process.
Figure IV.1: Agrawal D. et. al. proposed data analysis pipeline.
24
4.2 Building Blocks
4.2.1 Acquisition and Recording
Acquisition and recording, also known as data ingestion layer, refer on how the data arise from the source and is stored. There are several points to consider for this phase. Firstly, as it was described in Chapter II, the variety of sources in CPSs is very wide. A big portion of this data is of no interest, and it can be filtered, also much of the data coming from the same sources may contain similar information and can be compressed by orders of magnitude. One of the big challenges in this phase is to define these filters in such a way that useful information is not discarded.
Another important point is the ability to generate the right metadata to describe what data and how it is stored, and how is measured. There are metadata acquisition systems that can help in storing metadata. Additionally, it is important here to store information regarding the origins of the data for later data prove- nance along through the pipeline.
In CPS we have two main parts as we described earlier. The IT source, in which the data arise mostly from databases, files, or streaming. Usually these data is structured or semi-structured, and filtering and compression are more eas- ily done or even not required. In the other hand, we have the physical world, in which automatic systems generate the data while are actively working (e.g. in manufacturing industries, while actually manufacturing a product) and the acquisition can vary among different options, local storage in the machine and further manual dumps of the data, network capable machines or other type of buses, etc.
For a cloud native solution it is required that the sources allow data acquisition from the cloud, this means that our CPSs should be capable to push (or being pulled) by the ingestion layer of the pipeline in the cloud. Another key point is the ”velocity” of the data. For cloud solutions, the bandwidth is critical, not only for a performance but for a costing point of view.
Data ingestion in the cloud can be performed by instantiating computer resources and choosing and configuring the appropriate tool, or leverage on some cloud provider proprietary tools (some of them will be mentioned in the following chapter). .
The storage of the master data set is another key point. As we mentioned in Chapter II it is indispensable to have in hand a fault-tolerance storage. Again, we can create our own compute resources and configure a storage system like for example, Hadoop Distributed File System (HDFS) or leverage on cloud providers solutions like Amazon S3. The way in which the data is stored will affect how it can be consumed, so it is vital to design carefully the storage strategy (Marz &
25
Warren, 2015, p. 54).Considerations for design a storage solution may include:
• Efficient appends of new data
• Ability to scale to tera- or petabytes of data
• Parallel access for processing
• Compression capabilities
• Immutability enforcement
• Fault-tolerance and data replication
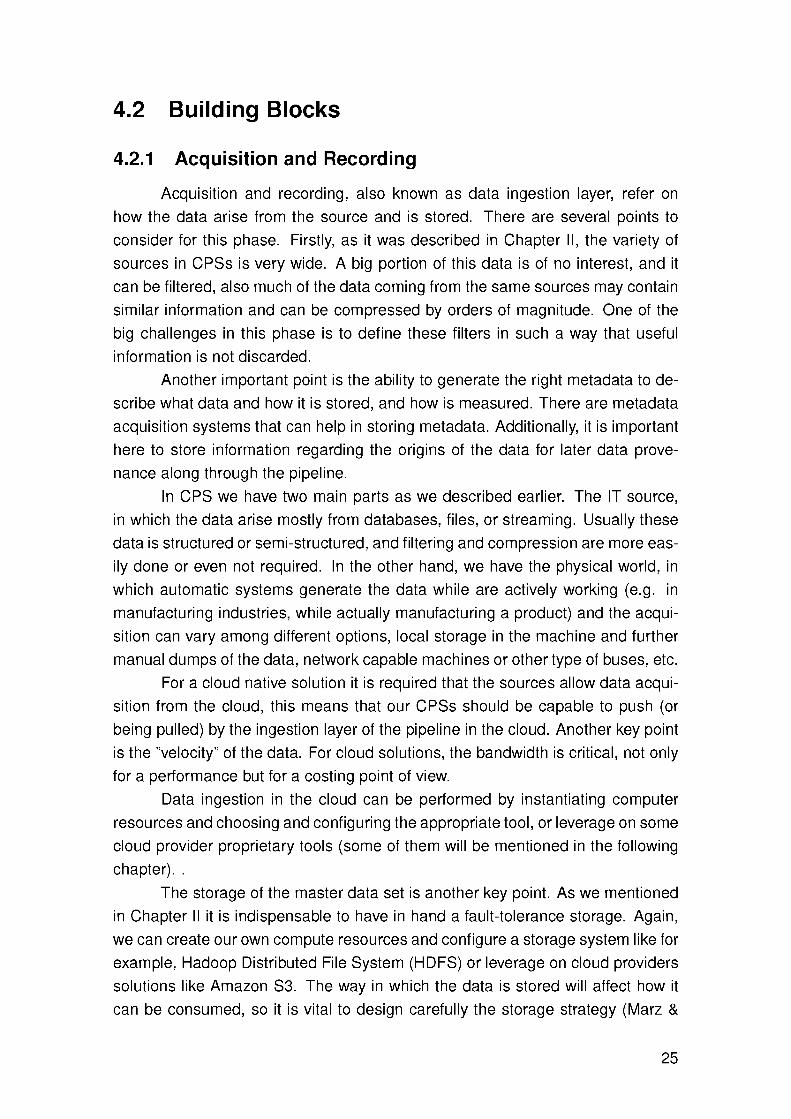
Despite the storage layer is built to run functions on the entire data set, many of the workloads may not require access to all data. For example, a daily clickstream analysis will need only the logs for the given day. Thus, this layer should allow data partitioning. It can be can be done in a simple way by sort- ing your data into separate folders. Another example can be login information storage. Each login contains the IP address, the user and a times-tamp; a valid partitioning scheme is shown in Figure IV.2 (Marz & Warren, 2015, p. 61-62).
Figure IV.2: A vertical partitioning scheme for login data.
Lastly, there are multiple formats for data storage and they have different strengths and weakness. Characteristics that are important and thus desirable are:
• Compressibility
• Splittability
• Columnar format
26
4.2.2 Extraction, Cleaning and Annotation
The information ingested can be from one of structured, semi-structured and unstructured data sources and with different data types as described in Chapter II. Aforementioned we explained that different data type affects the processing pipeline. For example, unstructured data requires an information extraction phase to retrieve the information and expresses it a structured form, whereas structured data is already in that format. Data extraction is still today a technical challenge.
Moreover, the truthfulness of the data can not be slighted. In many cases the data is not telling us the truth. Thus, data extraction phase may also involve some sort of data filtering. Data can be filtered either because it is not required in the following phases of the pipeline, or it is not suitable for further analysis. This filtering or cleaning can be done based on attribute, rule, or even using machine learning models but a good understanding of error models is required (Agrawal et al., 2011, p. 8).
Given the nature of CPS, data sources within the cyber world systems usually provide structured data so an ’information extraction’ phase may not be required, nevertheless, their counterpart is mostly semi-structured or unstructured and information extraction, and filtering is a must. Some ingestion tools offers also some kind of processing allowing to centralize ingestion, extraction, filtering and storage in one tool. This simplification, from a cloud point of view, it may be useful reducing the complexity of configuring and managing different set of tools. Some examples will be shown in Chapter V.
4.2.3 Integration, Aggregation and Representation
In this phase of the pipeline some functions should happen. Integration im- plies the harmonization of data from different sources and bring them to a common schema. This transformation allows that all data can be queried together. This is required because the data in different sources are modeled differently.
Given this heterogeneity of data, it is not sufficient to only record the data and keep it in some repository. Data aggregation and analysis are challenge tasks. They involve something more than simply locating, and presenting the data. This phase must prepare the data in a way that is ready for the workloads to be executed. This requires not only that the data structure and semantics become expressed in a way that computer can understand, but to understand which parts of the workloads can be pre-processed beforehand the real execution occurs at query time (Agrawal et al., 2011).
This can involve aggregation between different data sets, and different al- ternatives on how the same information can be stored. Some storage designs may have advantages over others for a given workload. Interaction between the
27
system architect and domain scientists can greatly improve the data storage de- signs.
4.2.4 Modeling and Analysis
This phase is the one in charge of receiving the query from the user and perform the corresponding workload to obtain insights from the data. Depending on the application of the pipeline this layer may not be end-user facing but run some given workloads and calculate intermediate views (pre processed results).
Advantages of this may include performance reasons that requires pre- processing, like the example aforementioned of fraud detection. The behavioral purchase profile of the users is pre-computed in batch mode and then used at purchasing time to approve or reject the transaction.
There are also two cases for this, user facing analysis requires an inter- face for end-users to define their own computations, whereas dashboards or pre- defined reports have also a pre-defined set of queries to execute.
A key point here is the requirements of the workloads that will let us later define the processing engine to be used. From the batch and streaming point of view, understand the workloads will condition us to one or more options to be used here. For example, a general purpose workload can benefit for using a system like Apache Spark (Zaharia, 2016), whereas a real-time application needs a streaming processing engine like Apache Storm.
Moreover, the data types and the portability of algorithms should be thought here. As we mention early, algorithms portability is merely conceptual but from a practical point of view is not the same. For example, it may make more sense in the previous layer to transform the data to a different data type, pre-compute some data, aggregated it, and process it here we some algorithm that may have advantages than not transforming the data and using another algorithm (Aggar- wal, 2015, p. 3) .
Furthermore, because of the interconnected nature of CPSs, a vast amount of information from different elements in the network allows the pipeline to perform cross-checks, or validate data, and find hidden links between them. To accom- plish this, we need not only the cleaned, validated, and efficiently accessible data, but a query interface capable to express all of the questions that the user want to perform. For example, some years ago was not thinkable to perform SQL alike queries on top of a Hadoop cluster, whereas today there are many different tools to do it.
In CPSs we do not have a good level of control on the data types and sources, neither in the quality of the data that we are receiving. Thus, under- standing which questions we want to perform to the system is also key to decide
28
which type of cleaning, filtering, pre-processing and processing our data needs. This affects directly how we should think about this building block. In our cloud pipeline this layer has a particular importance because the temptation of increas- ing the performance of the system by adding more resources to it can come with absurdly increases on costs. While a smart design and proper definition of the tasks in previous phases of the architecture can significantly reduce the costs and also increase the performance.
4.2.5 Interpretation
Interpretation layer is sometimes not considered in the literature, but is a key component of the pipeline. The ultimate goal of the whole architecture is gain valuable insights from the data but if the user is not able to understand the performed analysis the value of the pipeline is strictly limited. To achieve a good interpretation of the analysis, supplementary information must be provided. This information should let the user understand how the results were derived.
Due the complexity of the data pipeline, this is not an easy task to perform. Wrong or missing metadata stored hardly increase the complexity of this. Fur- thermore, the pipeline involves multiples steps in which several assumptions are made. Hence, most of this information and assumptions should be exposed to the user in certain way to let her examine it critically (Agrawal et al., 2011).
29
V. ARCHITECTURE ALLOCATION TO TOOLS AND SERVICES
5.1 ToolsAmong the different layers that we have defined, we can find different tools
that fit one ore more layers of the pipeline. Recognizing the nature of our workloads and data sources and types will let us choose the tool best suited to ac- complish each task.
In this chapter we try to present some of the available tools in the big data processing and analysis and how those can fit one or more layers in the different architecture layers. For this, we try to give at least two tools for each layer to have a better overview of different possibilities that an architect have.
Because the same tool sometimes is useful for more than layer we decided to explain each tool and in which layers make sense to use it. We first will give the literal description found on their owns web sites, then we will explain their usage or application in regards to the architecture layers and finally make some considerations if needed.
5.1.1 Apache Flume
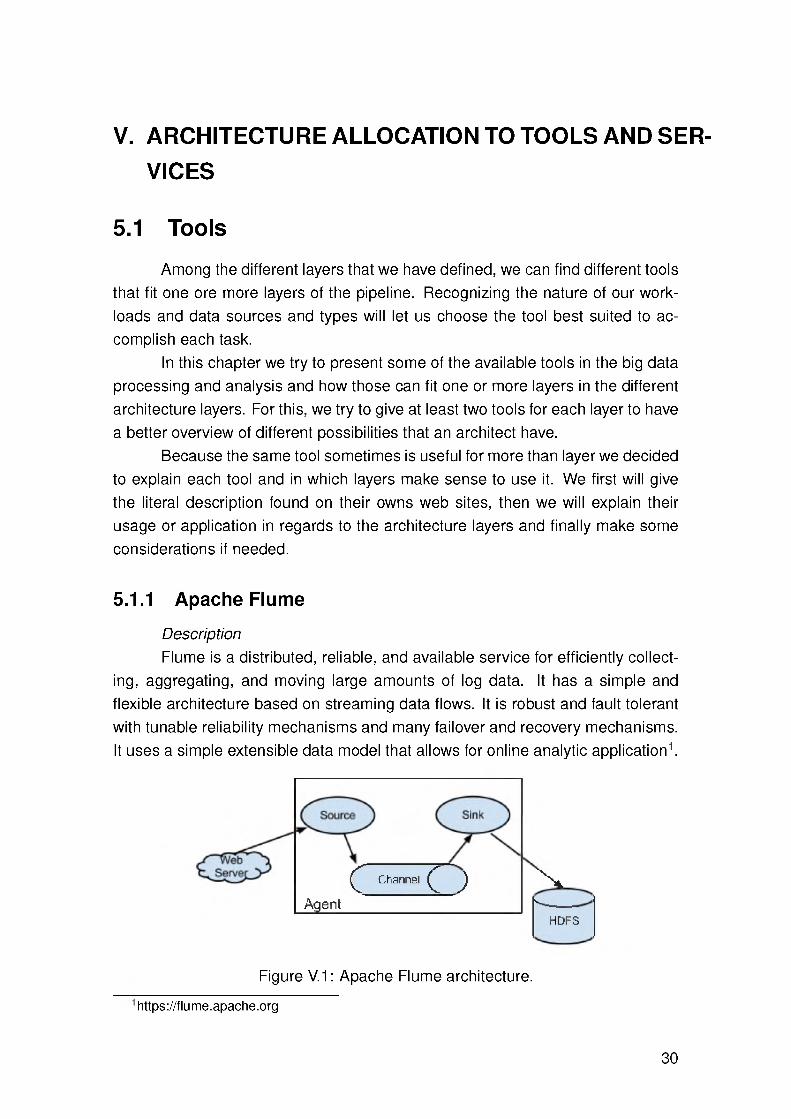
DescriptionFlume is a distributed, reliable, and available service for efficiently collect-
ing, aggregating, and moving large amounts of log data. It has a simple and flexible architecture based on streaming data flows. It is robust and fault tolerant with tunable reliability mechanisms and many failover and recovery mechanisms. It uses a simple extensible data model that allows for online analytic application1.
Q Channel Q ) X
Aoent S ---------AgentHDFS
Figure V.1: Apache Flume architecture.
https://flume.apache.org
30

UsageApache Flume, is a well known tool in event-based data ingestion environ-
ment. Its simple architecture is show in Figure V.1 and it gives it the powerful capabilities that it has. In its basic form, Flume is a queue service. It has sources that are loose coupled to one or multiple channels. This sources are in charge of receiving events from the applications originating them. While is true that the source can be customized to get virtually any data source, practically Flume is best suited for event-based sources. After the message is put on the channel it will remain there until a sink take it out of it. It allows chaining of multiple agents until delivery of the message to a final terminator.
Flume interceptors are small pre-defined processing units that allows us to perform some operations like, time-stamp events, add custom headers, transform data with regular expressions or even discard records.
For its features, Flume is very well suited to be used in the acquisition layer as the variety of sources and sinks is very big, and even if the exactly source or sink is not available one can build her custom module. Furthermore, Flume interceptors are a great option to perform time-stamp and certain cleaning and filtering tasks corresponding to the extraction layer.
ConsiderationsOne consideration about Flume, is that despite it is capable to read from
many sources, it does not perform well for batch ingestion from RDBMSs.
5.1.2 Apache Sqoop
DescriptionApache Sqoop(TM) is a tool designed for efficiently transferring bulk data
between Apache Hadoop and structured datastores such as relational databases2.
IMPORT
EXPORT
Usage
2https://sqoop.apache.org
Figure V.2: Apache Sqoop architecture.
31

In contrast with Apache Flume, Sqoop is widely used to move information in batch (or bulk) process from RDBMSs to HDFS and vice versa. Sqoop lets you import table no matter how long they are, in singles jobs or multiple DB sessions and table data split among all of those. It also allows compression codecs to be used to reduce bandwidth resource usage. In addition to HDFS, Sqoop can import data to HBase and Hive. It also have useful features to write metadata in a metadata repository like HCatalog.
5.1.3 Apache Kafka
DescriptionApache Kafka is publish-subscribe messaging rethought as a distributed
commit log. A single Kafka broker can handle hundreds of megabytes of reads and writes per second from thousands of clients. Kafka is designed to allow a single cluster to serve as the central data backbone for a large organization. It can be elastically and transparently expanded without downtime. Data streams are partitioned and spread over a cluster of machines to allow data streams larger than the capability of any single machine and to allow clusters of coordinated consumers.
Messages are persisted on disk and replicated within the cluster to prevent data loss. Each broker can handle terabytes of messages without performance impact. Kafka has a modern cluster-centric design that offers strong durability and fault-tolerance guarantees.
producer producer producer
kaíkacluster
1t
consumer consumer consumer
Figure V.3: Apache Kafka architecture.
UsageAs its description says, Kafka is a high scalable and fault tolerant publish-
subscribe messaging system. It is used also in the data ingestion layer for its good scalability and performance. For cloud implementations with multiple processing layers, Apache Kafka can be used as a messaging bus between those layers.
32
5.1.4 Apache Storm
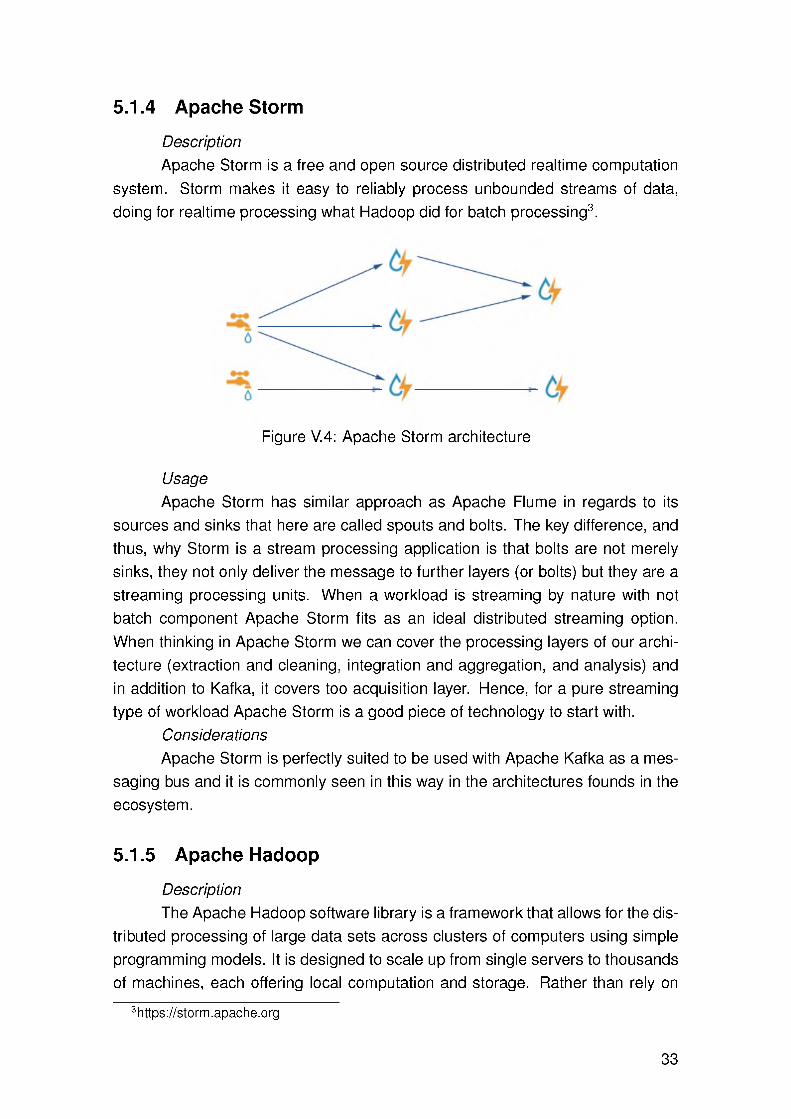
DescriptionApache Storm is a free and open source distributed realtime computation
system. Storm makes it easy to reliably process unbounded streams of data, doing for realtime processing what Hadoop did for batch processing3.
Figure V.4: Apache Storm architecture
UsageApache Storm has similar approach as Apache Flume in regards to its
sources and sinks that here are called spouts and bolts. The key difference, and thus, why Storm is a stream processing application is that bolts are not merely sinks, they not only deliver the message to further layers (or bolts) but they are a streaming processing units. When a workload is streaming by nature with not batch component Apache Storm fits as an ideal distributed streaming option. When thinking in Apache Storm we can cover the processing layers of our architecture (extraction and cleaning, integration and aggregation, and analysis) and in addition to Kafka, it covers too acquisition layer. Hence, for a pure streaming type of workload Apache Storm is a good piece of technology to start with.
ConsiderationsApache Storm is perfectly suited to be used with Apache Kafka as a mes-
saging bus and it is commonly seen in this way in the architectures founds in the ecosystem.
5.1.5 Apache Hadoop
DescriptionThe Apache Hadoop software library is a framework that allows for the dis-
tributed processing of large data sets across clusters of computers using simple programming models. It is designed to scale up from single servers to thousands of machines, each offering local computation and storage. Rather than rely on
3https://storm.apache.org
33
hardware to deliver high-availability, the library itself is designed to detect and handle failures at the application layer, so delivering a highly-available service on top of a cluster of computers, each of which may be prone to failures4.
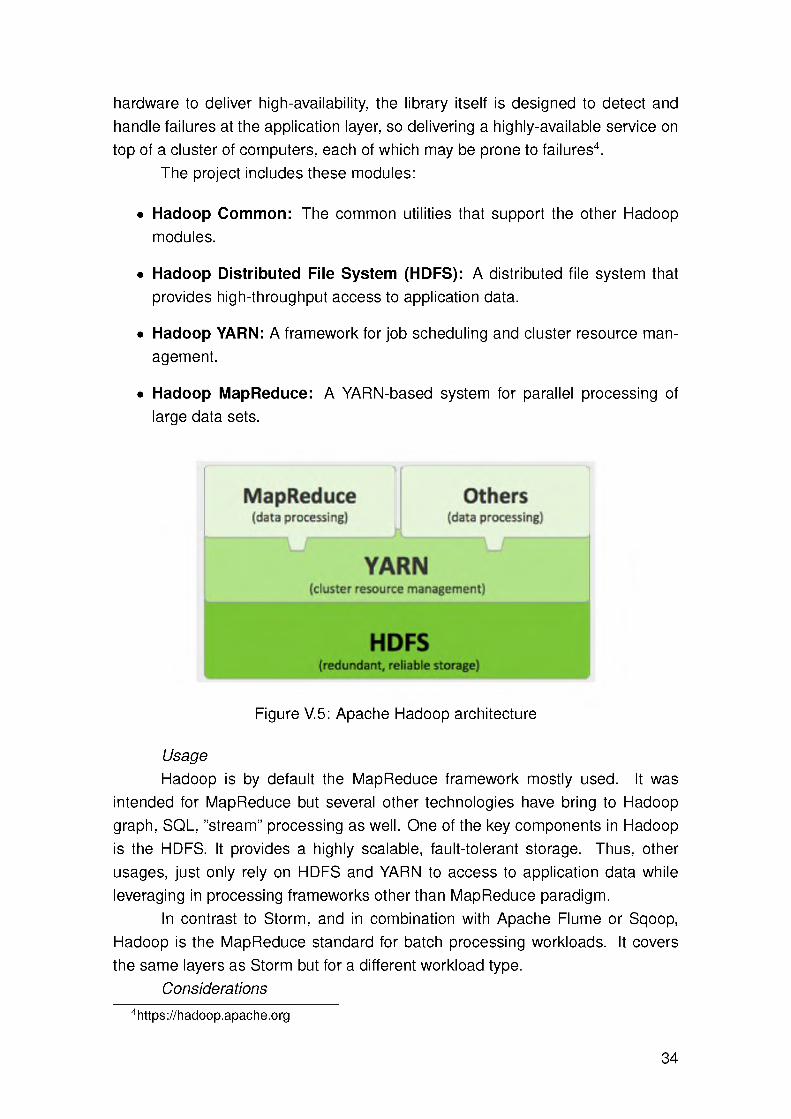
The project includes these modules:
• Hadoop Common: The common utilities that support the other Hadoop modules.
• Hadoop Distributed File System (HDFS): A distributed file system that provides high-throughput access to application data.
• Hadoop YARN: A framework for job scheduling and cluster resource man- agement.
• Hadoop MapReduce: A YARN-based system for parallel processing of large data sets.
Figure V.5: Apache Hadoop architecture
UsageHadoop is by default the MapReduce framework mostly used. It was
intended for MapReduce but several other technologies have bring to Hadoop graph, SQL, ”stream” processing as well. One of the key components in Hadoop is the HDFS. It provides a highly scalable, fault-tolerant storage. Thus, other usages, just only rely on HDFS and YARN to access to application data while leveraging in processing frameworks other than MapReduce paradigm.
In contrast to Storm, and in combination with Apache Flume or Sqoop, Hadoop is the MapReduce standard for batch processing workloads. It covers the same layers as Storm but for a different workload type.
Considerations
4https://hadoop.apache.org
34

Apache Hadoop is a top level project hosted in the Apache Software Foundation, but one can find different flavors of Hadoop by Private vendors like Cloud- era, MapR, HortonNetworks, IBM, and Pivotal Software among others.
5.1.6 Apache Spark
DescriptionApache Spark is a fast and general-purpose cluster computing system. It
provides high-level APIs in Java, Scala, Python and R, and an optimized engine that supports general execution graphs. It also supports a rich set of higher- level tools including Spark SQL for SQL and structured data processing, MLlib for machine learning, GraphX for graph processing, and Spark Streaming5.
Apache Spark is one of the most growing computing system the last years. It used for faster MapReduce like computations and with higher-level tools it can be used also for machine learning, graph, and SQL processing. Furthermore, Spark Streaming offers micro-batch streaming processing. The advantage of this application is that it brings a complete option to cover all layers of the data pipeline. From acquisition to even interpretation. Apache Spark has an interactive shell in which a user can perform several computations and data provenance.
Considerations Apache Spark accelerates batch operations and performs fairly well for near-real-time applications. Databricks was founded by Spark au- thors and offers a free option to start trying Spark.
5https://spark.apache.org
g Scala é «“Java python
Data Source
X&ttoziftnsim H B H S E @ {J S 0 N }M y5|¡S elasticsearch.cassandra ^BIVE PostgreSQL
24
Figure V.6: Apache Spark architecture (Provided by Databricks)
Usage
35
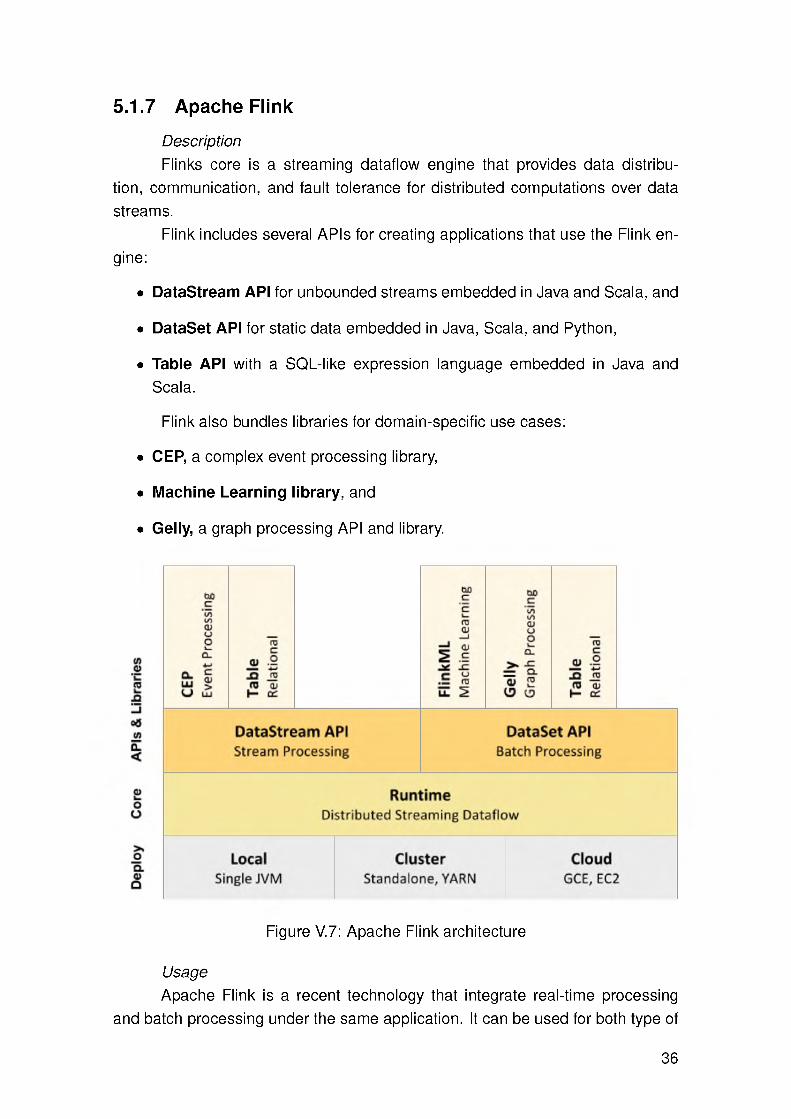
DescriptionFlinks core is a streaming dataflow engine that provides data distribu-
tion, communication, and fault tolerance for distributed computations over data streams.
Flink includes several APIs for creating applications that use the Flink en-gine:
• DataStream API for unbounded streams embedded in Java and Scala, and
• DataSet API for static data embedded in Java, Scala, and Python,
• Table API with a SQL-like expression language embedded in Java and Scala.
Flink also bundles libraries for domain-specific use cases:
• CEP, a complex event processing library,
• Machine Learning library, and
• Gelly, a graph processing API and library.
5.1.7 Apache Flink
Figure V.7: Apache Flink architecture
UsageApache Flink is a recent technology that integrate real-time processing
and batch processing under the same application. It can be used for both type of
36
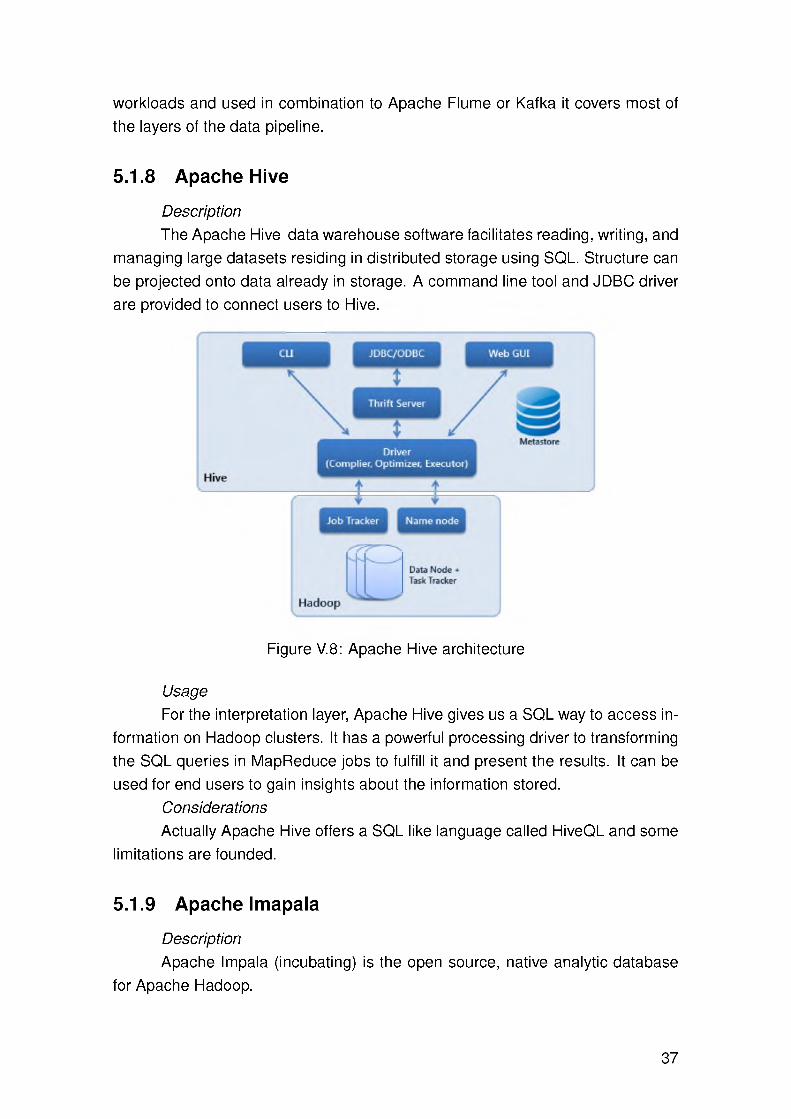
workloads and used in combination to Apache Flume or Kafka it covers most of the layers of the data pipeline.
5.1.8 Apache Hive
DescriptionThe Apache Hive data warehouse software facilitates reading, writing, and
managing large datasets residing in distributed storage using SQL. Structure can be projected onto data already in storage. A command line tool and JDBC driver are provided to connect users to Hive.
Figure V.8: Apache Hive architecture
UsageFor the interpretation layer, Apache Hive gives us a SQL way to access in-
formation on Hadoop clusters. It has a powerful processing driver to transforming the SQL queries in MapReduce jobs to fulfill it and present the results. It can be used for end users to gain insights about the information stored.
ConsiderationsActually Apache Hive offers a SQL like language called HiveQL and some
limitations are founded.
5.1.9 Apache Imapala
DescriptionApache Impala (incubating) is the open source, native analytic database
for Apache Hadoop.
37

Impala raises the bar for SQL query performance on Apache Hadoop while retaining a familiar user experience. With Impala, you can query data, whether stored in HDFS or Apache HBase including SELECT, JOIN, and aggregate func- tions in real time. Furthermore, Impala uses the same metadata, SQL syntax (Hive SQL), ODBC driver, and user interface (Hue Beeswax) as Apache Hive, providing a familiar and unified platform for batch-oriented or real-time queries.
Figure V.9: Apache Impala architecture
UsageApache Impala can be considered as the evolution of Hive. It offers better
support and more powerfull queries system. Also, batch-oriented and real-time queries can performed. It is used for data analysis layer as well as for the interpretaron layer.
ConsiderationsImpala still is an incubating project on the Apache Software Foundation.
This does not mean that the software is unstable or not usable but that the man- agement and involvement in the project is still being tracked, and if a community enough grows with it, it can be moved to a top level project.
5.1.10 Apache Pig
DescriptionApache Pig is a platform for analyzing large data sets that consists of a
high-level language for expressing data analysis programs, coupled with infras- tructure for evaluating these programs. The salient property of Pig programs is
38
that their structure is amenable to substantial parallelization, which in turns en- ables them to handle very large data sets.
At the present time, Pig’s infrastructure layer consists of a compiler that produces sequences of Map-Reduce programs, for which large-scale parallel im- plementations already exist (e.g., the Hadoop subproject). Pig’s language layer currently consists of a textual language called Pig Latin, which has the following key properties:
• Ease of programming. It is trivial to achieve parallel execution of simple, ”embarrassingly parallel” data analysis tasks. Complex tasks comprised of multiple interrelated data transformations are explicitly encoded as data flow sequences, making them easy to write, understand, and maintain.
• Optimization opportunities. The way in which tasks are encoded permits the system to optimize their execution automatically, allowing the user to focus on semantics rather than efficiency.
• Extensibility. Users can create their own functions to do special purpose processing.
UsageLastly, Pig is used for analysis layer like Impala and Hive, but also for its
powerful language Pig Latin it is also used in the processing layer.
5.2 Cloud Providers and ServicesIn the previous section we presented several tools to design and build our
data pipeline. In this section, we will present different cloud providers, in which the pipeline can be built using their services and the tools aforementioned. Moreover, we will present too, some of the Software-as-a-Service (SaaS) offered by this providers to cover the requirements for our architecture. Due to the amount of existing technologies and the complexity for estimate the hardware, software, and human resources, a cost analysis is out of the scope in this thesis. However, we highly recommend that at the time of the data pipeline design, the architect should take into account not only the performance requirements to process the required workloads but also a cost analysis of the tools and/or SaaS chosen.
It is required to understand the difference between the different cloud service model. The NIST defines three types of service models, Infrastructure-as-a- Service (IaaS),Platform-as-a-Service (PaaS), and Software-as-a-Service (SaaS). The difference between those are (Mell & Grance, 2011):
39

Figure V.10: Apache Pig architecture
• laaS: this is service model consist in provide to the user the capabilities of processing, storage, networks, and others basic computing resources, so the user is able to run arbitrary software.
• PaaS: in this service model the provider manages the underlying infras- tructure and provides the user the ability to deploy applications built using programming languages, libraries, and services supported by the provider.
• SaaS: this service model provides the user the capability to use applications running on the cloud infrastructure. However, the provider is the one who manages the underlying infrastructure and application deployment. The user is limited to modify some specific application configuration settings.
Given the vast amount of different cloud providers in different service mod- els, we decided to use Amazon Web Services (AWS) as a IaaS/PaaS cloud provider due it is the lead provider in the market. For SaaS we will consider some AWS services too and other big data SaaS providers as well.
40
For implementing the data pipeline, the architect can design it using services and tools from different service models and even different providers. Thus, a proper cost analysis is required.
5.2.1 AWS S3
DescriptionAmazon Simple Storage Service (Amazon S3), provides developers and
IT teams with secure, durable, highly-scalable cloud storage. Amazon S3 is easy to use object storage, with a simple web service interface to store and retrieve any amount of data from anywhere on the web.
UsageAmazon S3 offers an alternative for data storage layer cloud native. It is
the most robust and reliable product of Amazon and brings several properties as fault-tolerance, encryption, replication, compression and high scalability making it an attractive choice for a managed data storage layer.
5.2.2 AWS Kinesis Family
DescriptionAmazon Kinesis is a platform for streaming data on AWS, offering power-
ful services to make it easy to load and analyze streaming data, and also pro- viding the ability for you to build custom streaming data applications for special- ized needs. Web applications, mobile devices, wearables, industrial sensors, and many software applications and services can generate staggering amounts of streaming data sometimes TBs per hour that need to be collected, stored, and processed continuously.
UsageKinesis family offers actually three products, Firehose, Streams and Ana
lytics.Streams offers similar capabilities as Flume but without the power of Flume
interceptors.Firehose can be thought as the equivalent of Kafka, is a very high scalable
data ingestion system.Finally, this year, Analytics become general available and offers real-time
processing through SQL like defined applications. Used in conjunction with Firehose, the solution can offer similar capabilities as Apache Storm with Kafka.
5.2.3 AWS Lambda
Description
41
AWS Lambda is a serverless compute service that runs your code in re- sponse to events and automatically manages the underlying compute resources for you. You can use AWS Lambda to extend other AWS services with custom logic, or create your own back-end services that operate at AWS scale, performance, and security. AWS Lambda can automatically run code in response to multiple events, such as modifications to objects in Amazon S3 buckets or table updates in Amazon DynamoDB.
UsageLambda functions are a pay-as-you-go processing units. We can compare
the to Flume interceptors or Storm bolts. They can be interpolated in the pipeline to perform different activities, from data extraction and cleaning, to actually per- form aggregation or run the whole workload.
5.2.4 AWS Elastic MapReduce
DescriptionAmazon EMR is a web service that makes it easy to quickly and cost-
effectively process vast amounts of data.Amazon EMR simplifies big data processing, providing a managed Hadoop
framework that makes it easy, fast, and cost-effective for you to distribute and process vast amounts of your data across dynamically scalable Amazon EC2 in- stances. You can also run other popular distributed frameworks such as Apache Spark and Presto in Amazon EMR, and interact with data in other AWS data stores such as Amazon S3 and Amazon DynamoDB.
UsageAs the name may indicate this is a Hadoop alike managed service. It offers
also Spark processing on top of it and its used for the same layers as Apache Hadoop and Spark.
ConsiderationsLike this services are several clouds providers that offers similar sevices.
Cloduera is another well known Hadoop provider. We mentioned before Databricks for Spark as SaaS solution. Lastly HortonWorks is a big player in offering Hadoop in the SaaS fashion also providing streaming processing capabilities.
5.2.5 AWS Quicksight
DescriptionAmazon QuickSight is a very fast, cloud-powered business intelligence (BI)
service that makes it easy for all employees to build visualizations, perform ad- hoc analysis, and quickly get business insights from their data. Amazon Quick- Sight uses a new, Super-fast, Parallel, In-memory Calculation Engine (SPICE) to
42
perform advanced calculations and render visualizations rapidly. Amazon Quick- Sight integrates automatically with AWS data services, enables organizations to scale to hundreds of thousands of users, and delivers fast and responsive query performance to them via SPICEs query engine.
UsageQuicksight is another recently launched product from AWS and it offers
visualization capabilities to cover the interpretation layer of the pipeline.ConsiderationsQuicksight is a relatively new product and not mature enough. For a more
mature solution, Tableau offers business intelligence in the cloud with a powerfull and rich set of features.
5.2.6 DataTorrent
DescriptionDataTorrent RTS Core is an open source enterprise-grade unified stream
and batch processing engine. It is a high performing, fault tolerant, scalable, Hadoop-native in-memory platform. The engine provides a complete set of system services freeing the developer to focus on business logic. The platform is capable of processing billions of events per second and recovering from node outages with no data loss and no human intervention.
UsageThis provider, offers a stream and batch processing, covering mostly pro
cessing and analysis layers, based on an Apache Apex.ConsiderationsWe found that Apache Apex has not growth as fast as Apache Spark for ex
ample, and newer technologies like Apache Flink are taking over it. DataArtisans for example offers an Apache Flink as SaaS.
As we can see the this is just a small overview of some of the tools and services presented in the ecosystem. It is hardly to give a recommendation to use one or another tool or service and this decision will come by the hand of the data types used, the workloads to be processed, and a proper cost analysis.
43
VI. SUMMARY AND OUTLOOK
6.1 ConclusionsIndustrie 4.0, SmartFactories, Internet of Things are not only buzz words
nowadays but they have a strong impact on scholars. Academia has been study- ing CPS for some time now and after a initial literature review we could not find a cloud native data pipeline for them.
There were general big data architectures thought from a technical point of view with focus on performance. There were also studies to bring this kind of pipelines to small- and medium-sized enterprises. And there were also ad-hoc data processing in the cloud reports but most of those leave a gap that we tried to fill with the present work.
We are in the middle of the 4th industrial revolution. In a world of internet of things our work finds its context and its cloud native approach. We the advent of every day more promising tools in a SaaS fashion, cloud providers provide system architects and data scientist to interact with the data in a relative efficient and cost-effective way.
The big data world out there is immeasurable. The growth on data has been increasing at a pace that no current architecture is capable to process. Scholars are exhorted to find ways to improve and bring solutions to the open challenges. With this work we tried to contribute presenting a high level architecture and some recommendations for a practical implementation of it.
The idea behind a high-level architecture was make it general enough to be adapted to different scenarios. The CPS world is arising and new challenges ap- pear frequently, having a flexible architecture let designers adapt to this changes.
We also described different characteristics of workloads. In CPSs, exists a vast amount of different workloads, we tried to present them in general way but giving key concepts to understand what are the required points to take into account when designing the data pipeline.
Velocity, volume, variety and veracity are key concepts in big data. Most of them have their first encounter to our data pipeline in the ingestion or acquisition layer. Given the importance of properly acquire and record the data, as it is the fundamental piece of the pipeline, we gave an explanation of different data types and sources and its implications for a proper ingestion.
At the end, we wanted to give a more real view of the architecture and presented an overview of most common tools used in the ecosystem. We presented first software applications designed to deal with these issues, and then,
44
due the nature of our pipeline, we presented some cloud providers and their SaaS solutions to cover some phases of our architecture.
6.2 LimitationsFrom a technological point of view this work presented several limitations
due the wide nature of the topic and our objective to give a high level architecture that came with a trade off of depth in each subtopic.
First, referring to the data types chapter, a brief explanation about different data types was given. A more in depth explanation and its implications in the pipeline and in algorithm selection could have been more interesting.
Another limitation was the superficial explanation on data properties. In a data pipeline is not surprisingly that ”data” is the key part. Understand all of its characteristics is key to a correct design of the architecture. We opted to ex- plain the minimum of those characteristics that enable us to design a meaningful pipeline. However, properties like privacy, security, governance were just men- tioned.
In regards to data storage a basic knowledge was described. Neverthe- less, in big data environment and with the exponential growth of data volumes, a proper understanding of data storage properties, capabilities and designs will help design efficiently a data storage layer to support the pipeline, not only from the performance point of view but also from the storage costs.
Finally, an experimental setup with a concrete implementation of the architecture would have been very interesting. During the work, many recommen- dations were given but a practical example with real numbers could have helped to clarify them. With the amount of tools and services presented, an allocation of those to the architecture and a measure of some parameters given a certain workload could have let us understand the impact of workload relate decision regarding performance and costs.
6.3 OutlookThe limitations presented can be used as a base to give some baselines on
the continuity of this work. Filtering is a broad topic and its still today a challenge to design effective filtering layer. A deep knowledge on data types is required and extending this work in that topic may be useful to add more knowledge into the field.
Naturally, given to this work a practical context will make even more im- portant data properties understanding like privacy, security and governance. Just
45

thinking on workloads that analyzes critical personal identifiable information, or data pipelines that are shared among different users, expose the lack of deep- ness of this work in those areas and the need of extending it.
Lastly, we found several workload characterization works but all of them were performance centric approach. A more deep business analysis of the impli- cations of handle a data pipeline and the return of investment will help to measure the value that can be gain from it. Pay-as-you-go modality gives small- and medium-enterprises the option to be part of this industrial revolution with costs that they can afford.
46
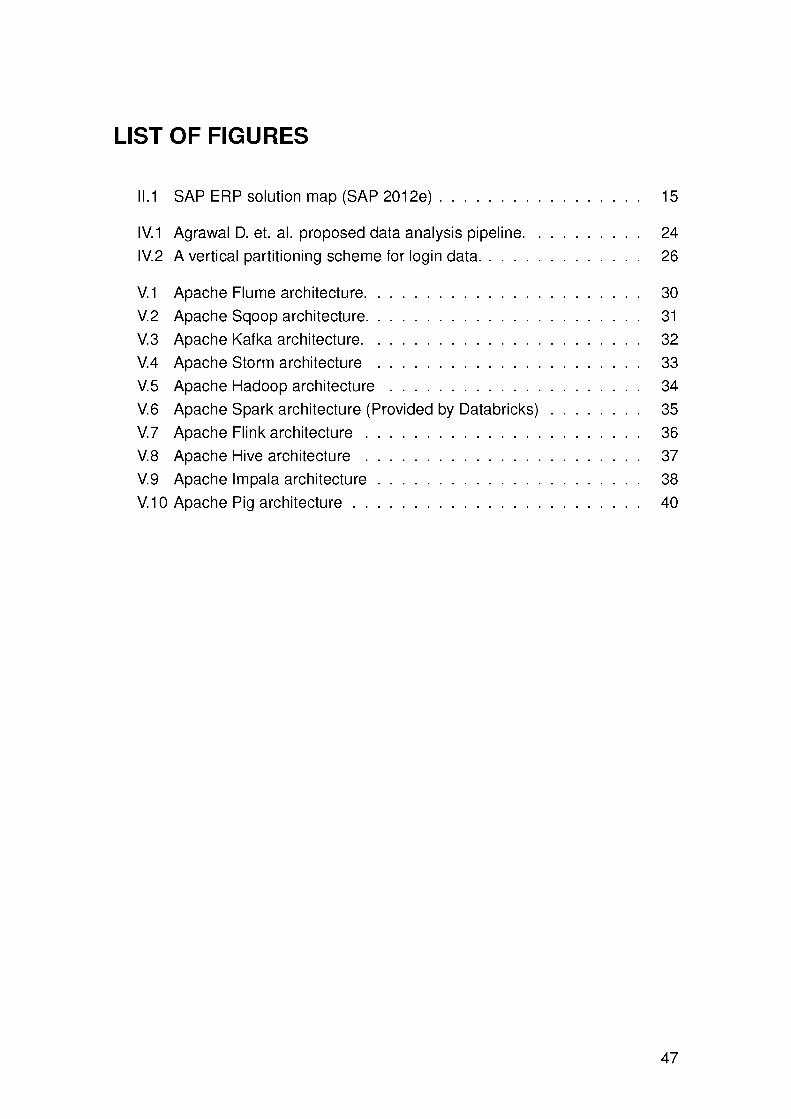
LIST OF FIGURES
II.1 SAP ERP solution map (SAP 2012e)............................................... ....15
IV.1 Agrawal D. et. al. proposed data analysis pipeline........................... ....24IV.2 A vertical partitioning scheme for login data..........................................26
V.1 Apache Flume architecture................................................................. ....30V.2 Apache Sqoop architecture.....................................................................31V.3 Apache Kafka architecture.................................................................. ....32V.4 Apache Storm architecture ..................................................................33V.5 Apache Hadoop a rch itectu re ........................................................... ....34V.6 Apache Spark architecture (Provided by Databricks).........................35V.7 Apache Flink architecture.....................................................................36V.8 Apache Hive arch itectu re .....................................................................37V.9 Apache Impala architecture..................................................................38V.10 Apache Pig architecture........................................................................40
47

LIST OF TABLES
I.1 Multidimensional data s e t ................................................................. 10
48

REFERENCESAgarwal, R. C., Aggarwal, C. C., & Prasad, V. V. V. (2001). Atree projection algo-
rithm for generation of frequent item sets. Journal of parallel and Distributed Computing, 61(3), 350-371.
Aggarwal, C. C. (2007). Data streams: models and algorithms (Vol. 31). Springer Science & Business Media.
Aggarwal, C. C. (2015). Data mining: The textbook. Springer.Aggarwal, C. C., Han, J., Wang, J., & Yu, P. S. (2003). A framework for clustering
evolving data streams. In Proceedings ofthe 29th International conference on very large data bases-volume 29 (p. 81-92).
Aggarwal, C. C., Wolf, J. L., Yu, P. S., Procopiuc, C., & Park, J. S. (1999). Fast algorithms for projected clustering. In Acm sigmod record (Vol. 28, p. 6172).
Agrawal, D., Bernstein, P, Bertino, E., Davidson, S., Dayal, U., Franklin, M., ... Han, J. (2011). Challenges and opportunities with big data.
Alrehamy, H., & Walker, C. (2015). Personal data lake with data gravity pull. In Big data and cloud computing (bdcloud), 2015 ieee fifth international conference on (p. 160-167).
Anderson, C. (2015). Creating a data-driven organization. O’Reilly Media, Inc.Ansoff, H. I. (1975). Managing strategic surprise by response to weak signals.
California management review, 18(2), 21-33.Apache. (2016). Apache hadoop. Retrieved from https://hadoop.apache.orgArvind, A. (2016). Architecture for industry 4.0-based manufacturing systems
(Unpublished doctoral dissertation). Carnegie Mellon University Pittsburgh, PA.
Assuncao, M. D., Calheiros, R. N., Bianchi, S., Netto, M. A., & Buyya, R. (2013). Big data computing and clouds: challenges, solutions, and future directions. arXiv preprint arXiv:1312.4722.
Assuncao, M. D., Calheiros, R. N., Bianchi, S., Netto, M. A., & Buyya, R. (2015). Big data computing and clouds: Trends and future directions. Journal of Parallel and Distributed Computing, 79, 3-15.
Atkeson, A., & Kehoe, P. J. (2001). The transition to a new economy after the second industrial revolution (Tech. Rep.). National Bureau of Economic Research.
Bahrami, M., & Singhal, M. (2015). The role of cloud computing architecture in big data. In Information granularity big data, and computational intelligence (p. 275-295). Springer.
49
Bauernhansl, I. T. (2014). Die vierte industrielle revolution-der weg in ein wertschaffendes produktionsparadigma. In Industrie 4.0 in produktion, au- tomatisierung und logistik (p. 5-35). Springer.
Begoli, E. (2012). A short survey on the state of the art in architectures and platforms for large scale data analysis and knowledge discovery from data. In Proceedings ofthe wicsa/ecsa 2012 companion volume (p. 177-183).
Berners-Lee, T. (1991,8).Bloem, J., van Doorn, M., Duivestein, S., Excoffier, D., Maas, R., & van Ommeren,
E. (2014). The fourth industrial revolution. Things to Tighten the.Bryson, S., Kenwright, D., Cox, M., Ellsworth, D., & Haimes, R. (1999). Visually
exploring gigabyte data sets in real time. Communications of the ACM, 42(8), 82-90.
Calzarossa, M., Haring, G., Kotsis, G., Merlo, A., & Tessera, D. (1995). A hi- erarchical approach to workload characterization for parallel systems. In International conference on high-performance computing and networking (p. 102-109).
Calzarossa, M., Massari, L., & Tessera, D. (2000). Workload characterization is- sues and methodologies. In Performance evaluation: Origins and directions (p. 459-482). Springer.
Chang, W. L. (15, 10). Nist big data interoperability framework: Volume 7, stan- dards roadmap (Tech. Rep.). National Institute of Standards and Technology. Retrieved from http://dx.doi.org/10.6028/NIST.SP .1500-7
Chen, Y., Alspaugh, S., & Katz, R. (2012). Interactive analytical processing in big data systems: A cross-industry study of mapreduce workloads. Proceedings of the VLDB Endowment, 5(12), 1802-1813.
Cherniack, M., Balakrishnan, H., Balazinska, M., Carney, D., Cetintemel, U., Xing, Y., & Zdonik, S. B. (2003). Scalable distributed stream processing. In Cidr (Vol. 3, p. 257-268).
Davenport, T. (2014). Big data at work: dispelling the myths, uncovering the opportunities. Harvard Business Review Press.
Davenport, T. H. (2013). Analytics 3.0. Harvard Business Review, 91(12), 64-+.Davenport, T. H., Barth, P, & Bean, R. (2012). How big data is different. MIT
Sloan Management Review, 54(1), 43.Denning, P. J. (1990). The science of computing: Saving all the bits. American
Scientist, 78(5), 402-405.Ding, S., Wu, F., Qian, J., Jia, H., & Jin, F. (2015). Research on data stream
clustering algorithms. Artificial Intelligence Review, 43(4), 593-600.Doherty, C., Orenstein, G., Camina, S., & White, K. (2015). Building real-time
data pipelines (First ed.). United States: O’Reilly.Dos Santos, J., & Singer, J. (2012). Looking for the right answers in the clouds.
50
Armed Forces Communications and Electronics Association, September.Enke, D., & Thawornwong, S. (2005, 11). The use of data mining and neural
networks for forecasting stock market returns. Expert Systems with Applications, 29(4), 927-940. doi: 10.1016/j.eswa.2005.06.024
European document retention guide. (2014).Ferdman, M., Adileh, A., Kocberber, O., Volos, S., Alisafaee, M., Jevdjic, D., ...
Falsafi, B. (2012). Clearing the clouds: a study of emerging scale-out workloads on modern hardware. In Acm sigplan notices (Vol. 47, p. 37-48).
Gandomi, A., & Haider, M. (2015, 4). Beyond the hype: Big data concepts, methods, and analytics. International Journal of Information Management, 35(2), 137-144. doi: 10.1016/j.ijinfomgt.2014.10.007
Gantz, J., & Reinsel, D. (2012). The digital universe in 2020: Big data, bigger digital shadows, and biggest growth in the far east. IDC iView: IDC Analyze the future, 2007, 1-16.
Gantz, J. F., & Reinsel, D. (2007). The expanding digital universe: A forecast of worldwide information growth through 2010..
Gao, W., Luo, C., Zhan, J., Ye, H., He, X., Wang, L. , ... Tian, X. (2015). Identifying dwarfs workloads in big data analytics. arXivpreprint arXiv:1505.06872.
Ghazal, A., Rabl, T., Hu, M., Raab, F., Poess, M., Crolotte, A., & Jacobsen, H.- A. . A. (2013). Bigbench: towards an industry standard benchmark for big data analytics. In Proceedings of the 2013 acm sigmod international conference on management ofdata (p. 1197-1208).
Gray, J., Chaudhuri, S., Bosworth, A., Layman, A., Reichart, D., Venkatrao, M.,... Pirahesh, H. (1997). Data cube: A relational aggregation operator gen- eralizing group-by, cross-tab, and sub-totals. Data mining and knowledge discovery, 1(1), 29-53.
Gregg, B. (2013). Systems performance: Enterprise and the cloud. Pearson Education.
Grover, M., Malaska, T., Seidman, J., & Shapira, G. (2015). Hadoop application architectures. O’Reilly Media, Inc.
Gunthner, I. W., & Klenk, E. (2014). Adaptive logistiksysteme als wegbereiter der industrie 4.0. In Industrie 4.0 in produktion, automatisierung und logistik (p. 297-323). Springer.
Han, J., Kamber, M., & Pei, J. (2011). Data mining: concepts and techniques. Elsevier.
Han, R., Jia, Z., Gao, W., Tian, X., & Wang, L. (2015). Benchmarking big data systems: State-of-the-art and future directions. arXiv preprint arXiv:1506.01494.
Hashem, I. A. T., Yaqoob, I., Anuar, N. B., Mokhtar, S., Gani, A., & Khan, S. U. (2015). The rise of big data on cloud computing: Review and open research
51
issues. Information Systems, 47 , 98-115.Hermann, M., Pentek, T., & Otto, B. (2016). Design principles for industrie 4.0
scenarios. In 2016 49th hawaii international conference on system sciences (hicss) (p. 3928-3937).
Holmes, A. (2012). Hadoop in practice (2nd ed.). Manning Publications Co.Hoste, K., & Eeckhout, L. (2007). Microarchitecture-independent workload char
acterization. IEEE Micro, 27 (3), 63-72.Inmon, W. H., & Linstedt, D. (2014). Data architecture: A primer for the data
scientist: Big data, data warehouse and data vault. Morgan Kaufmann.Jacobs, A. (2009). The pathologies of big data. Communications of the ACM,
52(8), 36-44.Ji, C., Li, Y., Qiu, W., Awada, U., & Li, K. (2012). Big data processing in cloud
computing environments. In 2012 12th international symposium on perva- sive systems, algorithms and networks (p. 17-23).
Jia, Z., Zhan, J., Wang, L., Han, R., McKee, S. A., Yang, Q., ... Li, J. (2014). Characterizing and subsetting big data workloads. In Workload characterization (iiswc), 2014 ieee international symposium on (p. 191-201).
Kambatla, K., Pathak, A., & Pucha, H. (2009). Towards optimizing hadoop provi- sioning in the cloud. HotCloud, 9, 12.
Katal, A., Wazid, M., & Goudar, R. H. (2013). Big data: issues, challenges, tools and good practices. In Contemporary computing (ic3), 2013 sixth international conference on (p. 404-409).
Kleppmann, M. (2015). Designing data-intensive applications. O?’Reilly Media, to appear in.
Kleppmann, M. (2016). Making sense of stream processing. United States: O’Really.
Kreps, J. (2014). I heart logs: Event data, stream processing, and data integra- tion. O’Reilly Media, Inc.
Kumar, V., Andrade, H., Gedik, B., & Wu, K.-L. . L. (2010, 1). Deduce: at the intersection of mapreduce and stream processing. ResearchGate, 657-662. doi: 10.1145/1739041.1739120
Kurbel, K., Nowak, D., Jatzold, F., & Glushko, P (2015). An in-memory approach to sentiment analysis based on sap hana. International Journal of Digital Information and Wireless Communications (IJDIWC), 5(1), 1-13.
Kurbel, K. E. (2013). Enterprise resource planning and supply chain manage- ment. Springer.
Laney, D. (2001). 3d data management: Controlling data volume, velocity and variety. META Group Research Note, 6, 70.
Lee, E. A. (2008). Cyber physical systems: Design challenges. In 2008 11th ieee international symposium on object and component-oriented real-time
52

distributed computing (isorc) (p. 363-369).Lee, J., Bagheri, B., & Kao, H.-A. . A. (2015). A cyber-physical systems architec
ture for industry 4.0-based manufacturing systems. Manufacturing Letters, 3 , 18-23.
Liu, F., Tong, J., Mao, J., Bohn, R., Messina, J., Badger, L., & Leaf, D. (2011). Nist cloud computing reference architecture. NIST special publication, 500(2011), 292.
Liu, Y. D., & Smith, S. (2008). Pedigree types. In International workshop on alias- ing, confinement and ownership in object-oriented programming (iwaco).
Logothetis, D., & Yocum, K. (2008). Ad-hoc data processing in the cloud. Pro- ceedings of the VLDB Endowment, 1(2), 1472-1475.
Lukoianova, T., & Rubin, V. L. (2014). Veracity roadmap: Is big data objective, truthful and credible? Advances in Classification Research Online, 24(1), 4-15.
Lynch, C. (2008, 9). Big data: How do your data grow? Nature, 455(7209), 28-29. doi: 10.1038/455028a
MacDougall, W. (2014). Industrie 4.0: Smart manufacturing for the future. Ger- many Trade & Invest.
Maier, M., Serebrenik, A., & Vanderfeesten, I. T. P (2013). Towards a big data reference architecture. EINDHOVEN UNIVERSITYMS thesis.
Marston, S., Li, Z., Bandyopadhyay, S., Zhang, J., & Ghalsasi, A. (2011). Cloud computingthe business perspective. Decision support systems, 51(1), 176189.
Marz, N., & Warren, J. (2015). Big data: Principles and bestpractices ofscalable realtime data systems. Manning Publications Co.
Mattern, M., & Croft, R. (2014). Business cases mitsap hana: AnwendungsfUlle und geschUftsmodelle fur big data (2014th ed.). Galileo Press GmbH.
McAfee, A., Brynjolfsson, E., Davenport, T. H., Patil, D. J., & Barton, D. (2012). Big data. The management revolution. Harvard Bus Rev, 90(10), 61-67.
Mell, P, & Grance, T. (2011). The nist definition of cloud computing.Nedyalkov, L. (2013). Designing a big data software-as-a-service platform
adapted for small and medium-sized enterprises (Unpublished doctoral dis- sertation). TU Delft, Delft University of Technology.
Ramaswamy, L., Lawson, V., & Gogineni, S. V. (2013). Towards a quality-centric big data architecture for federated sensor services. In 2013 ieee interna- tional congress on big data (p. 86-93).
Schwab, K. (2016). The fourth industrial revolution..Smirni, E., & Reed, D. A. (1997). Workload characterization of input/output in
tensive parallel applications. In International conference on modelling tech- niques and tools for computer performance evaluation (p. 169-180).
53
Smith, B. L. (2001). The third industrial revolution: policymaking for the internet. Colum. Sci. & Tech. L. Rev., 3 , 1.
Spath, D., Gerlach, S., Hammerle, M., Schlund, S., & Strolin, T. (2013). Cyber- physical system for self-organised and flexible labour utilisation. Personnel, 50, 22.
Thramboulidis, K. (2015). A cyber-physical system-based approach for industrial automation systems. Computers in Industry, 72, 92-102.
Wang, L., Torngren, M., & Onori, M. (2015). Current status and advancement of cyber-physical systems in manufacturing. Journal of Manufacturing Systems, 37(Part 2), 517-527.
Wang, L., Zhan, J., Jia, Z., & Han, R. (2015). Characterization and architectural implications of big data workloads. arXivpreprint arXiv:1506.07943.
White, T. (2012). Hadoop: The definitive guide. O’Reilly Media, Inc.Yin, S., & Kaynak, O. (2015). Big data for modern industry: Challenges and
trends [point of view]. Proceedings ofthe IEEE, 103(2), 143-146.Zaharia, M. (2016). An architecture for fast and general data processing on large
clusters (Tech. Rep.).
54