design optimization with non-linear processing
TRANSCRIPT
TRANSPORT PROBLEMS 2009
PROBLEMY TRANSPORTU Volume 4 Issue 2
Jakob WEIDEN
TECOSIM GmbH, Statics & Dynamics
Robert-Bosch-Str. 10, D-50765 Köln, Germany
Corresponding author. E-mail: [email protected]
DESIGN OPTIMIZATION WITH NON-LINEAR PROCESSING
Summary. The paper describes the methodology of a semi-automated optimization
process (FEM) on a deformation element on the basis of a low speed 14 km/h offset
insurance crash test (LSICT).
PROCES PROJEKTOWANIA Z WYKORZYSTANIEM OPTYMALIZACJI
NIELINIOWEJ
Streszczenie. Artykuł opisuje metodologię półautomatycznego procesu optymalizacji
(MES) elementu deformowanego na podstawie krasz testu (LSICT) z małą prędkością
(14 km/h).
1. INTRODUCTION
The automobile industry demands that the development process for cars need to be more and
more efficient. The main objective is to shorten development time and to minimize developing costs.
Due to the high complexity of the optimization operations analytical calculation methods seem to be a
good method for achieving these demands. Therefore the Finite Element Method (FEM) is used.
Today the development process primarily combines construction and FEM to find the optimal shape of
parts. This methodical approach decreases the number of real tests and saves a lot of time and money.
A discussion about accident statistics at lower speed was initiated by German insurance
companies because the costs for an insurance policy depend on the repair costs after an accident.
Therefore the automobile industry needs to keep these costs at a low level. In January 1999 the
German insurances asked the “Allianz Zentrum für Technik” to develop the Low Speed Offset
Insurance Crash Test (LSICT).
The definition of the LSICT says that a car with a dummy on board crashes with an offset of 40%
and a speed of 15 km/h (+1/-0 km/h) against a barrier. Damages are analyzed and repair costs are
calculated. A major focus lies on the cooling unit that has to stay intact. In October 2003 the additional
criteria to hit the barrier at 10° to the lateral axis was added.
This test can be simulated with CAE-methods to predict the deformation characteristic and the
energy absorption of the deformation element in the early stage of the development. Important is to
identify construction errors and to correct them by an FEM optimization. This paper shows the method
of a topography-optimization for finding a fast and reliable design.

16 J. Weiden
2. USED SOFTWARE
The software used for this analysis is developed by Altair (Hyperworks) and Abacom (Abaqus).
Hyperworks is a software bundle containing Hypermesh, Hyperstudy and Hyperview. Hypermesh is
generally used for the FE-mesh generation and the definition of design variables, Hyperstudy for the
optimization with the Response-Surface-Method and Hyperview to visualize and check the results.
The chosen Solver is Abaqus/explicit because it is able to simulate non-linear, dynamic events.
3. DEFINITION OF THE CONSTRAINTS
In order to keep the FEM model small enough for this analysis it is reduced to a minimum number
of elements.
Therefore the mass of the car is represented only by a single mass element. All the deformation
elements are modelled as shell and solid elements. A rigid surface represents the barrier. The whole
reduced car model has an initial velocity of 16 km/h along the x-axis.
Fig. 1. Definition of the constraints
Rys. 1. Definicja warunków brzegowych
4. STATUSMODEL (MANUALLY OPTIMIZED)
The model, which is chosen to prove the possibility of using a semi-automated optimization, is
taken from a previous manual optimization. The reliability criterion for this analysis is achieved when
the force on the deformation element achieves the pre-defined level. The target is to prove that it is
possible to reach nearly the same energy absorption in the semi-optimized deformation element as in
the manually optimized one.

Design optimization with non-linear processing 17
Fig. 2. Energy absorption status model
Rys. 2. Model z absorpcją energii
5. BEGINNING MODEL (W/O ANY DEPRESSIONS)
To proof that the semi-optimization achieves similar results as regular engineering does the origin
model needs to be completely flat.
At the beginning of the optimization the system reaction needs to be analyzed in a base run to identify
the loading level where the deformation process takes place. In this case the system needs to be
adjusted so that the deformation happens between 140 kN and 150 kN.
Fig. 3. Beginning model
Rys. 3. Model wyjściowy

18 J. Weiden
Fig. 4. Energy absorption beginning model
Rys. 4. Model wyjściowy z absorpcją energii
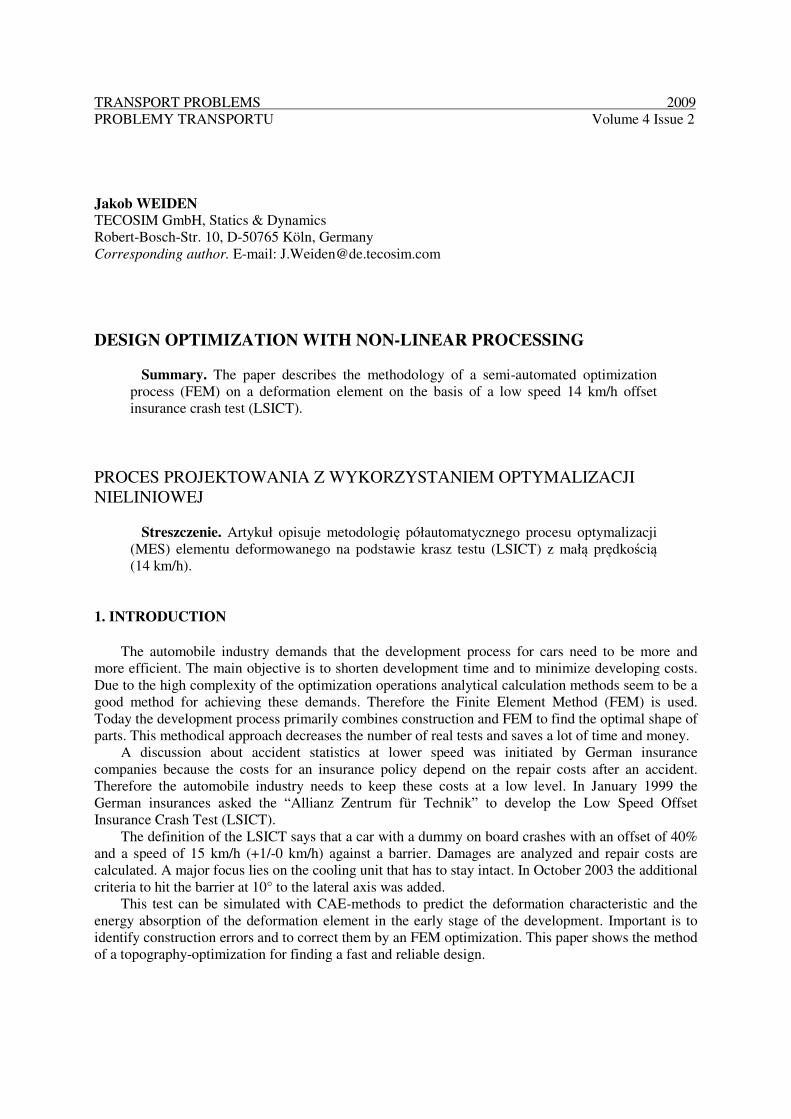
6. DEFINITION OF DESIGN VARIABLES
The design variables for this optimization are defined in vertical and horizontal direction. Only
the first four design variants are shown below. All further variants are analogue.
Fig. 5. Horizontal Shapes
Rys. 5. Parametry optymalizacji kształtów elementu w kierunku poziomym
Design optimization with non-linear processing 19
Fig. 6. Vertical Shapes
Rys. 6. Parametry optymalizacji kształtów elementu w kierunku pionowym
7. RESULTS OF OPTIMIZATION
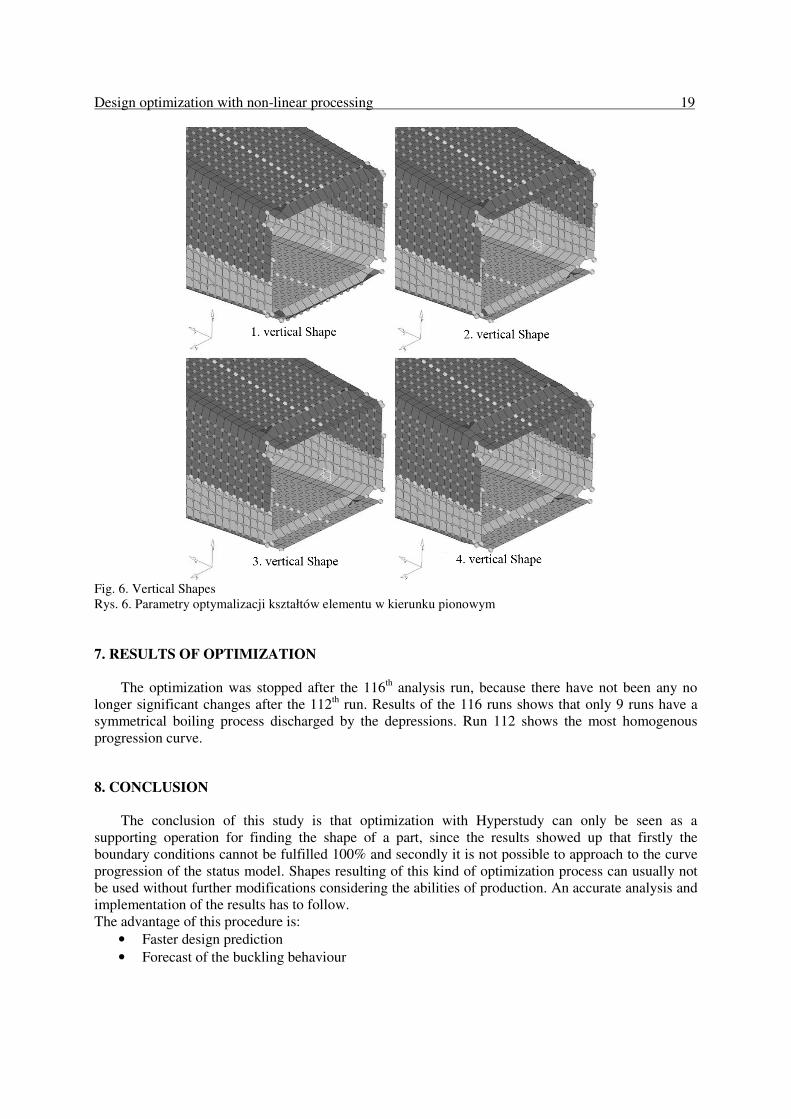
The optimization was stopped after the 116th analysis run, because there have not been any no
longer significant changes after the 112th run. Results of the 116 runs shows that only 9 runs have a
symmetrical boiling process discharged by the depressions. Run 112 shows the most homogenous
progression curve.
8. CONCLUSION
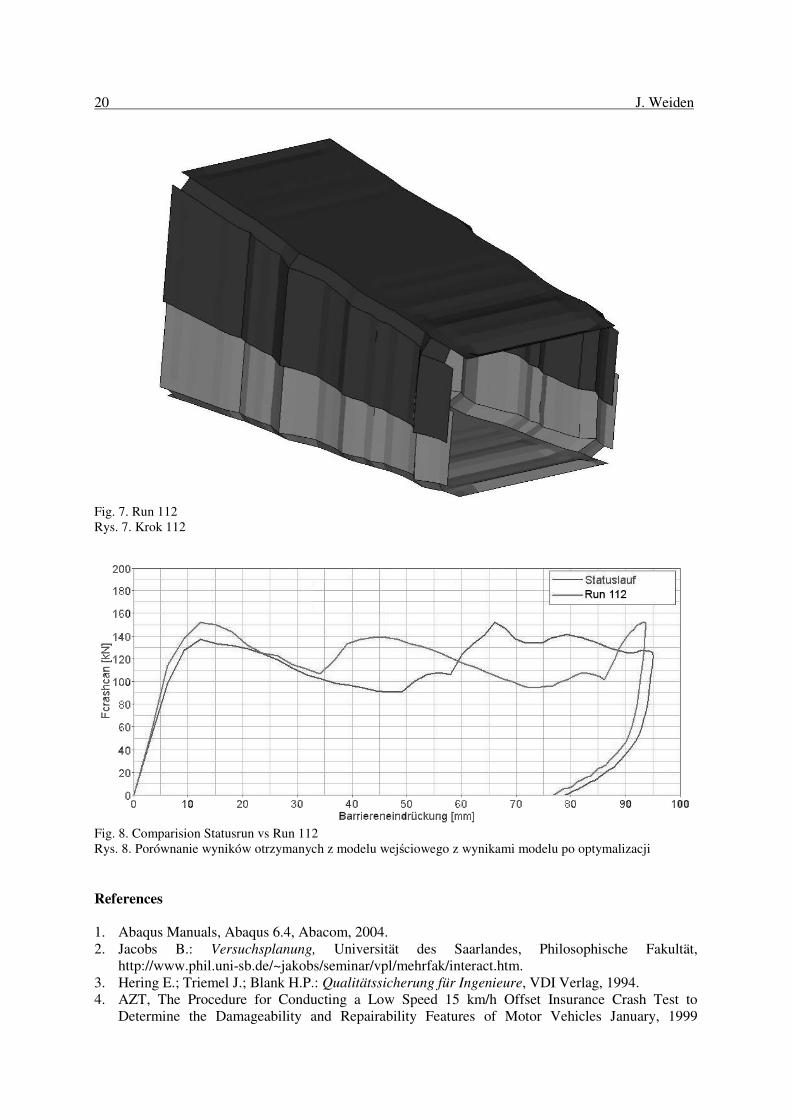
The conclusion of this study is that optimization with Hyperstudy can only be seen as a
supporting operation for finding the shape of a part, since the results showed up that firstly the
boundary conditions cannot be fulfilled 100% and secondly it is not possible to approach to the curve
progression of the status model. Shapes resulting of this kind of optimization process can usually not
be used without further modifications considering the abilities of production. An accurate analysis and
implementation of the results has to follow.
The advantage of this procedure is:
• Faster design prediction
• Forecast of the buckling behaviour
20 J. Weiden
Fig. 7. Run 112
Rys. 7. Krok 112
Fig. 8. Comparision Statusrun vs Run 112
Rys. 8. Porównanie wyników otrzymanych z modelu wejściowego z wynikami modelu po optymalizacji
References
1. Abaqus Manuals, Abaqus 6.4, Abacom, 2004.
2. Jacobs B.: Versuchsplanung, Universität des Saarlandes, Philosophische Fakultät,
http://www.phil.uni-sb.de/~jakobs/seminar/vpl/mehrfak/interact.htm.
3. Hering E.; Triemel J.; Blank H.P.: Qualitätssicherung für Ingenieure, VDI Verlag, 1994.
4. AZT, The Procedure for Conducting a Low Speed 15 km/h Offset Insurance Crash Test to
Determine the Damageability and Repairability Features of Motor Vehicles January, 1999

Design optimization with non-linear processing 21
http://azt.allianz.de/azt/Kraftfahrzeugtechnik/Content/Seiten/Forschung/Deformation/Crashtest/Se
iten/frontcrash.html.
5. AZT, Crashreparaturtest Front (Neuer RCAR Strukturtest – 10°), 01.02.2004.
http://azt.allianz.de/azt/Kraftfahrzeugtechnik/Content/Downloads/Files/frontcrash_neu.pdf.
6. Leibniz Rechenzentrum der Bayerischen Akademie der Wissenschaften, Beschreibung der FEM-
Software Nastran 05.07.2002, http://www.lrz-muenchen.de/services/software/fem/nastran.
7. Altair, Hyperstudy Training, 2004.
Received 18.12.2008; accepted in revised form 16.06.2009